Summary of Consolidated Financial Results for FY2013 · 2017-03-17 · (Reference) Equity in...
33
This document has been translated from the Japanese original for reference purposes only. In the event of any discrepancy between this translated document and the Japanese original, the original shall prevail. The Company assumes no responsibility for this translation or for direct, indirect or any other forms of damages arising from the translation. Summary of Consolidated Financial Results for FY2013 (January 1, 2013 - December 31, 2013) February 5, 2014 Company Name: Shimano Inc. Stock Exchange: Tokyo, First Section Code Number: 7309 URL: http://www.shimano.com President: Yozo Shimano Vice President, Accounting: Nobuhiro Inoue Telephone: +81-72-223-3254 Date of Shareholders' Meeting: March 27, 2014 Scheduled payment date for dividends: March 28, 2014 Date of filing of annual report to Ministry of Finance: March 28, 2014 Supplemental information: Yes Financial results briefing: Yes (Amounts are rounded down to the nearest million yen.) 1.Consolidated financial results for FY2013 (January 1, 2013 - December 31, 2013) (1) Consolidated income information (The percentages represent the rates of increase (decrease) compared to the corresponding prior period.) Net sales Operating income Ordinary income Net income Million yen % Million yen % Million yen % Million yen % FY2013 271,037 10.2 41,775 2.0 47,549 20.3 35,088 27.7 FY2012 245,843 10.9 40,961 29.0 39,539 24.7 27,487 38.4 (Note) Comprehensive income: FY2013: 62,073 million yen (38.6%) FY2012: 44,792 million yen (216.1%) Net income per share (Basic) Net income per share (Diluted) Return on shareholders’ equity Ordinary income to total assets Operating income to net sales Yen Yen % % % FY2013 378.50 - 14.5 16.5 15.4 FY2012 296.50 - 13.9 16.7 16.7 (Reference) Equity in earnings: FY2013: - million yen FY2012: - million yen (2) Consolidated balance sheet information Total assets Net assets Shareholders’ equity ratio Net assets per share Million yen Million yen % Yen FY2013 319,223 270,914 84.6 2,912.40 FY2012 257,707 216,364 83.7 2,326.13 (Reference) Shareholders’ equity FY2013: 269,995 million yen FY2012: 215,648 million yen (3) Consolidated cash flow information Cash flows from operating activities Cash flows from investing activities Cash flows from financing activities Cash and cash equivalents at end of year Million yen Million yen Million yen Million yen FY2013 49,021 (27,205) (7,194) 125,867 FY2012 38,187 (18,928) (11,083) 94,809 2. Dividend information Dividend per Share Total dividend (Annual) Dividend payout ratio (Consolidated) Dividend per shareholders’ equity (Consolidated) 1st Quarter 2nd Quarter 3rd Quarter Year-end Total Yen Yen Yen Yen Yen Million yen % % FY2012 - 37.50 - 37.50 75.00 6,953 25.3 3.5 FY2013 - 43.50 - 43.50 87.00 8,065 23.0 3.3 FY2014(Forecast) - 43.50 - 43.50 87.00 25.6 (Note) The year-end cash dividend for FY2013 included a special dividend of 37.25 yen. 3. Forecasted consolidated business performance for FY2014 (January 1, 2014 - December 31,2014) Net sales Operating income Ordinary income Net income Net income per share Million yen % Million yen % Million yen % Million yen % Yen First half of FY2014 138,200 3.8 22,100 4.1 22,100 (10.5) 15,400 (13.4) 166.12 FY2014 280,000 3.3 45,000 7.7 45,000 (5.4) 31,500 (10.2) 339.79 The percentages represent the rates of increase (decrease) compared to the corresponding prior period.
Transcript of Summary of Consolidated Financial Results for FY2013 · 2017-03-17 · (Reference) Equity in...

This document has been translated from the Japanese original for reference purposes only. In the event of any discrepancy between this translated document and the Japanese original, the original shall prevail. The Company assumes no responsibility for this translation or for direct, indirect or any other forms of damages arising from the translation.
Summary of Consolidated Financial Results for FY2013
(January 1, 2013 - December 31, 2013) February 5, 2014
Company Name: Shimano Inc. Stock Exchange: Tokyo, First Section Code Number: 7309 URL: http://www.shimano.com President: Yozo Shimano Vice President, Accounting: Nobuhiro Inoue Telephone: +81-72-223-3254 Date of Shareholders' Meeting: March 27, 2014 Scheduled payment date for dividends: March 28, 2014Date of filing of annual report to Ministry of Finance: March 28, 2014 Supplemental information: Yes Financial results briefing: Yes
(Amounts are rounded down to the nearest million yen.)
1.Consolidated financial results for FY2013 (January 1, 2013 - December 31, 2013) (1) Consolidated income information (The percentages represent the rates of increase (decrease) compared to the corresponding prior period.)
Net sales Operating income Ordinary income Net income Million yen % Million yen % Million yen % Million yen %
FY2013 271,037 10.2 41,775 2.0 47,549 20.3 35,088 27.7FY2012 245,843 10.9 40,961 29.0 39,539 24.7 27,487 38.4
(Note) Comprehensive income: FY2013: 62,073 million yen (38.6%) FY2012: 44,792 million yen (216.1%)
Net income per share (Basic)
Net income per share (Diluted)
Return on shareholders’ equity
Ordinary income to total assets
Operating income to net sales
Yen Yen % % % FY2013 378.50 - 14.5 16.5 15.4 FY2012 296.50 - 13.9 16.7 16.7
(Reference) Equity in earnings: FY2013: - million yen FY2012: - million yen (2) Consolidated balance sheet information
Total assets Net assets Shareholders’ equity ratio Net assets per share Million yen Million yen % Yen
FY2013 319,223 270,914 84.6 2,912.40 FY2012 257,707 216,364 83.7 2,326.13
(Reference) Shareholders’ equity FY2013: 269,995 million yen FY2012: 215,648 million yen (3) Consolidated cash flow information
Cash flows from operating
activities Cash flows from investing
activities Cash flows from financing
activities Cash and cash equivalents
at end of year Million yen Million yen Million yen Million yen
FY2013 49,021 (27,205) (7,194) 125,867 FY2012 38,187 (18,928) (11,083) 94,809
2. Dividend information
Dividend per Share Total dividend
(Annual) Dividend payout ratio
(Consolidated) Dividend per shareholders’
equity (Consolidated) 1st
Quarter 2nd
Quarter 3rd
Quarter Year-end Total
Yen Yen Yen Yen Yen Million yen % % FY2012 - 37.50 - 37.50 75.00 6,953 25.3 3.5 FY2013 - 43.50 - 43.50 87.00 8,065 23.0 3.3
FY2014(Forecast) - 43.50 - 43.50 87.00 25.6 (Note) The year-end cash dividend for FY2013 included a special dividend of 37.25 yen. 3. Forecasted consolidated business performance for FY2014 (January 1, 2014 - December 31,2014)
Net sales Operating income Ordinary income Net income Net income per share Million yen % Million yen % Million yen % Million yen % Yen
First half of FY2014 138,200 3.8 22,100 4.1 22,100 (10.5) 15,400 (13.4) 166.12FY2014 280,000 3.3 45,000 7.7 45,000 (5.4) 31,500 (10.2) 339.79
The percentages represent the rates of increase (decrease) compared to the corresponding prior period.
*Notes (1) Change in significant subsidiaries during the year (Changes in specified subsidiaries due to changes in scope of consolidation) : None (2) Changes in accounting policies, changes in accounting estimates, and retrospective restatement: ① Changes in accounting policies in accordance with revision of accounting standards: Yes ② Changes in accounting policies other than ① above: None ③ Changes in accounting estimates: Yes ④ Retrospective restatement: None (3) Number of shares of common stock issued ① Number of shares of common stock issued at year-end (including treasury stock): FY2013 : 92,720,000 FY2012 : 92,720,000 ② Number of shares of treasury stock at year-end: FY2013 : 14,538 FY2012 : 13,134 ③ Average number of shares during the year: FY2013 : 92,706,039 FY2012 : 92,707,257
Presentation concerning audit procedures This financial report is outside the scope of audit procedures pursuant to the Financial Instruments and Exchange Act and procedures for audit of financial statements pursuant to the Financial Instruments and Exchange Act were not completed as of the disclosure of this financial report. Explanation regarding the appropriate use of forecasts of business performance and other special items The forecasts of consolidated business performance and other forward-looking statements contained in this document are based on information currently available to the Company and certain assumptions that management believes reasonable and actual business performance may differ materially from those described in such statements due to various factors. For details of assumptions for the forecasts and other related items, please refer to Page 3 of the attached document. Shimano Inc. accepts no liability whatsoever for any direct or consequential loss arising from any use of this document.

○Table of contents of the attached document
1. Business Results .................................................................................................................................................. 2
(1) Analysis of Consolidated Business Results ................................................................................................. 2 (2) Analysis of Consolidated Financial Position ............................................................................................... 3 (3) Dividend Policy and Cash Dividends for FY2013 and FY2014 .................................................................. 4
2. Outline of the Group ......................................................................................................................................... 5
3. Business Policy ................................................................................................................................................... 6
4. Consolidated Financial Statements ..................................................................................................................... 7 (1) Consolidated Balance Sheets ..................................................................................................................... 7 (2) Consolidated Statements of Income and Comprehensive Income ............................................................. 9 (3) Consolidated Statements of Shareholder's Equity ...................................................................................... 11 (4) Consolidated Statements of Cash Flows ..................................................................................................... 13 (5) Notes relating to Consolidated Financial Statements ............................................................................. 15 (Note concerning Assumption of Going Concern) ............................................................................. 15 (Presentation of the Consolidated Financial Statements - Significant Matters) ................................. 15 (Changes in the “Preparation of the Consolidated Financial Statements - Significant Matters”) ....... 15 (Notes relating to Consolidated Balance Sheets) ................................................................................. 16 (Notes relating to Consolidated Statements of Income) ...................................................................... 16 (Notes relating to Consolidated Statements of Shareholders’ Equity) ................................................ 16
(Notes relating to Consolidated Statements of Cash Flows) ............................................................... 18 (Notes relating to Securities) ............................................................................................................... 18 (Notes relating to Deferred Tax Accounting) ...................................................................................... 19 (Segment Information) ........................................................................................................................ 20
(Per Share Data)................................................................................................................................... 22(Significant Subsequent Events) .......................................................................................................... 22
5. Non-consolidated Financial Statements .............................................................................................................. 23 (1) Non-consolidated Balance Sheets ............................................................................................................... 23 (2) Non-Consolidated Statements of Income ..................................................................................................... 25 (3) Non-consolidated Statements of Shareholders’ Equity ............................................................................... 26 (4) Notes relating to Non-consolidated Financial Statements ........................................................................... 28 (Note concerning Assumption of Going Concern) ....................................................................................... 28 (Changes in the Accounting Policies) .......................................................................................................... 28 (Notes relating to Non-consolidated Balance Sheets) .................................................................................. 28 (Notes relating to Non-consolidated Statements of Income) ...................................................................... 28 ( Notes relating to Deferred Tax Accounting) ............................................................................................. 29
6. Change in members of the board ........................................................................................................................ 30
Shimano Inc. (7309) Summary of Consolidated Financial Results for FY2013
1

1. Business Results (1) Analysis of Consolidated Business Results ① Review of Operations
During fiscal year 2013, while Southern European countries saw great reductions in their current account deficits, the economic downturn in the Eurozone finally halted against a backdrop of stabilizing financial markets. In the U.S., uncertainty about political issues and financial policies receded substantially mainly due to the U.S. Federal Reserve’s decision to scale back asset purchases in the third round of quantitative easing (QE3) in view of improved economic sentiment. As Abenomics steadily took effect, Japan’s real GDP growth rate remained positive for the fourth consecutive
quarter. In particular, public investment and personal consumption led expansion of the Japanese economy. In these circumstances, inspired by its mission—“To create new value and promote health and happiness
through the enjoyment of nature and the world around us”—Shimano Group concentrated on creating a stream of captivating products to enrich the experience of cyclists and anglers around the world. As a result, net sales increased 10.2% from the previous year to 271,037 million yen. Operating income
increased 2.0% to 41,775 million yen, ordinary income increased 20.3% to increased 47,549 million yen, and net income increased 27.7% to 35,088 million yen.
Reportable Segment Overview
Bicycle Components
In Europe, a major market for Shimano products, retail sales were hampered by unsettled weather in the first half and could not fully recover from the weak performance even though the weather was good in July and August. In North America too, many regions experienced poor weather at the beginning of 2013. Although the North American market shifted to a recovery track from May onward, the recovery lacked vigor. In Japan, retail sales were affected by the harsh winter weather and remained lackluster. Meanwhile, in emerging markets with growth potential, sales of sports bicycles continued to grow strongly, particularly in China. Distributor inventories of finished bicycles in Europe and North America were somewhat high but remained
in an appropriate range. On the other hand, demand for repair parts grew strongly in virtually every market, including the regions that experienced poor weather, reflecting enthusiasm for cycling worldwide. In these market conditions, shipments from Shimano proceeded virtually as scheduled. Sales of new products,
including DEORE and ALTUS mountain bike components and ULTEGRA and CLARIS road bike components, were buoyant. In addition, owing to the high popularity of Shimano products in Europe and North America and depreciation of the yen, segment sales fulfilled the forecast. As a result, sales from this segment increased 9.6% from the previous year to 217,263 million yen, and
operating income increased 1.3% to 39,505 million yen.
Fishing Tackle The Japanese market was affected by bad weather starting with cold spells and snowfall at the beginning of
the year, and Northern Japan experienced lengthy periods of wet weather from the summer to the autumn. However, signs of recovery became visible from late autumn when the market as a whole, centering on general consumers such as households with young children, gained momentum. In such market conditions, Shimano received many orders for NEW STELLA SW reels and other spinning reels for saltwater fishing and electric reels, and enjoyed brisk sales of lure fishing-related products throughout the year. Overseas, despite the adverse impact of unsettled weather in both Europe and North America, Shimano
recorded sales higher than the previous year because new products were highly regarded in the market. In Asia, while the slowing Chinese economy was a concern, sales to retailers in East Asian and Southeast Asian markets were buoyant. In Oceania, brisk sales to retailers continued despite concern about the impact of unsettled weather. As a result, sales from this segment increased 13.1% from the previous year to 53,398 million yen, and
operating income increased 5.7% to 2,404 million yen.
Others Sales from other segments decreased 10.3% from the previous year to 376 million yen and an operating loss
of 135 million yen was recorded, following an operating loss of 326 million yen the previous year.
Shimano Inc. (7309) Summary of Consolidated Financial Results for FY2013
2
② Forecast for Fiscal Year 2014 Although the European economies are becoming more stable, weak domestic demand and fiscal sustainability
remain issues. In the U.S., while robust expansion of personal consumption is in prospect against the backdrop of a recovery of the labor market, there is a possibility that interest rate increases in line with the tapering of quantitative easing may put a brake on the economy. Growth in China and other emerging economies is tending to slow, and likely to remain relatively sluggish. In Japan, despite concern that the consumption tax increase in April 2014 will have an immediate adverse
impact on consumption, the recovery of corporate earnings and the impact of pay rises, which are becoming evident in certain sectors, may maintain the momentum of the economy assisted by an expansion of exports due to depreciation of the yen. In these circumstances, the Shimano Group, while closely monitoring economic trends in Japan and overseas,
is endeavoring to further enhance management efficiency. We will take the lead in the creation of new cycling culture and new sport fishing culture. In view of the outlook described above, for the fiscal year ending December 2014, the Shimano Group
forecasts net sales of 280,000 million yen, an increase of 3.3%, operating income of 45,000 million yen, an increase of 7.7%, ordinary income of 45,000 million yen, a decrease of 5.4%, and net income of 31,500 million yen, a decrease of 10.2%.
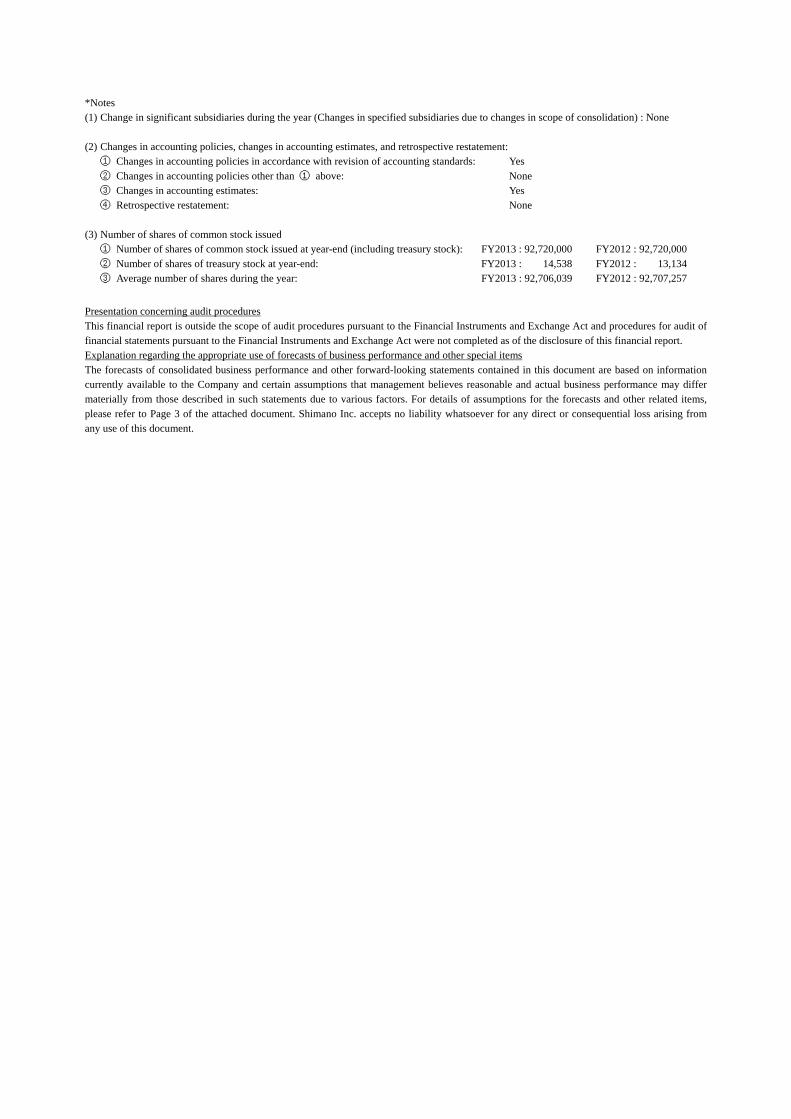
Sales forecasts by segment are indicated below. (Millions of yen)
First half Second half Full year Amount % Amount % Amount %
Bic
ycle
com
pone
nts
Japan 3,700 2.7 4,000 2.8 7,700 2.7
Overseas 106,300 76.9 110,600 78.0 216,900 77.5
Sub-total 110,000 79.6 114,600 80.8 224,600 80.2
Fishing tackle 28,000 20.3 27,000 19.1 55,000 19.7
Others 200 0.1 200 0.1 400 0.1
Total 138,200 100.0 141,800 100.0 280,000 100.0
(2) Analysis of Consolidated Financial Position ① Assets, Liabilities and Net Assets
(Total assets) Total assets as of the end of fiscal year 2013 amounted to 319,223 million yen (an increase of 61,516 million
yen compared with the figure as of the previous fiscal year-end). This increase was primarily due to an increase of 33,845 million yen in cash and time deposits, an increase of 5,488 million yen in buildings and structures, an increase of 5,482 million yen in construction in progress, and an increase of 3,791 million yen in investment securities. (Total Liabilities)
Total liabilities as of the end of fiscal year 2013 amounted to 48,308 million yen (an increase of 6,966 million yen compared with the figure as of the previous fiscal year-end). This increase was primarily due to an increase of 2,089 million yen in long-term loans payable, an increase of 1,774 million yen in accounts payable-trade, and an increase of 2,967 million yen in others. (Net assets)
Net assets as of the end of fiscal year 2013 amounted to 270,914 million yen (an increase of 54,550 million yen compared with the figure as of the previous fiscal year-end). This increase was primarily due to an increase of 27,579 million yen in retained earnings and an increase of 24,611 million yen in foreign currency translation adjustments.
Shimano Inc. (7309) Summary of Consolidated Financial Results for FY2013
3
② Cash Flows Net cash provided by operating activities amount to 49,021 million yen compared with 38,187 million yen for
the previous year. The main items were income before income taxes and minority interests of 45,222 million yen, depreciation and amortization amounting to 12,203 million yen, and income taxes paid amounting to 13,210 million yen.
Net cash used in investing activities amounted to 27,205 million yen compared with 18,928 million yen for the previous year. The main items included acquisition of property, plant and equipment amounting to 21,490 million yen.
Net cash used in financing activities amounted to 7,194 million yen compared with 11,083 million yen for the previous year. The main items were cash dividends to shareholders amounting to 7,511 million yen.
As a result, cash and cash equivalents at the end of the year were 125,867 million yen.
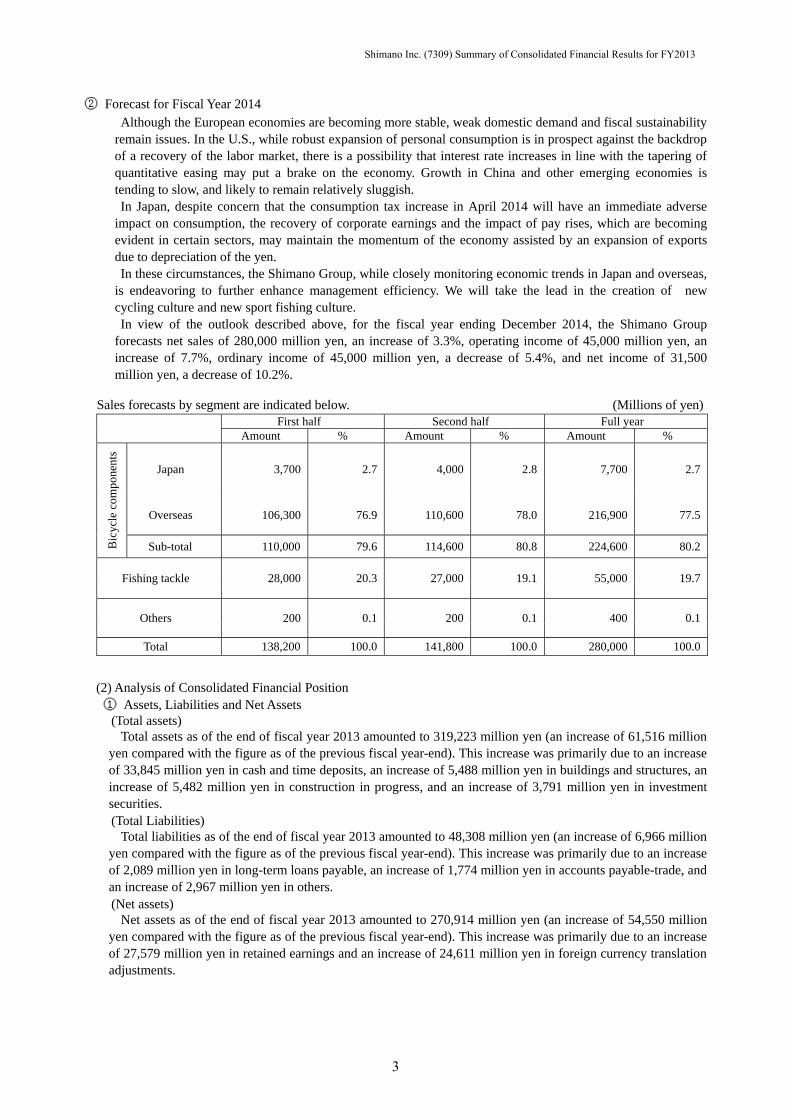
Cash flow indicators are shown in the following table.
FY2009 FY2010 FY2011 FY2012 FY2013 Equity ratio (%) 87.0 84.3 83.9 83.7 84.6Market value equity ratio (%) 185.0 188.7 162.4 198.6 262.2Interest-bearing debt to cash flow ratio (%) 0.06 0.06 0.30 0.20 0.21Interest coverage ratio (times) 81.9 93.6 87.1 115.4 150.8(Notes) 1. Each indicator is calculated using the consolidated results based on the formula indicated below:
Equity ratio: Shareholders' equity / Total assets Market value equity ratio: Total market capitalization / Total assets Interest-bearing debt to cash flow ratio: Interest-bearing debt / Operating cash flow Interest coverage ratio: Operating cash flow / Interest paid
2. Total market capitalization is calculated by: Closing stock price on the last day of the fiscal year x The number of shares of common stock issued and outstanding at the end of the fiscal year, less treasury stock.
3. Interest-bearing debt covers all debt in the consolidated balance sheet for which interest is paid. 4. Cash flows from operating activities and the amount of interest payments stated in the consolidated statements of cash flows
are used as operating cash flow and interest paid.
(3) Dividend Policy and Cash Dividends for FY 2013 and FY 2014 The Company considers the return of earnings to shareholders to be one of the most important issues for management. The Company's basic policy is to continue providing stable returns reflecting overall business performance and strategy. In accordance with the above policy, The Company intends to pay out year-end cash dividends of 43.50 yen per share, which include a special dividend of 37.25 yen, an increase of 6 yen from the amount paid for the previous year. As a result, cash dividends for the full year of fiscal year 2013 will amount to 87 yen per share, an increase of 12 yen from the amount paid for the previous year. The Company intends to pay out cash dividends of 87 yen per share for fiscal year 2014 (43.50 yen for both interim and year-end cash dividends).
Shimano Inc. (7309) Summary of Consolidated Financial Results for FY2013
4

2. Outline of the Group
Holding companies
Innovative Textiles, Inc. *1
*1: Consolidated subsidiaries
*2: A newly consolidated subsidiary in fiscal year 2013. (Refer to Page 15.)
*3: The company name was changed in fiscal year 2013. (Refer to Page 15.)
The Shimano Group consists of Shimano Inc. and 45 consolidated subsidiaries and affiliates. The Group ismainly engaged in manufacturing and sales of bicycle components and fishing tackle. Business relationships among the Shimano Group companies are indicated below.
Customers
Subsidiaries
Shimano American Corporation *1
Subsidiaries Subsidiaries AffiliateDashAmerica, Inc.(Pearl Izumi USA) *1
Shimano Inc.
Shimano Italy Fishing S.r.l. *1
Shimano (Kunshan) BicycleComponents Co., Ltd.*1
Shimano Italia S.p.A. in liquidazione *1 Sanbo Co., Ltd. Shimano Canada Ltd. *1
Shimano (Tianjin) Bicycle ComponentsCo., Ltd.*1 Shimano Czech Republic, s.r.o.*1 Shimano Europe Bike Holding B.V. *1
Shimano Europe Fishing Holding B.V. *1
Shimano Benelux B.V. *1
Shimano Europe B.V. *1
Bikefitting.com B.V. *1
Shimano France Composants CyclesS.A.S. *1
Shimano Europe Retail Division B.V *1*3
Bicycle components
Shimano Nordic Denmark ApS *1*2
Shimano (Philippines) Inc. *1*2
Shimano Polska Bicycle Parts sp. z o.o.*1
FBM Co., Ltd.
Fishing tackle Others
Shimano Belgium N.V. *1
Shimano Germany Fishing GmbH *1
Subsidiaries Subsidiaries
Shimano (Singapore) Pte. Ltd.*1 Shimano Kumamoto Co., Ltd. *1
Shimano Nordic Cycle OY *1
Shimano Components (Malaysia) Sdn.Bhd.*1
Shimano (Kunshan) Fishing Tackle Co.,Ltd. *1
Shimano Nordic Cycle AS *1
Shimano (Mersing) Sdn. Bhd.*1 Shimano Nordic Cycle AB *1
Shimano - Pearl Izumi Softgoods DivisionEurope GmbH *1*3
Subsidiaries
Subsidiaries
Shimano Australia Cycling Pty. Ltd. *1
Shimano (Malaysia) Sdn. Bhd.*1
Shimano Oceania Ltd. *1
Shimano Latin America RepresentacaoComercial Ltda. *1
Shimano Taiwan Co., Ltd. *1
P.T. Shimano Batam *1
Shimano Australia Fishing Pty. Ltd.*1
MSC Pte. Ltd. *1
Shimano Sales Co., Ltd.*1
Shimano (Shanghai) Sales Corporation *1
Shimano Europe Holding B.V. *1
Shimano Oceania Holdings Pty. Ltd. *1
Shimano (Lianyungang) Industrial Co.,Ltd.*1
Subsidiaries
G.Loomis, Inc. *1
Shimano (Cambodia) Co.,Ltd. *1
Subsidiaries
Shimano Inc. (7309) Summary of Consolidated Financial Results for FY2013
5

3. Business Policy
Since no significant changes have been made to the information for management policies in the Summary of Consolidated Financial Results for FY2011 disclosed on February 8, 2012, disclosure of the management policies has been omitted.
The Summary of Consolidated Financial Results for FY2011 is available at the following URL.
・Shimano Website http://www.shimano.com
・Tokyo Stock Exchange Website (Listed Company Information Search)
http://www.tse.or.jp/listing/compsearch/index.html
Shimano Inc. (7309) Summary of Consolidated Financial Results for FY2013
6

4. Consolidated Financial Statements
(1) Consolidated Balance Sheets (Millions of yen)
FY2012 As of Dec. 31, 2012
FY2013 As of Dec. 31, 2013
Assets
Current assets
Cash and time deposits 94,950 128,796 Notes and accounts receivable-trade *2 27,845 *2 30,899 Merchandise and finished goods 25,613 28,293 Work in process 17,209 17,145 Raw materials and supplies 5,091 4,718 Deferred income taxes 2,232 2,718 Others 3,090 3,464 Allowance for doubtful accounts (236) (296) Total current assets 175,798 215,740 Fixed assets
Property, plant and equipment
Buildings and structures 48,757 56,985 Accumulated depreciation (24,102) (26,828) Accumulated impairment loss (155) (168) Buildings and structures (net) 24,499 29,988 Machinery and vehicles 52,061 60,006 Accumulated depreciation (37,394) (43,000) Accumulated impairment loss (173) (161) Machinery and vehicles (net) 14,493 16,844 Land 11,256 11,814 Leased assets 489 85 Accumulated depreciation (57) (55) Leased assets (net) 431 30 Construction in progress 5,800 11,283 Others 40,226 43,948 Accumulated depreciation (35,612) (39,095) Accumulated impairment loss (19) (16) Others (net) 4,594 4,836 Total property, plant and equipment 61,076 74,798 Intangible assets
Goodwill 3,727 3,997 Software 1,916 2,834 Others 3,446 5,604 Total intangible assets 9,090 12,437 Investments and other assets
Investment securities *1 8,569 *1 12,361 Deferred income taxes 1,058 1,280 Others 2,602 3,071 Allowance for doubtful accounts (488) (465) Total investments and other assets 11,742 16,247 Total fixed assets 81,908 103,482 Total assets 257,707 319,223
Shimano Inc. (7309) Summary of Consolidated Financial Results for FY2013
7

(Millions of yen)
FY2012 As of Dec. 31 ,2012
FY2013 As of Dec. 31, 2013
Liabilities Current liabilities Accounts payable-trade 10,161 11,935 Short-term loans payable 5,915 6,130 Income taxes payable 6,582 5,593 Deferred income taxes 222 315 Accrued employee bonuses 1,268 1,524 Accrued officer bonuses 193 184 Provision for loss on factory reconstruction - 596 Others 11,321 14,278 Total current liabilities 35,665 40,559 Long-term liabilities Long-term loans payable 1,070 3,159 Deferred income taxes 742 1,051 Employee retirement benefits 2,681 2,710 Others 1,182 827 Total long-term liabilities 5,677 7,749 Total liabilities 41,342 48,308
Net assets Shareholders' equity Common stock 35,613 35,613 Capital surplus 5,822 5,822 Retained earnings 176,808 204,388 Treasury stock (47) (58) Total shareholders' equity 218,197 245,765 Accumulated other comprehensive income Unrealized gain (loss) on other securities 913 3,080 Foreign currency translation adjustments (3,462) 21,149 Total accumulated other comprehensive income (2,548) 24,229 Minority interests 716 919 Total net assets 216,364 270,914 Total liabilities and net assets 257,707 319,223
Shimano Inc. (7309) Summary of Consolidated Financial Results for FY2013
8

(2) Consolidated Statements of Income and Comprehensive Income Consolidated Statements of Income
(Millions of yen)
FY2012
Jan. 1, 2012 to Dec. 31, 2012
FY2013 Jan. 1, 2013 to Dec. 31, 2013
Net sales 245,843 271,037 Cost of sales *2 156,711 *2 174,613 Gross profit 89,132 96,423 Selling, general and administrative expenses *1,*2 48,171 *1,*2 54,648 Operating income 40,961 41,775 Non-operating income Interest income 743 873 Dividend income 318 205 Foreign exchange gains - 5,004 Others 583 637 Total non-operating income 1,645 6,721 Non-operating expenses Interest expenses 334 333 Loss on disposal of fixed assets 135 152 Foreign exchange losses 2,291 - Others 306 461 Total non-operating expenses 3,066 947 Ordinary income 39,539 47,549 Extraordinary losses Provision for loss on factory reconstruction - 596 Loss on factory reconstruction 1,061 1,730 Total extraordinary losses 1,061 2,326 Income before income taxes and minority interests 38,477 45,222 Income taxes-current 11,471 11,722 Income taxes-deferred (542) (1,626) Total income taxes 10,929 10,095 Income before minority interests 27,548 35,126 Minority interests in net income 60 38 Net income 27,487 35,088
Shimano Inc. (7309) Summary of Consolidated Financial Results for FY2013
9

Consolidated Statements of Comprehensive Income (Millions of yen)
FY2012
Jan. 1, 2012 to Dec. 31, 2012
FY2013 Jan. 1, 2013 to Dec. 31, 2013
Income before minority interests 27,548 35,126 Other comprehensive income
Unrealized gain (loss) on other securities 865 2,167 Foreign currency translation adjustments 16,377 24,778 Total other comprehensive income 17,243 26,946 Comprehensive income 44,792 62,073 (Breakdown)
Comprehensive income attributable to owners of the parent 44,658 61,866 Comprehensive income attributable to minority interests 133 206
Shimano Inc. (7309) Summary of Consolidated Financial Results for FY2013
10

(3) Consolidated Statements of Shareholders’ Equity
FY2012 (From January 1, 2012 to December 31, 2012) (Millions of yen)
Shareholders’ equity
Common stock Capital surplus Retained earnings Treasury stock Total shareholders’
equity
Balance at beginning of year 35,613 5,822 159,597 (124) 200,908
Changes of items during the year
Cash dividends paid (6,336) (6,336)
Net income 27,487 27,487
Acquisition of treasury stock (3,863) (3,863)
Sales of treasury stock 0 0 0
Retirement of treasury stock (0) (3,939) 3,939 -
Net changes of items other than shareholders' equity
Total changes of items during the year (0) 17,211 76 17,288
Balance at end of year 35,613 5,822 176,808 (47) 218,197
(Millions of yen)
Accumulated other comprehensive income
Minority interests Total net assets Unrealized gain (loss) on other securities
Foreign currency translation
adjustments
Total accumulated other comprehensive
income
Balance at beginning of year 47 (19,767) (19,719) 584 181,774
Changes of items during the year
Cash dividends paid (6,336)
Net income 27,487
Acquisition of treasury stock (3,863)
Sales of treasury stock 0
Retirement of treasury stock -
Net changes of items other than shareholders' equity 865 16,305 17,170 131 17,301
Total changes of items during the year 865 16,305 17,170 131 34,590
Balance at end of year 913 (3,462) (2,548) 716 216,364
Shimano Inc. (7309) Summary of Consolidated Financial Results for FY2013
11

FY2013 (From January 1,2013 to December 31, 2013) (Millions of yen)
Shareholders’ equity
Common stock Capital surplus Retained earnings Treasury stock Total shareholders’
equity
Balance at beginning of year 35,613 5,822 176,808 (47) 218,197
Changes of items during the year
Cash dividends paid (7,509) (7,509)
Net income 35,088 35,088
Acquisition of treasury stock (11) (11)
Net changes of items other than shareholders' equity
Total changes of items during the year 27,579 (11) 27,568
Balance at end of year 35,613 5,822 204,388 (58) 245,765
(Millions of yen)
Accumulated other comprehensive income
Minority interests Total net assets Unrealized gain (loss) on other securities
Foreign currency translation
adjustments
Total accumulated other comprehensive
income
Balance at beginning of year 913 (3,462) (2,548) 716 216,364
Changes of items during the year
Cash dividends paid (7,509)
Net income 35,088
Acquisition of treasury stock (11)
Net changes of items other than shareholders' equity 2,167 24,611 26,778 203 26,981
Total changes of items during the year 2,167 24,611 26,778 203 54,550
Balance at end of year 3,080 21,149 24,229 919 270,914
Shimano Inc. (7309) Summary of Consolidated Financial Results for FY2013
12
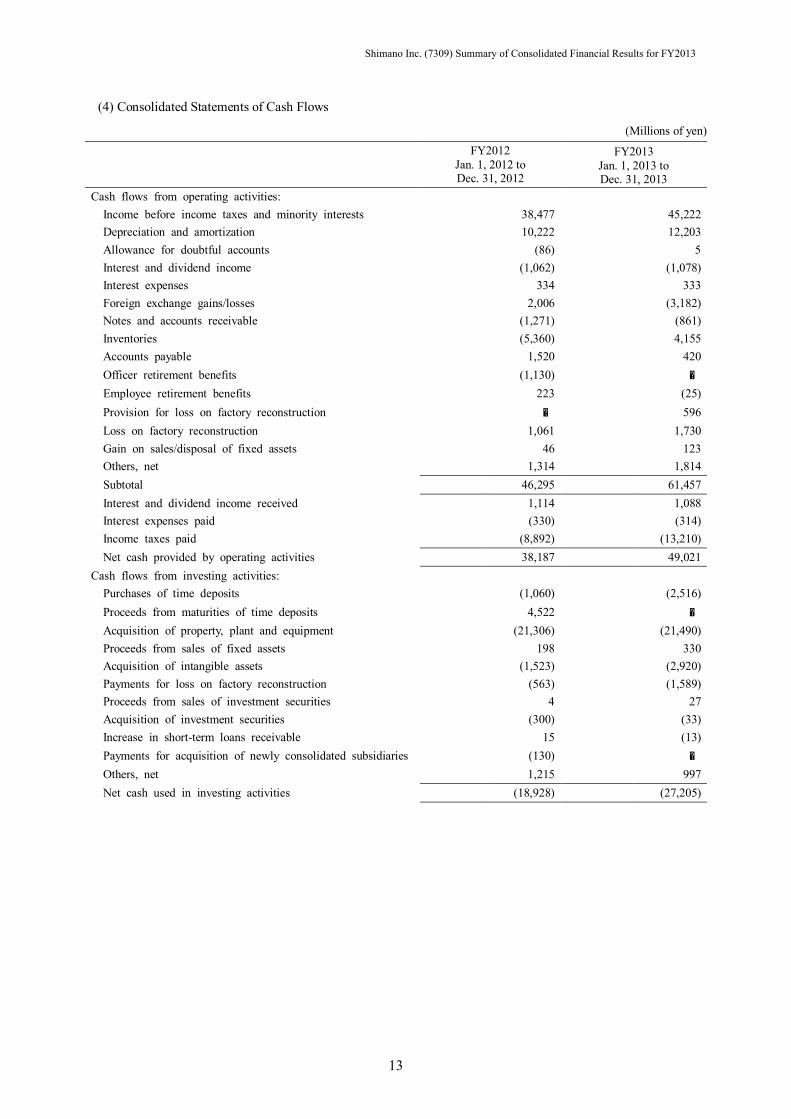
(4) Consolidated Statements of Cash Flows
(Millions of yen)
FY2012
Jan. 1, 2012 to Dec. 31, 2012
FY2013 Jan. 1, 2013 to Dec. 31, 2013
Cash flows from operating activities: Income before income taxes and minority interests 38,477 45,222 Depreciation and amortization 10,222 12,203 Allowance for doubtful accounts (86) 5 Interest and dividend income (1,062) (1,078) Interest expenses 334 333 Foreign exchange gains/losses 2,006 (3,182) Notes and accounts receivable (1,271) (861) Inventories (5,360) 4,155 Accounts payable 1,520 420 Officer retirement benefits (1,130) - Employee retirement benefits 223 (25) Provision for loss on factory reconstruction - 596 Loss on factory reconstruction 1,061 1,730 Gain on sales/disposal of fixed assets 46 123 Others, net 1,314 1,814 Subtotal 46,295 61,457 Interest and dividend income received 1,114 1,088 Interest expenses paid (330) (314) Income taxes paid (8,892) (13,210) Net cash provided by operating activities 38,187 49,021 Cash flows from investing activities: Purchases of time deposits (1,060) (2,516) Proceeds from maturities of time deposits 4,522 - Acquisition of property, plant and equipment (21,306) (21,490) Proceeds from sales of fixed assets 198 330 Acquisition of intangible assets (1,523) (2,920) Payments for loss on factory reconstruction (563) (1,589) Proceeds from sales of investment securities 4 27 Acquisition of investment securities (300) (33) Increase in short-term loans receivable 15 (13) Payments for acquisition of newly consolidated subsidiaries (130) - Others, net 1,215 997 Net cash used in investing activities (18,928) (27,205)
Shimano Inc. (7309) Summary of Consolidated Financial Results for FY2013
13

(Millions of yen)
FY2012
Jan. 1, 2012 to Dec. 31, 2012
FY2013 Jan. 1, 2013 to Dec. 31, 2013
Cash flows from financing activities: Increase in short-term loans payable 769 280 Proceeds from long-term loans payable - 3,225 Repayment of long-term loans payable (1,595) (2,764) Repayments of finance lease obligations (54) (410) Acquisition of treasury stock (3,863) (11) Gain on sales of treasury stock 0 - Cash dividends to shareholders (6,336) (7,511) Cash dividends to minority shareholders (3) (3) Net cash used in financing activities (11,083) (7,194) Effect of exchange rate changes on cash and cash equivalents 8,084 16,437 Net increase (decrease) in cash and cash equivalents 16,259 31,058 Cash and cash equivalents at beginning of year 78,549 94,809 Cash and cash equivalents at end of year * 94,809 * 125,867
Shimano Inc. (7309) Summary of Consolidated Financial Results for FY2013
14

(5) Notes relating to Consolidated Financial Statements
(Note concerning Assumption of Going Concern)
Not applicable.
(Preparation of the Consolidated Financial Statements - Significant Matters) 1. Consolidation
The consolidated financial statements include the accounts of the Company and the 45 subsidiaries whose names are stated in "2. Outline of the Group" on Page 5 of the Attachment. Shimano Nordic Denmark ApS and Shimano (Philippines) Inc. were included in the scope of consolidation during fiscal year 2013 due to establishment. The company name of Bikefitting.com Holding B.V. was changed to Shimano Europe Retail Division B.V., Pearl Izumi GmbH was changed to Shimano - Pearl Izumi Softgoods Division Europe GmbH during fiscal year 2013.
3. Fiscal year of the consolidated subsidiaries The fiscal year of Shimano Italia S.p.A. in liquidazione ends on November 30 and its financial statements at November 30 are used for preparation of the consolidated financial statements. Any material effects occurring during the period from December 1 to December 31 are adjusted in the consolidated financial statements.
4. Summary of significant accounting policies (1) Valuation basis and method for principal assets
Securities Other securities (syn. Available-for-sale securities)
Other securities with no market prices Other securities with no market prices are stated at moving average cost.
(3) Provision for principal allowances and reserves Provision for loss on factory reconstruction
Provision is made based on the estimated amount of future expenses anticipated for the reconstruction of Sakai factory. Since no significant changes have been made to the information in the recent securities report (submitted on March 29,
2013) for items other than the above 1, 3 and 4, disclosure of other items has been omitted.
(Changes in the "Preparation of the Consolidated Financial Statements - Significant Matters")
(Change in accounting policy for situation when a change in accounting estimate is difficult to distinguish) Effective from the first quarter of FY2013, the Company and its domestic consolidated subsidiaries have changed the depreciation method for property, plant and equipment acquired on or after January 1, 2013, in accordance with the revision of the Corporation Tax Act. The impact of this change is immaterial.
(Changes in presentation)
(Consolidated Statements of Cash Flows) “Loss on factory construction”, which was included in “Gain on sales/disposal of fixed assets” and “Others” under “Cash flow from operating activities”, was separately presented for fiscal year 2013 due to increased materiality. The Consolidated Statements of Cash Flows for the previous fiscal year was reclassified due to change in presentation. As a result, 447million yen included in “Gain on sales/disposal of fixed assets” and 613 million yen included in “Others” under “Cash flow from operating activities” were reclassified into “Loss on factory reconstruction” of 1,061 million yen. “Payments for loss on factory construction”, which was included in “Others” under “Cash flow from operating activities”, was separately presented for fiscal year 2013 due to increased materiality. The Consolidated Statements of Cash Flows for the previous fiscal year was reclassified due to change in presentation. As a result, (563) million yen included in “Others” under “Cash flow from operating activities” was reclassified into “Payments for loss on factory reconstruction” of (563) million yen.
Shimano Inc. (7309) Summary of Consolidated Financial Results for FY2013
15
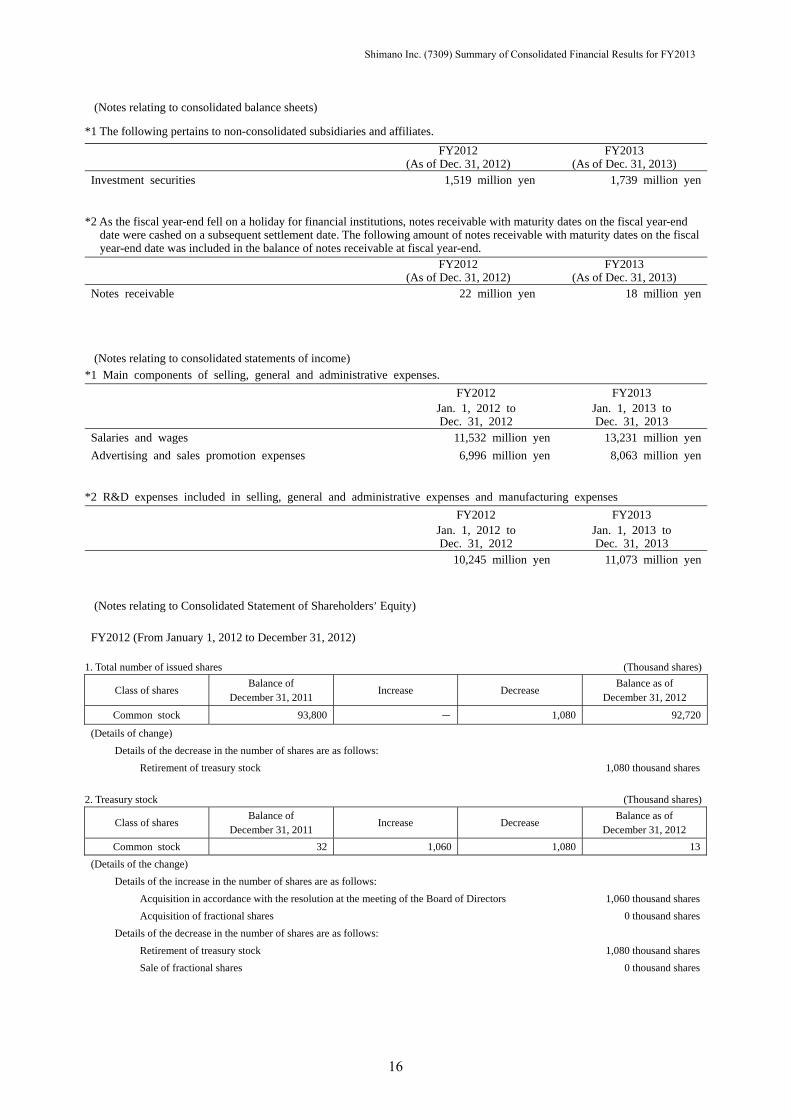
(Notes relating to consolidated balance sheets)
*1 The following pertains to non-consolidated subsidiaries and affiliates.
FY2012(As of Dec. 31, 2012)
FY2013 (As of Dec. 31, 2013)
Investment securities 1,519 million yen 1,739 million yen
*2 As the fiscal year-end fell on a holiday for financial institutions, notes receivable with maturity dates on the fiscal year-end
date were cashed on a subsequent settlement date. The following amount of notes receivable with maturity dates on the fiscal year-end date was included in the balance of notes receivable at fiscal year-end.
FY2012(As of Dec. 31, 2012)
FY2013 (As of Dec. 31, 2013)
Notes receivable 22 million yen 18 million yen
(Notes relating to consolidated statements of income) *1 Main components of selling, general and administrative expenses.
FY2012
Jan. 1, 2012 to Dec. 31, 2012
FY2013 Jan. 1, 2013 to Dec. 31, 2013
Salaries and wages 11,532 million yen 13,231 million yenAdvertising and sales promotion expenses 6,996 million yen 8,063 million yen
*2 R&D expenses included in selling, general and administrative expenses and manufacturing expenses
FY2012
Jan. 1, 2012 to Dec. 31, 2012
FY2013 Jan. 1, 2013 to Dec. 31, 2013
10,245 million yen 11,073 million yen (Notes relating to Consolidated Statement of Shareholders’ Equity)
FY2012 (From January 1, 2012 to December 31, 2012)
1. Total number of issued shares (Thousand shares)
Class of shares Balance of
December 31, 2011 Increase Decrease
Balance as of December 31, 2012
Common stock 93,800 - 1,080 92,720
(Details of change) Details of the decrease in the number of shares are as follows:
Retirement of treasury stock 1,080 thousand shares 2. Treasury stock (Thousand shares)
Class of shares Balance of
December 31, 2011 Increase Decrease
Balance as of December 31, 2012
Common stock 32 1,060 1,080 13(Details of the change)
Details of the increase in the number of shares are as follows: Acquisition in accordance with the resolution at the meeting of the Board of Directors 1,060 thousand sharesAcquisition of fractional shares 0 thousand shares
Details of the decrease in the number of shares are as follows: Retirement of treasury stock 1,080 thousand sharesSale of fractional shares 0 thousand shares
Shimano Inc. (7309) Summary of Consolidated Financial Results for FY2013
16

3. Dividends
(1) Payment of cash dividends
Resolution Class of Shares
Total amount of cash dividends
(Millions of yen)
Cash dividends per share(yen) Record date Effective date
General Meeting of shareholders held on March 29, 2012
Common stock
2,859 30.50 Dec. 31, 2011 Mar. 30, 2012
Meeting of the Board of Directors held on July 31, 2012
Common stock
3,476 37.50 Jun. 30, 2012 Sep. 4, 2012
(2) Dividends with record date within the current fiscal year and effective in the next fiscal year
Resolution Class of shares
Source of dividends
Total amount of cash dividends
(Millions of yen)
Cash dividends per share (yen) Record date Effective date
General Meeting of shareholders held on March 28, 2013
Common stock
Retainedearnings
3,476 37.50 Dec. 31, 2012 Mar. 29, 2013
FY2013 (From January 1, 2013 to December 31, 2013) 1. Total number of issued shares (Thousand shares)
Class of shares Balance as of
December 31, 2012 Increase Decrease
Balance as of December 31, 2013
Common stock 92,720 - - 92,720
2.Tresury stock (Thousand shares)
Class of shares Balance as of
December 31, 2012 Increase Decrease
Balance as of December 31, 2013
Common stock 13 1 - 14
(Details of the change)
Details of the increase in the number of shares are as follows: Acquisition of fractional shares 1 thousand shares
3. Dividends
(1) Payment of cash dividends
Resolution Class of shares
Total amount of cash dividends
(Millions of yen)
Cash dividends per share(yen) Record date Effective date
General Meeting of shareholders held on March 28, 2013
Common stock
3,476 37.50 Dec.31, 2012 Mar. 29, 2013
Meeting of the Board of Directors held on July 30, 2013
Common stock
4,032 43.50 Jun. 30, 2013 Sep. 4, 2013
(2) Dividends with record date within the current fiscal year and effective in the fiscal year
Resolution Class of shares
Source of dividends
Total amount of cash dividends
(Millions of yen)
Cash dividends per share (yen) Record date Effective date
General Meeting of shareholders held on March 27, 2014
Common stock
Retainedearning
4,032 43.50 Dec. 31, 2013 Mar. 28, 2014
Shimano Inc. (7309) Summary of Consolidated Financial Results for FY2013
17

(Notes relating to Consolidated Statements of Cash Flows)
* Reconciliation between cash and cash equivalents at the end of the year and the accounts in the consolidated balance sheets
FY2012
Jan. 1, 2012 to Dec. 31, 2012
FY2013 Jan. 1, 2013 to Dec. 31, 2013
Cash and time deposits 94,950 million yen 128,796 million yenTime deposits with maturities exceeding three months (141) million yen (2,928) million yenCash and cash equivalents 94,809 million yen 125,867 million yen
(Notes relating to Securities)
FY2012 (As of Dec.31, 2012) Other securities (Securities for which the amount recorded on the consolidated balance sheet exceeds acquisition cost)
Item Book value
(Millions of yen) Acquisition cost (Millions of yen)
Difference (Millions of yen)
(1) Stock 5,627 3,689 1,938
Subtotal 5,627 3,689 1,938
(Securities for which the amount recorded on the consolidated balance sheet does not exceed acquisition cost)
Item Book value
(Millions of yen) Acquisition cost (Millions of yen)
Difference (Millions of yen)
(1) Stock 1,173 1,710 (537)
Subtotal 1,173 1,710 (537)
The book value of securities whose market value declines to 50% or less of the acquisition cost during the fiscal year are written down.
FY2013 (As of Dec. 31, 2013) Other securities (Securities for which the amount recorded on the consolidated balance sheet exceeds acquisition cost)
Item Book value
(Millions of yen) Acquisition cost (Millions of yen)
Difference (Millions of yen)
(1) Stock 9,205 4,013 5,191
Subtotal 9,205 4,013 5,191
(Securities for which the amount recorded on the consolidated balance sheet does not exceed acquisition cost)
Item Book value
(Millions of yen) Acquisition cost (Millions of yen)
Difference (Millions of yen)
(1) Stock 1,130 1,385 (255)
Subtotal 1,130 1,385 (255)
The book value of securities whose market value declines to 50% or less of the acquisition cost during the fiscal year are written down.
Shimano Inc. (7309) Summary of Consolidated Financial Results for FY2013
18

(Notes relating to Deferred Tax Accounting) 1. Significant components of deferred tax assets and liabilities
FY2012 (As of Dec. 31, 2012)
FY2013 (As of Dec. 31, 2013)
(Deferred tax assets)
Excess of limit of accrued employee bonuses 204 millions of yen 241 millions of yen
Enterprise tax payable 281 millions of yen 191 millions of yen
Officer retirement benefits 270 millions of yen 272 millions of yen
Excess of limit of employee retirement benefits 913 millions of yen 897 millions of yen
Unrealized loss on other securities 95 millions of yen 60 millions of yen
Book in excess of tax depreciation 59 millions of yen 197 millions of yen
Unrealized gain of inventories 883 millions of yen 817 millions of yen
Loss on revaluation of other securities 663 millions of yen 848 millions of yen
Loss on revaluation of golf memberships 150 millions of yen 150 millions of yen
Excess of limit of allowance for doubtful accounts 381 millions of yen 396 millions of yen
Provision for loss on factory reconstruction - millions of yen 226 millions of yen
Loss on impairment 252 millions of yen 246 millions of yen
Book in excess of tax depreciation for small sum assets 204 millions of yen 196 millions of yen
Devaluation loss on inventories 423 millions of yen 494 millions of yen
Others 733 millions of yen 751 millions of yen
Sub-total deferred tax assets 5,518 millions of yen 5,989 millions of yen
Valuation allowance (1,531) millions of yen (44) millions of yen
Total deferred tax assets 3,987 millions of yen 5,945 millions of yen
(Deferred tax liabilities)
Undistributed earnings of consolidated subsidiaries (35) millions of yen (105) millions of yen
Reserve for special depreciation (942) millions of yen (1,325) millions of yen
Unrealized gain on other securities (651) millions of yen (1,869) millions of yen
Others (32) millions of yen (14) millions of yen
Total deferred tax liabilities (1,661) millions of yen (3,313) millions of yen
Net deferred tax assets 2,326 millions of yen 2,631 millions of yen
2. Reconciliation between the effective statutory tax rate and the actual effective tax rate.
FY2012 (As of Dec. 31, 2012)
FY2013 (As of Dec. 31, 2013)
Effective statutory tax rate 41.0 % 38.0 %
(Reconciliation)
Permanent difference-expenses 2.0 % 0.7 %
Permanent difference-income (1.4) % (1.2) %
Tax credit (2.0) % (1.9) %
Differences in tax rates for foreign subsidiaries (11.7) % (11.3) %
Valuation allowance (0.5) % (3.1) % Adjustment of deferred tax assets due to change
in effective statutory tax rates 0.1 % 0.0 %
Other 0.9 % 1.1 %
Actual effective tax rate 28.4 % 22.3 %
Shimano Inc. (7309) Summary of Consolidated Financial Results for FY2013
19
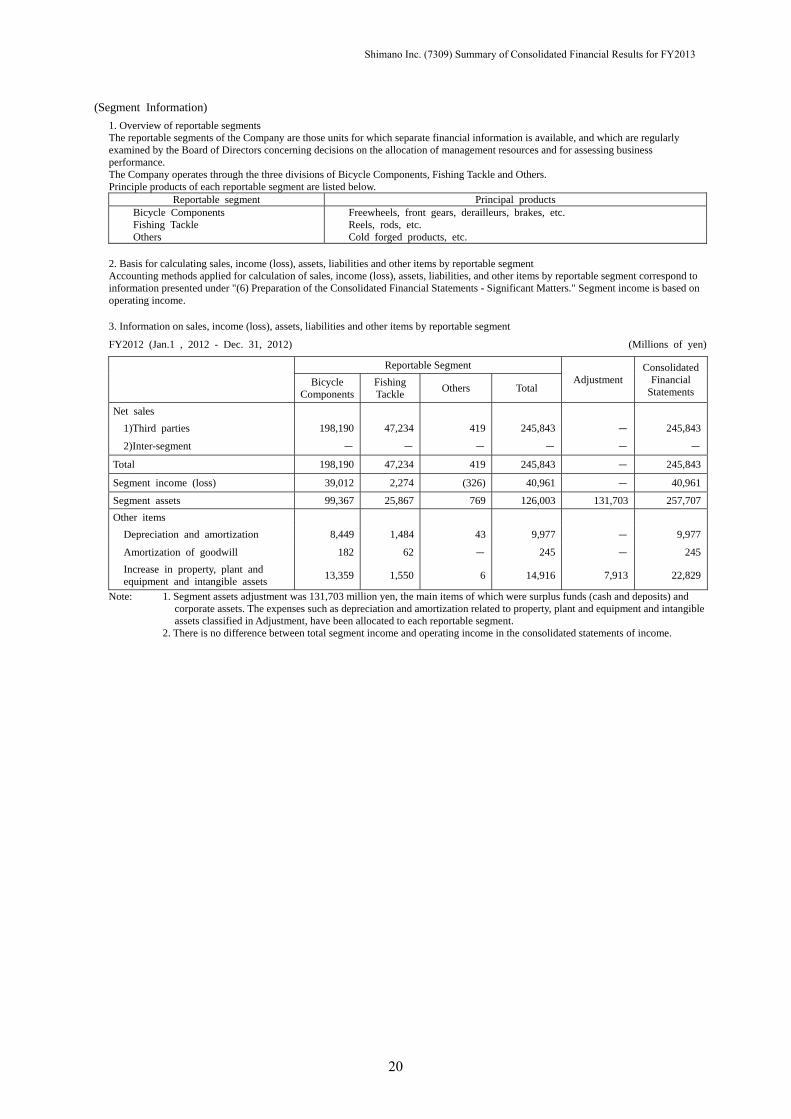
(Segment Information) 1. Overview of reportable segments The reportable segments of the Company are those units for which separate financial information is available, and which are regularly examined by the Board of Directors concerning decisions on the allocation of management resources and for assessing business performance. The Company operates through the three divisions of Bicycle Components, Fishing Tackle and Others. Principle products of each reportable segment are listed below.
Reportable segment Principal products Bicycle Components Freewheels, front gears, derailleurs, brakes, etc. Fishing Tackle Reels, rods, etc. Others Cold forged products, etc.
2. Basis for calculating sales, income (loss), assets, liabilities and other items by reportable segment Accounting methods applied for calculation of sales, income (loss), assets, liabilities, and other items by reportable segment correspond to information presented under "(6) Preparation of the Consolidated Financial Statements - Significant Matters." Segment income is based on operating income. 3. Information on sales, income (loss), assets, liabilities and other items by reportable segment
FY2012 (Jan.1 , 2012 - Dec. 31, 2012) (Millions of yen)
Reportable Segment
Adjustment Consolidated
Financial Statements
Bicycle Components
Fishing Tackle Others Total
Net sales 1)Third parties 198,190 47,234 419 245,843 - 245,843
2)Inter-segment - - - - - -
Total 198,190 47,234 419 245,843 - 245,843
Segment income (loss) 39,012 2,274 (326) 40,961 - 40,961
Segment assets 99,367 25,867 769 126,003 131,703 257,707Other items Depreciation and amortization 8,449 1,484 43 9,977 - 9,977
Amortization of goodwill 182 62 - 245 - 245 Increase in property, plant and
equipment and intangible assets 13,359 1,550 6 14,916 7,913 22,829
Note: 1. Segment assets adjustment was 131,703 million yen, the main items of which were surplus funds (cash and deposits) and corporate assets. The expenses such as depreciation and amortization related to property, plant and equipment and intangible assets classified in Adjustment, have been allocated to each reportable segment.
2. There is no difference between total segment income and operating income in the consolidated statements of income.
Shimano Inc. (7309) Summary of Consolidated Financial Results for FY2013
20

FY2013 ( Jan.1, 2013 - Dec. 31, 2013) (Millions of yen)
Reportable Segment
Adjustment Consolidated
Financial Statements
Bicycle Components
Fishing Tackle Others Total
Net sales 1)Third parties 217,263 53,398 376 271,037 - 271,037
2)Inter-segment - - - - - -
Total 217,263 53,398 376 271,037 - 271,037
Segment income (loss) 39,505 2,404 (135) 41,775 - 41,775
Segment assets 111,275 29,402 707 141,384 177,838 319,223Other items Depreciation and amortization 10,177 1,701 45 11,923 - 11,923
Amortization of goodwill 211 69 - 280 - 280 Increase in property, plant and
equipment and intangible assets 15,628 1,413 10 17,051 7,358 24,410
Note: 1. Segment assets adjustment was 177,838 million yen, the main items of which were surplus funds (cash and deposits) and corporate assets. The expenses such as depreciation and amortization related to property, plant and equipment and intangible assets classified in Adjustment, have been allocated to each reportable segment.
2. There is no difference between total segment income and operating income in the consolidated statements of income.
Related information Information by geographical area
Net Sales FY2012 (Jan. 1, 2012 - Dec. 31, 2012) (Millions of yen)
Japan North America Europe Asia Other Total
29,569 29,454 84,643 88,991 13,184 245,843Note: Net sales are classified by countries and regions according to customer location.
FY2013 (Jan. 1, 2013 - Dec. 31, 2013) (Millions of yen) Japan North America Europe Asia Other Total
31,545 33,223 93,357 99,246 13,664 271,037Note: Net sales are classified by countries and regions according to customer location.
Shimano Inc. (7309) Summary of Consolidated Financial Results for FY2013
21
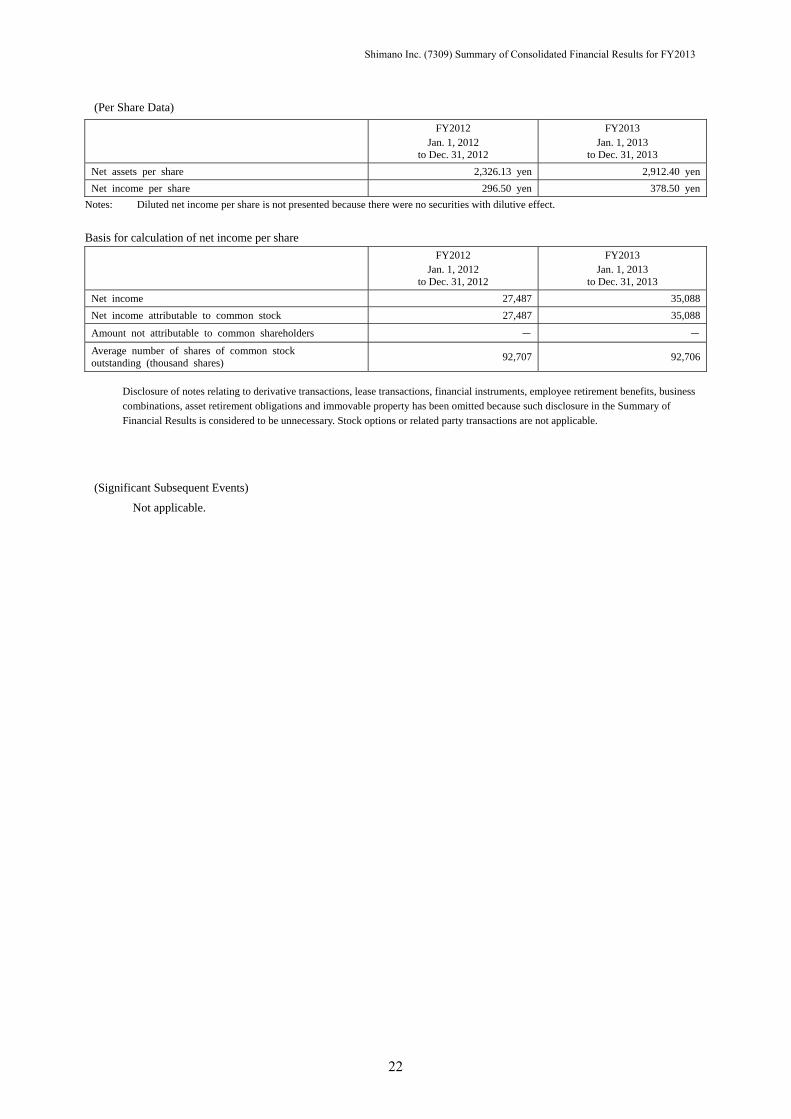
(Per Share Data)
FY2012
Jan. 1, 2012 to Dec. 31, 2012
FY2013 Jan. 1, 2013
to Dec. 31, 2013 Net assets per share 2,326.13 yen 2,912.40 yenNet income per share 296.50 yen 378.50 yen
Notes: Diluted net income per share is not presented because there were no securities with dilutive effect.
Basis for calculation of net income per share
FY2012
Jan. 1, 2012 to Dec. 31, 2012
FY2013 Jan. 1, 2013
to Dec. 31, 2013 Net income 27,487 35,088Net income attributable to common stock 27,487 35,088
Amount not attributable to common shareholders - -
Average number of shares of common stock outstanding (thousand shares) 92,707 92,706
Disclosure of notes relating to derivative transactions, lease transactions, financial instruments, employee retirement benefits, business combinations, asset retirement obligations and immovable property has been omitted because such disclosure in the Summary of Financial Results is considered to be unnecessary. Stock options or related party transactions are not applicable.
(Significant Subsequent Events) Not applicable.
Shimano Inc. (7309) Summary of Consolidated Financial Results for FY2013
22

5. Non-consolidated Financial Statements (1) Non-consolidated Balance Sheets
(Millions of yen)
FY2012 As of Dec. 31, 2012
FY2013 As of Dec. 31, 2013
Assets Current assets Cash and time deposits 16,508 16,860 Notes receivable * 1,191 * 1,173 Accounts receivable-trade 19,443 22,629 Finished goods 4,865 4,849 Work in process 8,235 8,176 Raw materials and supplies 1,387 1,252 Accounts receivable-other 3,783 2,061 Deferred income taxes 748 1,173 Others 1,155 1,585 Allowance for doubtful accounts (124) (178) Total current assets 57,196 59,583 Fixed assets Property, plant and equipment Buildings 26,079 27,529 Accumulated depreciation (12,518) (12,895) Accumulated impairment loss (140) (151) Buildings (net) 13,420 14,482 Structures 2,614 2,581 Accumulated depreciation (2,076) (2,127) Accumulated impairment loss (1) (1) Structures (net) 536 452 Plant and machinery 20,375 20,148 Accumulated depreciation (15,338) (15,396) Accumulated impairment loss (173) (160) Plant and machinery (net) 4,862 4,591 Vehicles 173 179 Accumulated depreciation (111) (103) Accumulated impairment loss - (0) Vehicles (net) 62 75 Tool, equipment and furniture 25,738 25,912 Accumulated depreciation (23,280) (23,754) Accumulated impairment loss (17) (14) Tools, equipment and furniture (net) 2,439 2,143 Land 9,804 9,838 Leased assets 43 50 Accumulated depreciation (30) (35) Leased assets (net) 13 15 Construction in progress 1,806 4,182 Total property, plant and equipment 32,946 35,782 Intangible assets Software 1,364 1,659 Others 278 441 Total intangible assets 1,642 2,101
Shimano Inc. (7309) Summary of Consolidated Financial Results for FY2013
23

(Millions of yen)
FY2012 As of Dec. 31, 2012
FY2013 As of Dec. 31, 2013
Investments and other assets Investment securities 6,348 9,705 Subsidiaries' and affiliates' stock 12,117 11,952 Long-term loans to subsidiaries and affiliates 4,025 3,846 Deferred income taxes 860 1,084 Others 2,076 2,223 Allowance for doubtful accounts (1,071) (1,027) Total investments and other assets 24,357 27,785 Total fixed assets 58,946 65,669 Total assets 116,142 125,252 Liabilities Current liabilities Accounts payable-trade 10,491 12,884 Accounts payable-other 4,353 4,251 Income taxes payable 3,146 1,473 Deposit payable 5,039 5,909 Accrued employee bonuses 232 230 Accrued officer bonuses 164 163 Provision for loss on factory reconstruction - 596 Others 541 1,197 Total current liabilities 23,969 26,705 Long-term liabilities Employee retirement benefits 2,169 2,065 Others 757 749 Total long-term liabilities 2,927 2,814 Total liabilities 26,896 29,520 (Net assets) Shareholders' equity Common stock 35,613 35,613 Capital surplus Capital reserve 5,822 5,822 Total capital surplus 5,822 5,822 Retained earnings Legal reserve 3,194 3,194 Other retained earnings Unappropriated retained earnings 43,557 47,945 Total retained earnings 46,751 51,139 Treasury stock (47) (58) Total shareholders' equity 88,139 92,516 Valuation and transaction adjustments Unrealized gain (loss) on other securities 1,106 3,214 Total valuation and transaction adjustments 1,106 3,214 Total net assets 89,246 95,731 Total liabilities and net assets 116,142 125,252
Shimano Inc. (7309) Summary of Consolidated Financial Results for FY2013
24

(2) Non-consolidated Statement of Income
(Millions of yen)
FY2012
Jan. 1, 2012 to Dec. 31, 2012
FY2013 Jan. 1, 2013
to Dec. 31, 2013 Net sales 191,551 205,214 Cost of sales Beginning balance of finished goods 4,969 4,865 Purchases of finished goods 85,503 99,815 Cost of products manufactured *2 64,604 *2 64,709 Total 155,076 169,390 Transfer to other accounts 765 716 Ending balance of finished goods 4,865 4,849 Total cost of sales 149,446 163,824 Gross profit 42,105 41,389 Selling, general and administrative expenses *2 29,004 *2 30,601 Operating income 13,101 10,788 Non-operating income Interest income 336 337 Dividend income *1 1,689 *1 2,978 Foreign exchange gains 1,418 2,643 Others 460 263 Total non-operating income 3,904 6,223 Non-operating expenses Interest expenses 97 79 Payment discounts 170 171 Donations 143 156 Others 180 261 Total non-operating expenses 591 669 Ordinary income 16,414 16,342 Extraordinary losses Provision for loss on factory reconstruction - 596 Loss on factory reconstruction 1,076 1,752 Total extraordinary losses 1,076 2,348 Income before income taxes 15,338 13,993 Income tax-current 5,159 3,996 Income tax-deferred (95) (1,901) Total income taxes 5,063 2,095 Net income 10,274 11,897
Shimano Inc. (7309) Summary of Consolidated Financial Results for FY2013
25

(3) Non-consolidated Statements of Shareholders’ Equity FY2012 (Jan. 1, 2012 to Dec. 31, 2012)
(Millions of yen)
Shareholders’ equity
Common stock
Capital surplus Retained earnings
Capital reserve Other capital
surplus Total capital
surplus Legal reserve Other retained earning
Total retained earnings Unappropriated
retained earning
Balance at beginning of year 35,613 5,822 0 5,822 3,194 43,559 46,753
Changes of items during the year
Cash dividends paid (6,336) (6,336)
Net income 10,274 10,274
Acquisition of treasury stock
Sales of treasury stock 0 0
Retirement of treasury stock (0) (0) (3,939) (3,939)
Net changes of item other than shareholder's equity
Total changes of items during the year (0) (0) (2) (2)
Balance at end of year 35,613 5,822 - 5,822 3,194 43,557 46,751
Shareholders’ equity Valuation and translation adjustments
Total net assets Treasury stock Total shareholders’
equity Unrealized gain (loss)
on other securities Total valuation and
translation adjustments
Balance at beginning of year (124) 88,065 139 139 88,204
Changes of items during the year
Cash dividends paid (6,336) (6,336)
Net income 10,274 10,274
Acquisition of treasury stock (3,863) (3,863) (3,863)
Sales of treasury stock 0 0 0
Retirement of treasury stock 3,939 - -
Net changes of item other than shareholder's equity 967 967 967
Total changes of items during the year 76 74 967 967 1,041
Balance at end of year (47) 88,139 1,106 1,106 89,246
Shimano Inc. (7309) Summary of Consolidated Financial Results for FY2013
26

FY2013 ( Jan. 1, 2013 - Dec. 31, 2013) (Millions of yen)
Shareholders’ equity
Common stock
Capital surplus Retained earnings
Capital reserve Other capital
surplus Total capital
surplus Capital reserve Other capital surplus
Total retained earnings Unappropriated
retained earning
Balance at beginning of year 35,613 5,822 - 5,822 3,194 43,557 46,751
Changes of items during the year
Cash dividends paid (7,509) (7,509)
Net income 11,897 11,897
Acquisition of treasury stock
Net changes of item other than shareholder's equity
Total changes of items during the year 4,388 4,388
Balance at end of year 35,613 5,822 - 5,822 3,194 47,945 51,139
Shareholders’ equity Valuation and translation adjustments
Total net assets Treasury stock Total shareholders’
equity Unrealized gain (loss) on
other securities Total valuation and
translation adjustments
Balance at beginning of year (47) 88,139 1,106 1,106 89,246
Changes of items during the year
Cash dividends paid (7,509) (7,509)
Net income 11,897 11,897
Acquisition of treasury stock (11) (11) (11)
Net changes of item other than shareholder's equity 2,108 2,108 2,108
Total changes of items during the year (11) 4,376 2,108 2,108 6,485
Balance at end of year (58) 92,516 3,214 3,214 95,731
Shimano Inc. (7309) Summary of Consolidated Financial Results for FY2013
27
(4) Notes relating to Non-consolidated Financial Statements (Note concerning Assumption of Going Concern)
Not applicable.
(Changes in the Accounting Policies)
(Changes of depreciation method) Effective from the first quarter of FY2013, the Company has changed the depreciation method for property, plant and equipment acquired on or after January 1, 2013, in accordance with the revision of the Corporation Tax Act. The impact of this change is immaterial.
(Notes relating to Non-consolidated Balance Sheets) As the fiscal year-end fell on a holiday for financial institutions, notes receivable with maturity dates on the fiscal year-end date were cashed on a subsequent settlement date. The following amount of notes receivable with maturity dates on the fiscal year-end date was included in the balance of notes receivable at fiscal year-end.
FY2012(As of Dec. 31, 2012)
FY2013 (As of Dec. 31, 2013)
Notes receivable 22 million yen 18 million yen
(Notes relating to Non-consolidated Statements of Income)
*1 Dividend income from affiliated companies.
FY2012
Jan. 1, 2012 to Dec. 31, 2012
FY2013 Jan. 1, 2013 to Dec. 31, 2013
1,548 million yen 2,812 million yen
*2 R&D expenses included in selling, general and administrative expenses and manufacturing expenses
FY2012
Jan. 1, 2012 to Dec. 31, 2012
FY2013 Jan. 1, 2013 to Dec. 31, 2013
9,288 million yen 9,771 million yen
Shimano Inc. (7309) Summary of Consolidated Financial Results for FY2013
28

(Notes relating to Deferred Tax Accounting) 1. Significant components of deferred tax assets and liabilities
FY2012 (As of Dec. 31, 2012)
FY2013 (As of Dec. 31, 2013)
(Deferred tax assets)
Excess of limit of accrued employee bonuses 88 millions of yen 87 millions of yen
Enterprise tax payable 247 millions of yen 157 millions of yen
Officer retirement benefits 233 millions of yen 233 millions of yen
Excess of limit of employee retirement benefits 780 millions of yen 743 millions of yen
Unrealized gain on other securities 95 millions of yen 60 millions of yen
Loss on revaluation of other securities 663 millions of yen 663 millions of yen
Book in excess of tax depreciation 14 millions of yen 0 millions of yen
Loss on revaluation of golf memberships 150 millions of yen 150 millions of yen
Excess of limit of allowance for doubtful accounts 381 millions of yen 400 millions of yen
Provision for loss on factory reconstruction - millions of yen 226 millions of yen
Loss on impairment 252 millions of yen 246 millions of yen
Book in excess of tax depreciation 206 millions of yen 198 millions of yen
Devaluation loss on inventories 337 millions of yen 383 millions of yen
Others 303 millions of yen 573 millions of yen
Sub-total deferred tax assets 3,757 millions of yen 4,126 millions of yen
Valuation allowance (1,496) millions of yen - millions of yen
Total deferred tax assets 2,260 millions of yen 4,126 millions of yen
(Deferred tax liabilities)
Unrealized gain on other securities (651) millions of yen (1,869) millions of yen
Total deferred tax liabilities (651) millions of yen (1,869) millions of yen
Net deferred tax assets 1,609 millions of yen 2,257 millions of yen
2. Reconciliation between the effective statutory tax rate and the actual effective tax rate
FY2012 (As of Dec. 31, 2012)
FY2013 (As of Dec. 31, 2013)
Effective statutory tax rate 41.0 % 38.0 %
(Reconciliation)
Permanent difference-expenses 1.1 % 1.1 %
Permanent difference-income (4.2) % (7.5) %
Tax credit (4.8) % (5.9) %
Adjustments of previous year 1.0 % (0.0) %
Valuation allowance (1.1) % (10.7) %
Others (0.0) % 0.0 %
Actual effective tax rate 33.0 % 15.0 %
Shimano Inc. (7309) Summary of Consolidated Financial Results for FY2013
29

6. Change in members of the board
These changes in members of the Board shall be effective on March 27, 2014
(1) Change in Representatives
Representative Director scheduled to retire
Senior Executive Vice President
Takeshi Oi
(Scheduled to be appointed as Senior Adviser)
(2) Changes in other members of the Board
1. Changes to Corporative Executive Officers
Senior Executive Vice President, (Chief Technology Officer)
Etsuyoshi Watarai
(Currently Executive Vice President, Engineering, Bicycle Components Div. and Engineering, Fishing
Operations Div.)
2. Changes to Corporative Executive Officers
Senior Executive Vice President, (Chief Manufacturing Officer)
Shinji Wada
(Currently Executive Vice President, Production, Bicycle Components Div. and Production Engineering,
and Global Procurement Div.)
3. Changes to Corporative Executive Officers
Executive Vice President, (Head of Lifestyle Gear Div.)
Yoshihiro Hirata
(Currently Senior Vice President, Head of Lifestyle Gear Div.)
4. Director scheduled to retire
Senior Vice President, (Vice President of Shimonoseki Factory, Production Dept., Bicycle Components Div.)
Hideo Katsuoka
(Scheduled to be appointed as Audit & Supervisory Board Member)
5. New candidate for Corporate Auditor
Audit & Supervisory Board Member
Hideo Katsuoka
(Currently Senior Vice President, Vice President of Shimonoseki Factory, Production Dept., Bicycle
Components Div.)
Shimano Inc. (7309) Summary of Consolidated Financial Results for FY2013
30

6. New candidate for Corporate Auditor
Outside Audit & Supervisory Board Member
Kanako Nozue
(Currently Attorney in Tsujinaka Law Firm) 7. Corporate Auditor scheduled to retire
Audit & Supervisory Board Member
Toshinori Tanino
8. Corporate Auditor scheduled to retire
Outside Audit & Supervisory Board Member
Takayo Tsujinaka
Shimano Inc. (7309) Summary of Consolidated Financial Results for FY2013
31

![[Overview of the consolidated financial results] · [Overview of the consolidated financial results] We posted revenue of 4,524.5 billion yen, up 214.7 billion yen from the previous](https://static.fdocuments.in/doc/165x107/5ed81d306ce43d1ebd3ca094/overview-of-the-consolidated-financial-results-overview-of-the-consolidated-financial.jpg)