
Mega Solar Power Plant 1.5MW, Innoshima works …2...FY2013 Semi Annual Result -April to Sept. 2013...
36
1 Financial Results For the six months ended September 30, 2013 Mega Solar Power Plant 1.5MW, Innoshima works Hiroshima November 1, 2013 President & COO Takashi Tanisho Hitachi Zosen Corporation
Transcript of Mega Solar Power Plant 1.5MW, Innoshima works …2...FY2013 Semi Annual Result -April to Sept. 2013...

1
Financial ResultsFor the six monthsended September 30, 2013
Mega Solar Power Plant 1.5MW, Innoshima works Hiroshima
November 1, 2013President & COO Takashi Tanisho
Hitachi Zosen Corporation

Copyright Hitachi Zosen Corp.Copyright Hitachi Zosen Corp. 2
1. Overview of Financial Results
for the six months ended September 30, 2013
2. Forecast of FY2013
3. Details by Segment
4. Progress of Mid Term Business Plan “Hitz Vision”
Contents

Copyright Hitachi Zosen Corp.
■ Booked operating loss in the 1st half due to the decrease in sales of profitable projects
■ FY2013 P/L forecast remains unchanged reflecting:- Increase of profit in AOM business of Environmental systems & industrial plants segment is expected
- Business reform effort in Infrastructure segment- Fixed cost absorption via increase of Net sales
(*)AOM: After service, Operation, Maintenance
3
Key Points of the First Half of FY2013 Results

4
1. OVERVIEW OF FINANCIAL RESULTSFOR THE SIX MONTHS ENDED SEPTEMBER 30, 2013
Copyright Hitachi Zosen Corp.
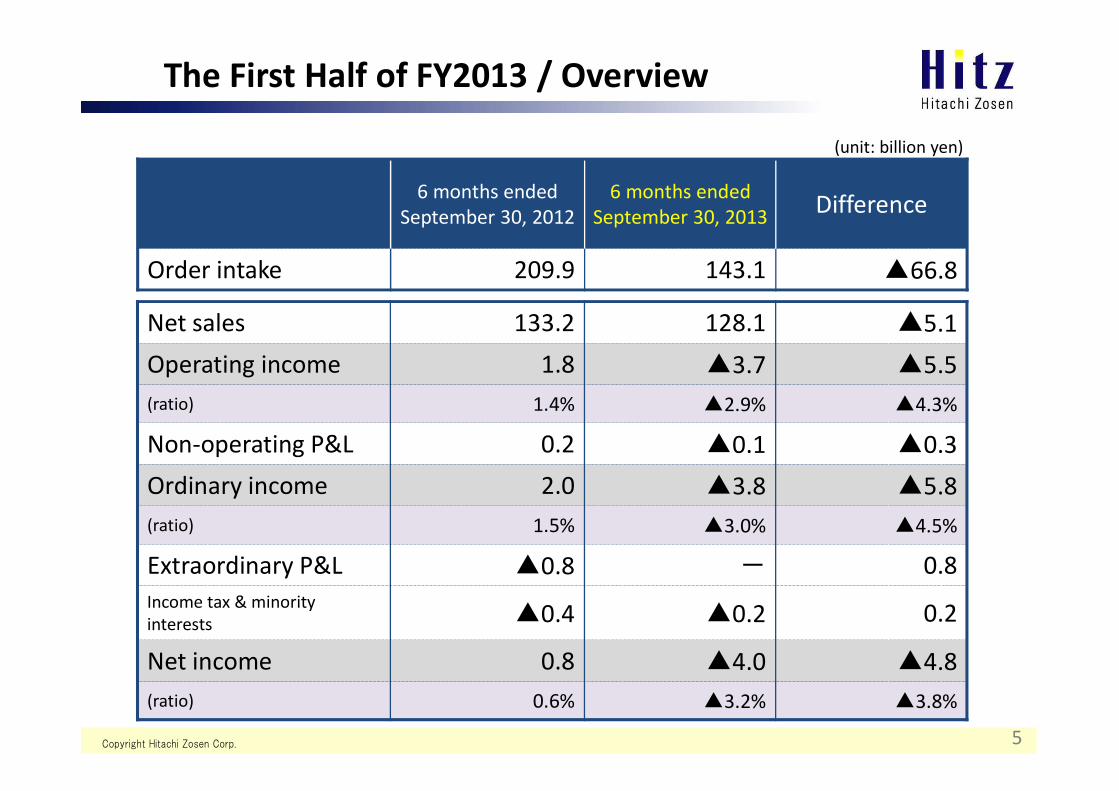
Net sales 133.2 128.1 ▲5.1Operating income 1.8 ▲3.7 ▲5.5(ratio) 1.4% ▲2.9% ▲4.3%
Non-operating P&L 0.2 ▲0.1 ▲0.3Ordinary income 2.0 ▲3.8 ▲5.8(ratio) 1.5% ▲3.0% ▲4.5%
Extraordinary P&L ▲0.8 - 0.8Income tax & minority interests ▲0.4 ▲0.2 0.2
Net income 0.8 ▲4.0 ▲4.8(ratio) 0.6% ▲3.2% ▲3.8%
5
6 months ended September 30, 2012
6 months ended September 30, 2013 Difference
Order intake 209.9 143.1 ▲66.8
(unit: billion yen)
The First Half of FY2013 / Overview

Copyright Hitachi Zosen Corp. 6
▲66.8
▲77.9
The First Half of FY2013 / Order intake
(unit: billion yen)

Copyright Hitachi Zosen Corp.
133.2 128.1
Total1.8
Total-3.7
7
▲6.2
▲5.1
▲1.2
■Net sales
■Operating income
(unit: billion yen)
The First Half of FY2013 / Net sales & Operating income

Copyright Hitachi Zosen Corp.
Environ-mentalSystems &Industrial Plants
Machinery ProcessEquipment
Infra-structure
PrecisionMachinery Others Total
6 months ended
September 30, 2013
Orderintake 80.9 26.1 9.0 10.5 12.6 4.0 143.1
Net sales 73.3 24.2 6.2 12.0 8.2 4.2 128.1Operatingincome ▲1.2 ▲0.3 ▲0.5 ▲1.2 ▲0.5 0.0 ▲3.7
6 months ended
September 30, 2012
Orderintake 158.8 27.1 1.9 10.4 7.4 4.3 209.9
Net sales 74.5 30.4 5.0 11.2 7.8 4.3 133.2Operatingincome 0.5 2.7 0.0 ▲2.2 0.2 0.6 1.8
Difference
Orderintake ▲77.9 ▲1.0 7.1 0.1 5.2 ▲0.3 ▲66.8
Net sales ▲1.2 ▲6.2 1.2 0.8 0.4 ▲0.1 ▲5.1Operatingincome ▲1.7 ▲3.0 ▲0.5 1.0 ▲0.7 ▲0.6 ▲5.5
8
(unit: billion yen)
The First Half of FY2013 / by segment

Copyright Hitachi Zosen Corp.
Operating P&L for 6 months ended September 30, 2012 1.8
Breakdown
Decrease of Net sales (-5.1)Decrease of profitable projectsin Environmental Systems & Industrial PlantsDecline of profit margin in MachineryDecline of profit margin in Precision MachineryCost reduction
▲0.8▲2.1
▲2.4▲0.7
0.5
▲5.5
Operating P&L for 6 months ended September 30, 2013 ▲3.7
9
The First Half of FY2013/ Increase & Decrease of Operating P&L
(unit: billion yen)

Copyright Hitachi Zosen Corp.
6 months ended September 30, 2012
6 months ended September 30, 2013 Difference
Interest expenses ▲0.6 ▲0.5 0.1
Dividend income 0.1 0.1 0.0
Equity in net income of affiliates 0.9 ▲0.8 ▲1.7Other Non-operating income ▲0.2 1.1 1.3
Non-operating P&L 0.2 ▲0.1 ▲0.3
10
Extraordinary Loss
Contribution for withdrawal from employees’ pension fund
▲0.8 - 0.8
Extraordinary P&L ▲0.8 - 0.8
The First Half of FY2013 / Non-operating P&L, Extraordinary P&L
(unit: billion yen)

Copyright Hitachi Zosen Corp.
Cash flows6 months ended September 30,
2012
6 months ended September 30,
2013Difference
Cash flows from operating activities 8.1 ▲4.1 ▲12.2Cash flows from investing activities ▲3.4 ▲1.8 1.6Cash flows from financing activities ▲19.4 ▲6.0 13.4Net increase in cash & cash equivalents (*1) ▲14.6 (*1) ▲11.0 3.6Cash & cash equivalents at beginning 66.6 56.4 ▲10.2Cash & cash equivalents at end (*2) 52.1 (*2) 45.4 ▲6.7
Interest bearing debt March 2013 September 2013 Difference
Bank borrowing (incl. Lease liabilities) 92.6 88.8 ▲3.8
Bond issues 10.0 10.0 0.0
Total 102.6 98.8 ▲3.8
11
The First Half of FY2013 / Cash flows & Interest bearing debt(unit: billion yen)
(unit: billion yen) (*1) including effect of exchange rate (1st half 2012: +0.1, 1st half 2013: +0.9)(*2) including other increase and decrease

12
2. FORECAST OF FY2013

Copyright Hitachi Zosen Corp.
Net sales 296.7 320.0 320.0 23.3
Operating income 11.3 13.0 13.0 1.7(ratio) 3.8% 4.1% 4.1% 0.3%
Ordinary income 11.2 10.0 10.0 ▲1.2(ratio) 3.8% 3.1% 3.1% ▲0.7%
Net income 7.4 7.5 7.5 0.1(ratio) 2.5% 2.3% 2.3% ▲0.2%
13
FY2012 FY2013 Forecast Difference(B-A)Actual (A) as of May as of Nov. (B)
Order intake 382.8 400.0 400.0 17.2
FY2013 Forecast / Overview
(unit: billion yen)

Copyright Hitachi Zosen Corp. 14
FY2013 Forecast / Oder intake
(unit: billion yen)

Copyright Hitachi Zosen Corp.
296.7 320.0
11.3 13.0
320.0
13.0
15
■Net sales
■Operating income
(unit: billion yen)
FY2013 Forecast / Net sales & Operating income

Copyright Hitachi Zosen Corp.
Environ-mentalSystems &Industrial Plants
Machinery ProcessEquipment
Infra-structure
PrecisionMachinery Others Total
FY2013Forecast
As of Nov.
Orderintake 240.0 55.0 30.0 36.0 30.0 9.0 400.0
Net sales 193.0 50.0 16.0 28.0 24.0 9.0 320.0Operatingincome 10.6 1.0 0.7 ▲1.0 0.8 0.9 13.0
As of May
Orderintake 240.0 50.0 35.0 36.0 30.0 9.0 400.0
Net sales 190.0 50.0 19.0 28.0 24.0 9.0 320.0Operatingincome 10.0 1.0 1.3 ▲1.0 0.8 0.9 13.0
FY2012Actual
Orderintake 271.1 47.5 16.3 20.9 18.3 8.7 382.8
Net sales 181.1 53.7 10.1 26.5 16.7 8.6 296.7Operatingincome 10.6 1.9 0.1 ▲2.3 0.1 0.9 11.3
16
(unit: billion yen)
FY2013 Forecast / by segment

Copyright Hitachi Zosen Corp. 17
(unit: billion yen)
FY2013 Forecast / Interest bearing debt
(multiple)
■Interest bearing debt■D/E Ratio (multiple)
■Shareholders’ equity ratio
*As of the financial year end

18
3. DETAILS BY SEGMENT

Copyright Hitachi Zosen Corp.
FY2013 Semi Annual Result -April to Sept. 2013<Net sales>・Yen 73.3 (- Yen 1.2 YoY)
<Operating income>・-Yen 1.2 (- Yen 1.7 YoY)・Decrease of profitable projects
FY2013 Annual Forecast –as of November<Net sales>・Yen 193.0 (+ Yen 3.0 from May Forecast)・Increase of AOM・Sales progress as scheduled
<Operating income>・Yen 10.6 (+ Yen 0.6 from May Forecast)・Increase of Net sales
240.0
FY2013 Semi Annual Result -April to Sept. 2013・Yen 80.9 (- Yen 77.9 YoY)・Decrease of EPC and Long-term operation
of Energy from Waste Plant (EfW) ・Projects concentrated in 2nd half
FY2013 Annual Forecast –as of November・Yen 240.0 (unchanged from May Forecast)・3 large orders confirmed as of October 31
(included 1 unofficial notification)
193.0
10.6
19
Environmental Systems & Industrial Plants
Order intake
Net sales/Operating income
(unit: billion yen) 【Order intake】
【Net sales】
【Operating income】
Forecast(As of May)
RevisedForecast
(As of Nov.)
6 month
12 month
EPC: Engineering, Procurement and ConstructionAOM: After-sales Service, Operation and Maintenance

Copyright Hitachi Zosen Corp.
FY2013 Semi Annual Result -April to Sept. 2013<Net sales>・Yen 24.2 (- Yen 6.2 YoY)・Decrease of Marine diesel engines
<Operating income>・-Yen 0.3 (- Yen 3.0 YoY)・Decrease of Net sales and profitability of
Marine diesel engines
FY2013 Annual Forecast –as of November・Net sales Yen 50.0 ・Operating income Yen 1.0・Unchanged from May Forecast
55.0
FY2013 Semi Annual Result -April to Sept. 2013・Yen 26.1 (- Yen 1.0 YoY)
FY2013 Annual Forecast –as of November・Yen 55.0 (+ Yen 5.0 from May Forecast)・The market of Press machine for
automobile industry continues to be brisk
50.0
1.0
20
Machinery
Order intake
Net sales/Operating income
(unit: billion yen) 【Order intake】
【Net sales】
【Operating income】
Forecast(As of May)
RevisedForecast
(As of Nov.)
6 month
12 month

Copyright Hitachi Zosen Corp.
FY2013 Semi Annual Result -April to Sept. 2013<Net sales>・Yen 6.2 (+ Yen 1.2 YoY)・Increase of Reactor
<Operating income>・-Yen 0.5 (- Yen 0.5 YoY)・Amortization of NAC’s goodwill
FY2013 Annual Forecast –as of November<Net sales>・Yen 16.0 (- Yen 3.0 from May Forecast)・Delay in kick off of a large GTL Reactor
project・Delay in order intake of large GTL Reactor
<Operating income>・Yen 0.7 (- Yen 0.6 from May Forecast)・Decrease of Net sales
30.0
FY2013 Semi Annual Result -April to Sept. 2013・Yen 9.0 (+ Yen 7.1 YoY)・Increase of Reactor・Addition of NAC International
FY2013 Annual Forecast –as of November・Yen 30.0 (- Yen 5.0 from May Forecast)・Delay in order intake of large GTL Reactor
16.0
0.7
21
Process Equipment
Order intake
Net sales/Operating income
(unit: billion yen) 【Order intake】
【Net sales】
【Operating income】
Forecast(As of May)
RevisedForecast
(As of Nov.)
6 month12 month

Copyright Hitachi Zosen Corp.
FY2013 Semi Annual Result -April to Sept. 2013<Net sales>・Yen 12.0 (+ Yen 0.8 YoY)・Increase of Steel stacks and Hydraulic gates
despite decrease of Shield tunneling machines
<Operating income>・-Yen 1.2 (+ Yen 1.0 YoY)・Improvement of profitability in Shield
tunneling machines・Increase of Net sales in Steel stacks
and Hydraulic gates FY2013 Annual Forecast –as of November・Net sales Yen 28.0 ・Operating income -Yen 1.0・Unchanged from May Forecast
36.0FY2013 Semi Annual Result -April to Sept. 2013・Yen 10.5 (+ Yen 0.1 YoY)
FY2013 Annual Forecast –as of November・Yen 36.0 (unchanged from May Forecast)・Order of Hydraulic gates and Movable
flap-gate type breakwater are expectedin 2nd half
28.0
-1.0
22
Infrastructure
Order intake
Net sales/Operating income
(unit: billion yen) 【Order intake】
【Net sales】
【Operating income】
Forecast(As of May)
RevisedForecast
(As of Nov.)
6 month
12 month

Copyright Hitachi Zosen Corp.
FY2013 Semi Annual Result -April to Sept. 2013<Net sales>・Yen 8.2 (+ Yen 0.4 YoY)
<Operating income>・-Yen 0.5 (- Yen 0.7 YoY)・Decline in profitability of projects
FY2013 Annual Forecast –as of November・Net sales Yen 24.0 ・Operating income Yen 0.8・Unchanged from May Forecast
30.0FY2013 Semi Annual Result -April to Sept. 2013
・Yen 12.6 (+ Yen 5.2 YoY)・Increase of food and drug filling and
packaging systems and liquid crystal panel production systems
FY2013 Annual Forecast –as of November・Yen 30.0 (unchanged from May Forecast)
24.0
0.8
23
Precision Machinery
Order intake
Net sales/Operating income
(unit: billion yen) 【Order intake】
【Net sales】
【Operating income】
Forecast(As of May)
RevisedForecast
(As of Nov.)
6 month
12 month

24
4. PROGRESS OF MID TERM BUSINESS PLAN“HITZ VISION”

Copyright Hitachi Zosen Corp. 25
Innovation of
Business
✦Define Growth Area Define Business Domain and Target Market
✦Strengthen the Growth Area
✦Global Business
Newly established Global Business Promotion Division Expansion of overseas office
✦Proposal for Solution
Promotion of Customers' View ActivitiesNew R&D System
✦Improvement of Corporate Power for Earning from business
Well-balanced Business Portfolio
✦No. 1 Profitability in each business segments
Planning of Business Strategy and Development by PDCA
Innovation of
Mgmt. Control
✦Organization Operation of Flat Matrix Management
✦Financial Position Shareholders' equity ratio of 30% by FY 2013Further improvement of credit rating
✦R&D to Future Business New R&D Organization (Business & Product Development HQ)Joint Work with Business Planning Dept. and Business & Product Development HQ
✦Transform Corporate Culture Secure Aggressive, Growth Driven, Efficiency-driven culturePromote Proactive Staff
Key Measure for Mid Term Business Plan

Copyright Hitachi Zosen Corp. 26
Establishment of local Subsidiary in MyanmarRebranding and Relocation of Vietnam Subsidiary
Hitz Dehydration System HDS® by Zeolite Membrane ElementDemonstration Plant for Solar Thermal Power Generation High-Speed Seabed Infiltration System
EfW Global Business Renewable Energy Project
Process Equipment – Expansion of Overseas manufacturing site
4. Research & Development
1. Green Energy
2. Social Infrastructure and Disaster Prevention
3. Development of Global Business
5. Hitz Vision Objectives
Progress of Mid Term Business Plan

Copyright Hitachi Zosen Corp.
EfW and Incineration Plants -Order intake from April to October, 2013-
Japan
Overseas
27
BuckinghamshireEfW Plant
(*) Order intake in 3Q
EfW Global Business (Energy from Waste)
Retrofit1. Kurashiki City,
OkayamaEfW Plant: 150t/d×2Power generation 1.9MW →3.4MW
2.Greater Katori,Chiba Incineration Plant: 45t/16h×3
EPC
1. Kyoto City(*) EfW Plant: 250t/d×2, 14MWBio gasification plant: 30t/d×2, 1MW
Long term operation & maintenance
1. Kurashiki-City,Okayama:21 year contract
2. Greater Tamura,Fukushima:8 year contract
EPC
1. Buckinghamshire UK by HZ Inova (*)
EfW Plant: 900t/d, 22MW
2. UK Project by HZ Inova (*)(unofficial notification)
EfW Plant: 1,162t/d
EPC: Engineering, Procurement and Construction
1. Green Energy (1)

Copyright Hitachi Zosen Corp.
■Mega Solar Power Plant・1.5MW plant built in our Innoshima works
Started operation in September 2013 under 20 year power supply contractElectric power generation of approx. 1,718,000 kWh per year
・1.0MW plant to be completed for our affiliated companyStart operation from Dec 2013 under 20 year contractElectric power generation of approx. 1,317,000 kWh per year
・Enter into the EPC and AOM business of Mega Solar■Biomass Power Plant
・5.8MW Plant fueled by unused woodchipsPlant completion in March 2015and 20-year operation
Renewable Energy Project under Feed in Tariff
28
1. Green Energy (2)
EPC: Engineering, Procurement and ConstructionAOM: After-sales Service, Operation and Maintenance

Copyright Hitachi Zosen Corp.
■Completion of Chinese JV’s manufacturing site
■ Additional investment to Indian JV for production facility
29
2. Social Infrastructure and Disaster Prevention
Process Equipment – Expansion of Overseas manufacturing site
ISGEC Hitachi Zosen Ltd・Increase of production capacity:
8,000t to 13,000t (×1.6)・Completion: June 2014
Manufacturing Site
Nagaoka Hitachi ZosenEquipment (Dalian) Co., LtdManufacturing of Process Equipment and Water Treatment Facility

Copyright Hitachi Zosen Corp. 30
■V TEX Korea Co., LtdVacuum valve manufacturing factoryMarch 2013
■ISGEC Hitachi Zosen Ltd. Indian JV for production of Process equipment April 2012
■Nagaoka Hitachi Zosen Equipment (Dalian) Co., Ltd. Manufacturing JV of Process equipment & Water treatment equipment. May 2012
■Hitachi Zosen GPM Technology (Suzhou) Co., Ltd. Chinese JV for manufacturing of Precision machinery October 2011
■Hitachi Zosen Vietnam Co., Ltd.Design office in Vietnam October 2011
■Hitachi Zosen Seoul Branch Marketing and Procurement April 2012
■Hitachi Zosen India Private Ltd / Hyderabad branchEPC of EfW plantApril 2012
■Hitachi Zosen India Private LtdIndian subsidiary for an base in Indian market - July 2011
Hitachi Zosen Inova AG
■Action implemented in medium term business plan starting 2011 until September 30, 2013 FY2012FY2011
NACInternational100% acquisition of NACI March 15, 2013
Hitachi Zosen Inova U.S.A. LLC
■Hitachi Zosen Myanmar Co., LtdMyanmar subsidiary for an base in Myanmar market - October 2013
Additional capital investmentJuly 2013
FY2013
Completion of manufacturing siteJuly 2013
Rebranding: May 2013Relocation: Sep. 2013
3. Development of Global Business (1)

Copyright Hitachi Zosen Corp.
Hitachi Zosen Myanmar Co., LtdStarted sales activities of infrastructure business
Hitachi Zosen Vietnam Co., Ltd.Rebranding and relocation to new officeto enhance the role of engineering hub in Southeast Asia
■Myanmar Subsidiary ■Vietnam Subsidiary
3. Development of Global Business (2)
31

Copyright Hitachi Zosen Corp.
4. Research & Development (1)
■Field Test in distillation process of petrochemical plant Accomplishment of continuous running for 200 hours
・Improvement of water resistance・Lengthening of body・Possibility of saving more than 50% energy
■Starting the Development for Mass ProductionFacility to produce 1,500 per month of large-sized membrane (diameter: 25mm, length: 1.7m)for Dehydration of bioethanol and various solvent
Hitz Dehydration System HDS® by Zeolite Membrane Element
Installed in petrochemical plant
Hitz Membrane Element
NEDO Project ParticipationsWaseda UniversityJX Nippon Oil & Energy Corp.Hitachi Zosen Corp.Mitsubishi Chemical Corp.Chiyoda Corp.Noritake Co., Ltd
HDS®
32

Copyright Hitachi Zosen Corp.
■Saudi ArabiaThermal Power Generation ⇒Contributing to Desalination plants
Using mirror reflectors to focus sunlight on a tube absorber, which acts as a heat source to generate steam and produce electricityThermal storage enable continuous power generation during nighttime
Hitz Super Low Profile Fresnel concentrated solar power(1) Controllable reflector in both angle and curvature
→improvement of the solar concentration ratio(2) Lower setup of he tube absorber →wind resistance and easy maintenance
Demonstration Plant for Solar Thermal Power Generation
4. Research & Development (2)
33

Copyright Hitachi Zosen Corp.
■ Abu DhabiHiSIS® pilot plant constructionis agreed between the Abu Dhabi Water and Electricity Authority (ADWEA) and Hitachi Zosen contributing to Seawater Reverse Osmosis (SWRO) Desalination Plants
High-speed Seabed Infiltration System (HiSIS®)
4. Research & Development (3)
34
Features of SWRO
Needs fewer electricity consumption, but has problems; ・clogging of membrane・environmental burden caused by
injecting chemicals
HiSIS®
Merits of installing HiSIS® to SWRO(1) Saving facilities
→ Reduction of initial costs(2) Restraint the growth of marine life,
amount of injecting chemicals, and deterioration of membrane
→ Reduction of running costs and environmental burden

Copyright Hitachi Zosen Corp.
FY2011 FY2012 FY2013
Hitz-V Plan Actual Achievement ratio Hitz-V Plan Actual Achievement
ratio Hitz-V Plan Forecast
Order intake 370.0 289.7 78.3% 440.0 382.8 87.0% 500.0 400.0
Net sales 310.0 303.0 97.7% 340.0 296.7 87.3% 400.0 320.0
Operating income(Ratio)
14.0(4.5%)
11.3(3.7%)
80.7% 15.5(4.6%)
11.3(3.8%)
72.9% 20.0(5.0%)
13.0(4.1%)
Ordinary income(Ratio)
13.0(4.2%)
10.7(3.5%)
82.3% 13.5(4.0%)
11.2(3.8%)
82.3% 16.0(4.0%)
10.0(3.1%)
Net income 10.0 9.3 93.0% 10.5 7.4 71.5% 11.5 7.5
Int. bearing debt 114.4 107.6 - 100.0 102.6 - 100.0 105.0
Net worth ratio 24.2% 25.4% - 29.1% 26.9% - 30.0% 27.3%
35
5. Hitz Vision Objectives
(unit: billion Yen)

Copyright Hitachi Zosen Corp. 36
Cautionary StatementForward-looking statements are based on information currently available to Hitachi Zosen Corporation. Therefore those forward-looking statements include unknown risks and uncertainties. Accordingly, you should note that the actual results could differ materially from those forward-looking statements. Risks and uncertainties that could influence the ultimate outcome include, but are not limited to, the economic conditions surrounding Hitachi Zosen Corporation and/or exchange rate fluctuation.


![Tonami · farel Adults 2,800 yen, children (elementary school student) 1,400 yen/ [short cruises] adults 1,000 yen, children 500 yen (Saturday, Sunday, and national holidays) Sankyoson](https://static.fdocuments.in/doc/165x107/6060f74a1f41df430a632a11/tonami-farel-adults-2800-yen-children-elementary-school-student-1400-yen-short.jpg)

