SUMMARY ANNUAL REPORT - Eni
36
SUMMARY ANNUAL REPORT ENI IN 2018 I N
Transcript of SUMMARY ANNUAL REPORT - Eni

S U M M A R Y A N N U A L R E P O R T
E N I I N 2 0 1 8
IN
*00232*

Printed on XPer Fedrigoni paper
Eni SpA
Registered OfficePiazzale Enrico Mattei, 1 - Rome - ItalyShare capital: € 4,005,358,876.00 fully paid-upBusiness Register of Rome, Taxpayer’s code 00484960588
Other BranchesVia Emilia, 1San Donato Milanese (MI) - Italy
Piazza Ezio Vanoni, 1San Donato Milanese (MI) - Italy
Page layout and supervisionK-Change - Rome - Italy
PrintVarigrafica Alto Lazio - Viterbo - Italy
MISSION
We are an energy company.
We are working to build a future where everyone
can access energy resources efficiently and sustainably.
Our work is based on passion and innovation,
on our unique strengths and skills, on the quality of our people
and in recognising that diversity across all aspects of our operations
and organisation is something to be cherished.
We believe in the value of long term partnerships with the countries
and communities where we operate.
FPSO – OCTP project – Ghana

FINANCIAL
REVIEW
SUPPLEMENTARY
INFORMATION
BUSINESS
REVIEW
Groupresultsfortheyear 16
Profitandlossaccount 17
Sourcesandusesofcash 19
SummarizedGroup BalanceSheet 20
SummarizedGroup cashflowstatementand changeinnetborrowings 22
Directorsandofficers 24
Remuneration 26
Investorinformation 29
Eniataglance 2
Ourstrategy 4
6 14 23
Exploration&Production 8
Gas&Power 10
Refining&MarketingandChemicals 12
CONTENTS
INFORMATION ABOUT THIS REPORT
Thissummaryreviewcomprisesanextractofthedescriptionofthebusinesses,themanagement’sdiscussionandanalysisoffinancialconditionandresultsofoperationsandcertainotherCompanyinformationfromEni’sAnnualReportfortheyearendedDecember31,2018.Itdoesnotcontainsufficientinformationtoallowasfullanunderstandingoffinancialresults,operatingperformanceandbusinessdevelopmentsofEnias“Eni2018AnnualReport”and“Eni’sAnnualReportonForm20-F2018”.ItisnotdeemedtobefiledorsubmittedwithanyItalianorUSmarketorotherregulatoryauthorities.Youmayobtainacopyof“SummaryAnnualReview-Eniin2018”,“AnnualReport2018”,“AnnualReportonForm20-F2018”and“FactBook2018”onrequest,freeofcharge,throughane-mailrequestaddressedtothemailbox:[email protected]’swebsiteunderthesection“Publications”.FinancialdatapresentedinthisreportisbasedonconsolidatedfinancialstatementspreparedinaccordancewiththeIFRSendorsedbytheEU.Thisreportcontainscertainforward-lookingstatementsparticularlythoseregardingcapitalexpenditure,developmentandmanagementofOil&Gasresources,dividendsandsharerepurchases,allocationoffuturecashflowfromoperations,futureoperatingperformance,gearing,targetsofproductionandsalegrowth,newmarketsandtheprogressandtimingofprojects.Bytheirnature,forward-lookingstatementsinvolverisksanduncertaintiesbecausetheyrelatetoeventsanddependoncircumstancesthatwillormayoccurinthefuture.Actualresultsmaydifferfromthoseexpressedinsuchstatements,dependingonavarietyoffactors,includingthetimingofbringingnewfieldsonstream;management’sabilityincarryingoutindustrialplansandinsucceedingincommercialtransactions;futurelevelsofindustryproductsupply;demandandpricing;operationalproblems;generaleconomicconditions;politicalstabilityandeconomicgrowthinrelevantareasoftheworld;changesinlawsandregulations;developmentanduseofnewtechnologies;changesinpublicexpectationsandotherchangesinbusinessconditions;theactionsofcompetitorsandotherfactorsdiscussedelsewhereinthisdocument.AsEnishares,intheformofADRs,arelistedontheNewYorkStockExchange(NYSE),anAnnualReportonForm20-FhasbeenfiledwiththeUSSecuritiesandExchangeCommissioninaccordancewiththeUSSecuritiesExchangeActof1934.EnidisclosesonitsAnnualReportonForm20-FsignificantwaysinwhichitscorporategovernancepracticesdifferfromthosemandatedforUScompaniesunderNYSElistingstandards.Theterm“shareholders”inthisreportmeans,unlessthecontextotherwiserequires,investorsintheequitycapitalofEniSpA,bothdirectand/orindirect.EnisharesaretradedontheItalianStockExchange(MercatoTelematicoAzionario)andontheNewYorkStockExchange(NYSE)underthetickersymbol“E”.

ENI IN 2018 | ENI AT A GLANCE2
ENIAT A GLANCE
In 2018, Eni made outstanding progress both at optimizing the existing asset portfolio and at strengthening it for the future. These results owed to the process of transformation of its business model started in 2014 in anticipation of the oil downturn, at the end of which Eni has become more financially sustainable and resilient to the volatile scenario as it has never been in the past.A new culture of integration and efficiency allowed us to accelerate the time-to-market of the capital projects and to unlock value in all Eni’s businesses by capitalizing on synergies.
At the core of this progress are our intangible assets: technologies, skills and know-how.Leveraging on these drivers, a new Eni has been built, based on efficiency, integration, deployment of new technologies and an optimized asset portfolio. Substantial progress was made in expanding the geographic reach of the asset portfolio and in rebalancing the business along the hydrocarbons “value chain” by making strategic acquisitions in the Middle East which comprised exploration and development properties in the UAE and elsewhere in the region and a deal under completion to acquire a 20% interest in the Ruwais refining complex in the UAE.
-50%
MANAGING THROUGH THE DOWNTURN
DOWNSTREAM REFINING BREAKEVEN MARGIN $3/BBL
FIRST RENEWABLES PROJECT STARTED UPRENEWABLES
FINANCIAL
2014 2018
+62%LNG LNG CONTRACTED VOLUMES 8.8 MTPA
-35%+123%
-40%
CAPEX €7.9 BLN
ORGANIC FREE CASH FLOW €6.5 BLN
NET DEBT €8.3 BLN
LEVERAGE 16% -5pp.
EXPLORATIONUPSTREAM
+16%+37%
PRODUCTION 1.851 MLN BOE/DNET ACREAGE >400,000 KM2
"IN THE PAST FIVE YEARS WE HAVE BEEN RAPIDLY DELIVERING A STRATEGY OF TRANSFORMATION THAT WAS DESIGNED TO ENHANCE OUR BUSINESS MODEL BY REDUCING DEBT, INCREASING PRODUCTION AND FINDING NEW WAYS TO DIVERSIFY OUR COMPANY"
CLAUDIO DESCALZI CEO ENI

ENI IN 2018 | ENI AT A GLANCE 3
-6%VS. 2017 UPSTREAM GHG INTENSITY INDEX
0.35 TRIRAMONG THE LOWEST LEVEL COMPARED TO THE AVERAGEOF THE INDUSTRY
0.16 LEVERAGE
THE LOWEST LEVEL IN THE LAST 12 YEARS
+110%VS. 2017UPSTREAM PROFITABILITY
1.85MILLION BOE/DNEW RECORD IN HYDROCARBON PRODUCTION
€380 MLN
R&M AND CHEMICALSADJUSTED OPERATING PROFIT
+154%VS. 2017 G&P PROFITABILITY
In these years, we have consistently delivered on our strategic guidelines leading to excellent results in terms of growth, returns and a healthy balance sheet: 2018 marked a record in hydrocarbon production at 1.85 million boe/d, the cash neutrality for funding capex and the floor dividend lowered to 52 $/bbl, which compares well to the 2014 baseline of 114 $/bbl, net borrowings declined to €8.3 billion, with a leverage at 0.16, the lowest level of the last twelve years and among the best of the industry, after having paid a total of €16.2 billion of dividends in the last five years in a challenging oil scenario.
Exploration was at the core of our growth and cash generation owing to magnitude of our discoveries and the effectiveness of the dual exploration model, whereby Eni has elected to acquire high working interest in exploration leases to achieve fast monetization of the discovered resources through the dilution of participation interests, while retaining operatorship. Since 2013, the dual exploration model allowed us to cash in approximately $10 billion mainly by diluting Eni’s interest in the giant gas projects Zohr in Egypt and Area 4 in Mozambique. Leveraging the dual exploration model, a number of strategic partnerships have been signed as well as the agreements signed in March 2018 to divest a 10% interest in the Zohr field and the concurrent acquisition of interests in the producing concession agreements Lower Zakum (5%) and Umm Shaif and Nasr (10%) located offshore the United Arab Emirates (UAE).
The downstream businesses reported robust results driven by the turnaround implemented in these five years, which made these businesses sustainable also in an unfavorable trading environment. The Gas & Power segment more than doubled 2017 results, significantly better than the announced guidance. In the oil downstream, technological innovation was the driver of the turnaround, which allowed Eni to revamp certain unprofitable plants, thus reducing the exposure to the volatility of the oil feedstock. Also in Versalis the development of the green chemical business and specialties, allowed to reduce the incidence of plastic commodities in the Company’s portfolio, which are subject to the volatility of the oil cycle.
Our businesses growth is even more focused on the long-term sustainability. Progress achieved so far in the evolution of our business model is based on a clear decarbonization strategy focused on operational efficiency and the search for innovative and sustainable solutions to foster energy transition and reduce emissions, including projects of circular economy and carbon offset and the development of power generation capacity from renewable sources (solar photovoltaic, wind and other). In 2018, significant results were achieved in Upstream GHG intensity emission reporting a 20% reduction compared to the baseline 2014. By 2030 Eni intends to achieve zero net carbon footprint in the upstream business leveraging on increasing efficiency to minimize direct upstream CO
2 emissions, maximizing decarbonization initiatives and developing forestry initiatives offsetting residual upstream emissions, while providing benefits to local communities.
52$/BARREL
2018 CASH NEUTRALITY
Volumes of hydrocarbon sent to �aring process (bcm)
2025
Upstream GHG intensity emission(mmtonnes CO2eq/kboe)
2014 2015 2016 2017 2018
26.8325.32
23.56 22.75 21.44
15.29
2014
1.7
2015
1.6
2016
1.5
2017
1.6
2018
1.4
-20% -16%
R&D expenditure (€ million)
2014
174
2015
176
2016
161
2017
185
2018
197+13%

ENI IN 2018 | OUR STRATEGY4
OURSTRATEGY
Eni's strategy of efficient and resilient growth will be driven by organic developments, the maximization of synergies across all of its businesses, cost and capital discipline, while geographic diversification and the rebalancing of the portfolio along the value chain are expected to strenghten the business.
The main planned course of actions are: (i) replacement of resources through exploration; (ii) growing Oil & Gas production with improving returns leveraging on the organic developments of our discoveries and full ramp-up at our core producing field; (iii) the sanctioning of projects to support medium and long-term growth; (iv) the renegotiations of gas supply contracts; (v) the development of the global LNG portfolio; (vi) the enhancement and growth of gas and power retail customers; (vii) the reduction in the breakeven of refining activity and international development; and (viii) the integration and specialization of the chemical business.These actions will be pursued leveraging on the operating model which assumes the continuous commitment to minimize risk
and the central role of human capital, environment and security.
This strategy aims at reaching the long-term carbon neutrality through a defined path that includes: (i) actions on energy mix and maximization of energy efficiency and reduction of direct emissions; (ii) development of forest conservation, reforestation or afforestation projects to increase CO
2 absorption capacity, with positive effects on local communities; (iii) development of circular economy initiatives aiming at the valorization of waste and biomass and the recovery of idle or reclaimed assets.
Eni, in line with its tradition and corporate values, will continue to promote local development leveraging on its original dual flag approach, focused on supporting Countries in their social and economic development, involving all the stakeholders. Development will be reached by promoting access to electricity and water, developing health, education and hygiene projects, as well as know-how sharing.
This strategy will be underpinned by innovation and the growing adoption of the digital technology which will allow to improve safety at the workplace and to catch new opportunities
of development and efficiency
EFFICIENT AND RESILIENT GROWTH(operating model)
AMBITION TO CARBONNEUTRALITY
PROMOTION OF LOCAL DEVELOPMENT(cooperation model)
Looking forward Eni plans to enhance value generation across all the businesses by maturing the grow projects in its portfolio and by capitalizing on the expansion in the Middle East.
Implementation of this strategy will be supported by a capital plan of €33 billion, approximately 77% of which will be destined to finding and developing hydrocarbons reserves. Approximately €3 billion will fund projects intended to reduce GHG emissions, including projects designated to cut volumes of flared gas, to grow the green business and to develop the circular economy.
Management believes that the action plan designed for the next four-year period 2019-2022 at the Company’s Brent scenario of $62 in 2019 subsequently increasing to our long-term case of $70 will improve the Company’s profitability and cash generation
The 2019-2022 plan gives a new input to growth and consolidates the integration of the sustainability in the business model. The plan consists in the following strongly synergic strategic levers:
reducing further Eni's cash neutrality. In 2019, CFFO before working capital needs is expected at €12.8 billion at a Brent price of 62 $/bbl, PSV gas price of 266 €/kcm and EUR/USD exchange rate of 1.15, growing by €2.6 billion in 2022 at the same scenario assumptions.
The Company remains committed to a progressive distribution policy in line with the expected growth in underlying earnings and cash flow. This policy contemplates an increase in the cash dividend to €0.86 per share for FY2019 and the resumption of the share buy-back program.

ENI IN 2018 | OUR STRATEGY 5
Eni has designed a decarbonization strategy integrated in the business model based on short, medium and long-term actions. Research and development will play a key role in our decarbonization strategy and in finding innovative solutions to promote energy transition.
In the short term, Eni’s strategy is based on the following levers:˛ increase of efficiency and reduction of direct GHG emissions:
by 2025 Eni targets to reduce the upstream emission intensity of its operated assets by 43% compared to 2014 through projects aiming at zero gas flaring, reduction of methane fugitive emissions and the realization of projects based on energy efficiency;
˛ “low carbon” and resilient Oil & Gas portfolio: Eni’s portfolio is characterized by a high share of natural gas (more than 50%), a bridge towards reduced future emissions. The main upstream projects in execution present an average breakeven at a Brent price of approximately 25 $/barrel, resilient to low carbon scenario;
˛ development of renewable sources and green business: the
promotion of renewable sources targets an installed power capacity of approximately 5 GW by 2025.
Relating to green business, the second phase of Venice biorefinery will be completed by 2021 with an increase of capacity to 560 kton/year (compared to the current value of 360 kton/year) and the start-up, by 2019, of the Gela plant, with a capacity of 720 kton/year. The consolidation of green chemicals is confirmed by the acquisition in 2018 of the Mossi & Ghisolfi Group bio-activities and by the development of recycling and recovering projects.
In the medium term, Eni targets the net zero carbon footprint by 2030, relating to direct emissions of the upstream equity assets, by maximizing the decarbonization initiatives and developing forestry projects offsetting residual upstream emissions. A central role will be played by those solutions addressed to capture, store and reuse CO
2. Another lever of our decarbonization path is the devolopment of circular economy initiatives aimed at waste and bio-mass valorization in order to extract new energy, new products or materials and revitalized dismissed or decommissioned assets.
FOCUS ON DECARBONIZATION
2018 results Target Actual 2018 - New plan 2019-2021 2018-2021 plan
620 mmboe Discovered resources 2.5 bboe 2 bboe
2.5% vs. 2017 at constant prices CAGR Production ~3.5% 3.5%
25 $/barrel Upstream new projects breakeven 25 $/barrel 30 $/barrel
8.8 MTPA LNG contracted volumes @ 2025 16 MTPA 14 MTPA
3 $/barrel Refining long-term breakeven margin 1.5 $/barrel 3 $/barrel
GHG upstream emissive intensity index -6% Decarbonization strategy Zero upstream carbon footprint
by 2030
2018 results Target Actual 2018 - New plan 2019-2021 2018-2021 plan
€0.83 per share Dividend €0.86 per share for FY2019. Growing the dividend going forward. €0.83 per share for FY2018
Share buy-back
€400 mln in 2019. In the subsequent years with leverage ante IFRS 16 below 0.20: • €400 mln/y @ Brent 60-65 $/bbl; • €800 mln/y @ Brent > 65 $/bbl.
IMPROVING OUR OPERATING TARGETS
OUR PROGRESSIVE REMUNERATION POLICY

Since the beginning of the oil downturn Eni has been transformed into a company capable of growing and creating value even in difficult market conditions. In the upstream, the Company has beaten its historical record of production, while delivering outstanding results in exploration and shortening the time-to-market of its projects. In mid-downstream, a full turnaround process has been completed. Gas & Power returned to positive structural results while the Refining & Marketing and Chemicals businesses have greatly improved their fundamentals.
BUSINESSREVIEW


ENI IN 2018 | BUSINESS REVIEW | EXPLORATION & PRODUCTION ENI IN 2018 | BUSINESS REVIEW | EXPLORATION & PRODUCTION 8
PORTFOLIO MANAGEMENTUpstream expanded the geographic reach of its operations by building a strong presence in the Middle East, strengthening its position in Norway as well as reloading the portfolio of exploration leases.We signed strategic agreements with the UAE, Oman and Bahrain that included producing fields, major developments and further near-field/high-potential exploration activities. We enhanced the producing platform in Norway, by setting up the jv Vår Energi (Eni 69.6%) and a production target of 250 kboe/d in 2023.Entrance in new areas was balanced through application of our Dual Exploration Model that included: (i) the disposal of a 10% interest in the Zohr field to Mubadala Petroleum and of the Nour exploration license (45% to BP/Mubadala), in Egypt; (ii) swap of explorations assets with Lukoil and disposal of 35% in the Area 1 license to Qatar Petroleum, in Mexico.
PRODUCTION GROWTHThe average hydrocarbon production for the year set a new record at 1.85 million boe/d (up by 2.5% vs. 2017 at constant prices) thanks to the five scheduled start-ups and ramp-ups with the extraordinary success in the production build at the Zohr field. Overall, start-ups and ramp-ups added approximately 300 kboe/d to the FY plateau.These outstanding achievements leverage on our integrated model of exploration and development, which enabled us to accelerate the time-to-market of our projects at the same time ensuring control on execution and capex. We are targeting a 3.5% average growth rate in hydrocarbon production up to a plateau of 2.13 million boe/d in the 2019-2022 plan period. We have good visibility as to the ability to reach those production targets because they relate to already-sanctioned projects, mostly of which are operated, and to incremental development phases at our existing profit centers.
EXPLORATION WILL CONTINUE FUELLING FUTURE DEVELOPMENTSThe upstream segment was boosted by exploration success. For the fourth consecutive year, Eni has been nominated best exploration company in the oil business. We added 620 million boe of equity resources to our portfolio at a competitive unit cost of 1.5 $/boe. In the last five years, we have discovered some 5 billion boe of resources replacing more than 130% of our cumulative production with proved reserves. Our exploration effort has been equally split between near-field initiatives aiming at quickly supporting production and cash flows leveraging on the proximity to our existing producing facilities and the higher-risk exploration of material resources in new areas or in unexplored geological layers. In the four-year plan, we will spend approximately €900 million per year, targeting 2.5 billion boe of new equity resources at below 2 $/boe, drilling more than 140 wells located in more than 25 countries. We are exploring with high equity stakes in order to continue to fuel our Dual Exploration Model.
GROWING CASH GENERATIONUpstream growth will continue to add higher-margin barrels. Exploration successes at low unit cost, the reduction in the time-to-market of reserve and efficient operating costs determined a steady downtrend in the full-cycle cost of the barrel produced, which today is 25 $/boe for new projects under execution. The significant improvement vs. the previous breakeven guidance of 30 $/bbl is due to the quality of the incoming projects, recently sanctioned, as well as the contribution of the fast track and phased development concept applied to the projects underway. Our projects portfolio remains resilient and competitive under both weak and low carbon scenarios.This positive result together with the legacy asset contribution, will contribute to cash flow of €11.5 billion in 2019 to €13.6 billion in 2022 at the Eni scenario. This projects portfolio is already free cash flow positive, thanks to the proceeds from the Dual Exploration Model. During the plan, we are expecting to generate €22 billion of upstream free cash flow.
EXPLORATION& PRODUCTION
In 2018, the E&P segment recorded the best result of the last four years. This performance reflected more than proportionally strong trend registered in hydrocarbon price scenario in the first ten months of 2018 (Brent prices up by 31%) and production growth, which was boosted by a larger weight of barrels with a higher profit per boe.
Exploration successes and time-to-market acceleration boosted the reserve replacement ratio at 131%, in the three-year period 2015-2018. In 2018 we achieved a 124% of all sources replacement ratio; 100% of organic replacement ratio (105% net of price effects). Our Dual Exploration Model with the early monetization of part of our reserves does not jeopardize our future growth plans.
We have been able to quickly reshape our upstream business in years of industry downturn. Today the upstream is faster, more efficient and valuable. By leveraging the quality of our portfolio and the low cost development, we have increased our production by 16%, whilst reducing overall capex by around 35%.
2,49
4
2016 2017
5,17
3
2018
10,8
50Adjusted operating performance (€ million)
Brent ($/boe)
43.69
+24%
54.27
71.04
Performance vs. Brent
+107%
+110%
+31%
2.60
6.89
2015
0.361.
98
Proved reserves
Net organic additions 2015-2018
Production 2015-2018
Portfolio 2015-2018
Movements in net proved reserves (bboe)
2018
7.15
Organic reservereplacement
ratio 2015-2018
131%
Production vs. Capex
1.90
1.80
1.70
1.60
14
10
6
2
2014 2015 2016 2017 2018
production (mmboe/d)
(mmboe/d)
capex (€ billion)
(€ billion)

ENI IN 2018 | BUSINESS REVIEW | EXPLORATION & PRODUCTION ENI IN 2018 | BUSINESS REVIEW | EXPLORATION & PRODUCTION 9
STRATEGY
Management will seek to boost the cash generation in the E&P segment leveraging on profitable production growth, capital discipline, effective project execution and strict control of operating expenses and working capital.The drivers to achieve our priorities are: (i) exploration initiatives will focus on supporting the replacement of produced reserves and on contributing to cash generation by means of near-field success where we can leverage on existing infrastructures to readily develop the discovered resources, ensuring fast contribution to cash flows; initiatives in operated licenses with high working interest targeting conventional resources, where in case of material discoveries we can apply our Dual Exploration Model as well as a resumption of activities in high-risk, high-reward plays; (ii) a 3.5% average growth rate in hydrocarbon production up to a plateau of 2.13 million boe/d in the 2019-2022 plan period. In 2019, we expect a production growth of approximately 2.5% at constant Brent prices and excluding the effects of portfolio transactions. This growth is expected to be fueled organically by new fields start-ups and the achievement of full field production at our main producing fields, including the Zohr gas field in Egypt, Block 15/06 in Angola and the gas project offshore Ghana, as well as continuing production optimization to fight fields natural decline. The main start-ups expected in the plan period include the projects that were sanctioned in 2018, mainly the Area 1 oil project offshore Mexico, the Merakes gas field in Indonesia, phase two of the Nenè Marine field in Congo and other developments in Italy, Egypt and Angola. We estimate that new field start-ups and production ramp-ups will add approximately 660 kboe/d in 2022. We have good visibility as to the ability to achieve those production targets because they relate to already sanctioned projects, mostly of which are operated, and to incremental development phases at our existing profit centers. Finally, in 2022 we are planning to start-up production at certain very large projects in Mozambique, the UAE, Norway and Nigeria, which will contribute to our long-term production growth; (iii) start-up and strengthening of integration with the G&P segment to monetize gas equity; (iv) a strong focus on project execution; and (v) optimizing operations by means of several initiatives to reduce operating costs and downtime also with processes digitalization.Eni will strictly monitor the main risks that could adversely impact the upstream performance: (i) the commodity risk related to trend in crude oil prices. Management intends to retain a strong focus on capital and cost discipline and on reducing the time-to-market of our reserves; (ii) the political risk due to social and political instability in certain countries of operations, which may lead to temporary production losses and disruptions in our operations. We note that our strategy of diversifying the geographic reach of our operations will lessen going forward our dependence on less politically stable areas such as North Africa, where we expect to reduce the relative weight of our production; and (iii) risks related to the growing complexity of certain projects due to technological and operational issues. Eni plans to counteract those risks by the execution in parallel of the main project activities, including discovery appraisal and pre-fid activities; the in-sourcing of critical engineering and project management phases; the design-to-cost method whereby the Company has redirected its exploration efforts towards mature and low-complexity areas where we can achieve fast time-to-market and cost synergies; and continuing progress in our technologies designed to improve drilling performance and the recovery factor.
1.85
2018
Production growth (mmboe/d)
The rise of upstream cash �ow(€ billion)
Excellence in operations
Start-ups/ramp-ups
Brent $/bbl 62 70Exchange rate €/$ 1.15 1.21
CAGR 3.5%~ €6.5 bln
per year
UPSTREAM CFFOCAPEX
~€22 bln
FCF 2019-2022
14
13
12
11
102019 2022
1.88
2019
>2.1
2022 2025
2.4
11.5
13.6
We will deliver an annual average growth rate of 3.5% to the end of the plan. New project start-ups and ramp-ups will account for around 660 kboe/d by 2022. Of this, 50% is related to the ramp-up of the recent start-ups. An additional 290 kboe/d are related to expansion projects of the existing �elds. In the period, we will put 18 major projects into production and we will operate 77% of our equity. Thanks to the long pipeline of projects in our portfolio, we are expecting to grow by 3.5% on average per year also through 2025.
In upstream, we will continue to grow organically, keeping capex stable and generating large amounts of free cash �ow. With the accretive contribution of new production, operating cash �ow is anticipated to reach €13.6 billion in 2022 at our scenario. Considering the new developments in the Middle East, Mexico and Africa, we will keep our upstream capex at €6.5 billion per year and lower cash neutrality to 37 $/bbl. Finally, we will generate a cumulated free cash �ow of €22 billion in the plan period, almost double our dividend needs.
Upstream GHG intensity index was positive with a reduction of 6% from 2017 and 20% from 2014. Our target is to achieve net zero emissions on equity basis in upstream business by 2030 leveraging on the continuing e�ciency to minimize direct CO
2 emission and by 2025 the elimination of gas process �aring and reduction of methane emissions by 80%. The residual upstream emissions will be o�set by large forestry projects. A growth in low carbon and zero carbon sources as well as a circular approach to maximize the use of waste as feedstock will be other issues of our strategy.
Oil and gas production (mmboe/d)
GHG emissions/100% operated hydrocarbon grossproduction (tonnes CO2eq/kboe)
1.75
9
2016 2017
1.81
6
2018
1.85
1
22.7521.44
23.56

ENI IN 2018 | BUSINESS REVIEW | GAS & POWER ENI IN 2018 | BUSINESS REVIEW | GAS & POWER 10
SUSTAINABLE PROFITABILITYIn 2018, the Gas & Power segment reported an adjusted operating profit of €543 million, more than doubling 2017 results and significantly better than the announced guidance. This performance was due to the restructuring the portfolio of long-term gas contracts, leveraging on the associated flexibilities to capture scenario upsides, the optimizations in the power business, trading and logistics as well as the growth in the LNG business with 8.8 MTPA of contracted volumes (up by 70% vs. 2017). All along the value chain we leveraged on the integration with the upstream segment contributing to the acceleration of FIDs at gas reserves development projects. The retail business performed strongly, driven by value creation at the European customer portfolio which reached 9.2 million clients, efficiency gains from the operations, digitalization programs and automatization of post-selling activities and working capital monitoring.
RESTRUCTURING OF LONG-TERM PORTFOLIO CONTRACTS Our renegotiation efforts will seek to obtain cost indexation that will track our pricing formulas, to align our procurement costs to prices prevailing in the wholesale market, which includes sales to large industrial and power companies and resellers, and to match our minimum contractual take with the dimension of our addressable market. Looking forward, we expect to fully align our supply portfolio to market conditions and dynamics in terms of both pricing and volumes.
PORTFOLIO OPTIMIZATION IN EUROPECompleted the sale of gas distribution activities in Hungary. In July 2018, Eni acquired a controlling stake in the Gas Supply Company Thessaloniki-Thessalia SA, a gas and electricity supplier in the retail market in Greece, with approximately 300,000 customers. In March 2018, the subsidiary Adriaplin finalized the acquisition of 100% of the company Mestni Plinovodi, which managed gas distribution and commercialization in 11 municipalities located in the central-north and north-eastern part of Slovenia.
ENERGY EFFICIENCY SERVICESIn January 2019, Eni through the subsidiary Eni gas e luce SpA, completed the acquisition of a controlling interest of SEA SpA, an energy service company operating in the field of services and solutions for energy efficiency. This transaction confirmed the strategy aiming to strengthen Eni’s presence in the energy efficiency services market, through the growth of commercial offer with integrated and innovative solutions, mainly focused on the industrial segment and apartment buildings.
GAS AND POWER SALESIn 2018 natural gas sales amounted to 76.71 bcm, down by 4.12 bcm, or 5.1% from 2017. Sales in Italy (39.03 bcm) increased by 4.3% from 2017. Higher sales to spot market and volumes sold to wholesalers and industries were partly offset by lower sales to thermoelectrical and residential segments. Sales in the European markets amounted to 26 bcm, down by 24.3% or 8.34 bcm from 2017. In 2018, power sales (37.07 TWh) were mainly directed to the free market. Compared to 2017, electricity sales in the free market were down by 0.62 TWh or by 2.3%, due to lower volumes sold to large customers, middle market and small and medium-sized enterprises, partially offset by higher volumes sold to the wholesalers.
LNG SALESLNG business can count currently on a portfolio of contracted long-term supplies mainly from Indonesia, Qatar, Nigeria, Oman and Algeria. In 2018, LNG sales (10.3 bcm),increased by 24.1% from 2017 and mainly concerned LNG supplied from Indonesia, Qatar, Nigeria, Oman and Algeria and marketed in Europe, China, Japan, Pakistan and Taiwan. In the plan period, Eni intends to develop its LNG business leveraging on the integration with the E&P segment and the valorization of the equity gas. In order to strengthen the integration with upstream business Eni obtained from the partners of Area 4 JV, long-term agreements for the purchase of LNG volumes.
GAS& POWER
In 2018, main gas volumes from equity production derived from: (i) Italian gas �elds (3.9 bcm); (ii) certain Eni �elds located in the British and Norwegian sections of the North Sea (2.6 bcm); (iii) Indonesia (1.6 bcm); (iv) Libyan �elds (1.4 bcm); and (v) the United States (0.3 bcm). Supplied gas volumes from equity production were approximately 9.9 bcm representing 13% of total volumes available for sale.
GHG emissions/kWheq relating to electricity production slightly increased by 1.8% compared to the previous year due to the higher consumption of re�nery gas in place of natural gas at the Ferrera Erbognone site.
2016 2017 2018
Supply of natural gas
Power plants GHG emissions(gCO2eq/kWheq)
398
395
402
Worldwide gas sales (bcm)
In 2018, natural gas sales amounted to 76.71 bcm, down by 4.12 bcm. In Italy, sales were 39.03 bcm, reporting an increase of 4.3% vs. 2017, driven by higher sales to spot market, wholesalers and industrial segments. Sales in the European markets amounted to 26 bcm (excluding importers in Italy), down by 24.3%, in the extra-European markets increased by 59.8%.
Italy European Markets
Russia
Algeria
Norway
Italy
Libya
The Netherlands
Other
Extra European Markets
2016
38.435.45
42.43
37.435.17
38.23
39.038.26
29.422017
2018
21%36%
16%9%
5%6%
7%
74.15 bcm

ENI IN 2018 | BUSINESS REVIEW | GAS & POWER ENI IN 2018 | BUSINESS REVIEW | GAS & POWER 11
STRATEGY
Against a weak outlook in the European gas and electricity markets, the Company priority in its G&P business is to strengthen profitability and cash generation. The main drivers to achieve these goals are: (i) renegotiating of our long-term gas supply contracts to align pricing and volume terms to current market conditions and dynamics as they evolve, and the reduction of logistic costs; (ii) growing in the LNG marketing business leveraging on the integration with the E&P segment with the aim of maximizing the profitability along the entire gas value-chain and supporting the achievement of the final investment decisions at large gas upstream projects (for example in Mozambique, Nigeria, Indonesia); (iii) leveraging integration with our downstream and upstream operations to extract better margins from the oil trading activity; (iv) managing the commodity risk in the power business by means of risk management activities intended to reduce the market risk; and (v) increasing the profitability of the Gas & Power retail business, by enhancing the value of the existing customer base against the backdrop of escalating competitive pressures. This will be achieved by growing our customer base, by expanding the offer of new products and services other than the commodity and by continuing innovation in marketing processes including the deployment of digitalization in the acquisition of new customers, a reduction in the cost to serve and effective management of working capital.Based on the above outlined trends and industrial actions, management expects that we will retain profitable, cash-positive operations in the Company's gas marketing business over the plan period. Our profitability outlook factors in the expected outcome of ongoing and planned renegotiations of the Company long-term supply contracts which the Company is seeking to finalize during the plan period.
8.8
2018
LNG: doubling our portfolio @2025 (MTPA)
Retail customers in Italy (million)
14
2022
16
2025
7.7
2017
7.7
2018
12
2022
We target to grow our customer base in core countries by 26% vs. 2018, up to around 12 million, driven by a doubling of power customers.
Equity gas projects
LNG will play a crucial role in creating a stronger G&P in the long-term. We are accelerating the ramp-up of our portfolio and we expect to reach 14 MTPA of contracted volumes in 2022 and up to 16 MTPA in 2025, placing us among the top players in the market.
Angola
Egypt Damietta
Nigeria NLNG (current)Nigeria NLNG
Indonesia Jangkrik (current)Indonesia Merakes
Australia
Oman (current)
Mozambique Rovuma
Qatar (current)
>70%VS. 56% IN 2018
EQUITY @2022
Con�rmed the structural sustainability in the plan period. Adjusted operating pro�t is expected at €0.7 billion in 2022 will leverage on stable contribution thanks to the integration of LNG activities with the upstream and continuing optimization of gas supply portfolio as well as growth and enhancement of the retail business' customer base also by developing new products/services.
543
2018 2019
~500
2022
~700
Adjusted operating pro�t(€ million)
Our target is to retain positive cash generation in future reporting periods. The cumulated free cash �ow of the plan is projected at €2.3 billion thanks to the strong contribution of the retail Gas & Power customer base expansion and further business integration in mid-downstream.
2017 2018 2019-2022
2.3
Cash generation (€ billion)

ENI IN 2018 | BUSINESS REVIEW | REFINING & MARKETING AND CHEMICALS ENI IN 2018 | BUSINESS REVIEW | REFINING & MARKETING AND CHEMICALS12
2018 RESULTSIn 2018, the Refining & Marketing business reported an adjusted operating profit of €390 million (down by 27%). The refining activity was negatively affected by a 26% decline in refining margins and by longer plant standstills. These negative trends were offset by plant and supply optimizations, as well as by higher margins on green throughputs. Marketing activities reported an improved performance both in the retail and wholesale segments also leveraging on effective commercial initiatives to support margins and on efficiency actions.In 2018, the Chemical business was negatively affected by rising costs of oil-based feedstock in the first ten months of the year that were not recovered in sale prices, by competitive pressures and by a demand slowdown in the last part of the year, which resulted in a strong contraction of the benchmark margin of cracker (down by 11%), and a sharp decrease in polyethylene prices during the fourth quarter, thus reporting an adjusted operating loss of €10 million from the adjusted operating profit of €460 million reported in 2017.
OPERATING PERFORMANCEIn 2018, Eni’s refining throughputs amounted to 23.23 mmtonnes, down by 3.3% y-o-y, driven by lower throughputs at the Milazzo refinery due to maintenance standstills and at the Bayernoil refinery following an event occurred in September, partially offset by higher volumes processed at the Sannazzaro and Livorno refineries.In 2018 the production of biofuels from vegetable oil at the Venice green refinery amounted to 0.25 mmtonnes, up by 4.2% compared to 2017.In 2018 sales of petrochemical products in Europe amounted to 4.94 mmtonnes, recording an increase of 6.3% y-o-y, due to higher intermediates sale volumes.
ACQUISITION OF REFINING CAPACITY IN THE MIDDLE EASTIn January 2019, in line with the strategy of rebalancing the geographical presence and the Group asset portfolio along the hydrocarbon value chain, Eni signed a Share Purchase Agreement with Abu Dhabi National Oil Company (ADNOC) for the acquisition of a 20% interest in the ADNOC Refining company, one of the best refining complexes in the world with an overall capacity of more than 900 kbbl/d. Additionally, the agreement includes the creation of a joint venture engaged in trading activities, participated by Eni with a 20% interest. The transaction is valued at $3.3 billion. Eni will provide refinery know-how and technologies to maximize the value of the asset. The agreement, one of the most remarkable transaction finalized in the refining sector, increased Eni downstream capacity by 35% and is expected to halve the breakeven refining margin to 1.5 $/barrel in the long term.
CIRCULAR ECONOMY COMMITMENTIn the downstream business we produce bio-products from our facilities, consistent with our decarbonization strategy. The Gela conversion in biorefinery is expected to come fully operational in the fourth quarter of 2019.In 2018 Eni launched a number of partnerships with some Italian municipalities, Vatican City and multi-utility companies operating in waste treatment and local public transport (in Taranto, Turin, Venice, Rome and in some municipalities of Emilia Romagna) for the exploitation of civil waste and organic raw materials by using them as feedstock to produce energy resources such as biofuels.Versalis carries on its commitment in the development of chemicals based on use of renewable resources, through an integrated technological platform. In November 2018 was completed the acquisition of bio-activities of the Mossi & Ghisolfi Group. The new assets will allow producing “advanced” bio-ethanol (i.e. obtained by non-food feedstock) and, potentially, other chemical bio-intermediates.
REFINING & MARKETING AND CHEMICALS
Average gasoline and gasoil throughput (1,589 kliters) was almost unchanged from 2017.As of December 31, 2018, Eni's retail network in ltaly consisted of 4,223 service stations, lower by 87 units from December 31, 2017 (4,310 service stations), resulting from the negative balance of acquisitions/releases of lease concessions (74 units), closure of low throughput stations (10 units) and the reduction in motorway concessions netted by the new opening (3 units).
In 2018 Eni's refining throughputs amounted to 23.23 mmtonnes, lower y-o-y (down by 3.3%). Production of petrochemical products (9,483 ktonnes) increased by 528 ktonnes (up by 5.9%).
4,39
6
2016 2017
4,31
0
2018
4,22
3
8.8
2016 2017
9.0
2018
9.5
24.5
2
2016 2017
24.0
2
2018
23.2
3
1,551
1,588 1,589
Service stations (no.)
Average throughput (kliters)
Service stations and average throughput in Italy
Operating performanceRe�nery throughputs on own account(mmtonnes)
Production of petrochemical products(mmtonnes)
In 2018 direct GHG emissions reported an increase of 4.7% in absolute terms following higher volumes processed. Energy e�ciency projects contributed to a 2.1% decrease in GHG emissions related to re�ning throughputs.
278
2016 2017
258
2018
253
GHG emissions/re�ning throughputs(ton CO2eq/kt)

ENI IN 2018 | BUSINESS REVIEW | REFINING & MARKETING AND CHEMICALS ENI IN 2018 | BUSINESS REVIEW | REFINING & MARKETING AND CHEMICALS 13
STRATEGY
Refining & MarketingIn the Refining & Marketing business management expects refining margins to hover around the 4-5 $/bbl range in the next four years and beyond. Further appreciation in the dollar vs. the euro exchange rate could negatively affect this target. Against this backdrop, the Company priority is to retain profitable and cash-positive operations even in a depressed downstream oil environment by reducing the breakeven margin of Eni refineries, targeting 3 $/bbl with the full operability of our refining system, particularly with the restart of the EST high-conversion unit at the Sannazzaro refinery and the recovery of the Bayernoil plant and optimizing the plant setup. We expect higher contribution from our green refining complexes due to the planned start-up of the Gela revamped refinery and the ramp up of green volumes at the Venice refinery. We expect the profitability of our refining business will be boosted significantly once we close the acquisition of a 20% interest in the refining complex in the UAE, with closing of transaction by end of 2019, by reducing our average breakeven refining margin in the medium term down to 2.7 $/bbl and longer term to 1.5 $/bbl.In Marketing activities, where we expect competitive pressure to continue due to muted demand trends, we are planning to improve results of operations mainly by focusing on innovation of products and services anticipating customer needs, strengthening our line of premium products, as well as efficiency in the marketing and distribution activities. Further value will be extracted by the development of our initiatives in the segment of sustainable mobility (Enjoy) and new fuels (for example the recharging for electric vehicles, hydrogen and compressed natural gas) and selling non-fuel products and services.
ChemicalsThe outlook in the chemical business is challenging due to an ongoing economic slowdown in Europe, in China and in other emerging economies and rising competitive pressures from cheaper products stream in the main commoditized segments, like polyethylene, from producers in the Middle East and in the US which can leverage on larger plant scale and lower feedstock costs. In addition, our petrochemical commodities are exposed to the volatility of the crude oil-based feedstock costs. Over the last few years, we have restructured our business by reducing capacity, divesting or exiting unprofitable lines, plant optimization and other efficiency measures as well as a shift in our product portfolio towards specialties, green chemicals and products with high technology content, which are less exposed to the scenario volatility. Looking forward we believe that further steps are needed to preserve profitability and to improve resiliency to the market volatility: (i) strengthening the productive footprint by means of improved plant integration and reliability as well as by rightsizing our captive ethylene capacity vs. internal needs for the production of polyethylene; (ii) improving feedstock flexibility by switching to ethane in feeding our crackers; (iii) upgrading the product mix by developing differentiated products, leveraging on new applications through internal R&D; (iv) developing the international presence of our chemical business leveraging on proprietary technologies targeting markets with growth opportunities and access to competitive feedstock and outlets; and (v) developing our portfolio of green products.
Breakeven re�ning margin ($/bbl)
Green re�nery throughputs (mmtonnes)
Adjusted operating pro�t(€ million)
Breakeven re�ning margin ($/bbl)Brent price (USD)
We are targeting a breakeven margin of 3 $/bbl at our legacy re�neries, with full operability of our re�neries, by maximizing plant reliability, optimizing setup and supply and by increasing the licensing of proprietary technologies. The re�nery breakeven margin is expected to improve to 1.5 $/bbl in the long term once the integration with ADNOC Re�ning has been accomplished.
The bio-re�ning segment is expected to grow thanks to the start-up and full operation of the Gela plant and the upgrading of Venice. Our green diesel production will grow to 1 million tonnes per year by 2021.
The R&M business is expected to grow operating pro�t to €1 billion by 2022 including contribution from our initiatives in the UAE, through the optimization of re�ning processes and the contribution of the biore�nery capacity in full operation.Chemicals target is to achieve an operating pro�t over €270 million in 2022, due to improved resilience to scenario volatility, a focus on higher value-added products, development of circular economy projects and of international presence in the low-cost feedstock areas.
278
2016
583
991380
2017
531
2018
390
305
460
(10)
2022
1,00
0
>270
2013 2014 2015 2016 2017 2018 2019(expected)
R&M
Chemicals
7.5
109
44
62713.8
3.51.5
Long term
3.0 0.21
2016
0.24
2017
0.25
2018 2021
1.00
FINANCIALREVIEW

In 2018, Eni achieved remarkable milestones in terms of geographical diversification and in the rebalancing of its businesses. All the main KPIs from the upstream to the downstream sector improved, increasing our financial and technological efficiency and with an extensive integration of all the businesses. From a financial point of view, this was one of Eni’s best performance of the last decade. With a cash flow from operations of €13.9 billion, up by 39% on last year, Eni has been able to more than capture the oil price upside, benefitting from the valuable and diversified portfolio. The efficient and disciplined capital allocation allowed the Group to lower the full cash neutrality reaching 52 $/bbl.

ENI IN 2018 | FINANCIAL REVIEW | GROUP RESULTS FOR THE YEAR ENI IN 2018 | FINANCIAL REVIEW | GROUP RESULTS FOR THE YEAR 16
0.4
0.6
0.8
1.2
1
0.2
1.4
100
150
200
250
300
50
350
20
40
60
80
100
120
1
2
3
4
5
6
7
8
9
20
40
60
80
100
120
2013 2014 2015 2016 2017 2018 2013 2014 2015 2016 2017 2018 2013 2014 2015 2016 2017 2018
Brent dated crude oil ($/bbl)
eur/$ exchange rate
PSV (€/kmc)
TTF (€/kmc)
Brent dated crude oil ($/bbl)
SERM ($/bbl)
A challenging trading environment
GROUP RESULTSFOR THE YEAR
In the full year 2018, net profit attributable to Eni’s shareholders was €4,126 million, up by 22.3% vs. the prior-year (€3,374 million); operating profit of €9,983 million represented a 24.6% increase over 2017 (up by approximately €2 billion). Eni’s results were supported by a better trading environment with average Brent prices increasing by 31% from 2017 to 71 $/barrel in 2018, in a highly volatile scenario. In the first ten months of the year, oil prices built on gains peaking at 85 $/barrel in October, the highest level in the last four years, due to a global economic recovery and a balanced demand/supply backdrop. Starting from November, alongside a sharp correction in the global financial markets, oil prices entered a downturn losing about 40% from the peak, falling to approximately 50 $/barrel at the end of the year, due to signs of weakening global growth, oversupplies, uncertainties tied to the commercial dispute between the USA and China and the Brexit, as well as geopolitical factors. In December, OPEC and Russia announced a production cut of 1.2 million barrel/d effective from 2019, which helped crude oil prices rebound to the sixty-dollars level in the first months of 2019.
In this scenario, Eni’s E&P segment reported an increase in operating profit of €2.56 billion, leveraging on better prices and production increases, with the latter boosted by a shift in the production mix towards barrels with higher profitability. Hydrocarbons production rose to 1.73 mmboe/d, with a 1.3% annual grow at constant prices (1% on reported basis), driven by Eni’s successful strategy of reducing the time-to-market of its reserves as witnessed by five new field start-ups in the year and fast ramp-up at core projects like the Zohr gas field in Egypt. The reserve replacement ratio was 124% on all-sources basis; when stripping out asset purchases and divestments the ratio was
still 100%. The de-booking of proved reserves made at a project in Venezuela negatively affected the reserve replacement ratio by fifteen percentage points and was driven by a deteriorated operating environment. The all-sources reserve replacement ratio improved significantly from the year-ago ratio of 27% due to the fact that in 2017 the Company divested significant interests in the properties of Zohr and Area 4 in Mozambique.
The G&P segment improved its operating profit by approximately €0.6 billion, driven by the overall restructuring of all the business lines. The Company was able to monetize the flexibilities associated with the portfolio of long-term gas contracts, as in the case of the option to lift additional volumes of gas beyond the minimum contractual take in case of favourable market trends like the ones that occurred in the first nine months of the year with a tighter gas market. Also, optimization in the power business and in logistics, as well as growth in the LNG business leveraging its integration with the E&P segment helped the segment’s results.
The downstream oil and chemical businesses were negatively affected by a challenging trading environment (approximately down by €1.4 billion) because of rapidly-escalating oil-based feedstock costs in the first ten months of the year, which were not fully recovered in the final prices of products due to competitive pressure from more efficient producers and a slowdown in markets for oil and chemicals commodities in the final part of the year. Those market developments caused a squeeze in commodity margins (the SERM benchmark refining margin was down by 26% to 3.7 $/barrel; the cracker margin down by 11% and the polyethylene margin was down by 69%), the effects of which were partly offset by improved margins on retail sales of fuels and efficiency gains.

ENI IN 2018 | FINANCIAL REVIEW | GROUP RESULTS FOR THE YEAR ENI IN 2018 | FINANCIAL REVIEW | GROUP RESULTS FOR THE YEAR 17
PROFIT AND LOSS ACCOUNT
(€ million) 2018 2017 2016 Change % Ch.Net sales from operations 75,822 66,919 55,762 8,903 13.3
Other income and revenues 1,116 4,058 931 (2,942) (72.5)
Operating expenses (59,130) (55,412) (47,118) (3,718) (6.7)
Other operating income (expense) 129 (32) 16 161 ..
Depreciation, depletion, amortization (6,988) (7,483) (7,559) 495 6.6
Impairments reversals (impairment losses), net (866) 225 475 (1,091) ..
Write-off of tangible and intangible assets (100) (263) (350) 163 62.0
Operating profit (loss) 9,983 8,012 2,157 1,971 24.6
Finance income (expense) (971) (1,236) (885) 265 21.4
Net income from investments 1,095 68 (380) 1,027 ..
Profit (loss) before income taxes 10,107 6,844 892 3,263 47.7
Income taxes (5,970) (3,467) (1,936) (2,503) (72.2)
Tax rate (%) 59.1 50.7 217.0 8.4
Net profit (loss) - continuing operations 4,137 3,377 (1,044) 760 22.5
Net profit (loss) - discontinued operations (413)
Net profit (loss) 4,137 3,377 (1,457) 760 22.5
attributable to:
- Eni's shareholders 4,126 3,374 (1,464) 752 22.3
- continuing operations 4,126 3,374 (1,051) 752 22.3
- discontinued operations (413)
- Non-controlling interest 11 3 7 8 ..
- continuing operations 11 3 7 8 ..
- discontinued operations
(€ million) 2018 2017 2016 Change % Ch.Operating profit (loss) 9,983 8,012 2,157 1,971 24.6
Exclusion of inventory holding (gains) losses 96 (219) (175)
Exclusion of special items 1,161 (1,990) 333
Adjusted operating profit (loss) 11,240 5,803 2,315 5,437 93.7
of which:
- Exploration & Production 10,850 5,173 2,494 5,677 109.7
- Gas & Power 543 214 (390) 329 153.7
- Refining & Marketing and Chemicals 380 991 583 (611) (61.7)
Net profit (loss) attributable to Eni's shareholders 4,126 3,374 (1,051) 752 22.3
Exclusion of inventory holding (gains) losses 69 (156) (120)
Exclusion of special items 388 (839) 831Adjusted net profit (loss) attributable to Eni's shareholders 4,583 2,379 (340) 2,204 92.6
Tax rate (%) 56.2 56.8 120.6
Adjusted operating profit and adjusted net profit are determined by excluding inventory holding gains or losses and extraordinary and non-recurring gains and losses (special items). In 2018, special items were a net negative of €388 million in net profit and of €1,161 million in operating profit.Furthermore, an inventory holding loss of €69 million (€96 million pre-tax) was recorded due to declining crude oil and products prices at end of the year reflected in the alignment of inventories at their net realizable values.The Group underlying performance – i.e. net of the effect of special gains and losses and the inventory holding loss – resulted in adjusted net profit for the year of €4,583 million compared to €2,379 million
in 2017, and in adjusted operating profit of €11,240 million compared to €5,803 million in 2017, almost doubling y-o-y, up by €5.44 billion. The increase in adjusted operating profit was driven by higher results in the E&P segment which doubled its operating profit at €10,850 million, up by €5.68 billion, and by a recover in profitability at the G&P segment with a €0.33 billion gain. Price and margin effects accounted for €4 billion, while improvements in the underlying performance driven by production growth and a better volume mix in the E&P segment accounted for €1.4 billion.
For further information on business segment results see the section “Business review” of this report.

ENI IN 2018 | FINANCIAL REVIEW | GROUP RESULTS FOR THE YEAR ENI IN 2018 | FINANCIAL REVIEW | GROUP RESULTS FOR THE YEAR 18
Net profit includes special items consist of net charges of €388 million, relating to the following:(i) net impairment losses of certain E&P assets resulting an
overall effect of €726 million driven by a lower-than-expected performance at certain fields as well as in order to align them with the fair-value of selling price;
(ii) an impairment reversal at certain transportation activities outside Italy due to the reduction of the country risk premium factored in the discount rate (€66 million);
(iii) the reinstatement of correlation amounting €375 million between hydrocarbon production and reserve depletion by accruing the underlying UOP-based amortization charges of Eni Norge subsidiary classified as held for sale in accordance to IFRS 5 due to the pending business combination with Point Resources;
(iv) impairment losses (€193 million) mainly regarding the write-down of capital expenditure relating to certain Cash Generating Units in the R&M business, which were impaired in previous reporting periods and continued to lack any profitability prospects;
(v) a charge taken in connection with the outcome of an arbitration proceeding relating a long-term contract to purchase regasification services, which resulted in the termination of
BREAKDOWN OF SPECIAL ITEMS
(€ million) 2018 2017 2016Inventory holding (gains) losses 96 (219) (175)
Special items 1,161 (1,990) 333
- environmental charges 325 208 193
- impairment losses (impairments reversal), net 866 (221) (459)
- impairment of exploration projects 7
- net gains on disposal of assets (452) (3,283) (10)
- risk provisions 380 448 151
- provision for redundancy incentives 155 49 47
- commodity derivatives (133) 146 (427)
- exchange rate differences and derivatives 107 (248) (19)
- reinstatement of Eni Norge amortization charges (375)
- other 288 911 850
Special items of operating profit (loss) 1,257 (2,209) 158
Net finance (income) expense (85) 502 166
of which:
- exchange rate differences and derivatives reclassified to operating profit (loss) (107) 248 19
Net income (expense) from investments (798) 372 817
of which:
- gains on disposal of assets (909) (163) (57)
- impairments / revaluation of equity investments 67 537 896
Income taxes 110 277 (72)
of which:
- net impairment of deferred tax assets of Italian subsidiaries 99 170
- net impairment of deferred tax assets of upstream business outside Italy 6
- USA tax reform 115
- taxes on special items of operating profit (outside Italy) and other special items 11 162 (248)
Total special items of net profit (loss) 484 (1,058) 1,069
the contract and of the related annual fees charged to Eni. It also awarded the counterparty equitable compensation of €289 million (plus financial interests of €24 million);
(vi) valuation allowance for doubtful accounts in connection with cost recovery in E&P segment to align the recoverable amount (€158 million);
(vii) a gain recorded on the disposal of a 10% interest in the Shorouk and Nour concessions, offshore Egypt (€339 million net of assignment bonus and other charges);
(viii) provision for redundancy incentives (€155 million); (ix) environmental provisions (€325 million) mainly relating to
R&M and Chemicals and E&P segments;(x) the effects of fair-valued commodity derivatives that lacked
the formal criteria to be accounted as hedges under IFRS (net gains of €133 million);
(xi) exchange rate differences and derivatives reclassified to operating profit (net gain of €107 million) mainly referred to G&P segment, related to derivative financial instruments used to manage margin exposure to foreign currency exchange rate movements and exchange translation differences of commercial payables and receivables;
(xii) the gain on the business combination involving Eni Norge and Point Resources, fully-owned by Eni and HitecVision

ENI IN 2018 | FINANCIAL REVIEW | GROUP RESULTS FOR THE YEAR ENI IN 2018 | FINANCIAL REVIEW | GROUP RESULTS FOR THE YEAR 19
CAPITAL EXPENDITURE BY SEGMENT
respectively, which led to the creation of the equity-accounted joint venture Var Energi, jointly controlled by Eni (69.6%) and HitecVision, with a gain of approximately €890 million as difference between the fair value of Eni’s interest in the venture and the book value of disposed net assets;
(xiii) an impairment reversal (€262 million) at the Angola LNG equity-accounted entity due to improved project economics;
(xiv) the impairment of an equity accounted upstream investment (approximately €200 million) due to the de-booking of undeveloped reserves at a certain project driven by a deteriorating operational local environment;
(xv) Eni’s interest of extraordinary charges/impairment losses recognized by the Saipem joint venture (€154 million);
(xvi) tax effects relating to operating special items, as well as the write-down of deferred taxes relating to Italian subsidiaries due to a deteriorated profitability outlook (€99 million).
SOURCES AND USES OF CASH
Cash flow from operating activities amounted to €13,647 million for the full year of 2018 and was up by 35% y-o-y, driven by an improved underlying performance and scenario effects. Adjusted net cash flow from operating activities before changes in working capital at replacement cost was €12,662 million, up by 37%
from 2017. This adjusted measure is derived by excluding certain non-recurring charges: an expense recognized in connection with the final outcome of an arbitration proceeding (€313 million), an extraordinary allowance for doubtful accounts in the E&P segment (€158 million) and an expense related to the sale of a 10% interest in the Zohr project due to the fact that they related to the asset disposals.At a Brent price of 71 $/barrel in 2018, adjusted cash flow from operations amounted to approximately €13.45 billion and positive changes in receivables and payables associated with investing activities (mainly including the cash-in of the deferred price of the Zohr disposals made in 2017) amounted to €0.9 billion. Those inflows funded capex of €7.94 billion and the dividend of €2.95 billion, leaving a surplus of around €3.5 billion. Consequently, on the basis of the Group’s cash flow sensitivity to the Brent scenario which assumes a change of approximately €0.19 billion in cash flow for each one-US dollar change in the Brent price (and vice versa), the cash neutrality for funding full year capex and the floor dividend would have been achieved at 52 $/barrel. This is re-determined in 55 $/barrel when excluding from cash inflows the deferred tranches of the consideration on the disposal of Eni’s interests in Zohr made in 2017 (€450 million), being these the unique non-organic components of the cash flow.Net borrowings at December 31, 2018 was €8,289 million, down by €2,627 million as of December 31, 2017. Gearing was 0.14, the lower end of the European peer group and leverage reduced to 0.16, down from 0.23 as of December 31, 2017.
(€ million) 2018 2017 2016 Change % Ch.Exploration & Production 7,901 7,739 8,254 162 2.1
- acquisition of proved and unproved properties 869 5 2 864 ..
- exploration 463 442 417 21 4.8
- development 6,506 7,236 7,770 (730) (10.1)
- other expenditure 63 56 65 7 12.5
Gas & Power 215 142 120 73 51.4
Refining & Marketing and Chemicals 877 729 664 148 20.3
- Refining & Marketing 726 526 421 200 38.0
- Chemicals 151 203 243 (52) (25.6)
Corporate and other activities 143 87 55 56 64.4
Impact of unrealized intragroup profit elimination (17) (16) 87
Capital expenditure 9,119 8,681 9,180 438 5.0
In the full year of 2018, capital expenditure amounted to €9,119 million (€8,681 million in the FY 2017) and mainly related to:- development activities (€6,506 million) deployed mainly in
Egypt, Ghana, Norway, Libya, Italy, Nigeria, Congo and Iraq. The acquisition of proved and unproved reserves of €869 million relates to the entry bonus in two producing Concession Agreements and the offshore concession of Ghasha in the United Arab Emirates;
- refining activity in Italy and outside Italy (€587 million) mainly
aimed at reconstruction works of the EST conversion plant at the Sannazzaro refinery, reconversion of Gela refinery into a biorefinery, maintain plants’ integrity as well as initiatives in the field of health, security and environment; marketing activity, mainly regulation compliance and stay in business initiatives in the retail network of refining product in Italy and in the rest of Europe (€139 million);
- initiatives relating to gas marketing (€161 million) and power business (€46 million).

ENI IN 2018 | FINANCIAL REVIEW | GROUP RESULTS FOR THE YEAR ENI IN 2018 | FINANCIAL REVIEW | GROUP RESULTS FOR THE YEAR 20
The Summarized Group Balance Sheet aggregates the amount of assets and liabilities derived from the statutory balance sheet in accordance with functional criteria which consider the enterprise conventionally divided into the three fundamental areas focusing on resource investments, operations and financing. Management believes that this summarized group balance sheet is useful
information in assisting investors to assess Eni’s capital structure and to analyse its sources of funds and investments in fixed assets and working capital. Management uses the summarized group balance sheet to calculate key ratios such as the return on invested capital (ROACE), gearing and leverage.
SUMMARIZED GROUP BALANCE SHEET
(€ million) December 31, 2018 December 31, 2017 Change Fixed assets
Property, plant and equipment 60,302 63,158 (2,856)
Inventories - Compulsory stock 1,217 1,283 (66)
Intangible assets 3,170 2,925 245
Equity-accounted investments and other investments 7,963 3,730 4,233
Receivables and securities held for operating purposes 1,314 1,698 (384)
Net payables related to capital expenditure (2,399) (1,379) (1,020)
71,567 71,415 152
Net working capital
Inventories 4,651 4,621 30
Trade receivables 9,520 10,182 (662)
Trade payables (11,645) (10,890) (755)
Tax payables and provisions for net deferred tax liabilities (1,104) (2,387) 1,283
Provisions (11,886) (13,447) 1,561
Other current assets and liabilities (860) 287 (1,147)
(11,324) (11,634) 310
Provisions for employee post-retirement benefits (1,117) (1,022) (95)
Assets held for sale including related liabilities 236 236
CAPITAL EMPLOYED, NET 59,362 58,995 367
Eni shareholders' equity 51,016 48,030 2,986
Non-controlling interest 57 49 8
Shareholders’ equity 51,073 48,079 2,994
Net borrowings 8,289 10,916 (2,627)
TOTAL LIABILITIES AND SHAREHOLDERS' EQUITY 59,362 58,995 367
The Summarized Group Balance Sheet was affected by the movement in the EUR/USD exchange rate, which determined an increase in net capital employed, total equity and net borrowings by €2,107 million, €1,787 million, and €320 million respectively. This was due to translation into euros of the financial statements of US-denominated subsidiaries reflecting a 4.5% appreciation of the US dollar against the euro (1 EUR = 1.146 USD at December 31, 2018 compared to 1.200 at December 31, 2017).
Fixed assets (€71,567 million) increased by €152 million from December 31, 2017. The item “Property, plant and equipment” was down by €2,856 million mainly due to the derecognition of Eni Norge’s assets following loss of control over the subsidiary as a result of the business combination with Point Resources which had an offsetting impact in the line-item “Equity-accounted investments and other investments” mainly due to the recognition of Var Energi interest; while DD&A and impairment
losses (€7,854 million) and the disposals were substantially offset by capital expenditure for the year (€9,119 million). The increase in the item “Equity-accounted investments and other investments” of €4,233 million was due to the above mentioned Var Energi operation, the new accounting of equity instruments required by IFRS 9 and the net equity investments. Net payables related to capital expenditure increased by €1,020 billion due to the cash-in of the receivables arising from the disposal of the Zohr interests made in 2017.
Net working capital was in negative territory at minus €11,324 million and increased by €310 million y-o-y driven by the decrease in risk provisions due to the change of the estimate revision to the decommissioning provision following higher discount rates and to tax payables and provision for deferred taxes due to the derecognition of Eni Norge, offset by a reduction in trade receivables and an increase in trade payables.

ENI IN 2018 | FINANCIAL REVIEW | GROUP RESULTS FOR THE YEAR ENI IN 2018 | FINANCIAL REVIEW | GROUP RESULTS FOR THE YEAR 21
LEVERAGE AND NET BORROWINGS
Eni evaluates its financial condition by reference to net borrowings, which is calculated as total finance debt less: cash, cash equivalents and certain very liquid investments not related to operations, including among others non operating financing receivables and securities not related to operations. Non-operating financing receivables consist of amounts due to Eni’s financing subsidiaries from banks and other financing institutions and amounts due to other subsidiaries from banks for investing purposes and deposits in escrow. Securities not related to operations consist primarily of government and corporate securities.Leverage is a measure used by management to assess the
Company’s level of indebtedness. It is calculated as a ratio of net borrowings which is calculated by excluding cash and cash equivalents and certain very liquid assets from financial debt to shareholders’ equity, including non-controlling interest. Management periodically reviews leverage in order to assess the soundness and efficiency of the Group balance sheet in terms of optimal mix between net borrowings and net equity, and to carry out benchmark analysis with industry standards.Gearing is calculated as the ratio between net borrowings and capital employed net and measures how much of capital employed net is financed recurring to third-party funding.
(€ million) December 31, 2018 December 31, 2017 ChangeTotal debt: 25,865 24,707 1,158
Short-term debt 5,783 4,528 1,255
Long-term debt 20,082 20,179 (97)
Cash and cash equivalents (10,836) (7,363) (3,473)
Securities held for trading and other securities held for non-operating purposes (6,552) (6,219) (333)
Financing receivables for non-operating purposes (188) (209) 21
Net borrowings 8,289 10,916 (2,627)
Shareholders' equity including non-controlling interest 51,073 48,079 2,994
Leverage 0.16 0.23 (0.07)
Gearing 0.14 0.18 (0.04)
Net borrowings at December 31, 2018 was €8,289 million, lower by €2,627 million from 2017. Total debt of €25,865 million consisted of €5,783 million of short-term debt (including the portion of long-term debt due within twelve months of €3,601 million) and €20,082 million of long-term debt. This reduction was driven by net cash flow from operations and the finalization of portfolio transactions as part of the Dual Exploration Model and other minor assets.As of December 31, 2018, the ratio of net borrowings to shareholders’ equity – including non-controlling interest
leverage – was 0.16, reporting a decrease from 0.23 as of the end of 2017. This decline was driven by lower net borrowing and by the increase in the Group total equity of €2,994 million from December 31, 2017. This was due to the positive foreign currency translation differences (€1,787 million) and profit for the year, partly offset by dividend distribution to Eni’s shareholders (2017 balance dividend and 2018 interim dividend of €2,953 million).As of December 31, 2018, gearing – the ratio of net borrowings to net capital employed – was 0.14, lower than 0.18 at December 31, 2017.

ENI IN 2018 | FINANCIAL REVIEW | GROUP RESULTS FOR THE YEAR ENI IN 2018 | FINANCIAL REVIEW | GROUP RESULTS FOR THE YEAR 22
Eni’s Summarized Group cash flow represents the link existing between changes in cash and cash equivalents (deriving from the statutory cash flows statement) and in net borrowings (deriving from the summarized cash flow statement) that occurred from the beginning of the period to the end of period. Free cash flow is the cash in excess of capital expenditure needs. Starting from free cash flow it is possible to determine either: (i) changes in cash and cash equivalents for the period by adding/deducting cash flows relating to financing debts/
receivables (issuance/repayment of debt and receivables related to financing activities), shareholders’ equity (dividends paid, net repurchase of own shares, capital issuance) and the effect of changes in consolidation and of exchange rate differences; (ii) changes in net borrowings for the period by adding/deducting cash flows relating to shareholders’ equity and the effect of changes in consolidation and of exchange rate differences.
SUMMARIZED GROUP CASH FLOW STATEMENT AND CHANGE IN NET BORROWINGS
(€ million) 2018 2017 2016Net profit (loss) 4,137 3,377 (1,044)Adjustments to reconcile net profit (loss) to net cash provided by operating activities:
- depreciation, depletion and amortization and other non monetary items 7,657 8,720 7,773
- net gains on disposal of assets (474) (3,446) (48)
- dividends, interests, taxes and other changes 6,168 3,650 2,229
Changes in working capital related to operations 1,632 1,440 2,112
Dividends received, taxes paid, interests (paid) received during the period (5,473) (3,624) (3,349)
Net cash provided by operating activities 13,647 10,117 7,673
Capital expenditure (9,119) (8,681) (9,180)
Investments and purchase of consolidated subsidiaries and businesses (244) (510) (1,164)
Disposals 1,242 5,455 1,054
Other cash flow related to capital expenditure, investments and disposals 942 (373) 465
Free cash flow 6,468 6,008 (1,152)
Borrowings (repayment) of debt related to financing activities (357) 341 5,271
Changes in short and long-term financial debt 320 (1,712) (766)
Dividends paid and changes in non-controlling interests and reserves (2,957) (2,883) (2,885)
Effect of changes in consolidation, exchange differences and cash 18 (65) (3)
NET CASH FLOW 3,492 1,689 465
CHANGE IN NET BORROWINGS (€ million)
Free cash flow 6,468 6,008 (1,152)
Net borrowings of acquired companies (18)
Net borrowings of divested companies (499) 261 5,848
Exchange differences on net borrowings and other changes (367) 474 284
Dividends paid and changes in non-controlling interest and reserves (2,957) (2,883) (2,885)
CHANGE IN NET BORROWINGS 2,627 3,860 2,095

SUPPLEMENTARY INFORMATION

1) Appointed by the Ordinary Shareholders’ Meeting held on April 13, 2017 for a three year period.9 members, 7 independents, 1 executive Director; Chairman non-executive and independent pursuant to law.The term of office expires with the Shareholders' Meeting approving the Financial Statements for the year end in December 31st, 2019.
FromtheslatesubmittedbytheMinistryoftheEconomyandFinance.Fromtheminorityslate.
SustainabilityandScenarios CommitteeNominationCommittee RemunerationCommittee ControlandRiskCommittee
ENI'S BOARD OF DIRECTORS1
(left to right)
Remuneration Committee Chairman
Nomination Committee
Control and Risk Committee
Andrea Gemma
Sustainability and Scenarios Committee
Nomination Committee
Fabrizio Pagani
Nomination Committee Chairman
Control and Risk Committee
Remuneration Committee
Diva Moriani
Control and Risk Committee Chairman
Remuneration Committee
Alessandro Lorenzi
Chairman
Emma Marcegaglia
Sustainability and Scenarios Committee Chairman
RemunerationCommittee
Pietro A. Guindani
Chief Executive Officer
Claudio Descalzi
Sustainability and Scenarios Committee
Nomination Committee
Domenico L. Trombone
Sustainability and Scenarios Committee
Control and RiskCommittee
Karina A. Litvack
DIRECTORS AND OFFICERS

ENI IN 2018 | SUPPLEMENTARY INFORMATION | DIRECTORS AND OFFICERS 25
(a) Appointed on April 16, 2019.
BOARD OF STATUTORY AUDITORS
GROUP OFFICERS
Chairman Rosalba Casiraghi
Statutory Auditors Enrico Maria Bignami Paola Camagni Andrea Parolini Marco Seracini
Alternate Auditors Stefania Bettoni Claudia Mezzabotta
M. BardazziExternal
Communication
L. FranceschiniIntegrated
Compliance
J. TrevisanIntegrated Risk
Management
M. BolliniCommercial
Negotiations
L. LusurielloChief Digital
O�cer
L. PistelliInternational
A�airs
S. SperoniLegal A�airs
R. UlissiCorporate A�airs
& Governance
R. UlissiBoard Secretary
and CorporateGovernance Counsel
A. PulitiChief Development,
Operations & Technology
O�cer
L. CosentinoEnergy Solutions
A. VellaChief Upstream
O�cer
C. Signoretto(a)
Chief Gas & LNGMarketing and Power
O�cer
G. RicciChief Re�ning & Marketing
O�cer
A. ChiariniChief Executive
O�cer Eni gas e luce SpA
D. FerrariChief Executive
O�cer Versalis SpA
P. Grossi(a)
Chief ExecutiveO�cer
Syndial SpA
M. MondazziChief Financial
O�cer
C. GranataChief Services & Stakeholder
Relations O�cer
L. BertelliChief
ExplorationO�cer
M. Petracchini Internal AuditC. Descalzi
(Chief Executive O�cer)
E. Marcegaglia(Chairman of the Board)

ENI IN 2018 | SUPPLEMENTARY INFORMATION | REMUNERATION 26
REMUNERATION2
The Eni Remuneration Policy is approved by the Board of Directors, following a proposal by the Remuneration Committee, which is entirely made up of Non-Executive and Independent Directors. It is defined in accordance with the corporate governance model adopted by the Company as well as with the recommendations of the Italian Corporate Governance Code.This policy is aimed at ensuring the alignment of management interests with the primary goal of creating value for shareholders over the medium to long term.Eni’s Remuneration Policy contributes to achieving the Company’s mission and strategies, by: - promoting actions and behaviours reflecting the Company’s
values and culture, consistent with the principles of plurality, equal opportunity, enhancement of individuals’ knowledge and skills, nondiscrimination, fairness and integrity, as described in the Code of Ethics and Eni Policy “Our people”;
The table below reports the remuneration paid to the Chairman of the Board of Directors, the Chief Executive Officer and General Manager and, in aggregate form, Managers with strategic responsibilities.
- recognising roles and responsibilities assigned, results, and the quality of professional contribution, taking into account the operating environment and relevant market references;
- defining incentive structures that are tied to the sustainable long-term achievement of financial, business development, operational and individual objectives, consistent with the Company’s Strategic Plan and the responsibilities assigned.
With regard to sustainability issues, the CEO objectives set for the year 2019 are focused on environmental matters as well as on human capital aspects.The objectives of the Chief Officers of Eni business segments and other Managers with strategic responsibilities are assigned on the basis of those assigned to top management focused on stakeholders’ perspectives, as well as on individual objectives assigned in relation to the responsibilities inherent the single managerial position, under the provisions of Company’s Strategic Plan.
REMUNERATION PAID IN 2018The remuneration received from subsidiaries and/or associates, except that waived or paid to the company, are shown separately.
2018 TARGETS FOR THE 2019 SHORT-TERM INCENTIVE PLAN WITH DEFERRAL
ECONOMIC AND FINANCIAL RESULTS(25%)
INDICATORSEarning Before Tax (12.5%)Free Cash Flow (12.5%)
LEVERSUpstream expansion Strengthen Gas & Power operationsResilience in downstream Green business
INDICATORSHydrocarbon production (12.5%)Exploration resources (12.5%)
LEVERSFast track approachExpanding exploration acreage Diversi�cation
OPERATING RESULTS AND SUSTAINABILITY OF ECONOMICRESULTS (25%)
OPERATING RESULTS AND SUSTAINABILITY OF ECONOMICRESULTS (25%)
ENVIRONMENTAL SUSTAINABILITY AND HUMAN CAPITAL (25%)
INDICATORSCO2 emissions (12.5%)Severity Incident Rate (12.5%)
LEVERSDecarbonization HSE and sustainability
EFFICIENCY AND FINANCIAL STRENGTH (25%)
INDICATORSROACE adjusted (12.5%)Net Debt/EBITDA adjusted (12.5%)
LEVERSFinancial disciplineE�ciency of operating costs and G&A Optimisation of working capital
2) For detailed information on Eni's remuneration policy and compensation see the "Remuneration Report 2019" available on Eni's website under the sections "Governance" and "Investors relations".
The 2019 Remuneration Policy does not contain changes compared with the structure of the policy approved in 2018, in line with the policy approved for the 2017-2020 term, and is characterised by the adoption of a new, simpler variable incentive system, based on:
- a Short-Term Incentive Plan, featuring a three-year deferral mechanism applicable to a portion of accrued bonuses and subject to specific performance conditions over a three-year
term, this is to ensure the medium-term ustainability of results achieved in the short term;
- a Long-Term Share-based Incentive Plan, offered to managers with the greatest influence on business performance and aimed at achieving medium-to-Long-Term objectives consistent with the Strategic Plan and the expectations of shareholders, as measured by comparison with the performance achieved by a defined Peer Group.
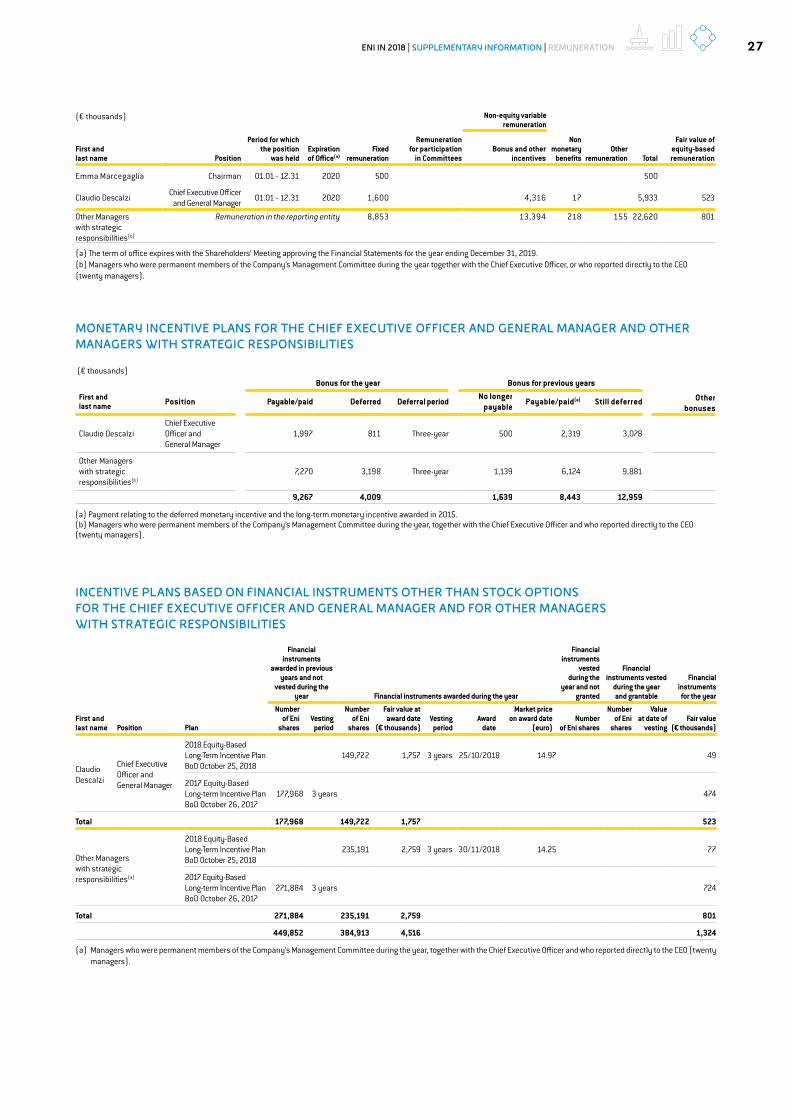
ENI IN 2018 | SUPPLEMENTARY INFORMATION | REMUNERATION 27
(€ thousands)Bonus for the year Bonus for previous years
First and last name Position Payable/paid Deferred Deferral period No longer
payable Payable/paid(a) Still deferred Other bonuses
Claudio DescalziChief Executive Officer and General Manager
1,997 811 Three-year 500 2,319 3,078
Other Managers with strategic responsibilities(b)
7,270 3,198 Three-year 1,139 6,124 9,881
9,267 4,009 1,639 8,443 12,959
(a) Payment relating to the deferred monetary incentive and the long-term monetary incentive awarded in 2015.(b) Managers who were permanent members of the Company’s Management Committee during the year, together with the Chief Executive Officer and who reported directly to the CEO (twenty managers).
MONETARY INCENTIVE PLANS FOR THE CHIEF EXECUTIVE OFFICER AND GENERAL MANAGER AND OTHER MANAGERS WITH STRATEGIC RESPONSIBILITIES
(€ thousands) Non-equity variable remuneration
First and last name Position
Period for whichthe position
was heldExpiration of Office(a)
Fixedremuneration
Remunerationfor participation
in CommitteesBonus and other
incentives
Non monetary
benefitsOther
remuneration Total
Fair value of equity-based remuneration
Emma Marcegaglia Chairman 01.01 - 12.31 2020 500 500
Claudio Descalzi Chief Executive Officer and General Manager 01.01 - 12.31 2020 1,600 4,316 17 5,933 523
Other Managers with strategic responsibilities(b)
Remuneration in the reporting entity 8,853 13,394 218 155 22,620 801
(a) The term of office expires with the Shareholders’ Meeting approving the Financial Statements for the year ending December 31, 2019.(b) Managers who were permanent members of the Company’s Management Committee during the year together with the Chief Executive Officer, or who reported directly to the CEO (twenty managers).
INCENTIVE PLANS BASED ON FINANCIAL INSTRUMENTS OTHER THAN STOCK OPTIONS FOR THE CHIEF EXECUTIVE OFFICER AND GENERAL MANAGER AND FOR OTHER MANAGERS WITH STRATEGIC RESPONSIBILITIES
Financial instruments
awarded in previous years and not
vested during the year Financial instruments awarded during the year
Financial instruments
vested during the
year and not granted
Financial instruments vested
during the year and grantable
Financial instruments for the year
First and last name Position Plan
Number of Eni
sharesVesting
period
Number of Eni
shares
Fair value at award date
(€ thousands)Vesting
periodAward
date
Market price on award date
(euro)Number
of Eni shares
Number of Eni
shares
Value at date of
vestingFair value
(€ thousands)
Claudio Descalzi
Chief Executive Officer and General Manager
2018 Equity-Based Long-Term Incentive Plan BoD October 25, 2018
149,722 1,757 3 years 25/10/2018 14.97 49
2017 Equity-BasedLong-term Incentive PlanBoD October 26, 2017
177,968 3 years 474
Total 177,968 149,722 1,757 523
Other Managerswith strategic responsibilities(a)
2018 Equity-Based Long-Term Incentive PlanBoD October 25, 2018
235,191 2,759 3 years 30/11/2018 14.25 77
2017 Equity-Based Long-term Incentive PlanBoD October 26, 2017
271,884 3 years 724
Total 271,884 235,191 2,759 801
449,852 384,913 4,516 1,324
(a) Managers who were permanent members of the Company’s Management Committee during the year, together with the Chief Executive Officer and who reported directly to the CEO (twenty managers).

ENI IN 2018 | SUPPLEMENTARY INFORMATION | REMUNERATION ENI IN 2018 | SUPPLEMENTARY INFORMATION | INVESTOR INFORMATION28
In 2012-2018, Eni delivered a Total Shareholder Return of 14.5%, compared with 5.1 in the Peer Group3, while the FTSE Mib index produced a TSR of 34.1% compared with an average 68.8% for the peer companies’ respective benchmark Stock market indices4.Total remuneration for Eni’s Chief Executive Officer and General
(Eni vs. Peer Group and Reference Stock Market Indices)
2015 2016201420132012
-20%
0%
20%
40%
60%
80%
2017 2018
TSR Eni (%)TSR FTSE MIB (%)
TSR - Peer Group AvgTSR - Peers stock exchange index Avg
68.8
34.1
14.55.1
Total Shareholder Return(Eni TSR vs. CEO/GM total remuneration for 2012-2018) Pay for performance analysis
TSR Eni (%) CEO/GM Total remuneration (/,000 €)
2 012
6,397
4,555
2 013
4,092
2 014
3,498
2 015
3,779
2 016
4,420
2 017 2 018
5,933
14.5
3) The Peer Group consists of ExxonMobil, Chevron, BP, Royal Duch Shell, Total, ConocoPhillips, Equinor (ex Statoil), Apache, Marathon Oil and Anadarko.4) Benchmark indices: Standard&Poors 500, Cac 40, FTSE 100, AEX, OBX.
TARGET MAXIMUM TARGET
CEO/GM Pay mix Pay mix Managers with strategic responsibilities (MSR)
Fixed Remuneration
Short-Term Variable Component
Long-Term Variable Component50%
30%
19%
53%
28%26%30%
40%24%
Remuneration of persons responsible of key positions in planning, direction and control functions of Eni Group companies, including executive and non-executive Directors, Chief Operating Officers and other managers with strategic responsibilities in charge at December 31, 2018, amounted to €39 million, as described in the following table:
(€ million)
Wages and salaries 27
Post-employment benefits 2
Other long-term benefits 10
TOTAL 39
OVERALL REMUNERATION OF KEY MANAGEMENT PERSONNEL
PERFORMANCE AND REMUNERATION
PAY MIXThe remuneration package for the Chief Executive Officer and General Manager includes a fixed component, a short-term variable component and a long-term variable component, which comprises a short-term incentive deferral and long-term share incentive determined
using internationally recognized methodologies for remuneration benchmarks. The pay mix, calculated by considering fixed remuneration as the base, is weighted significantly towards the variable components, with a dominant weighting attributed to the long-term component.
Manager for the 2017-2020 term was set taking account of the termination of the restrictions on reducing remuneration applied for the 2014-2017 term (-25% on the maximum potential financial benefit) and working to balance the pay mix with a greater focus on long-term variable components (53% vs. 46%).

29ENI IN 2018 | SUPPLEMENTARY INFORMATION | REMUNERATION ENI IN 2018 | SUPPLEMENTARY INFORMATION | INVESTOR INFORMATION
In accordance with Article 5 of the By-laws, the Company's share capital amounts to €4,005,358,876.00, fully-paid, and is represented by 3,634,185,330 ordinary registered shares without indication of par value.In the last session of 2018, Eni share price, quoted on the Italian Stock Exchange, was €13.75, down by 0.4% from the price quoted at the end of 2017 (€13.80). The Italian Stock Exchange is the primary market where Eni share is traded. During the year, FTSE/MIB index, the basket including the 40 most important shares listed on the Italian Stock Exchange, decreased by 16.1 percentage points.
At the end of 2018, Eni ADR listed on the NYSE was $31.50, down by 5.1% compared to the price registered in the last session of 2017 ($33.19). One ADR is equal to two Eni ordinary shares. In the same period the S&P 500 index decreased by 6.2 percentage points. Eni market capitalization at the end of 2018 was €50 billion (unchanged compared to the end of 2017). Shares traded during the year totaled almost 3.3 billion, with a daily average of shares traded of 13 million (13.9 million in 2017). The total traded value of Eni shares amounted to approximately €49.6 billion (€50.2 billion in 2017), equal to a daily average of €197 million.
INVESTOR INFORMATION
2018 2017 2016Market quotations for common stock on the Mercato Telematico Azionario (MTA)
High (€) 16.76 15.72 15.47
Low 13.33 12.96 10.93
Average daily close 15.25 14.16 13.42
Year-end close 13.75 13.80 15.47
Market quotations for ADR on the New York Stock Exchange
High ($) 40.09 34.09 33.33
Low 30.00 29.54 25.00
Average daily close 35.98 31.98 29.74
Year-end close 31.50 33.19 32.24
Average daily traded volumes (million of shares) 12.99 13.89 18.41
Value of traded volumes (€ million) 197 197 246
20
8
10
12
14
16
18
30
40
50
Eni
EniSource: Eni calculations based on BLOOMBERG data.
Source: Eni calculations based on BLOOMBERG data.
Indexed FTSE MIB to Eni share price
Indexed S&P 500 to Eni ADR price
Indexed Euro Stoxx 50 to Eni share price
2016 2017 2018 M AY 6 , 2019
2016 2017 2018 M AY 6 , 2019
€
US $
Eni share price in Milan (December 31, 2015 - May 6, 2019)
Eni ADR price in New York (December 31, 2015 - May 6, 2019)
ENI SHARE PERFORMANCE IN 2018
SHARE INFORMATION

ENI IN 2018 | SUPPLEMENTARY INFORMATION | INVESTOR INFORMATION ENI IN 2018 | SUPPLEMENTARY INFORMATION | INVESTOR INFORMATION30
SUMMARY FINANCIAL DATA
2018 2017 2016Net profit (loss)
- per share(a) (€) 1.15 0.94 (0.29)
- per ADR(a)(b) ($) 2.72 2.12 (0.65)
Adjusted net profit (loss) - per share(a) (€) 1.27 0.66 (0.09)- per ADR(a)(b) ($) 3.00 1.49 (0.20)Cash flow - per share(a) (€) 3.79 2.81 2.13- per ADR(a)(b) ($) 8.95 6.35 4.72Adjusted Return on average capital employed (ROACE) (%) 8.5 4.7 0.2Leverage 16 23 28
Gearing 14 18 22
Coverage 10.3 6.5 2.4
Current ratio 1.4 1.5 1.4
Debt coverage 164.6 92.7 51.9
Net Debt/EBITDA adjusted 45.2 80.6 144.7
Dividend pertaining to the year (€ per share) 0.83 0.80 0.80
Total Share Return (TSR) (%) 4.8 (5.6) 19.2
Pay-out 72 85 (197)
Dividend yield (c) 5.9 5.7 5.4
(a) Fully diluted. Ratio of net profit (loss)/cash flow and average number of shares outstanding in the period. Dollar amounts are converted on the basis of the average EUR/USD exchange rate quoted by Reuters (WMR) for the period presented.(b) One American Depositary Receipt (ADR) is equal to two Eni ordinary shares. (c) Ratio of dividend for the period and the average price of Eni shares as recorded in December.
Med
ioba
nca
Cred
it S
uiss
e
Kepl
er C
heuv
reux
Banc
a IM
I
Gold
man
Sac
hs
Soci
été
Géné
rale
Bank
of A
mer
ica
Mer
rill L
ynch
HSB
C
Equi
ta Citi
Bern
stei
n
Oddo
Sec
urit
ies
Redb
urn
Je�e
ries
UBS
Banc
a Ak
ros
Fide
ntiis
Exan
e BN
P Pa
ribas
Bere
nber
g
RBC
Capi
tal M
arke
ts
Sant
ande
r
Inte
rmon
te
Deut
sche
Ban
k
Mac
quar
ie
Barc
lays
Cap
ital
Mor
gan
Stan
ley
JP M
orga
n
ENI SHARE PRICE €13.75
Buy
16
14
18
20
22
Eni ratings distribution as of December 31, 2018 (main analysts)
(€/share)
Hold
Sell 22%
67%11%

31ENI IN 2018 | SUPPLEMENTARY INFORMATION | INVESTOR INFORMATION ENI IN 2018 | SUPPLEMENTARY INFORMATION | INVESTOR INFORMATION
Shareholders distribution by geographic area(*) Class of shareholders(*)
(*) As of January 11, 2019. (*) As of January 11, 2019.
Rest of world
Italy
UK and Ireland
Retail investors
Public holding
Institutional shareholders
USA and Canada
Other
Treasury shares
Other
Rest of Europe
17.9%9.3%
1.7%
44.2%
7.8%
19.1%
0.8%11.1%
0.9%
30.1%
57.1%
0.801.10
2013
(a) Refer to: BP, Chevron, Repsol, ExxonMobil, Royal Dutch Shell and Total.
6.5
4.5 5.1
7.6 6.1
5.7
1.120.80 0.80 0.83
2016 2017 2018
0.86
201920152014
5.3
5.45.7 5.9
5.05.4
Eni’s dividend yield (%)
Dividend yield - average of Oil & Gas companies(a) (%)
Dividend (€/share)
Dividend per share
DIVIDENDS
Management intends to propose to the Annual Shareholders’ Meeting scheduled on May 14, 2019, the distribution of a dividend of €0.83 per share for fiscal year 2018, of which €0.42 was already paid as interim dividend in September 2018. Total cash outlay for the 2018 dividend is expected at approximately €2.99 billion (including €1.51 billion already paid in September 2018, relating to 2018 interim dividend) if the Annual Shareholders’ Meeting approves the annual dividend. In future years, management expects to continue paying interim dividends for each fiscal year, with the balance to the full-year dividend to be paid in each following year. Holders of ADRs receive their dividends in US dollars. The rate of exchange used to determine the amount in dollars is
equal to the official rate recorded on the date of dividend payment in Italy (May 22, 2019).On ADR payment date (June 6, 2019), Citibank N.A. pays the dividend less the amount of any withholding tax under Italian law (currently 26%) to all Depository Trust Company Participants, representing payment of Eni SpA’s gross dividend. By submitting to Citibank N.A. certain required documents with respect to each dividend payment, US holders of ADRs will enable the Italian Depositary bank and Citibank N.A. as ADR Depositary to pay the dividend at the reduced withholding tax rate of 15% US shareholders can obtain relevant documents as well as a complete instruction packet to benefit from this tax relief by contacting Citibank N.A. at +1-781-575-4555.
ENI IN 2018 | SUPPLEMENTARY INFORMATION | PUBLICATIONS 32
ANNUAL REPORT 2018 a comprehensive report on Eni’s activities and financial and sustainability results for the year. Includes the consolidated disclosure of non-financial information (NFI), prepared in accordance with Legislative Decree No. 254/2016, relating to environment, social, people, human rights and anti-corruption issues.
REMUNERATION REPORT 2019
a report on Eni’s compensation and remuneration policies pursuant to rule 123-ter of Legislative Decree
No. 58/1998.
CORPORATE GOVERNANCE REPORT 2018
a report on the Corporate Governance system adopted by Eni pursuant
to rule 123-bis of Legislative Decree No. 58/1998.
ENI FOR 2018a report that describes how Eni
creates value in the long term through the integrated business model
and pursues local development and the path to decarbonization through its model for operational excellence.
FACT BOOK 2018 a report on Eni’s businesses development and performancesincluding a full set of operating and financial statistics.
These and other Eni publications are available on Eni’s internet site eni.com, in the section Publicationshttp://www.eni.com/en_IT/documentation/documentation.page?type=bil-rapShareholders may receive a hard copy of Eni’s publications, free of charge, through an e-mail request addressedto the mailbox: [email protected].
FINANCIAL CALENDAR
The dates of the Board of Directors’ meetings to be held during 2019 in order to approve/review the Company’s quarterly, semi-annual and annual preliminary results are the following:
Results for the first quarter of 2019 April 24, 2019Results for the second quarter and the first half of 2019 and proposal of interim dividend for the financial year 2019
July 25, 2019
Results for the third quarter of 2019 October 25, 2019Preliminary full-year results for the year ending December 31, 2019 and dividend proposal for the financial year 2019
February 2020
A press release on quarterly results is disseminated to the market the following day, when management also hosts a conference call with financial analysts to review the Group performance.
ANNUAL REPORT ON FORM 20-F 2018 a comprehensive report on Eni’s activities and results required by the US Securities Exchange Act of 1934 and filed with the US Securities and Exchange Commission.
PUBLICATIONS

Printed on XPer Fedrigoni paper
Eni SpA
Registered OfficePiazzale Enrico Mattei, 1 - Rome - ItalyShare capital: € 4,005,358,876.00 fully paid-upBusiness Register of Rome, Taxpayer’s code 00484960588
Other BranchesVia Emilia, 1San Donato Milanese (MI) - Italy
Piazza Ezio Vanoni, 1San Donato Milanese (MI) - Italy
Page layout and supervisionK-Change - Rome - Italy
PrintVarigrafica Alto Lazio - Viterbo - Italy

S U M M A R Y A N N U A L R E P O R T
E N I I N 2 0 1 8
IN
*00232*