Annual Report 2014 - Eni Shareholders’ Meeting of April 27, 2015 Mission Versalis SpA a company...
109
versalis Annual Report 2014 Ordinary Shareholders’ Meeting of April 27, 2015
-
Upload
vuongtuyen -
Category
Documents
-
view
216 -
download
1
Transcript of Annual Report 2014 - Eni Shareholders’ Meeting of April 27, 2015 Mission Versalis SpA a company...

versalis
Annual Report 2014 Ordinary Shareholders’ Meeting of April 27, 2015

Mission Versalis SpA – a company wholly owned and controlled by Eni SpA and subject to its direction and coordination – manages the production and marketing of petrochemical products (basic chemicals, polyethylene, elastomers and styrenes) and the sale of licences relating to technologies and know-how.
Countries in which Versalis operates The Versalis Group1 is present in Italy (Brindisi, Ferrara, Mantua, Porto Marghera, Porto Torres, Priolo, Ragusa, Ravenna and Sarroch), France (Dunkirk), Germany (Oberhausen), Great Britain (Grangemouth, Hythe2), Hungary (Szàzhalombatta), with Research Centres and Units in Italy (Brindisi, Ferrara, Mantua, Novara and Ravenna), sales networks in Italy, Belgium, Czech Republic, Slovak Republic, Denmark, France, Germany, Great Britain, Greece, Poland, Slovenia, Romania, Spain, Sweden, Switzerland, Turkey, Hungary and China and a representative office in Russia.
Boards of Directors and of Statutory Auditors BOARD OF DIRECTORS(1) BOARD OF STATUTORY AUDITORS(2) Chairman Chairman Salvatore Sardo Carlo Invernizzi Chief Executive Officer Statutory auditors Daniele Ferrari Patrizia Ferrari(3) Alberto Luigi Gusmeroli
Directors Cristiana Argentino
Alternate statutory auditor Marco Mencagli
Davide Calabrò INDEPENDENT AUDITORS(4) Rosanna Fusco Reconta Ernst & Young SpA (1) Appointed by the Shareholders’ Meeting of April 23, 2013 for a three-year period which expires upon the approval of the financial statements for the year 2015. (2) Appointed by the Shareholders’ Meeting of April 23, 2013 for a three-year period which expires upon the approval of the financial statements for the year 2015.
(3) Took over as Statutory Auditor following the resignation of Elisabetta Corvi on January 14, 2015. (4) Appointed by the Shareholders’ Meeting of April 15, 2010 for a nine-year period which expires upon approval of the financial statements for the year 2018.
1 The Versalis Group represents the chemicals sector of Eni. 2 The elastomers plant in Hythe (United Kingdom) was shut down permanently in March 2014 and the site is being decommissioned.

Directors’ Report and Consolidated Financial Statements Directors’ Report on Operations
1 Highlights
4 Versalis Group Structure
Operating Review
6 Revenues and production
9 Investments
Financial Review - Versalis Group
11 Profit and Loss Account
17 Reclassified Balance Sheet
20 Reclassified Cash Flow Statement
23 Financial Review - Versalis SpA
32 Risk factors and uncertainties
35 Business outlook
36 Other information
38 Commitment to sustainable development
42 Technological innovation
43 Other compliance information
43 Administrative and Accounting separation of the electricity business
Consolidated Financial Statements
45 Consolidated Financial Statements
50 Notes to the Consolidated Financial Statements
105 Independent Auditors’ Report


Versalis / Directors’ Report on operations/ Highlights
Highlights
Workers’ safety
The Versalis Group’s commitment to workers’ safety has led to a further improvement in the accident frequency rate for 2014, which shows a reduction, compared to the previous year, of 51%. Moreover, during the year, seventeen out of eighteen sites achieved the target of one year without any employee accidents.
Green chemistry
As part of the New development plan for Gela, signed in November 2014 by eni and the Ministry of Economic Development, Versalis is currently undertaking a feasibility study for realizing a project aimed at producing latexes through organic raw materials while developing the related agricultural supply chain. In particular, an assessment will be made, involving the Region of Sicily, on the realization of a guayule agricultural chain (the shrub from which oils are extracted for use in the production of natural latexes).
In November 2014 eni, versalis and the Ministry of Economic Development also signed a memorandum of understanding to relaunch the Porto Marghera petrochemical plant with the goal of creating an integrated green chemistry technological hub. More particularly, as a result of the partnership agreed with the US chemical company Elevance Renewable Sciences in February 2014, new plants will be developed on the site. These plants will be the first of their kind in the world and will produce specialty chemicals for application in oil drilling and other widespread used products such as detergents and biolubricants.
Versalis and Solazyme Inc., a company producing bio products and oil from renewable sources, announced - yet again in November 2014 - the launch of a partnership aimed at expanding the marketing of Encapso™, the first encapsulated biodegradable lubricant for fluids used in the oil drilling industry. Encapso™ will be part of the “Specialty oilfield chemicals” product range. In particular, Versalis will promote the entry of Encapso™ on the market and its marketing on a global scale, initially encouraging the use of this lubricant in the oil and gas extraction sites operated by Eni.
In June 2014, the plants for the Green Chemistry project of Matrìca (the Versalis-Novamont joint venture) were started up, marking the reconversion of the Porto Torres petrochemical hub. The technological innovation used by the plants is able to transform vegetable oils into monomers and intermediates, basic components for the production of more complex bio products for different industrial sectors (tyres, bio lubricants, plastics, etc.). The production capacity of these plants is approximately 70 thousand metric tons/year and they will gradually move to fully operational status in 2015. The oil cracking plant has been shut down permanently.
Organizational and corporate restructuring in the EMEA area
The second stage of the project was completed in the first quarter of 2014. This involved completing the rationalization of Versalis’s organizational structures in the EMEA with the carve-out of the activities of staff from the companies Dunastyr, Polimeri Europa France, Polimeri Europa UK and Polimeri Europa GmbH, and their assignment to Versalis International. The carve-out for the first three companies took legal, accounting and fiscal effect as of January 1, 2014. The new branches of Versalis International in France, UK, Hungary, Romania, Czech Republic and Slovakia were thus established on this day. The carve-out of Versalis Deutschland GmbH’s (known before as Polimeri Europa GmbH) business unit was approved on March 31, 2014. The German and Swiss branches of Versalis International SA, therefore, became operational with legal effect as of April 1, 2014 and with accounting and fiscal effect as of January 1, 2014. On the other hand, the Austrian branch became operational with legal, accounting and fiscal effect as of April 1, 2014.
In line with Versalis’s new business strategy, aimed at creating a more market-oriented Group, from March 1, 2014 Polimeri Europa UK Ltd and Polimeri Europa France SAS adopted new company names, “Versalis UK Ltd” and “Versalis France SAS” respectively, and from March 7, 2014 Polimeri Europa GmbH adopted the new name “Versalis Deutschland”.
The Portuguese branch of Versalis International was closed on December 31, 2014 and all its assets were transferred to the Spanish branch as of January 1, 2015.
1

Versalis / Directors’ Report on operations/ Highlights
Extraordinary operations
The elastomer production plant in Hythe (UK) was shut down permanently in March 2014. This shutdown forms part of the measures for balancing production capacity in response to the new levels of demand that, combined with the new investments in the elastomers business, will enable the Versalis Group to improve its commercial and production structure.
On December 31, 2014, Versalis finalized the definitive agreement with Sarlux Srl (part of the Saras Group) for the divestment of the Sarroch site’s Aromatics business unit. The agreement establishes the purchase, by Sarlux, of Versalis’s assets already connected with the refinery’s production cycle and related services, which include the Reforming plant, the Propylene Splitter plant, the BTX plant and related services, including the logistics system. Versalis will continue to operate on the site, making the prescheduled environmental improvements, and implementing the safety measures related to the shutdown of production facilities not included in the agreement.
Technological innovation
In 2014, research and technology activities contributed to the strengthening and renewal of company businesses by constantly improving processes and products. Research and development activities in the green chemistry sector were strengthened with growing commitment. Furthermore, work continued on enhancing the value of the research activity via the sale of technology to third parties. The overall expenditure on Research and Development was €40 million. Fifteen patent applications were filed.
Production
Production amounted to 5,283 thousand metric tons, down by 9.2% compared with 2013. The greatest reductions concern aromatics and olefins, where the challenging competitive market for petrochemical products also led to the opportunistic shutdown of the Porto Marghera cracker plant and the sale of the Sarroch aromatics business unit. The final shutdown of the Hythe site resulted in lower production of elastomers. Production of polyethylene increased in the Brindisi and Oberhausen sites.
Results
Against the background of the continuing economic crisis, the Versalis Group recorded an increase of €74 million in adjusted operating income in 2014 compared to the previous year. The financial year ended with a net loss of €545 million (€286 million adjusted net of special items), a shareholders’ equity of €407 million, net capital employed of €2,941 million, net borrowings of €2,534 million and negative net cash flow from operating activities of €483 million.
The parent company Versalis SpA recorded a net loss of €594 million which, added to the losses from previous years totalling €552 million and compared with the fully paid-up capital of €1,553 million and negative reserves of €9 million, is in accordance (since 2013) with the limits stipulated in Article 2446 of the Italian Civil Code.
2

Versalis / Directors’ Report on operations/ Highlights
Financial highlights
2012 amounts in millions of euros 2013 20146,418 Net sales from operations 5,859 5,284(686) Operating loss (738) (702)(489) Adjusted operating loss (401) (327)(573) Net loss (625) (545)(426) Adjusted net loss (380) (286)(653) Net cash flow provided by operating activities (271) (483)
156 Capital expenditures 291 2743,805 Total assets 4,089 4,254
580 Shareholders' equity 952 4071,948 Net borrowings 1,664 2,5342,528 Net capital employed 2,616 2,9413.36 Leverage 1.75 6.23
Key operating and sustainability data
2012 2013 20145,724 Employees (number) 5,745 5,2580.75 Accident frequency rate (accidents/hours worked x 1,000,000) 0.57 0.283.69 Direct emission of greenhouse gases (millions of metric tons CO2 eq) 3.66 3.09
38 Cost of research and development (amount in millions of euros) 39 406,090 Production (thousands of metric tons) 5,817 5,283
67 Plant utilization rate (%) 64.6 71.3111.58 Average price of Brent Dated FOB (dollars/barrel) 108.60 98.99
910 Average price of Virgin Naphtha FOB Med (dollars/metric ton) 874 805
3

Versalis / Directors’ Report on Operations/ Group Structure
Versalis Group Structure
A chart of the Versalis Group is presented below. The companies are consolidated on a line-by-line basis. The percentage indicated refers to the interest held by the parent company.
Versalis SpA
Versalis Deutschland
(100%)
Dunastyr Polystyrene Manufacturing Co Ltd
(96,34%)1
Versalis France SAS
(100%)
Versalis International SA
(59%)2
Eni Chemicals Trading (Shanghai) Co Ltd
(100%)
Versalis Uk Ltd
(100%)
Versalis Pacific Trading (Shanghai) Co Ltd
(100%)
(1) I restanti soci sono Versalis International SA (1,83%) e Versalis Deutschland (1,83%).(2) I restanti soci sono Versalis Deutschland (23,71%), Dunastyr Polystyrene Manufacturing Co Ltd (14,43%), Versalis France SAS (2,86%).
(1) The remaining shareholders are Versalis International SA (1.83%) and Versalis Deutschland (1.83%) (2) The remaining shareholders are Versalis Deutschland (23.71%), Dunastyr Polystyrene Manufacturing Co Ltd (14.43%) and Versalis France SA (2.86%).
4

Versalis / Directors’ Report on operations/ Operating Review
Operating Review
Despite the general improvement in the global macroeconomic situation, with global GDP up by 3.3% over 2013, expectations of economic recovery in Europe during 2014 gradually diminished in the face of a gradual reduction of growth rates and a continuing recession in Italy.
The economic growth data in the Eurozone in 2014 has, nevertheless, shown an improvement, bringing GDP growth in the zone up to 0.8% compared to the contraction (-0.4%) of the previous year. This trend has benefited from the strengthening of US growth and the decline in commodity prices, with crude oil at its lowest since 2009, which more than offset the weakness of emerging countries and the slowdown in Chinese growth. Growth in global trade (3.1%) remained below GDP, but Eurozone countries were, however, able to benefit from the weakening of the euro, which made their products more competitive on world markets and conversely made imports more expensive.
Inflation has fallen sharply in the Eurozone reaching a negative value (-0.2%) by the end of the year. In the last quarter of the year, the ECB started buying issued securities in exchange for the securitization of bank credits, as well as guaranteed bank bonds. These operations, in addition to the targeted long-term refinancing actions, were intended to breathe new life into the credit market, which was slow to start in 2014.
The limited improvement in the European macroeconomic situation generated positive effects on the demand for many products belonging to the petrochemical chain. This, in addition to the rationalization of productions, contributed to the improvement in plant utilization rates at European level. Specific market factors then influenced the dynamics of the individual sectors suffering from overcapacity at global level, weighing heavily on the performances of Butadiene and Elastomers. After years of continued falls, the European demand for Polyethylene recorded a significant improvement (+5.0%), due both to increased world demand for transformers and the lower availability of imports caused by the increase in custom duties.
On the price side, the relative stability in the prices of petroleum feedstock during the first half of 2014 has given more leeway to producers to recover or stabilize margins on products, particularly on Crackers and Polyethylene. The collapse of crude oil prices during the last quarter, however, did not have a dramatic impact on demand, as happened in late 2008. The steady demand, combined with supply constraints, has allowed producers to sustain profit margins throughout the year.
The sustained recovery in the US, the stabilization of the Chinese economy and the low price of crude oil, together with the weakened euro, have created a solid foundation for expected growth in Europe for 2015. Signs of improvements have been clearly visible during the last quarter in Europe and also in Italy, despite the difference in growth for the latter.
Against this background, in 2014 the Versalis Group recorded a net loss for the period of €545 million (€625 million in 2013) and a lower adjusted operating loss of €327 million (€401 million in 2013), thanks to the improvement in margins for intermediates and polyethylene, despite the continuing weak demand for commodities caused by the economic scenario and competition from producers outside the EU, particularly in the first part of the year. The efficiency and restructuring measures aimed at improving business management also helped limit losses. These measures have focused not only on the optimization of the production and sales processes, but also on structural interventions to reduce production capacity in those businesses most susceptible to cost competition (Ethylene-Polyethylene). For this reason, the Porto Marghera activities were stopped, starting from February 2014, to reduce Ethylene overcapacity and allow better asset utilization. Furthermore, at the end of the year, the Sarroch Aromatics business unit, integrated with Sarlux refinery processing, was sold and the production of Isomers, heavily penalized by a market scenario that has been extremely negative for years, was shut down.
5

Versalis / Directors’ Report on operations/ Operating Review
Revenues and production The Versalis Group manufactures and sells petrochemical products (intermediates, polyethylene, styrenes and elastomers). In the Intermediates Business Unit, the main objective is to ensure the adequate availability of monomers to cover the needs of the downstream business. In particular, olefins (ethylene and butadiene) are integrated with the elastomer and polyethylene business, and aromatics are integrated with the phenol / hydrogenated derivatives and styrenes business.
The Versalis Group is among the leading European manufacturers of polystyrene and polyethylene, used mainly for flexible packaging, and is one of the world leaders in elastomers, covering almost all the major sectors (in particular the automotive industry).
The net sales from operations of the Versalis Group for the year ended on December 31, 2014 amounted to € 5,284 million compared with € 5,859 in 2013 (-9.8%). Average unit prices were 1.5% lower than the previous year. Sales dropped by 8.5%, still affected by the weak demand, even though some signs of improvement were felt in the latter part of the year, especially with regard to polymers. The decline in sales volumes is, in fact, largely due to lower sales of olefins (-19%) and aromatics (-14%) owing to the shutdown of the Porto Marghera cracking and aromatics plants, starting from the end of February 2014, while sales of polymers are only slightly lower than last year (-1.1%).
The fall in oil prices in Euro during the second half of 2014 had repercussions on the prices of monomers, particularly of Butadiene (-17.4%) and Xylenes (-14.8%), also in the light of the weak market and the production overcapacity. These events influenced the decision to proceed with the sale of the Aromatics plants in Sarroch, as described above. In the Polymers business, styrenes are still suffering (-4.4%) since they do not benefit from the falling in raw material costs, and elastomers (-7.6%) are suffering from price competition from Asian imports. Polyethylene prices, however, are stable and have benefited from a lack of supply in Europe and favourable exchange rates, with sales recovering by 0.8%.
Production amounted to 5,283 thousand metric tons, 534 thousand metric tons less than in 2013 (-9.2%), due mainly to a lower production by the Intermediates Business Unit (-14.2%) following the shutdown of the Porto Marghera cracker plant. The production of elastomers also declined (-7.5%) due to the contraction in market demand, as did that of styrenes (-4.0%). Vice versa, the production of polyethylene increased by 2.2%.
The main drops in production were recorded at the Porto Marghera site (-85%), following the aforementioned shutdown of the cracking and aromatics plants, and at the Sarroch site (-23%), where production was reduced in the light of the difficult market situation. There was, however, a rise in production at the Priolo and Dunkirk sites, where the crackers ran at full capacity to compensate for the lack of production by the Porto Marghera cracker.
Among the foreign sites, the Hythe plant producing rubber and latex was shut down permanently at the end of March 2014.
6

Versalis / Directors’ Report on operations/ Operating Review
Nominal production capacity decreased as a result of the rationalization activities undertaken during the period. The average utilization rate of the plants was 71.3%, calculated based on nominal capacity, showing a significant increase compared to 2013 (65.3%).
Revenues
(amount in millions of euros) 2012 2013 2014 Ch. %Intermediates 3,050 2,709 2,310 (14.7)Polymers (a) 3,188 2,933 2,800 (4.5)Other income (b) 180 217 174 (19.8)
6,418 5,859 5,284 (9.8)
Production
(in thousands of metric tons) 2012 2013 2014 Ch. %Intermediates 3,595 3,462 2,972 (14.2)Polymers 2,495 2,355 2,311 (1.9)
6,090 5,817 5,283 (9.2)
(b) Third party products sold under agency agreements via foreign trading companies and other income for services.
(a) From 2013 styrene monomer has been aggregated in the Polymers Business Unit. The related data from the Intermediates Business Unit for the periods under comparison have been reclassified accordingly.
Business review
Intermediates Business Unit
In 2014 revenues from Intermediates (€2,310 million) decreased by €399 million compared with the previous year (-14.7%). The decline in sales of Polymers led to an “opportunistic balancing” of Olefins and thus to the shutdown of the Porto Marghera cracking plants, with repercussions on the sales of aromatics and derivatives. The reduction in sales of Butadiene (-31.0%) and Xylenes (-34.0%) is a result of the market weakness and production overcapacity in Europe.
Average unit sales prices have fallen by 1.5% overall, with a reduction of 6.7% in the prices of aromatics, where the very weak market has led to a decrease of 15.0% in the prices of Xylenes. Propylene quotations have strengthened and this offset the decline in prices of ethylene and butadiene, resulting in an overall reduction of 1.1% of the average prices of olefins.
Production of Intermediates (2,972 thousand metric tons) decreased by 14.2% compared to 2013, due to the lower volumes of olefins and aromatics (-10.6% and -31.0%), in relation to the aforementioned shutdown of the Porto Marghera cracker plant. Furthermore, Sarroch had lower production, resulting from the difficult competitive market for Aromatics products. Production volumes of derivatives also dropped (-9.6%), due to the programmed shutdown in the second half of the year.
Polymers Business Unit
In 2014, revenues from Polymers (€2,800 million) decreased by €133 million compared to 2013 (-4.5%). The reduction in sales volumes (-5.0%) and in the average unit prices (-7.6%) for the elastomers business was influenced by the persistent weakness of demand in the automotive sector and the low prices of products from the Asian market. The styrenes business contracted too, as it did not benefit from the fall in prices of raw materials and it recorded a decrease in average prices of 4.4%, alongside a drop in volumes sold of 3.5%, also due to new imports from North Africa. The average prices of polyethylene have remained stable.
As regards the sales volumes of elastomers, in 2014 there was a partial recovery in sales of thermoplastic rubber (+8.6%) and special EPDM rubber (+4.8%), which partially offset the lower sales of rubber commodities (SBR -11.0% and BR -2.6%), nitrile (-9.0%) and latex (-19.0%). The decline in sales volumes of styrenes (-3.5%) is attributable in particular to the lower sales of compact polystyrene (-4.0%), caused by the weak demand, and styrene monomer (-15.0%) where a programmed shutdown caused a lack of supply. Sales volumes in the polyethylene business increased overall. Higher sales of HDPE (+6.8%), EVA (+9.4%) and LLDPE (+0.6%) were recorded due to a shortage of these product lines on European markets, keeping prices relatively strong. Falling volumes of LDPE (-2.5%) were recorded.
7

Versalis / Directors’ Report on operations/ Operating Review
Production of Polymers (2,311k metric tons) decreased by 1.9% compared to 2013. In particular, with regard to elastomers (-7.5%), the final shutdown of the Hythe plant at the end of March realigned the production of latex and SBR rubber to their demand, while BR rubber recorded a contraction related to market scenarios. Production of styrenes also fell down (-4%) because of a lower production of styrene (-5.0%), due to the programmed shutdown during the second half of 2014, and of compact polystyrene (-6.4%), partially offset by increased production of ABS/SAN (+10.6%) as a result of short-term reprogramming. Lastly, production of polyethylene (+2.2%) raised, due to the increase of the Brindisi site (HDPE +5.0%), resulting from the programmed shutdown of olefins, and the increase of EVA production in the Oberhausen site (+53%).
8

Versalis / Directors’ Report on operations/ Operating Review
Investments Net investment in tangible and intangible assets for the year amounted to €274 million; this is analysed by business unit in the table, and by type of expenditure in the graph, here below.
Investments(amounts in millions of euros) 2012 2013 2014 % Ch.
Olefins 64 133 69 (48.1)Aromatics 23 7 7Derivatives 2 4 8 100.0Styrenes 4 9 12 33.3Elastomers 13 47 117 n.s.Polyethylene 15 18 7 (61.1)Green Chemistry 9 3 (66.7)Industrial Services 39 80 52 (35.0)Staff and financial expenses 5 5 8 n.s.Syndial Grants (16) (24) (7) (70.8)
Grants, refunds from third parties and change in advances (2) (6) n.s.Investments in property, plant and equipment 147 288 270 (6.3)Investments in intangible assets 9 3 4 33.3
156 291 274 (5.8)
Net investment by type
mantenimento10%
recupero energetico
2%
potenziamento55% ricerca 1%
fermate e manutenzione straordinaria
23%ecologia e sicurezza
9%
expansion
research
energy recovery
maintenance environment and safety
shutdowns and
extraordinary maintenance
9

Versalis / Directors’ Report on operations/ Operating Review
The main investments for the year related to the following:
• work on strategic projects started for the development of the elastomer business in Ferrara and Grangemouth and for the reorganization of the Priolo site (totalling €136.5 million);
• work to ensure plant compliance with safety and environmental regulations (€46.1 million), including work to ensure compliance with the IPPC (Integrated Pollution Prevention and Control) Directive at the Brindisi, Ferrara, Mantua, Priolo and Sarroch sites (€13.7 million), work to ensure compliance with the BAT and double bottom tanks in the Brindisi, Ferrara, Mantua, Porto Marghera, Porto Torres, Priolo and Sarroch sites (€8.4 million), work to improve safety in accordance with the Regional Technical Committee requirements in Priolo (€2.3 million) and work on the wharf at Porto Torres (€1.1 million);
• minor maintenance work and improvements in the reliability of the plants at various facilities (€26.1 million);
• long-term maintenance work on the ethylene and polyethylene plants in Brindisi, the phenol and styrene plants in Mantua and ethylene plant in Priolo for a total of €17.3 million;
• recoiling work on 4 furnaces at the Priolo ethylene plant with new technology (€11.6 million); • inter-company project with Ecofuel SpA, at the Ravenna site, for the extraction of Butene 1, selective
hydrogenation of Refinate 2 and buried tanks (€9 million); • recoiling work on the furnaces at the Brindisi, Dunkirk and Porto Marghera ethylene plants and cyclical
maintenance work at the Mantua site (€8.9 million); • work on the buildings and utility networks at the Porto Torres site in preparation for the Green
Chemistry project (€8.3 million); • research activities (€3.9 million).
10

Versalis / Directors’ Report on Operations/ Comments on the consolidated economic and financial results of the Versalis Group
Financial review Versalis Group
Profit and Loss Account
2012 (amounts in millions of euros) 2013 2014 Change % Ch.6,418 Net sales from operations 5,859 5,284 (575) (9.8)
103 Other income and revenues 149 122 (27) (18.1)(7,005) Operating expenses (6,620) (5,896) 724 (10.9)
(9) Other operating (expense) income (1) (27) (26) n.s.(193) Depreciation, depletion, amortization and impairments (125) (185) (60) 48.0(686) Operating loss (738) (702) 36 (4.9)(51) Net financial income (expense) (53) (30) 23 (43.4)
2 Net income (expense) from investments (3) (3) n.s.(735) Loss before income taxes (791) (735) 56 (7.1)
162 Income taxes 166 190 24 14.522.0 Tax Rate (%) 21.0 25.9 4.9 23.2(573) Net loss (625) (545) 80 (12.8)
Net loss
In 2014, the Versalis Group recorded a net loss of €545 million, €80 million less than in 2013.
The improvement in operating results of €36 million was mainly a consequence of the following factors: - the reduction in quantities purchased and prices of petroleum feedstock in Euro compared to 2013; - the reduction in quantities purchased and prices of utilities compared to 2013; - the general reduction in fixed costs due to savings and rationalization.
The effects of the above situation were attenuated by the following factors:
- the 9.8% decrease in sales revenues, resulting from the decline in quantities sold and the reduction in elastomer and olefin prices due to the negative trend in the automotive and tyre markets and the greater availability of Asian products, which has hampered European exports;
- the increase in net write-downs of tangible assets; - the decrease in revenues from royalties and the sale of carbon dioxide emission rights; - the increase in operating expenses related to derivatives used to hedge the price risk of virgin naphtha.
Adjusted net loss
2012 (amounts in millions of euros) 2013 2014 Change % Ch.(573) Net loss (625) (545) 80 (12.8)
63 Exclusion of inventory holding (gains) losses 213 170 (43) (20.2)84 Exclusion of special items 32 89 57 n.s.
(426) Adjusted net loss (a) (380) (286) 94 (24.7)(a) For a definition and reconciliation of the adjusted net loss, which excludes inventory (gains) losses and special items, see the section "NON-GAAP Measures". The adjusted net loss decreased by €94 million as described in the section “Non-GAAP measures” below.
11

Versalis / Directors’ Report on Operations/ Comments on the consolidated economic and financial results of the Versalis Group
Analysis of profit and loss account items Net sales from operations
2012 (amounts in millions of euros) 2013 2014 Change % Ch.1,792 Olefins 1,487 1,305 (182) (12.2)
819 Aromatics 791 610 (181) (22.9)440 Derivatives (*) 431 394 (37) (8.6)979 Elastomers 716 628 (88) (12.3)774 Styrenes (*) 800 745 (55) (6.9)
1,434 Polyethylene 1,418 1,428 10 0.7180 Corporate and services 216 174 (42) (19.4)
6,418 5,859 5,284 (575) (9.8)
(*) From 2013 styrene monomer has been aggregated in the Styrenes Business Unit. The related data from the Derivatives Business for the periodsunder comparison have been reclassified accordingly.
Net sales from operations fell by €575 million due to a reduction in the quantities sold (-8.5%), (caused by an overall slowdown in demand), and the reduction in average unit sales prices.
Other income and revenues
Other income and revenues decreased by €27 million compared with 2013 due mainly to lower income from the sale of licences (€37 million) and lower income from compensation for damages (€15 million), partially offset by higher revenues from the sale of Energy Efficiency Certificates (€16 million) and higher other income (€7 million).
Operating expenses 2012 (amounts in millions of euros) 2013 2014 Change % Ch.
5,049Production costs – raw, ancillary and consumable materials and goods 4,629 4,074 (555) (12.0)
1,511 Service costs 1,463 1,263 (200) (13.7)25 Operating leases and other 25 26 1 4.019 Net provisions for contingencies 64 28 (36) (56.3)35 Other expenses 66 148 82 n.s.
366 Payroll and related costs 373 357 (16) (4.3)7,005 6,620 5,896 (724) (10.9)
Purchases, services and other operating costs decreased by €724 million (a decrease of 10.9%), as shown in the table above. The decrease of 12.0% in the cost of raw, ancillary materials, consumables, goods and inventory variations was primarily due to the decrease in the average unit price in euro of virgin naphtha compared to 2013 and a decrease in the quantities purchased, following the reduction in production due to falling demand for products in the chemical sector. Service costs decreased by 13.7% mainly due to the reduction in the operating activities and utility prices (methane -13.2%, electricity -7.4%, steam -7.1%), linked with the lower production, reduction in maintenance costs, costs of planning and managing the works, costs of ecological treatment and logistics costs, only partially offset by the higher costs due to increases in non-current assets from in-house constructions. The reduction of €36 million in net provisions for contingencies was mainly due to the lower amount of €32 million allocated to the disposal and restructuring provision, and the lower amount of €4 million allocated for risks associated with antitrust litigation (more extensively discussed in the section “Litigation”). Other expenses increased by €82 million compared to 2013, primarily because of the capital loss of €45 million related to the divestment of Sarroch’s Aromatics business unit, the increase in expenses for the
12

Versalis / Directors’ Report on Operations/ Comments on the consolidated economic and financial results of the Versalis Group
decommissioning of the Polyethylene plant at the Gela site (€18 million) and the Aromatics plant at the Sarroch site (€10 million) and the higher losses on receivables of €6 million, only partially offset by the greater net use of €17 million from the doubtful debt provision. Payroll and related costs have decreased by €16 million (4.3%) mainly as a result of a reduction of 487 employees, both for ordinary reasons and as a result of extraordinary operations and reorganizations which are better described in the section “People” in the chapter “Commitment to sustainable development.”
Other operating (expense) income
Other operating expenses of €27 million (€1 million in 2013) are related to derivatives used to hedge the price risk of virgin naphtha which, although not held for speculative purposes, cannot be classified as a “hedge” under IFRS standards.
Depreciation, amortization and impairment
2012 (amounts in millions of euros) 2013 2014 Change % Ch.77 Tangible assets 80 85 5 6.35 Intangible assets 4 4
82 Depreciation and amortization 84 89 5 6.0111 Impairments 41 96 55 n.s.193 125 185 60 48.0
Depreciation and amortization increased by €5 million compared with 2013, owing to newly-commissioned investments in property, plant and equipment. The impairment of €96 million stems from the results of impairment tests and refers mainly to the Dunkirk site (€63 million), the SBR and latex plants at the Ravenna site (€14 million), the sites in Sarroch (€9 million), Porto Marghera (€7 million), Ragusa (€4 million) partially offset by the use of the write-down provision for the Hythe site (€1 million). Versalis Group’s non-financial assets have been grouped into Cash Generating Units (CGUs) and the impairment loss was determined by comparing the book value of each CGU with its value in use (determined by discounting to present value the expected cash flows deriving from uof the assets over a period coinciding with the remaining average useful life of the CGU). The CGUs of the SBR and Latex plants in Ravenna, Sarroch, Porto Marghera, Ragusa and Dunkirk have a value in use that is less than the value of the asset. The impairment, therefore, relates to investments made during the year at such sites and essentially refers to work carried out in order to maintain plant efficiency (including long-term maintenance) and compliance with environmental and safety standards. These values are net of utilization of government grants relating to the plants in Sarroch and Priolo (€3 million). For further details, see Note No. 7 “Property, plant and equipment” in the Notes to the consolidated financial statements.
Net financial expenses
2012 (amounts in millions of euros) 2013 2014 Change % Ch.(39) Finance income (expense) related to net borrowings (48) (39) 9 18.8(2) Income (expense) on derivative contracts (9) 11 20 n.s.(8) Exchange differences 4 (8) (12) n.s.(5) Other finance income (expense) (4) 4 n.s.
3 Capitalized finance expense 4 6 2 (50.0)(51) (53) (30) 23 43.4
13

Versalis / Directors’ Report on Operations/ Comments on the consolidated economic and financial results of the Versalis Group
Net financial expenses decreased by €23 million, due essentially to: (i) decreased expenses from the fair value measurement of non-speculative commodity derivatives on exchange rate risks of €20 million; (ii) the decrease of €9 million in the interest charges related to financial debt, partially offset by the worsening of net exchange rate differences on commercial transactions by €12 million.
These derivative instruments do not meet the conditions specified by IAS 39 in order to be classified as “hedges” and, therefore, the related charges in fair value are recorded in the income statement.
Net income (expense) from investments
2012 (amounts in millions of euros) 2013 2014 Change % Ch.Share of profit (loss) of equity-method investments (5) (5) n.s.Dividends 2 2 n.s.
2 Net gains on disposals of equity instruments n.s.2 (3) (3) n.s.
The net expense from investments of €3 million concerns the equity-method evaluation of Newco Tech SpA (€5 million), partially offset by the dividends received from Versalis Kimya Ticaret Limited Sirketi (€2 million).
Income taxes
2012 (amount in millions of euros) 2013 2014 ChangeProfit before income taxes
(613) Italy (606) (626) (20)(122) Abroad (185) (109) 76(735) (791) (735) 56
Income taxes(171) Italy (151) (174) (23)
9 Abroad (15) (16) (1)(162) (166) (190) (24)
Tax rate (%)27.9 Italy 24.9 27.8 2.9n.s. Abroad 8.1 14.7 6.6
22.0 21.0 25.9 4.9
Deferred tax assets were accounted for in the books since their recovery was considered as being probable, taking into account the expected future profitability resulting from the Group’s four-year plan and also in virtue of the fact that the deferred taxes included in tax losses are not subject to time limits for their recoverability.
The reported tax rate increased by 4.9 percentage points. For a full description of the principal reasons thereof, please see the section “Income taxes” in the notes on the consolidated financial statements.
The adjusted tax rate, given by the ratio between taxes and the loss before income taxes net of inventory gains/losses and of special items, amounted to 21.4% (14.8% in 2013).
14

Versalis / Directors’ Report on Operations/ Comments on the consolidated economic and financial results of the Versalis Group
Non-GAAP measures
Reconciliation of reported operating profit and reported net profit to adjusted results The Versalis management assesses the company's performance on the basis of adjusted operating profit and adjusted net profit, which are arrived at by excluding special items and inventory gains (losses) from operating profit and from reported net profit. The tax effect of items excluded from adjusted net profit is determined on the basis of the nature of each excluded item, with the exception of financial income/financial expenses to which the Italian statutory tax rate of 27.5% is conventionally applied. Adjusted operating profit and adjusted net profit are not envisaged by the IFRS. Management believes that these performance measures facilitate the comparison of the performance of the businesses across periods and allows the financial analysts to evaluate the company's performance on the basis of their forecasting models. The management uses the Group's adjusted net profit when calculating the Group's return on average capital employed (Group ROACE).
The following is a description of some of the items that are excluded from calculation of adjusted results.
The inventory gains (losses) are given by the difference between the current cost of products sold and that resulting from application of the weighted average cost as required by the IFRSs.
Income or charges are classified as special items, if significant, when: (i) they derive from infrequent or unusual events and transactions, being identified as non-recurring events; (ii) they derive from events or transactions which are not considered to be representative of the normal course of business, such as environmental provisions, restructuring charges, write-downs or write-ups in the value of assets and gains or losses on disposals even if similar events occurred in the past or are likely to occur in the future, or (iii) exchange rate differences and derivatives related to commercial and not financial operations, as is the case in particular for derivatives set up to manage the exchange risk implicit in commodity pricing formulas. In this case, these are reclassified from the adjusted financial income and expenses to adjusted operating profit/(loss).
In compliance with Consob Resolution No. 15519 of July 27, 2006, components of income deriving from non-recurring events or operations are to be disclosed separately, where significant, in the directors’ report and in the financial statements. The valuation component of derivative instruments on commodities, which lack the formal requisites to be classified as hedging, is also classified among special items (including the ineffective portion of the hedge derivatives).
2012 (amounts in millions of euros) 2013 2014 Change(686) Operating loss (738) (702) 36
63 Exclusion of inventory holding (gains) losses 213 170 (43)134 Exclusion of special items 124 205 81
(489) Adjusted operating loss (401) (327) 74(41) Net finance income (expense) (*) (45) (34) 11
2 Net income (expense) from investments (*) (3) (3)102 Income taxes (*) 66 78 12
(19.3) Tax rate (%) (14.8) (21.4) (6.63)(426) Adjusted net loss (380) (286) 94
(*) Excluding special items
15

Versalis / Directors’ Report on Operations/ Comments on the consolidated economic and financial results of the Versalis Group
Details of special items:
2012 (amounts in millions of euros) 2013 2014Other special items
111 - impairment of tangible assets 41 961 - provision for environmental and restructuring risks 61 58
- losses on divestment of business unit 45- valuation provisions for operating charges on derivatives 3- gains (1)
14 - provision for redundancy incentives 23(10) - exchange rate differences and derivatives (5) 4
15 - provision for revocation expenses3 - provision for Antitrust fines 4
134 Special items of operating loss 124 20510 Finance (income) expense 8 (4)
of which: 10 - reclassification of exchange rate differences and derivatives in operating loss 5 (4)
- financial expenses on Antitrust sanctions 3(60) Income taxes (100) (112)
16

Versalis / Directors’ Report on Operations/ Comments on the consolidated economic and financial results of the Versalis Group
Reclassified Balance Sheet
The reclassified balance sheet aggregates the asset and liability amounts derived from the statutory balance sheet according to function, under three basic areas: operating, investing and financing. Management believes that the reclassified balance sheet provides useful information in assisting investors to assess the Company’s capital structure and to analyse its sources of funds and investments in fixed assets and working capital. Management uses the reclassified balance sheet to calculate key ratios such as return on capital employed (ROACE) and the proportion of net borrowings to shareholders’ equity (leverage).
Reclassified Balance Sheet (*)
(amounts in millions of euros) 31.12.2013 31.12.2014 ChangeFixed assets
Property, plant and equipment 1,060 1,150 90Intangible assets 67 67Investments 163 170 7Receivables and securities held for operating activities 101 201 100Net payables related to capital expenditure (31) (34) (3)
1,360 1,554 194Net working capital
Inventories 1,145 1,077 (68)Trade receivables 752 664 (88)Trade payables (1,006) (853) 153Tax receivables (payables) and provisions for net deferred tax liabilities 474 645 171Provisions for risks and charges (159) (147) 12Other assets (liabilities) 124 77 (47)
1,330 1,463 133Provisions for employee benefits (74) (76) (2)NET CAPITAL EMPLOYED 2,616 2,941 325Shareholders' equity 952 407 (545)Net borrowings 1,664 2,534 870TOTAL LIABILITIES AND SHAREHOLDERS’ EQUITY 2,616 2,941 325
(*) See “Reconciliation of reclassified balance sheet, income statement and cash flow statement to statutory scheme”.
Fixed assets
Property, plant and equipment, amounted to €1,150 million, showing an increase of €90 million due essentially to additions for the period (€270 million), partially offset by depreciation for the period (€85 million), the results of the impairment tests (€96 million) and the divestment of the Sarroch Aromatics business unit (€2million).
Investments, amounted to €170 million, showing an increase of €7 million due mainly to the subscriptions to the share capital of the joint ventures Lotte Versalis Elastomers Co. Ltd (€10 million) and Newco Tech SpA (€3 million), partially offset by the impairment of the investment in Newco Tech SpA (€5 million) and the sale of the investments in Priolo Servizi Scarl (€2 million).
Financial receivables and securities held for operating activities of €201 million refer mainly to the loan granted to Matrìca SpA, joint venture with Novamont SpA, to meet the financial requirements of Phase 1 of the “Green Hub” project in Porto Torres.
Net working capital
The decrease of €68 million in inventories is attributable: (i) to the decrease of €86 million in inventories of finished products resulting from the reduction of stock and the drop in prices; (ii) to the decrease of €4 million in inventories of work in progress and semi-finished products; partially offset by the increase of €22 million in inventories of raw materials, supplies and consumables. These amounts include net allowances for impairment
17

Versalis / Directors’ Report on Operations/ Comments on the consolidated economic and financial results of the Versalis Group
losses for the period of €17 million (€1 million in 2013) for the adjustment to market value of the remaining stock.
The decrease of €88 million in trade receivables results mainly from lower sales.
The decrease of €153 million in trade payables is primarily due to a reduction in the quantities purchased of petroleum feedstock (virgin naphtha) in the last quarter of 2014 compared with the same period in the previous year.
The increase in tax assets and net provisions for taxes of €171 million is mainly due to: (i) the recording of deferred tax assets of €196 million and (ii) the decrease of €9 million of payables to the parent company Eni SpA for participation in the national tax consolidation, due to the repayment of the excessive advance payments received in 2013. These effects were partially offset by the decrease of €26 million in the VAT receivables of the Group following the collection of prior year receivables.
The decrease of €12 million in provisions for risks and charges was due primarily to the utilization of €21 million to the disposal and restructuring provision for the closure of the Hythe (UK) site, the utilization of €16 million for redundancy incentives, partially offset by the accrual of €20 million to the disposal and restructuring provision for the divestment of the Sarroch business unit and net accrual of €7 million to the provision for environmental expenses for the Dunkirk (France) site.
The decrease of €47 million in other current net assets is mainly due to the decrease of €57 million in other receivables from third parties, the decrease of €8 million in receivables for the sale of licences, the decrease of €2 million in non-hedged derivatives, partially offset by the increase of €13 million of receivables from companies in the Eni Group and the increase of €11 million in advances to suppliers.
Statement of comprehensive loss
2013 2014(amounts in millions of euros)LOSS FOR THE PERIOD (625) (545)Other items of comprehensive loss:Valuations of defined-benefit plans for employees 2 (5)Foreign currency translation differences (1) 4Tax effect relative to the other components of the comprehensive loss that cannot be reclassified to the profit and loss account (1) 1TOTAL COMPREHENSIVE LOSS FOR THE YEAR (625) (545)
Shareholders' equity (amounts in millions of euros)
Shareholders' equity at December 31, 2013 952Total comprehensive loss for the year (545)
Shareholders' equity at December 31, 2014 407
Shareholders’ equity amounted to €407 million and decreased by €545 million as a result of the comprehensive loss for the year.
Leverage and net borrowings Leverage measures the degree of company indebtedness and is calculated as the ratio between net borrowings and shareholders’ equity. The Versalis management uses leverage to assess the degree of solidity and efficiency of the asset structure in terms of relative proportion of financing sources between own and third-party assets, and to carry out benchmark analysis with the industry standards.
18

Versalis / Directors’ Report on Operations/ Comments on the consolidated economic and financial results of the Versalis Group
(amounts in millions of euros) 31.12.2013 31.12.2014 ChangeShort-term debt 1,042 1,788 746Medium/long-term debt 702 825 123Cash and cash equivalents (80) (79) 1Net borrowings 1,664 2,534 870Shareholders' equity 952 407 (545)Leverage 1.75 6.23 4.48
The increase in net borrowings by €870 million was primarily the result of the financial requirements of €867 million related to the net cash flow from operating activities (negative for €483 million) and the net cash flow from investing activities (€385 million). For further information, see the section Reclassified Cash Flow Statement.
Leverage, the ratio of net borrowings to shareholders’ equity, went up from 1.75 in 2013 to 6.23 in 2014.
Reconciliation of net profit/(loss) and shareholders’ equity of Versalis SpA with consolidated net profit/(loss) and shareholders’ equity
(amounts in millions of euros) 2013 2014 31.12.2013 31.12.2014
As recorded in annual Financial Statements of Versalis SpA (551) (594) 997 398
Difference between the equity value of individual accounts of consolidated subsidiaries, with respect to the corresponding carrying amount in the statutory accounts of the parent company (51) 71 (63) 11Consolidation adjustments:- elimination of tax adjustments and compliance with accounting policies (29) (43) 29 (12)- deferred taxation 6 21 (11) 10As recorded in Consolidated Financial Statements (625) (545) 952 407
Profit for the year Shareholders' equity
19

Versalis / Directors’ Report on Operations/ Comments on the consolidated economic and financial results of the Versalis Group
Reclassified Cash Flow Statement The Reclassified Cash Flow Statement derives from the statutory statement of cash flows. It enables investors to understand the link existing between changes in cash and cash equivalents (deriving from the statutory cash flow statement) and in net borrowings (deriving from the reclassified cash flow statement) occurring between the beginning and the end of the period. The measure enabling such a link is represented by the “free cash flow”, which is the excess or deficit of cash remaining after capital expenditure requirements. The free cash flow, which is a non-GAAP performance measure, ends alternatively with: (i) changes in cash and cash equivalents for the period after adding/deducting cash flows relative to finance debts/receivables (issuance/repayment of debts and receivables related to financing activities), shareholders’ equity (dividends paid/, purchase of own shares, capital issuance) and the effect on cash and cash equivalent of changes in the consolidation area and of exchange rate differences; (ii) change in net borrowings for the period by adding/deducting cash flows relating to shareholders’ equity and the effect on net financial debts of changes in the consolidation area and of exchange rate differences. * See “Reconciliation of reclassified balance sheet, income statement and cash flow statement to statutory schemes”.
Reclassified Cash Flow Statement (*)
2012 (amounts in millions of euros) 2013 2014(573) Net loss for the period (625) (545)
Adjustments to reconcile net loss to net cash provided byoperating activities:
189 - depreciation and amortization and other non monetary items 120 191- net gains on disposal of assets 5
(127) - dividends, interest, taxes and other charges (125) (153)(220) Changes in w orking capital 399 51
Dividends received, taxes (paid) received, interest (paid)78 received (40) (32)
(653) Net cash flow provided by operating activities (271) (483)(156) Investments in f ixed assets (291) (274)(60) Investments and purchase of consolidated subsidiaries and businesses (74) (13)
Disposals 1 2Financial investments (100) (101)
(9) Other cash f low related to investing activities 17 2(878) Free cash flow (718) (867)
894 Change in short-term and long-term debt (262) 866Cash f low from capital and reserves 1,000
16 NET CASH FLOW FOR THE PERIOD 20 (1)
Change in net borrowings
2012 (amounts in millions of euros) 2013 2014(878) Free cash flow (718) (867)
(2) Exchange differences on net borrow ings and other changes 2 (3)Cash f low from capital and reserves 1,000
(880) CHANGE IN NET BORROWINGS 284 (870)
20

Versalis / Directors’ Report on Operations/ Comments on the consolidated economic and financial results of the Versalis Group
The net cash used by operating activities of €483 million and the financial requirement of €867 million, generated primarily by investments in fixed assets (€274 million), equity investments (€13 million) and loans granted to the joint venture company Matrìca SpA (€101 million) were covered by an increase in short-term and long-term debt of €866 million, generating a negative net cash flow for the period of €1 million.
Reconciliation of reclassified consolidated balance sheet, income statement and cash flow statement to statutory schemes
Reclassified Consolidated Balance Sheet
Items of the Reclassified Consolidated Balance Sheet Reference to Partial amounts Amounts from Partial amounts Amounts from(w here not expressly indicated, the item notes to the statutory from the reclassif ied from the reclassif iedderives directly from the statutory f inancial statements) f inancial statements statutory f inancial f inancial statutory f inancial f inancial (amounts in millions of euros) statements statements statements statementsFixed assetsProperty, plant and equipment 1,060 1,150Intangible assets 67 67Equity accounted investments 148 155Other investments 15 15
Receivables and securities held for operating activities, made up of: 101 201- other receivables 101 131- other non-current f inancial assets 70Net payables related to capital expenditures, made up of: (31) (34)- payables related to capital expenditures (see note 16) (31) (34)Total fixed assets 1,360 1,554Net working capitalInventories 1,145 1,077Trade receivables 752 664Trade payables (1,006) (853)Tax receivables (payables) and provisions for tax, made up of: 474 645- income tax payables (see note 17) (2) (1)- other tax payables (see note 18) (10) (11)- deferred tax liabilities (see note 23) (20) (111)- payables for tax consolidation (see note 16) (10) (1)- current tax assets (see note 4) 25 14- other current tax assets (see note 5) 10 13- deferred tax assets (see note 12) 427 714- receivables for Group VAT (see note 2) 54 28Provisions for risks and charges (159) (147)Other current assets and liabilities, made up of: 124 77- other receivables (see note 2) 201 163- other (current) assets (see note 6) 3 6- other receivables and other assets (see note 13) 4 4- advances, other payables (see note 16) (75) (80)- other (current) liabilities (see note 19) (3) (7)- other payables and other liabilities (see note 24) (6) (9)Total net working capital 1,330 1,463Provisions for employee benefits (74) (76)NET CAPITAL EMPLOYED 2,616 2,941Shareholders' equity 952 407Net borrowingsTotal debt, made up of:- long-term debt (see note 20) 702 822- current portion of long-term debt (see note 20) 2 3- short-term debt (see note 14) 1,040 1,788less:Cash and cash equivalents (see note 1) (80) (79)Total net borrowings 1,664 2,534TOTAL LIABILITIES AND SHAREHOLDERS’ EQUITY 2,616 2,941
31.12.2013 31.12.2014
21

Versalis / Directors’ Report on Operations/ Comments on the consolidated economic and financial results of the Versalis Group
Items of the Reclassified Cash Flow Statement Partial Amounts from Partial Amounts fromand confluence/reclassification of items in the statutory format amounts from reclassified amounts from reclassified
Statutory format Statutory format(amounts in millions of euros) format formatNet loss (625) (545)
Adjustments to reconcile net loss to net cash provided by operating activities:Depreciation and amortization and other non-monetary items 120 191
- depreciation and amortization 84 89- net impairment of tangible and intangible assets 41 96- share of profit (loss) of equity-accounted investments 5- currency translation differences from alignment (2) 1- net change in provision for employee benefits (3)
Net gains on disposal of assets 5Dividends, interest, income taxes and other charges (125) (153)
- dividends (1)- interest income- interest expense 41 38- income taxes (166) (190)
Changes in working capital 399 51- inventories 107 63- trade receivables 95 89- trade payables 147 (156)- provisions for risks and charges 51 (16)- other assets and liabilities (1) 71
Dividends received, taxes paid, interest (paid) received during the period (40) (32)- dividends received 1- interest received- interest paid (38) (33)- Income taxes received (paid) including tax credits rebated (2)
Net cash flow provided by operating activities (271) (483)Capital expenditures (291) (274)
- tangible assets (288) (270)- intangible assets (3) (4)
Investments and purchase of consolidated subsidiaries and businesses (74) (13)- non consolidated investments (71) (13)- investments and purchase of consolidated subsidiaries and businesses (3)
Disposals 1 2- tangible assets- investments 1 2Other cash flow related to capital expenditures, investments and disposals- financial investments: financial receivables (100) (100) (101)- change in payables and receivables relating to investments 17 17 2
Free cash flow (718) (867)Change in short-term and long-term debt (262) 866
- proceeds from long-term finance debt 121- payments from long-term finance debt (101) (3)- change in short-term finance debt (161) 746- foreign currency exchange differences 2
Dividends paid and changes in non-controlling interests and reserves: 1,000- net contributions (refunds) of own capital from/to third parties 1,000Net cash flow for the period 20 (1)
2013 2014
22

Versalis / Directors’ Report on Operations/ Comments on the economic and financial results of Versalis SpA
Financial review – Versalis SpA
Profit and Loss Account
2012 (amounts in millions of euros) 2013 2014 Change % Ch.5,220 Net sales from operations 4,766 4,186 (580) (12.2)
97 Other income and revenues 155 115 (40) (25.8)
(5,738) Operating expenses (5,383) (4,771) 612 (11.4)
(9) Other operating (expense) income (1) (27) (26) n.s.
(139) Depreciation, amortization and impairment (88) (91) (3) 3.4
(569) Operating loss (551) (588) (37) 6.7(45) Net finance income (expense) (46) (31) 15 (32.6)
(150) Net income (expense) from investments (103) (148) (45) 43.7
(764) Loss before income taxes (700) (767) (67) 9.6171 Income taxes 149 173 24 16.1
(593) Net loss (551) (594) (43) 7.8 Net loss The financial statements of Versalis SpA show a net loss for the period of €594 million (€551 million in 2013), determined by the operating loss of €588 million, net finance expenses of €31 million and net investment expenses of €148 million, partially offset by income from income taxes of €173 million.
The operating result worsened by €37 million, mainly as a consequence of the following factors:
- the 12.2% decrease in sales from operations resulting from the decline in quantities sold and the reduction in elastomer and olefin prices due to the negative trend in the automotive and tyre markets and the greater availability of Asian products, which has hampered European exports;
- the decrease in revenues from the sale of licences; - the capital loss related to the divestment of the Sarroch business; - the increase in operating expenses related to derivatives utilized to hedge the price risk of virgin
naphtha.
The effects of the above negative factors were partly offset by the following factors:
- the reduction in quantities purchased and prices of petroleum feedstock in euro; - the reduction in quantities purchased and prices of utilities compared to 2013; - the general reduction in fixed costs due to savings and rationalization; - the increase in income from the sale of Energy Efficiency Certificates.
23

Versalis / Directors’ Report on Operations/ Comments on the economic and financial results of Versalis SpA
Analysis of the profit and loss account items The reasons for the most significant variations in Versalis SpA’s income statement items are commented upon in the Notes to the separate Statutory financial statements of Versalis SpA, unless expressly indicated below.
Net sales from operations
2012 (amounts in millions of euros) 2013 2014 Change Ch. %1,334 Olefins 1,127 903 (224) (19.9)
819 Aromatics 791 610 (181) (22.9)630 Derivatives 431 394 (37) (8.6)723 Elastomers 523 507 (16) (3.1)537 Styrenes 755 693 (62) (8.2)989 Polyethylene 963 923 (40) (4.2)188 Corporate and services 176 156 (20) (11.4)
5,220 4,766 4,186 (580) (12.2)
Net sales from operations fell by €580 million (12.2%) following the reduction in the quantities sold, (caused by an overall slowdown in demand), and the decrease in average unit sales prices.
Other income and revenues
Other income and revenues decreased by €40 million compared with 2013 due mainly to the following: a reduction in income from the sale of licences of €37 million, a reduction in income from compensation for damages of €15 million and a reduction in income from the sale of carbon dioxide emission rights of €5 million, partially offset by an increase in revenues from the sale of Energy Efficiency Certificates of €16 million.
Operating expenses 2012 (amounts in millions of euros) 2013 2014 Change Ch. %
3,996Production costs – raw, ancillary and consumable materials and goods and inventory changes 3,685 3,184 (501) (13.6)
1,380 Service costs 1,326 1,163 (163) (12.3)19 Operating leases and other 18 19 1 5.622 Net provisions for contingencies 7 20 13 n.s.32 Other expenses 49 107 58 n.s.
289 Payroll and related costs 298 278 (20) (6.7)5,738 5,383 4,771 (612) (11.4)
Operating expenses decreased by €612 million, equal to 11.4%, as shown in the table above. The decrease of 13.6% in the cost of raw, ancillary and consumable materials and goods and inventory changes was primarily due to a decrease (-5.2%) in the average unit price in euros of virgin naphtha compared to 2013 and to a decrease of 18.6% in the quantities purchased, following the drop in production due to falling demand for products in the chemical sector. Service costs decreased by 12.3%, mainly due to the reduction in quantities purchased and the reduction in the cost of utilities (electricity -7.4%, methane -13.2%, steam -7.1%), connected with the reduction in maintenance costs, costs of planning and managing the works, costs of ecological treatment, logistics costs and costs of contract work, only partially offset by the raise in costs due to increases in fixed assets for internal works. The increase of €13 million in provisions for contingencies was determined primarily by the accrual of €20 million to the disposal and restructuring provision following the sale of the Sarroch Aromatics business, partially offset by the net utilization of €4 million for antitrust litigation and the net utilization of €1 million for the OIL insurance provisions. Other expenses increased by €58 million compared to 2013, primarily because of the capital loss of €45 million related to the divestment of the Sarroch Aromatics business, the increase in expenses for the disposal
24

Versalis / Directors’ Report on Operations/ Comments on the economic and financial results of Versalis SpA
of the Polyethylene plant at the Gela site (€18 million) and the Aromatics plant at the Sarroch site (€10 million), only partially offset by the lower net accrual of €18 million to the doubtful debt provision. Payroll and related costs decreased by €20 million (6.7%) mainly as a result of a reduction in the number of employees, mainly due to the implementation of the mobility plan 2013-2014 which led to expenses associated with the reorganization.
Other operating (expense) income
Other operating expenses of €27 million (€1 million in 2013) are related to derivatives used to cover the price risk of virgin naphtha which, although not held for speculative purposes, are not classifiable as “hedges” under IFRS standards.
Depreciation, amortization and impairment
2012 (amounts in millions of euros) 2013 2014 Change % Ch.49 Tangible assets 50 53 3 6.04 Intangible assets 4 4
53 Depreciation and amortization 54 57 3 5.686 Impairments 34 34
139 88 91 3 3.4
Depreciation and amortization increased by €3 million compared with 2013, owing to newly commissioned investments in tangible assets. The impairment of €34 million stems from the results of impairment tests and refers mainly to the SBR and Latex plants in Ravenna (€14 million) and the sites in Sarroch (€9 million), Porto Marghera (€7 million) and Ragusa (€4 million). The Versalis Group’s non-financial fixed assets have been grouped into Cash Generating Units (CGUs) and the impairment loss was determined by comparing the book value of each CGU with its value in use (determined by discounting to present value the expected cash flows deriving from use of the assets over a time horizon coinciding with the remaining average useful life of the CGU). The CGUs of the SRB and Latex plants in Ravenna, Sarroch, Porto Marghera and Ragusa have a value in use that is less than the value of the assets. The impairment, therefore, relates to investments made during the year at such sites and essentially refers to work carried out in order to maintain plant efficiency (including multi-year maintenance) and compliance with environmental and safety standards. These values are stated net of utilization of government grants relating to the plants in Sarroch and Priolo (€3 million). For further details, see Note 7 “Property, plant and equipment” in the Notes to the financial statements.
Net financial expenses
2012 (amounts in millions of euros) 2013 2014 Change % Ch.(34) Financial income (expense) related to net borrowings (41) (43) (2) 4.9(2) Income (expense) on derivative contracts (9) 10 19 n.s.(8) Exchange differences 4 (4) (8) n.s.(4) Other financial income (expense) (4) 4 (100.0)
3 Financial expenses capitalized 4 6 2 50.0(45) (46) (31) 15 (32.6)
Net financial expenses decreased by €15 million essentially owing to: (i) increased income from the fair value measurement of non-speculative commodity derivatives on exchange rate risks of €19 million; (ii) increased expenses classified as assets of €2 million. These effects are only partially offset by: (i) the worsening of net
25

Versalis / Directors’ Report on Operations/ Comments on the economic and financial results of Versalis SpA
exchange rate differences on commercial transactions of €8 million; (ii) the increase of €2 million in interest charges on financial debt in relation to the financing partner Eni SpA, in line with market conditions. The derivative instruments do not possess the formal requisites to be classified as “hedges” in accordance with IAS 39 and, therefore, the related fair value changes are recorded in the income statement.
Net income (expense) from investments
2012 (amounts in millions of euros) 2013 2014 Change % Ch.41 Dividends 9 1 (8) (88.9)
(111) (Additions to) Utilization of provisions for impairment of investments (114) (78) 36 (31.6)(80) (Additions to) Utilization of provisions to cover losses 2 (71) (73) n.s.
(150) (103) (148) (45) 43.7
The net expense from investments increased by €45 million mainly due to the allocation of €71 million to the provision to cover for losses relative to the investment Versalis France SAS , and the lower dividends received of €8 million, partially offset by the lower net accruals to the provision for impairment of investments of €36 million. The net provisions for equity impairments of €78 million refer to the provisions related to investments in Versalis France SAS (€63 million), Dunastyr (€6 million), Newco Tech SpA (€5 million) and Versalis UK Ltd (€4 million).
Income taxes
2012 (amounts in millions of euros) 2013 2014 ChangeCurrent tax assets
(36) IRES (28) (8) 201 IRAP
(35) (28) (8) 20(17) Deferred taxes (5) (3) 2
(119) Prepaid taxes (116) (162) (46)(136) (121) (165) (44)(171) (149) (173) (24)
The increase in income from income taxes of €24 million compared with 2013 was due primarily to higher net prepaid taxes of €44 million, only partly offset by the lower income resulting from the participation in Eni SpA’s national tax consolidation of €20 million.
26
Versalis / Directors’ Report on Operations/ Comments on the economic and financial results of Versalis SpA
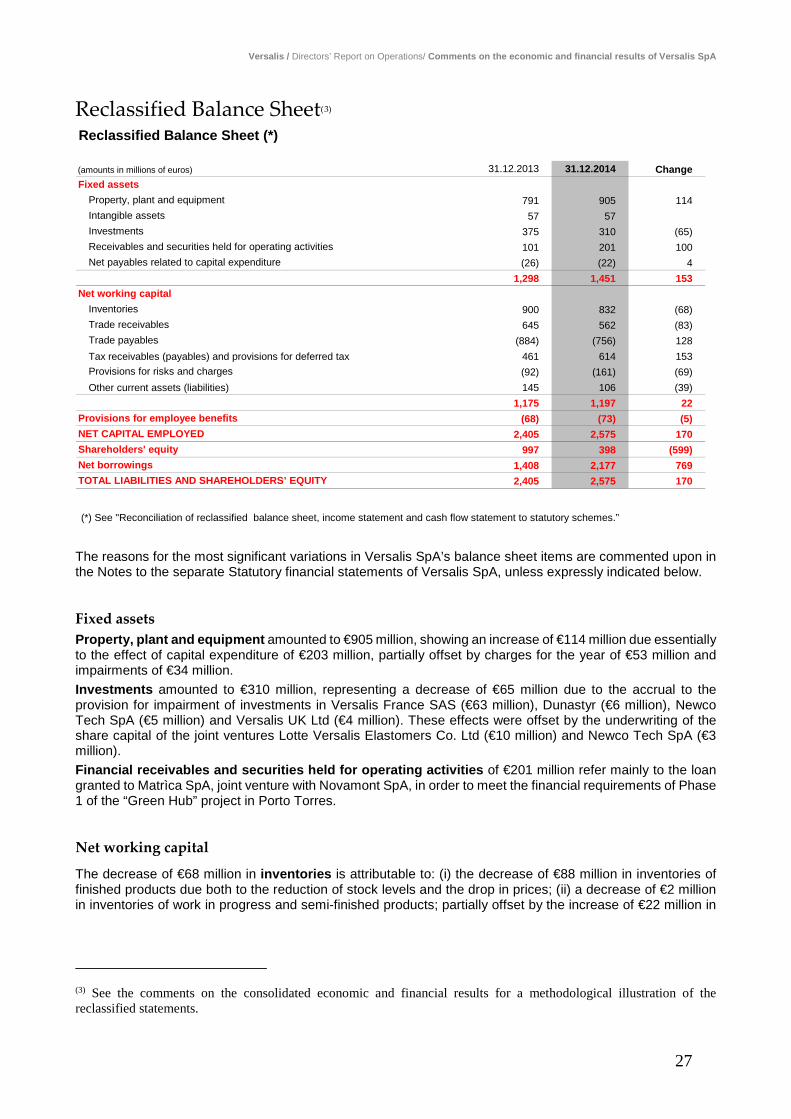
Reclassified Balance Sheet(3) Reclassified Balance Sheet (*)
(amounts in millions of euros) 31.12.2013 31.12.2014 ChangeFixed assets
Property, plant and equipment 791 905 114Intangible assets 57 57Investments 375 310 (65)Receivables and securities held for operating activities 101 201 100Net payables related to capital expenditure (26) (22) 4
1,298 1,451 153Net working capital
Inventories 900 832 (68)Trade receivables 645 562 (83)Trade payables (884) (756) 128Tax receivables (payables) and provisions for deferred tax 461 614 153Provisions for risks and charges (92) (161) (69)Other current assets (liabilities) 145 106 (39)
1,175 1,197 22Provisions for employee benefits (68) (73) (5)NET CAPITAL EMPLOYED 2,405 2,575 170Shareholders' equity 997 398 (599)Net borrowings 1,408 2,177 769TOTAL LIABILITIES AND SHAREHOLDERS’ EQUITY 2,405 2,575 170
(*) See "Reconciliation of reclassified balance sheet, income statement and cash flow statement to statutory schemes.” The reasons for the most significant variations in Versalis SpA’s balance sheet items are commented upon in the Notes to the separate Statutory financial statements of Versalis SpA, unless expressly indicated below.
Fixed assets Property, plant and equipment amounted to €905 million, showing an increase of €114 million due essentially to the effect of capital expenditure of €203 million, partially offset by charges for the year of €53 million and impairments of €34 million. Investments amounted to €310 million, representing a decrease of €65 million due to the accrual to the provision for impairment of investments in Versalis France SAS (€63 million), Dunastyr (€6 million), Newco Tech SpA (€5 million) and Versalis UK Ltd (€4 million). These effects were offset by the underwriting of the share capital of the joint ventures Lotte Versalis Elastomers Co. Ltd (€10 million) and Newco Tech SpA (€3 million). Financial receivables and securities held for operating activities of €201 million refer mainly to the loan granted to Matrìca SpA, joint venture with Novamont SpA, in order to meet the financial requirements of Phase 1 of the “Green Hub” project in Porto Torres.
Net working capital
The decrease of €68 million in inventories is attributable to: (i) the decrease of €88 million in inventories of finished products due both to the reduction of stock levels and the drop in prices; (ii) a decrease of €2 million in inventories of work in progress and semi-finished products; partially offset by the increase of €22 million in
(3) See the comments on the consolidated economic and financial results for a methodological illustration of the reclassified statements.
27

Versalis / Directors’ Report on Operations/ Comments on the economic and financial results of Versalis SpA
inventories of raw materials, supplies and consumables. These amounts include net allowances for impairment losses of €16 million (€7 million in 2013) for adjustment to market value of the remaining stock.
The decrease of €83 million in trade receivables derived mainly from the lower sales.
The decrease of €128 million in trade payables is due primarily to a reduction in the quantities of petroleum feedstock (virgin naphtha) purchased in the last quarter of 2014, compared with the same period of the previous year.
The increase in tax assets and net provisions for taxes of €153 million is mainly due to: (i) the allocation of net deferred tax assets of €166 million and (ii) the decrease of €9 million of payables to the parent company Eni SpA for participation in the national tax consolidation, due to the repayment of the advance payments received in excess in 2013. These effects were partially offset by the decrease of €26 million in the VAT receivables of the Group following the collection of prior receivables.
The increase of €69 million in provisions for risks and charges was due primarily to a €71 million accrual to cover for losses relating to the investment in Versalis France SAS and a €20 million accrual for disposal and restructuring relative to the divestment of the Sarroch Aromatics business, partially offset by the utilization of €17 million of the provision for redundancy incentives, the utilization of €4 million of the provision for litigation risks and the utilization of €1 million of the OIL unfunded losses insurance provisions.
The decrease of €39 million in other current net assets is mainly due to the decrease of €57 million in other receivables from third parties, the decrease of €8 million in receivables for the sale of licences, the decrease of €2 million of non-hedged derivatives, partially offset by the increase of €13 million of receivables from companies in the Eni Group, the increase of €11 million in advances to suppliers and the increase of €4 million of other receivables due from jointly controlled companies.
Shareholders' equity (amounts in millions of euros)
Shareholders' equity at December 31, 2013 997Total comprehensive loss for the year (594)Other changes (5)
Total changeShareholders' equity at December 31, 2014 398
Shareholders' equity amounted to €398 million representing a decrease of €599 million. This decrease was due essentially to the comprehensive loss for the year of €594 million. Other variations of €5 million concerned the effects on the reserve relating to employee benefits in compliance with IAS 19.
Net borrowings
(amounts in millions of euros) 31.12.2013 31.12.2014 ChangeShort-term debt 835 1,529 694Medium/long-term debt 601 671 70Cash and cash equivalents (28) (23) 5Net borrowings 1,408 2,177 769Shareholders' equity 997 398 (599)Leverage 1.41 5.47 4.06
The increase of by €769 million in net borrowings was primarily the result of the financial requirements related to the net cash flow from operating activities (- €444 million) and the net cash flow from investing activities (€322 million). For further information, see the comment on the Reclassified Cash Flow Statement.
28

Versalis / Directors’ Report on Operations/ Comments on the economic and financial results of Versalis SpA
Reclassified Cash Flow Statement
The net cash used by operating activities of €444 million and the financial requirement of €766million, generated primarily by capital expenditure (€207 million), investments in other companies and businesses (€13 million) and other loans granted to the joint venture Matrìca SpA (€101 million) were covered by an increase in short-term and long-term debt of €761 million, generating a negative net cash flow for the period of €5 million.
Reclassified Cash Flow Statement (*)
2012 (amounts in millions of euros) 2013 2014 Change(593) Net loss for the period (551) (594) (43)
Adjustments to reconcile net loss to net cash provided byoperating activities:
328 - depreciation, depletion, and amortization and other non monetary items 196 240 44(1) - net gains on disposal of assets 4 4
(181) - dividends, interest, taxes and other charges (122) (138) (16)(160) Changes in w orking capital 233 77 (156)
Dividends received, taxes (paid) received, interest (paid)130 received (27) (33) (6)
(477) Net cash flow provided by operating activities (271) (444) (173)(131) Capital expenditures (236) (207) 29(64) Investments and purchase of consolidated subsidiaries and businesses (399) (13) 386
5 Disposals 4 2 (2)Financial investments: f inancial receivables (100) (101) (1)
(13) Cash f low related to capital expenditures, investments and disposals 11 (3) (14)(680) Free cash flow (991) (766) 225
695 Change in short-term and long-term debt (16) 761 777Dividends paid and changes in non-controlling interest and reserves 1,000 (1,000)
15 NET CASH FLOW FOR THE PERIOD (7) (5) 2
Change in net borrowings
2012 (amount in millions of euros) 2013 2014 Change(680) Free cash flow (991) (766) 225
Exchange differences on net borrow ings and other changes (3) (3)Dividends paid and changes in non-controlling interest and reserves 1,000 (1,000)
(680) CHANGE IN NET BORROWINGS 9 (769) (778)
(*) See “Reconciliation of reclassif ied balance sheet, income statement and cash f low statement to statutory schemes”.
29

Versalis / Directors’ Report on Operations/ Comments on the economic and financial results of Versalis SpA
Reconciliation of the reclassified financial statements used in the Directors’ Report to statutory financial statements Reclassified Balance Sheet
Items of the Reclassified Balance Sheet Reference to Partial Amounts from Partial Amounts from(where not expressly indicated, the item notes on the amounts from reclassified amounts from reclassifiedderives directly from the statutory statement) financial statements Statutory format Statutory format(amounts in millions of euros) format formatFixed assetsProperty, plant and equipment 791 905Intangible assets 57 57Investments in subsidiaries, partnerships and jointventures and other investments 375 310
Receivables and securities held for operating activities, made up of: 101 201- other receivables 101 131- other non-current financial assets 70Net payables related to capital expenditures, made up of: (26) (22)- payables related to capital expenditures (see note 16) (26) (22)Total fixed assets 1,298 1,451Net working capitalInventories 900 832Trade receivables 645 562Trade payables (884) (756)Tax, made up of: 461 614- other tax payables (see note 17) (9) (8)- payables for tax consolidation (see note 16) (10) (1)- current tax assets (see note 4) 11 13- other current tax assets (see note 5) 1- deferred tax assets (see note 12) 412 578- receivables for Group VAT (see note 2) 54 28- receivables for IRES refund applications (see note 13) 3 3Provisions for risks and charges (92) (161)Other current assets and liabilities, made up of: 145 106- other receivables (see note 2) 208 178- other (current) assets (see note 6) 2 3- other receivables and other assets (see note 13) 1 1- advances, other payables (see note 16) (59) (62)- other (current) liabilities (see note 18) (1) (5)- other payables and other liabilities (see note 22) (6) (9)Total net working capital 1,175 1,197Provisions for employee benefits (68) (73)NET CAPITAL EMPLOYED 2,405 2,575Shareholders' equity 997 398Net borrowingsTotal debt, made up of:- long-term debt (see note 19) 601 671- current portion of long-term debt (see note 19) 2 3- short-term debt (see note 14) 833 1,526less:Cash and cash equivalents (see note 1) (28) (23)Total net borrowings 1,408 2,177TOTAL LIABILITIES AND SHAREHOLDERS’ EQUITY 2,405 2,575
31.12.2013 31.12.2014
30

Versalis / Directors’ Report on Operations/ Comments on the economic and financial results of Versalis SpA
Reclassified Cash Flow Statement
Items of the Reclassified Cash Flow Statement Partial Amounts from Partial Amounts fromand confluence/reclassification of items in the statutory format amounts from reclassified amounts from reclassified
Statutory format Statutory format(amounts in millions of euros) format formatNet loss (551) (594)Adjustments to reconcile net loss to net cash provided by operating activities:Depreciation and amortization and other non-monetary items 196 240
- depreciation and amortization 55 57- net impairment of tangible and intangible assets 34 34- impairments (writebacks) of investments 113 149- currency translation differences from alignment (3) 1- net change in provision for employee benefits (3) (1)
Net gains on disposal of assets 4Dividends, interest, income taxes and other charges (122) (138)
- dividend income (9) (1)- interest expense 37 36- income taxes (150) (173)
Changes in working capital 233 77- inventories 60 64- trade receivables 83 83- trade payables 107 (131)- change in provisions for contingencies (5) (3)- other assets and liabilities (12) 64
Dividends received, taxes paid, interest (paid) received during the period (27) (33)- dividends received 9 1- interest paid (34) (32)- income taxes received including tax credits rebated (2) (2)
Net cash flow provided by operating activities (271) (444)Capital expenditures (236) (207)
- tangible assets (235) (203)- intangible assets (1) (4)
Investments and purchase of consolidated subsidiaries and businesses (399) (13)- investments (396) (13)- businesses (3)
Disposals and partial sales of investments 4 2- investments 4 2Other cash flow related to capital expenditures, investments and disposal (89) (104)- financial investments: financial receivables (100) (101)- change in payables and receivables relating to investments 11 (3)
Free cash flow (991) (766)Change in short-term and long-term debt (16) 761
- proceeds from long-term finance debt 70- payments of non-current finance debt (3)- change in finance debt (16) 694
Dividends paid and changes in non-controlling interests and reserves: 1,000- net contributions (refunds) of own capital 1,000Net cash flow for the period (7) (5)
2013 2014
31

Versalis / Directors’ Report on Operations/ Risk factors and uncertainties
Risk factors and uncertainties Introduction The main business risks, identified and actively managed by the Versalis Group, are country risk and operational risk. These risks, and the methods of managing them, are described below. For a description of financial risks, see the specific section of the notes to the consolidated financial statements. Country risk All of the Versalis Group’s production plants are located within European Union countries. Purchases and sales are made mainly in Italy and in Europe. The Group, therefore, has no significant interests in countries that are politically or economically unstable. In any case, the Versalis Group periodically monitors the political, social and economic risks of the countries in which it operates, paying attention also to any penalizing changes in the legislative framework, in particular those of a fiscal nature, in order to minimize the impact on the Group. Operational risk The Versalis Group’s business, by nature, involves industrial and environmental risks and is subject, in most countries where the Versalis Group operates, to laws and regulations regarding environmental protection and industrial safety. For example, in Europe, the Versalis Group owns and operates industrial facilities that are subject to a high risk of accidents and for which the Versalis Group has adopted standards and procedures that meet the criteria of the European Union’s “Seveso II” Directive. The wide spectrum of the Group’s activities involves a vast range of operational risks such as explosions, fires, harmful gas emissions, toxic product leakage and the creation of non-biodegradable waste. These events could damage or destroy the plants, and cause harm to persons or damage to the surrounding environment. Moreover, as industrial operations may be carried out in ecologically sensitive areas, each site requires a specific approach to minimize the impact on the ecosystem involved, on biodiversity and on the health of the local population.
The Versalis Group has adopted the highest standards for assessing and managing industrial and environmental risks, bringing its conduct into line with industry best practices. The Versalis Group has, over time, obtained the ISO14001 and OHSAS18001 System Certifications (see the paragraph “Environmental Responsibility”). In developing and managing operations, the business units apply the laws and regulations of the countries in which they operate and they assess the industrial and environmental risks using specific procedures. Any environmental emergency is managed by the business units at site level, with an emergency response plan for each possible scenario, detailing the actions to be taken to limit the damage, as well as identifying the persons responsible for ensuring that these actions are taken. As illustrated in the “Environmental responsibility” section of the Director’s report, most of the Versalis Group’s products are subject to the REACH legislation that regulates the obligations of registration and authorization of the products themselves, not only by the company, but also by its suppliers, as a condition necessary for their manufacture and commercialisation on the market. The Versalis Group complies with this legislation and requires the same to its suppliers during the pre-qualification stage for awarding contracts The integrated approach to health, safety and environmental issues is fostered by the application of an HSE Management System at all levels of the Eni Business Units and companies, which bases its methodological approach on the Eni HSE Management System model. This system is based on an annual cycle of planning, implementation, control, review of results and definition of new objectives. It is aimed at the prevention of risks, systematic monitoring, and control of HSE performance within a continuous improvement cycle, which also envisages that these processes be audited by internal and external personnel. Capital management The Versalis management uses leverage to assess the degree of solidity and efficiency of the asset structure in terms of relative proportion of sources of financing between own and third-party assets, as well as to carry out benchmark analysis with the industry standards. Leverage measures the degree of company indebtedness and is calculated as the ratio between net borrowings and shareholders’ equity. The Management’s aim in the medium term is to maintain a solid financial structure epitomized by a leverage ratio of not more than 1.
32

Versalis / Directors’ Report on Operations/ Risk factors and uncertainties
Fair value of financial instruments The classification of financial assets and liabilities is indicated below; these are measured at fair value in the Balance Sheet according to the fair value hierarchy defined on the basis of the significance of the inputs used in the measurement process. In particular, on the basis of the features of the inputs used in making the measurements, the fair value hierarchy has the following levels:
- Level 1: prices quoted (and unadjusted) in active markets for identical financial assets or liabilities; - Level 2: measurements carried out on the basis of inputs, other than the quoted prices as above, which,
for the assets and liabilities to be measured, can be observed directly (e.g. prices) or indirectly (e.g. deriving from prices);
- Level 3: inputs not based on observable market data. In relation to the above, the Versalis Group’s financial instruments carried at fair value at December 31, 2014 regard “level 2” derivative contracts. In carrying out its business, Versalis uses various kinds of financial instruments. The market value of the company’s financial instruments is substantially in line with their book values, for the following reasons:
• receivables included in current assets: the market value of trade, financial and other receivables falling due within one year is estimated to be practically equivalent to the respective book value because of the short interval between the origin of the receivable and its due date;
• financial payables included in non-current liabilities: the market value of financial payables falling due after one year, including the short-term portion, is estimated to be substantially equal to the book value, because they were entered into at fixed market rates;
• trade, financial and other payables included in current liabilities: the market value of trade, financial and other payables falling due within one year is estimated to be practically equivalent to the book value because of the short interval between the origin of the payable and its due date;
• other non-current financial assets and liabilities: other non-current financial assets and liabilities are of an immaterial amount.
Environmental regulations As regards environmental risk, given the steps already taken, the insurance policies signed and the provisions for risk already accrued, Versalis does not expect to incur any particularly significant negative effects on the financial statements as a result of compliance with environmental legislation. However, we cannot rule out with certainty the risk that Versalis may have to bear further costs or liabilities, even of significant proportions, as it is impossible, on the basis of current knowledge, to predict the effects of future developments, taking into account the following aspects, among others: (i) the possibility of as yet unknown contamination; (ii) the results of the ongoing surveys and the other possible effects of statements required by Decree no. 152/2006 of the Ministry of Environment; (iii) new developments in environmental regulation; (iv) the effect of possible technological changes relating to future remediation; (v) the possibility of litigation and the difficulty of determining the eventual consequences, also considering the responsibility of other parties and eventual insurance indemnity. As explained in greater detail in the notes to the financial statements (section “Accounting policies – Grants”), the environmental costs of action to be taken at the manufacturing facilities acquired by the Versalis Group through the business contribution by Syndial SpA are covered by a specific warranty issued by the conferrer. Emissions trading Italian Legislative Decree No. 216 of April 4, 2006 implemented the Emission Trading Directive 2003/87/EC concerning greenhouse gas emissions and Directive 2004/101/EC concerning the use of carbon credits deriving from projects for the reduction of emissions based on the flexible mechanisms devised by the Kyoto Protocol. In relation to the European Emissions Trading Scheme (ETS), which has been operational since January 1, 2005, on November 27, 2008, the National Committee for Management and Implementation of Directive 2003/87/EC published Resolution 20/2008 assigning the emissions allowances for the 2008-2012 period to the existing plants. It should be noted that, at the request of the European Commission, changes were made by the National Committee for Management and Implementation of Directive 2003/87/EC, which expanded the scope of application of the Directive with respect to the provisions in force for the period 2005-2007, extending it to certain types of combustion plants, including those present in the steam cracking plants (see also the paragraph “Commitments for sustainable development” in the Directors' Report attached to the consolidated financial statements).
33

Versalis / Directors’ Report on Operations/ Risk factors and uncertainties
On the basis of the estimates of the emissions made, at December 31, 2014, the Versalis Group presents an overall surplus emissions rights position (a so-called “long position”)(4); therefore, in accordance with the accounting criteria adopted, management shall recognize the income from the surplus rights at the moment of sale thereof.
4 Provisional data: the definitive data will be available only after the final results have been certified by the Accredited Auditor. This, however, will not affect the company's position, which will certainly remain long.
34
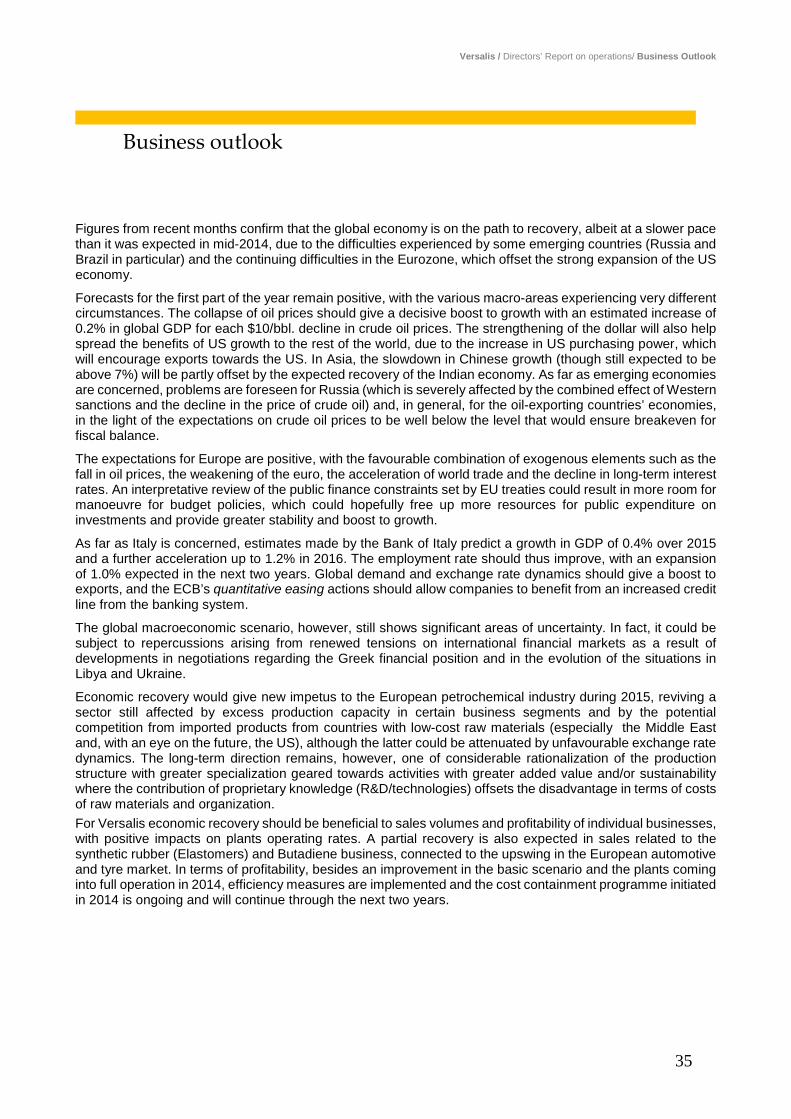
Versalis / Directors’ Report on operations/ Business Outlook
Business outlook
Figures from recent months confirm that the global economy is on the path to recovery, albeit at a slower pace than it was expected in mid-2014, due to the difficulties experienced by some emerging countries (Russia and Brazil in particular) and the continuing difficulties in the Eurozone, which offset the strong expansion of the US economy.
Forecasts for the first part of the year remain positive, with the various macro-areas experiencing very different circumstances. The collapse of oil prices should give a decisive boost to growth with an estimated increase of 0.2% in global GDP for each $10/bbl. decline in crude oil prices. The strengthening of the dollar will also help spread the benefits of US growth to the rest of the world, due to the increase in US purchasing power, which will encourage exports towards the US. In Asia, the slowdown in Chinese growth (though still expected to be above 7%) will be partly offset by the expected recovery of the Indian economy. As far as emerging economies are concerned, problems are foreseen for Russia (which is severely affected by the combined effect of Western sanctions and the decline in the price of crude oil) and, in general, for the oil-exporting countries’ economies, in the light of the expectations on crude oil prices to be well below the level that would ensure breakeven for fiscal balance.
The expectations for Europe are positive, with the favourable combination of exogenous elements such as the fall in oil prices, the weakening of the euro, the acceleration of world trade and the decline in long-term interest rates. An interpretative review of the public finance constraints set by EU treaties could result in more room for manoeuvre for budget policies, which could hopefully free up more resources for public expenditure on investments and provide greater stability and boost to growth.
As far as Italy is concerned, estimates made by the Bank of Italy predict a growth in GDP of 0.4% over 2015 and a further acceleration up to 1.2% in 2016. The employment rate should thus improve, with an expansion of 1.0% expected in the next two years. Global demand and exchange rate dynamics should give a boost to exports, and the ECB’s quantitative easing actions should allow companies to benefit from an increased credit line from the banking system.
The global macroeconomic scenario, however, still shows significant areas of uncertainty. In fact, it could be subject to repercussions arising from renewed tensions on international financial markets as a result of developments in negotiations regarding the Greek financial position and in the evolution of the situations in Libya and Ukraine.
Economic recovery would give new impetus to the European petrochemical industry during 2015, reviving a sector still affected by excess production capacity in certain business segments and by the potential competition from imported products from countries with low-cost raw materials (especially the Middle East and, with an eye on the future, the US), although the latter could be attenuated by unfavourable exchange rate dynamics. The long-term direction remains, however, one of considerable rationalization of the production structure with greater specialization geared towards activities with greater added value and/or sustainability where the contribution of proprietary knowledge (R&D/technologies) offsets the disadvantage in terms of costs of raw materials and organization. For Versalis economic recovery should be beneficial to sales volumes and profitability of individual businesses, with positive impacts on plants operating rates. A partial recovery is also expected in sales related to the synthetic rubber (Elastomers) and Butadiene business, connected to the upswing in the European automotive and tyre market. In terms of profitability, besides an improvement in the basic scenario and the plants coming into full operation in 2014, efficiency measures are implemented and the cost containment programme initiated in 2014 is ongoing and will continue through the next two years.
35

Versalis / Directors’ Report on operations/ Other information
Other information
Transactions with related parties The transactions with related parties carried out by Versalis SpA and the companies included in its consolidation area involve mainly the trading of goods, the performance of services, the provision/receipt of funding and the use of financial resources with the parent company Eni SpA and with companies directly or indirectly controlled by the latter, and with its own non-consolidated subsidiaries and associates, and with other State-owned or controlled companies. All of the transactions carried out form part of ordinary operations and took place at arm’s length, that is, at conditions that would have been applied by independent parties on the open market. Under the provisions of applicable laws, the company has adopted internal procedures to ensure transparency and the substantial and procedural correctness of the related party transactions, carried out by the company itself or by its subsidiaries. The amounts of the trade, financial and other transactions carried out with related parties and a description of the type of major transactions, as well as the impacts thereof on the equity, the economic results and the cash flows, are disclosed in the notes to the financial statements.
Treasury shares and shares in parent company In accordance with the regulations of Art. 2428, clause 3, points 3 and 4 of the Italian Civil Code, it is hereby confirmed that Versalis SpA and its subsidiaries do not own nor have they been authorized by their respective Shareholders' Meetings to purchase shares in either Versalis SpA or in Eni SpA.
Advances against services received from Syndial As regards the transfer of the “Production plants, services and utilities of the Porto Torres works” business unit, with effect as from January 11, 2007, in accordance with the agreements signed by the parties, the conferrer Syndial SpA paid the receiver Versalis SpA the sum of €96 million as an advance against the obligation assumed by Versalis SpA to keep the plants operating for at least five years (that is, until December 31, 2011). During this five-year period, Versalis SpA formally advised Syndial SpA at the end of each year, that the plants had been in operation and that, therefore, the annual portion of the advance payment was considered effectively earned and due. The agreements also envisaged that, had the above plants been definitively shut down, Versalis SpA would have promptly notified Syndial SpA, returning the portion not accrued relating to the period running from the definite shutdown to December 31, 2011 (€1.6 million per full month or fraction of a month of more than 15 days). On this point, the shutdowns that occurred in June 2011 following the “Memorandum of Understanding for Green Chemistry at Porto Torres” (signed by the Government, the Regional Authorities, Eni, Novamont, Versalis SpA, Syndial, Enipower and the trade unions) did not entail the return of the advances. Moreover, as provided for in the above-mentioned agreements, at the end of the first three years (and, therefore, on January 1, 2010) the parties asked the auditing firm KPMG SpA to carry out an audit on the effective amount of the losses recorded at the site. Given that these were found to be higher than it was originally envisaged in the business plan, on the basis of which the amount of €96 million was determined, on December 14, 2010 Syndial supplemented the above advance with a payment of €104 million, thus reaching the contractually defined maximum amount. Considering the evident correlation between the agreements described above and the grant operation, it was decided that, for the purpose of preparing the financial statements, the advance of €96 million and the supplement of €104 million should be accounted for by adopting the principles applicable to the main grant transaction. Given that this grant took place between entities subject to common control, reference was made to the provisions of the OPI1 document issued by Assirevi. This establishes that, applying the principle of consistency of values, any adjustments made must be recorded by means of a contra-entry in a shareholders' equity reserve of the receiving company. Versalis SpA initially recorded the advance payment of €96 million and the supplement of €104 million received from Syndial SpA under “other payables for advances received” bearing in mind that, being a company subject
36

Versalis / Directors’ Report on Operations/ Other information
to the direction and coordination of Eni SpA, any decisions about the early closure of the site are not the exclusive responsibility of the Company's directors. At the end of each year, once it has been established that the annual portion could be considered definitively accrued, it was charged to a specific shareholders' equity reserve.
Significant events after the reporting date On January 15, 2015, Versalis SpA, after signing an agreement to supply ethylene with an important trading partner, announced the temporary restart of the Porto Marghera cracking plant. Production was officially restarted on February 9, 2015. On February 11, 2015 Versalis SpA’s Board of Directors approved the reorganization of the investments in Asia, concluding that Versalis SpA should purchase the entire share capital of Versalis Pacific Trading (Shanghai) Co. Ltd, currently owned by Eni Chemicals Trading (Shanghai) Co. Ltd, and deciding upon the transfer to Versalis Pacific Trading (Shanghai) Co. Ltd of the personnel currently employed at Eni Chemicals Trading (Shanghai) Co. Ltd and the subsequent winding up of Eni Chemicals Trading (Shanghai) Co. Ltd.
37

Versalis / Directors’ Report on Operations/ Commitment to sustainable development
Commitment to sustainable development Introduction The main commitments undertaken by the Company in terms of sustainable development are indicated below, with particular reference to the following areas: personnel, environment, territorial relationships and local development, and technological innovation. Personnel The number of employees working for the Group companies at December 31, 2014 amounted to 5,258.
2012 Employees 2013 2014 4,674 Italy 4,665 4,306 1,050 Abroad 1,080 952 5,724 5,745 5,258
The reduction of 487 staff compared with December 31, 2013 was determined by the following:
increases: 86 people were recruited, 33% of whom were graduates;
reductions: 223 employees were transferred following the divestment of the Sarroch business;
114 employees left the company for ordinary reasons (retirement, resignation, consensual termination, and transfer to Matrìca SpA); 114 employees left the Company under ordinary redundancy procedures, in accordance with Law No. 223/91; 118 employees of Versalis UK left following the closure of the Hythe plant; 4 employees, representing the net negative balance resulting from transfers within the Eni Group.
The breakdown by category is as follows:
2012 Employees 2013 2014 111 Senior Managers 113 112
3,341 Managers and employees 3,448 3,201 2,272 Workers 2,184 1,945 5,724 5,745 5,258
The distribution of permanent employees by age group is shown below:
Age group Total % < 30 501 9.5 30-39 1,401 26.7 40-49 1,844 35.1 50-60 1,334 25.4
> 60 178 3.4 5,258 100.0
38

Versalis / Directors’ Report on Operations/ Commitment to sustainable development
As at December 31, 2014, the number of employees in service in the Group companies was 5,220.
Employees 2013 2014Senior Managers 110 108 Managers and employees 3,429 3,169 Workers 2,169 1,943
5,708 5,220
The number of employees in service is obtained by subtracting those employees seconded to other companies from the total number of employees on the payroll and adding those seconded from other companies.
Employees of Versalis SpA and of its subsidiaries seconded to other companies of the Eni Group, to other entities, or on leave, numbered 80, while those seconded to Versalis SpA from other companies of the Eni Group numbered 42.
Training
The training programmes in Italy and in the foreign subsidiaries covered 170,000 man-hours in 2014. This activity was provided mostly using internal resources, but also with the support of Eni Corporate University SpA. Consolidation of the know-how of certain specialist areas was provided by qualified trainers from outside the Eni Group.
The financial resources used included €2 million of direct costs, €1 million of which towards Eni Corporate University SpA. Specific examples over the year include: - ongoing commitment to the institutional training of new recruits, carried out in-house for those just graduated from high school, and also using the services of Eni Corporate University SpA for young graduates, using the editions in English for foreign subsidiaries; - significant commitment to training and information on environmental, health, safety and quality issues for a total of approximately 73,000 hours, including both classroom lessons and on-the-job training; - training initiatives aimed at extending to all personnel a full knowledge of compliance requirements, in order to make them aware of the guidelines, regulations and internal procedures designed to ensure observance of the relevant legislation in the conducting of Versalis SpA and Eni SpA's business; - attendances at refresher and advanced seminars held at Eni Corporate University SpA or other qualified external organizations, for the development and reinforcement of the transversal skills and specialist know-how of resources operating in the various corporate areas.
Incentive and remuneration systems
In keeping with the merit-based policy linked to roles and responsibilities, Versalis SpA consolidated its variable performance-based incentive system for senior managers and managers, setting individual targets in line with the company's general objectives. In 2014, performance assessment involved almost all senior managers and managers, identified on the basis of their assigned operating and management responsibilities. The incentive policy is linked to the achievement of results and the level of contribution provided. Furthermore, in 2014 the incentive system was confirmed for the sales force operating within Europe. A long-term incentive system, in line with the practices and policies of the Eni Group, is in place for those executives with greater strategic responsibilities, whose actions have an impact on the results of operations.
Environmental responsibility The final figures, which give a significant indication of the commitment of economic resources by Versalis SpA regarding the protection of the health of its workers and of the environment, as well as the implementation of preventive measures to guarantee safety in the workplace and the protection against industrial risks of local communities in which the company operates, are as follows: - €185 million for expenses in the period (€192 million in 2013) of which €30 million for ordinary maintenance
(€36 million in 2013) and €155 million of current expenses (€156 million in 2013); - €46 million for capitalized investments (€51 million in 2013).
39

Versalis / Directors’ Report on Operations/ Commitment to sustainable development
Environmental activities amounted to €130 million (including polluted area and aquifer management activities), safety activities amounted to €91 million and Management and Health activities amounted to €9 million.
With regard to the control of greenhouse gas emissions, another important issue for environmental protection, 2014 ended with a final balance of CO2 emissions, which represented once again the historic low for the company (2.98 million metric tons5 in 2014, against 3.57 million metric tons in 2013). As we all know, in the past few years, as a result of both the cyclical nature of trends in the chemicals market, and of the economic crisis which afflicted all markets, production volumes, and consequently the emissions related to energy production, have been steadily decreasing. The results for 2014, therefore, can be summarized as: - quotas allocated in 2014: 3.59 million metric tons of CO2; - 2014 emissions: 2.98 million metric tons of CO2; - surplus: 0.61 million metric tons of CO2;
The work of supporting Italian and foreign sites on all safety aspects is continuing. Moreover, visits (road shows) were organized at the operational sites with the aim of raising the awareness of the company and third party personnel on safety issues, the fight against corruption, supplier qualification and feedback.
In particular, with regard to accident prevention, the following results were obtained for company and contractor personnel:
Italian and abroad 2013 2014No. of incapacitating accidents 9 4 Frequency rate 0.57 0.28 Severity index 0.038 0.017
In 2014, 17 Versalis sites out of 18 achieved the target of “an entire year without employee accidents”: Versalis International SA (second consecutive year), green chemistry research centre in Novara (second consecutive year), Porto Marghera (second consecutive year), Grangemouth, Dunkirk (second consecutive year), Oberhausen, Ravenna, Sarroch, Hythe (third consecutive year), Priolo (sixth consecutive year), Ragusa (seventh consecutive year), Brindisi (fifth consecutive year), Ferrara, Porto Torres, San Donato Milanese and Trieste (seventh consecutive year), Szàzhalombatta (fourth consecutive year), Eni Chemicals Trading Shanghai (second consecutive year). In addition to safeguarding the physical integrity of employees, the company’s responsibility for health protection is increasingly extending beyond a strictly business/operational dynamic to a more social perspective, with the activation of programmes aimed at promoting health.
Health protection activities are managed according to a system which is strongly focused on prevention, with integrated annual standard programmes and campaigns for environmental surveys and health checks. In particular, in view of the risks from exposure to carcinogenic chemical agents and mutagens, environmental measurements and personal exposure measurements are supplemented by biological monitoring activities aimed at assessing the dose absorbed by workers.
The 2014 System Certification results, regarding the company’s manufacturing sites, are as follows: - Italian Sites: all facilities (Priolo and Ragusa considered as a single site), including the San Donato
Milanese office, are ISO 14001 and OHSAS 18001 certified. Two sites are EMAS certified (Mantua and Ferrara);
- foreign Sites: all sites are ISO 14001 and OHSAS 18001 certified; - Versalis International (Brussels and branches), the Green Chemistry research centre in Novara and the
Brindisi Servizi Generali consortium obtained the OHSAS 18001 standard for health and safety management systems and the ISO 14001 and OHSAS 18001 have been extended.
As regards the remediation of soil and groundwater, aquifer pumping systems have been installed as preventive measures and are active at the Brindisi, Ferrara, Mantua, Porto Marghera, Priolo and Sarroch sites. The pumping systems, evaluated at the end of 2014, pump an estimated total of 5 million cubic metres of water
5 Provisional final balance pending completion of certification activities.
40

Versalis / Directors’ Report on Operations/ Commitment to sustainable development
a year, in line with forecasts. The Mantua, Ravenna, Ferrara, Brindisi and Sarroch sites are being or have been monitored for soil gas, in order to directly assess the risks associated with volatilization paths.
With regard to remediation, the authorization procedure provided for by law was completed with the approval of projects at the sites in: Gela (groundwater), Porto Marghera (groundwater and soil), Priolo (groundwater and soil in the area south of Vallone della Neve), Ferrara (confined groundwater and surface aquifer and soil), Ravenna (surface aquifer and soil), Sarroch (groundwater) and Ragusa (remediation of the ex-topping area). The soil and groundwater remediation project for the Mantua site has been approved limited to the removal of the supernatant and to some specific areas. Work has begun at Porto Marghera, Priolo, Ferrara, Sarroch and Ravenna. At the Porto Torres facility, the groundwater and soil situation is monitored and managed by Syndial, since Versalis operates under leasehold at this site.
Versalis has entrusted Syndial, centre of excellence for remediation activities in Eni, with a number of activities at the sites of Mantua, Ferrara, Brindisi, Ravenna, Sarroch, Porto Marghera, Priolo, following an agreement signed between the two companies in September 2012.
With regard to Quality Control in 2014, internal audits were carried out on the Quality Management System (ISO 9001) at all of the Italian production sites, including the headquarters, the sales office in Trieste, and also at production sites outside of Italy, Versalis International SA and the related branch offices in UK, Hungary, France and Germany. In addition, audits were carried out on 24 companies performing the following activities/processes on behalf of Versalis SpA: contract work, storage of Versalis products, chemical analysis, procurement, packaging, handling, storage, shipment, calibration and weighing.
During 2014, the cycle of surveillance audits was completed with the aim of maintaining certification for the Quality Management System (ISO 9001) for all Italian sites.
In 2014, the “Toxproof” certification was obtained by the TÜV Laboratory for the application of EPS in pillows for expectant mothers.
41

Versalis / Directors’ Report on Operations/ Commitment to sustainable development
Technological innovation During 2014 research and technological innovation activities were directed at the ongoing improvement of processes and products of the existing business lines. Moreover, research and development activities in the green chemistry sector have been strengthened, with intensified commitment. In particular, the most interesting results include: Green chemistry
During 2014, a strategic partnership was established with Elevance Renewable Sciences Inc. - a company specializing in high value-added products obtained from vegetable oils - aimed at the development and industrialization of chemical intermediates for use in high value-added application sectors such as detergents and biolubricants, to be produced in synergy with the green fuels made by Eni in the green refinery. Within the context of the development of oilfield chemicals, formulations for drilling fluids with high performance capabilities derived from renewable sources produced by Solazyme are currently being marketed. Solazyme is a US company that has developed a production technology for the fermentation of microalgae using sugars. Moreover, as part of the innovative technological platform for the production of natural rubber using alternative biomass sources (non-food feedstock), both the activities for developing the agronomic protocol and those for engineering the extraction plant with water are being consolidated.
Elastomers Breakthrough technologies were developed during 2014. These were aimed at developing new butadiene-based copolymers, characterized by controlled sequences of amorphous and crystalline blocks, which enable innovative materials to be designed, also for high performance tyre applications. As part of the development of new materials based on styrene-butadiene copolymers (sSBR) a recipe for some new functionalized grades has been finalized for tyre applications which, owing to the balanced composition of monomers, guarantees enhanced tyre performances with regard to adhesion to wet surfaces as well as rolling resistance, a factor that reduces energy consumption at constant mileage. Moreover, again in the high performance tyre sector, new formulations of sSBR and BR have been developed for tyre applications.
Polyethylene As part of the strategic project for expanding the portfolio of low/very low density products (VLDPE), a grade for food packaging was successfully launched and grades have been approved for the wire and cable sector produced with Z/N modified proprietary catalysts. The research commitment towards the targeted compounding sector was also consolidated during the year and, in particular, the development of formulations based on thermoplastic elastomer (SEBS) and LLDPE/EVA blends for application sectors such as high mechanical performance industrial packaging. Exploratory activities have also been launched, focused on developing composite materials based on polyethylene mixed with nano fillers of vegetable or mineral origin, as well as the development of products for food packaging mixed with antimicrobials of vegetable origin (smart packaging sector).
Styrenes Various production trials have been carried out during 2014, aimed at optimizing the formulation of expandable polystyrene with new bromine-free flame-retardants. This aspect is of strategic importance for the construction industry which requires high performance materials for thermal insulation that are at the same time environmentally sustainable, in other words, without the ecotoxic additives that will soon be banned from the European market. Furthermore, within the expansion of the product portfolio in the ABS and AES (acrylonitrile-butadiene-styrene and acrylonitrile-ethylene-propylene-styrene based copolymers, respectively) application sectors, production recipes have been consolidated at laboratory level and at the pilot plant which are able to obtain new high mechanically resistant and thermo-oxidative materials and lower production costs while maintaining the same performance level.
42

Versalis / Directors’ Report on operations/ Other information
Other compliance information
Declaration in accordance with Legislative Decree No. 196 of June 30, 2003 Versalis SpA declares that the Data protection security planning document required under the terms of Legislative Decree No. 196 of June 30, 2003 has been drawn up and updated. Secondary head offices In accordance with the provisions of Art. 2428, clause 4, of the Italian Civil Code, it is hereby confirmed that Versalis SpA has no secondary head offices.
Administrative and Accounting separation of the electricity business In addition to the petrochemical sector, Versalis SpA also operates in the power sector, producing energy almost exclusively for internal consumption and selling modest quantities to third parties. As of 2013, the ratio between the quantity of electric energy and thermal energy that can be produced in a cogeneration arrangement at Versalis’ three thermoelectric power plants is less than 1. Furthermore, the plants do not satisfy the definition set forth in Resolution no. 42/02. This results in the exclusion of the three power plants from “Production of electric energy” and their classification in “Other activities”.
It should also be noted that, as of January 1, 2014 Versalis SpA became a provider for the “sale of electricity to free market customers”. For this reason Versalis, as of 2014, prepares separate annual accounts in accordance with Resolution 11/2007 of the Italian Energy & Water Authority.
43

versalis
Consolidated Financial Statements 2014
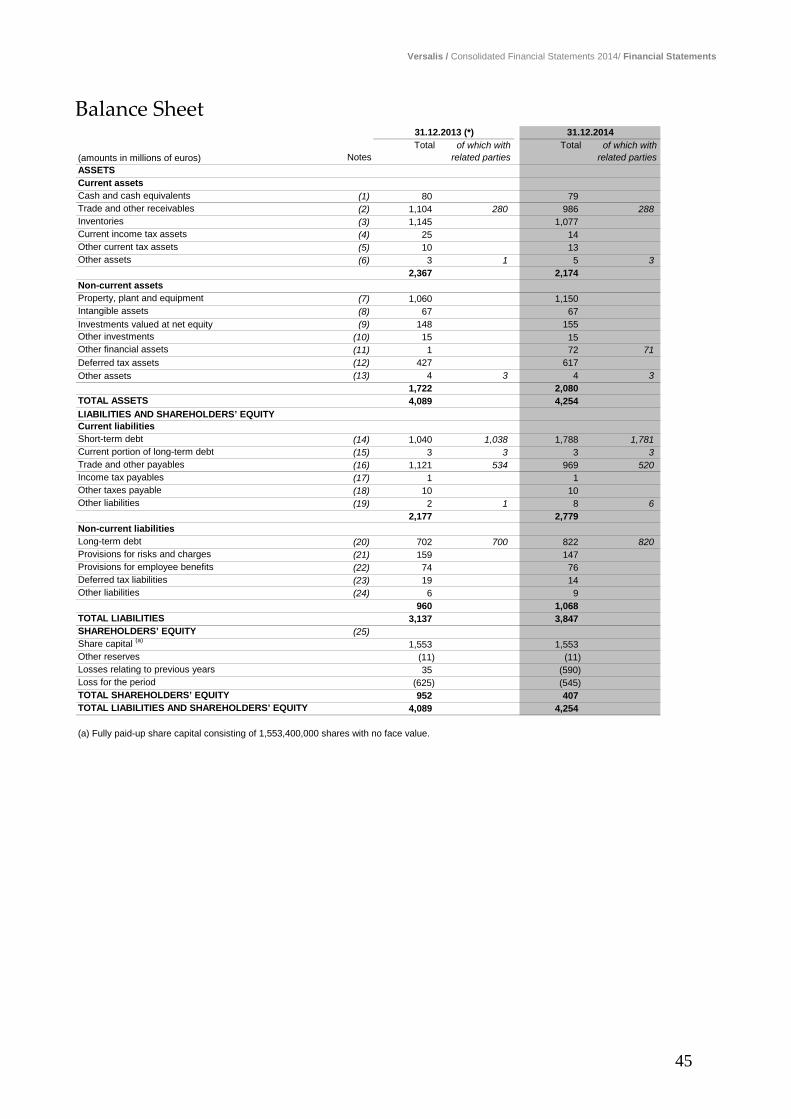
Versalis / Consolidated Financial Statements 2014/ Financial Statements
Balance Sheet
(amounts in millions of euros) NotesTotal of which with
related partiesTotal of which with
related partiesASSETSCurrent assetsCash and cash equivalents (1) 80 79 Trade and other receivables (2) 1,104 280 986 288 Inventories (3) 1,145 1,077 Current income tax assets (4) 25 14 Other current tax assets (5) 10 13 Other assets (6) 3 1 5 3
2,367 2,174 Non-current assetsProperty, plant and equipment (7) 1,060 1,150 Intangible assets (8) 67 67 Investments valued at net equity (9) 148 155 Other investments (10) 15 15 Other financial assets (11) 1 72 71 Deferred tax assets (12) 427 617 Other assets (13) 4 3 4 3
1,722 2,080 TOTAL ASSETS 4,089 4,254 LIABILITIES AND SHAREHOLDERS’ EQUITYCurrent liabilitiesShort-term debt (14) 1,040 1,038 1,788 1,781 Current portion of long-term debt (15) 3 3 3 3 Trade and other payables (16) 1,121 534 969 520 Income tax payables (17) 1 1 Other taxes payable (18) 10 10 Other liabilities (19) 2 1 8 6
2,177 2,779 Non-current liabilitiesLong-term debt (20) 702 700 822 820 Provisions for risks and charges (21) 159 147 Provisions for employee benefits (22) 74 76 Deferred tax liabilities (23) 19 14 Other liabilities (24) 6 9
960 1,068 TOTAL LIABILITIES 3,137 3,847 SHAREHOLDERS’ EQUITY (25)Share capital (a) 1,553 1,553 Other reserves (11) (11)Losses relating to previous years 35 (590)Loss for the period (625) (545)TOTAL SHAREHOLDERS’ EQUITY 952 407 TOTAL LIABILITIES AND SHAREHOLDERS’ EQUITY 4,089 4,254
(a) Fully paid-up share capital consisting of 1,553,400,000 shares with no face value.
31.12.2013 (*) 31.12.2014
45

Versalis / Consolidated Financial Statements 2014/ Financial Statements
Profit and Loss Account
of which with of which with(amounts in millions of euros) Notes Total related parties Total related partiesREVENUES (27)Net sales from operations 5.859 299 5.284 266Other income and revenues 149 71 122 93Total revenues 6.008 5.406OPERATING EXPENSES (28)Purchases, services and other costs (6.247) (3.169) (5.539) (2.487)Payroll and related costs (373) (2) (357)OTHER OPERATING (EXPENSE) INCOME (29) (1) (1) (27) (27)
DEPRECIATION, AMORTIZATION AND IMPAIRMENT (30) (125) (185)OPERATING PROFIT (LOSS) (738) (702)FINANCIAL INCOME (EXPENSE) (31)Financial income 58 2 35 11Financial expense (102) (48) (76) (47)Derivatives (9) (9) 11 11
(53) (30)INCOME (EXPENSE) FROM INVESTMENTS (32)Share of profit (loss) of equity-accounted investments (3) (3)
(3)PROFIT (LOSS) BEFORE INCOME TAXES (791) (735)Income taxes (33) 166 190LOSS FOR THE PERIOD (625) (545)
2013 2014
Comprehensive loss
2013 2014(amounts in millions of euros)LOSS FOR THE PERIOD (625) (545)Other items of comprehensive loss:Valuations of defined-benefit plans for employees 2 (5)Foreign currency translation differences (1) 4Tax effect relative to the other components of the comprehensive loss that cannot be reclassified to the profit and loss account (1) 1TOTAL COMPREHENSIVE LOSS FOR THE YEAR (625) (545)
46

Versalis / Consolidated Financial Statements 2014/ Financial Statements
Statement of Changes in Shareholders’ Equity
(amounts in millions of euros) Shar
e ca
pita
l
Exch
ange
diff
eren
ces
rese
rve
Port
o To
rres
con
trib
utio
n re
serv
e
Oth
er re
serv
es
Ret
aine
d ea
rnin
gs /(
loss
es
brou
ght f
orw
ard)
Loss
for t
he p
erio
d
Tota
l
Balances at December 31, 2012 1.553 (5) 101 (5) (491) (573) 580Loss for the year 2013 (625) (625)Other items of comprehensive loss:
Revaluation of defined-benefit plans for employees net of tax effect 1 1Foreign currency translation differences (1) (1)
Total comprehensive loss for the year 2013 (b) (1) 1 (625) (625)Transactions with shareholders:
Allocation of loss for the year 2012 (573) 573Reduction of share capital and loss coverage (1.000) (101) (1) 1.102Contribution by the sole shareholder 1.000 1.000
Total transactions with shareholders (c) (101) (1) 529 573 1.000Other changes:
Business combination under common control (3) (3)Total other changes (d) (3) (3)Balances at December 31, 2013 (e=a+b+c+d) 1.553 (6) (5) 35 (625) 952Loss for the year 2014 (545) (545)Other items of comprehensive loss:
Revaluation of defined-benefit plans for employees net of tax effect (4) (4)Foreign currency translation differences 4 4
Total comprehensive loss for the year 2014 (f) 4 (4) (545) (545)Transactions with shareholders:
Allocation of loss for the year 2013 (625) 625Total transactions with shareholders (g) (625) 625Other changes:
Business combination under common controlTotal other changes (h)Balances at December 31, 2014 (i=e+f+g+h) 1.553 (2) (9) (590) (545) 407
47

Versalis / Consolidated Financial Statements 2014/ Financial Statements
Cash Flow Statement (amounts in millions of euros) Notes 2013 2014Loss for the period (625) (545) Adjustments to reconcile net loss to net cash provided by operating activities:
Depreciation and amortization (30) 84 89Net impairments (writebacks) on plant, property, equipment and intangible assets (30) 41 96Share of profit (loss) of equity-method investments 5Currency translation differences from alignment (31) (2) 1Net gains on disposal of assets 5(Dividends) (32) (1)Interest expense (31) 41 38Current, deferred and advance income taxes for the period (33) (166) (190)Changes in working capital:- inventories (3) 107 63- trade receivables (2) 95 89- trade payables (16) 147 (156)- provisions for risks and charges (21) 51 (16)- other assets and liabilities (1) 71Cash flow provided by changes in working capital (228) (451)Net changes in provisions for employee benefits (22) (3)Dividends received 1Interest paid (38) (33)Income taxes received (paid) including tax credits rebated (2)Net cash flow provided by operating activities (271) (483)of which with related parties (33) (2,793) (2,219)Investments:- tangible assets (7) (288) (270)- intangible assets (8) (3) (4)- investments (9) & (10) (71) (13)- business units (3)- changes in payables relating to investment activities (16) 17 2- financial receivables instrumental to the operating activity – investment (100) (101)Cash flow from investments (448) (386)Disposals:- investments (9) & (10) 1 2Cash flow from disposals 1 2Net cash flow from investment activities (447) (384)of which with related parties (33) (175) (109)Long-term debt obtained (20) 121Repayments of long-term debt (20) (101)Increase (decrease) in short-term debt (14) (163) 743Dividends paid and changes in non-controlling interest and reserves (25) 1,000Other changes 2 2Net cash flow from financing activities 738 866of which with related parties (33) 738 863Net cash flow for the period 20 (1)Cash and cash equivalents - beginning of the year (1) 60 80Cash and cash equivalents - end of the year (1) 80 79
48

Versalis / Consolidated Financial Statements 2014/ Financial Statements
Supplementary information
Year Year(amounts in millions of euros) Notes 2013 2014Analysis of investments in business unitsNon-current assets:Property, plant and equiment (7) (3)Net effect of the investments (3)CASH FLOW FROM INVESTMENTS MADE (3)
49

Versalis / Consolidated Financial Statements 2014/ Notes to the Financial Statements
Notes to the Consolidated Financial Statements
Basis of presentation The consolidated financial statements have been prepared in accordance with the International Financial Reporting Standards (“IFRS”) issued by the International Accounting Standards Board (IASB) and adopted by the European Commission pursuant to Article 6 of EC Regulation No. 1606/2002 of the European Parliament and Council of July 19, 2002, and in accordance with Art. 9 of Italian Legislative Decree 38/05.6 The consolidated financial statements have been prepared on a historical cost basis, with adjustments where appropriate, except for items that under the IFRSs must be recorded at fair value as described in the paragraph on accounting policies. The consolidated financial statements include the statutory financial statements of Versalis SpA and the financial statements of those companies over which Versalis SpA holds the right to, directly or indirectly, exercises control, determine financial and management decisions and obtain economic and financial benefits. The consolidated companies, unconsolidated subsidiaries, joint ventures, associates and significant investments as set forth by Art. 126 of Consob Decision No. 11971 of May 14, 1999 and subsequent amendments, are indicated separately in the paragraph “List of investments” which is an integral part of these notes. The same appendix also shows the changes to the consolidation area, which took place during the year. The financial statements of the consolidated companies are audited by independent audit firms, which also examine and verify the information required for preparation of the consolidated financial statements. The financial statements at December 31, 2014, approved by the Board of Directors of Versalis SpA at its meeting on March 4, 2015, are audited by Reconta Ernst & Young SpA. As the main independent auditor, the Reconta Ernst & Young network is responsible for auditing the Group's consolidated financial statements. Considering their materiality, the amounts of the items in the financial statements and the associated notes are stated in millions of euro, unless otherwise indicated. These financial statements were prepared on a going concern basis, as Versalis SpA is a company wholly owned and controlled by Eni SpA; on this point, see the more detailed description provided in the report on operations, in the paragraphs on liquidity risk and the business outlook.
Consolidation principles Interest in consolidated companies Assets and liabilities, revenues and expenses related to fully consolidated subsidiaries are consolidated on a line-by-line basis in the Consolidated Financial Statements; the value of these investments is offset against the corresponding share of the shareholder’s equity of the investee companies.
Business combination operations are recorded using the acquisition method. The amount transferred under a business combination is determined at the date control is taken and is equal to the fair value of the assets transferred, the liabilities incurred or undertaken, and any equity instruments issued by the acquirer. Costs directly attributable to the operation are reported in the income statement at the time they are incurred.
The shareholder’s equity in consolidated companies is determined by attributing to each of the balance sheet items its fair value at the date on which control is acquired. The excess of the purchase price of an acquired entity over the total value assigned to assets acquired and liabilities undertaken is recorded in the balance sheet as goodwill. Any negative goodwill is recorded in the income statement.
6 The international accounting standards used in preparing the consolidated financial statements substantially coincide with those issued by the IASB in force for financial year 2011 because the current differences between the IFRSs endorsed by the European Commission and those issued by the IASB concern cases not present in the Group's businesses.
50

Versalis / Consolidated Financial Statements 2014/ Notes to the Financial Statements
When shareholdings are acquired after control was obtained (acquisition of minority interests), any positive difference between the purchase cost and the proportionate share of shareholders’ equity is stated in the Group’s equity; in the same way, effects deriving from disposals of equity interests that do not result in a loss of control are recorded in equity. However, the sale of shareholdings which involve loss of control results in the recognition in the income statement of: (i) any capital gain/loss calculated as the difference between the amount received and the proportionate share of consolidated shareholders’ equity sold; (ii) the effect of the revaluation of any residual shareholding held to align it to its fair value; (iii) any amounts accounted for in other comprehensive income items related to the former subsidiary. The value of the shareholding held, aligned to its fair value at the date control is lost, represents the new carrying amount of the interest and, therefore, the reference value for the subsequent valuation of the interest in accordance with the applicable accounting policies.7 Gains or losses associated with the disposal of interests in consolidated subsidiaries are reflected in the income statement for the difference between proceeds from the sale and the divested portion of shareholders’ equity. Intercompany transactions Income deriving from intercompany transactions between consolidated companies is offset, as are unrealized income from third parties. Receivables, payables, revenues and costs, guarantees, commitments and risks among consolidated companies are also offset. Unrealized gains with companies accounted for using the equity-accounting method are offset in proportion to the Group’s share. In both cases, intercompany losses are not offset since they reflect an actual decrease in the value of divested assets. Foreign currency translation Financial Statements of consolidated companies denominated in currencies other than the euro, which is the Group's functional currency, are converted into euro applying the exchange rates prevailing at the period end to assets and liabilities, the historical exchange rates to equity items and the average rates for the period to the profit and loss account (source: Bank of Italy). Any currency translation differences from the translation of non-euro financial statements, deriving from the application of different exchange rates for assets and liabilities, shareholders’ equity and the profit and loss account are recorded under the item “Other reserves”. The reserve for currency translation differences is accounted for in the profit and loss account at the time of disposal of the investment or of repayment of the capital employed. The financial statements of foreign subsidiaries which are translated into euro are those denominated in the functional currencies of the country where the enterprise operates (Pound Sterling, Hungarian Forint and the Chinese Renminbi). The exchange rates used to translate financial statements in currencies other than the euro are listed below:
(amounts of currency for 1 euro)
Annual average exchange rate
2013Exchange rate at
Dec. 31, 2013
Annual average exchange rate
2014Exchange rate at
Dec. 31, 2014Pound Sterling 0.85 0.83 0.81 0.78Hungarian Forint 296.87 297.04 308.71 315.54Chinese Renminbi 8.16 8.35 8.19 7.54
7 The same indications apply in the case of sales involving the loss of joint control or of the associated company status.
51

Versalis / Consolidated Financial Statements 2014/ Notes to the Financial Statements
Accounting policies The most significant accounting policies adopted in the preparation of the Consolidated Financial Statements are described below. Current assets Cash and cash equivalents include cash in hand, sight deposits and financial assets originally due within 90 days, readily convertible into cash and subject to insignificant risk of changes in value. Financial assets held for trading and available-for-sale financial assets are stated at fair value, with gains or losses stated in the income statement under the heading “Financial income (expense)”8 and in the shareholders’ equity reserve under “Other items of comprehensive income” respectively. In the latter case, changes in fair value recorded in equity are charged to the income statement when the asset is sold or impaired. Assets are assessed for objective evidence of an impairment loss. This may include, among other things, significant breaches of contracts, serious financial difficulties or the high risk of insolvency of the counterparty. Financial instruments available for sale include financial assets, other than derivatives, receivables, financial assets held for trading and assets held to maturity. Interest matured and dividends declared on financial assets available-for-sale are accounted for on an accrual basis as “Financial income (expense)”9 and “Other income (expense) from investments”, respectively. When the purchase or sale of financial assets occurs under a contract whose terms require delivery of the asset within the timeframe established generally by regulations or conventions in the market place concerned, the transaction is accounted for at the settlement date. Receivables are stated at amortised cost (see below “Non-current assets - Financial assets"). Financial assets sold are derecognized from the Balance Sheet when the contractual rights to receive the cash flows of the financial assets are transferred together with the risks and benefits associated with ownership. Inventories are stated at the lower of purchase or production cost and net realizable value represented by the proceeds the company expects to collect from the sale of inventories in the normal course of business. The cost of inventories of chemical products is determined by applying the weighted average cost for the year. Non-current assets Property, plant and equipment Property, plant and equipment, including real estate investments, are accounted for using the cost model and are stated at their purchase or production cost including any costs directly attributable to bringing the asset into operation. In addition, when a substantial amount of time is required to make the asset ready for use, the purchase price or production cost includes borrowing costs that theoretically would have been avoided had the investment not been made. In the case of current obligations for the dismantling and removal of assets and the remediation of sites, the book value includes, with a corresponding entry to a specific provision, the estimated (discounted) costs to be borne at the moment the asset is retired. The accounting treatment of changes for these provisions, of the passage of time and of the discount rate are stated in the "Provisions for risks and charges". As the time when the asset will be abandoned is uncertain, making it impossible to estimate the related discounted abandonment costs, the site dismantling and remediation costs related to property, plant and equipment are accounted for when the date on which the actual cost to be incurred can be determined and when the amount of the obligation can be estimated reliably. In this respect Versalis periodically assesses the conditions in which it operates in
8 Starting from 2009, the fair value variations of non-hedging derivatives on commodities, also including the effects of such regulations, are recorded under the profit and loss account item “Other operating (expense) income.”
9 The accrued interest income on financial assets held for trading contributes to the overall valuation of the instrument’s fair value and is reported under “Financial income (expense)”, in the sub-item “Income (expense) from securities held for trading.” However, the accrued interest income on available-for-sale financial assets is reported under “Financial income (expense)”, in the sub-item “Financial income.”
52

Versalis / Consolidated Financial Statements 2014/ Notes to the Financial Statements
order to ascertain if there have been any changes, circumstances or events that can result in the need to provide for site dismantling and remediation costs related to its property, plant and equipment. Revaluations are not allowed even in application of specific laws.
Expenditures on renewals, improvements and transformations that extend the useful life of the related asset or otherwise increase the value thereof are capitalized when it is likely that they will increase the future economic benefits expected from the asset.
Starting from the moment when the asset comes into use or should have come into use, property, plant and equipment are depreciated on a straight-line method over their useful life, which is an estimate of the period over which the assets will be used by the company. When the asset is made up of several significant components with different useful lives, the depreciation is calculated separately for each component. The depreciable value of an asset is its cost less the estimated realisable value at the end of its useful life, if significant and reasonably determinable. Land is not subject to depreciation, even if purchased together with a building, and nor is property, plant and equipment held for sale (see the paragraph “Assets held for sale and discontinued operations”, below). Eventual changes to the depreciation plan arising from the revision of the asset’s useful life, of its residual value or of the method for obtaining the economic benefits of the asset, are recorded prospectively. The costs of replacing identifiable components in complex assets are capitalized and depreciated over their useful life; the residual book value of the component that has been replaced is charged to the income statement. Ordinary maintenance and repair costs are expensed incurred. The book value of tangible assets is reviewed for impairment whenever events indicate that the book values for those assets may not be recoverable. The recoverability of an asset is assessed by comparing its book value with the recoverable amount, represented by the higher of fair value less costs to sell and value in use (the so-called impairment test). Value in use is determined by discounting the future cash flows expected to be derived from the use of the asset and, if significant and reasonably determinable, those from its disposal at the end of its useful life, net of disposal costs. The value in use is calculated net of the tax effect as it produces results substantially equivalent to those obtainable using a pre-tax measurement. Cash flows are determined on the basis of reasonable and demonstrable assumptions that represent the best estimate of the future economic conditions which could occur during the residual useful life of the asset, giving more importance to independent assumptions. Discounting is carried out at a rate that reflects current market assessments of the time value of money and of the risks specific to the asset that are not reflected in the estimate of the future cash flows. The discount rate used is the Weighted Average Cost of Capital (WACC) adjusted, as indicated below, for the specific country risk of the asset being measured. The measurement of the specific country risk to be included in the discount rate is carried out on the basis of information provided by external providers. Valuation is carried out for each single asset or, if the realizable value of a single asset cannot be determined, for the smallest identifiable group of assets that generates independent cash inflows from their continuous use, the so-called “cash generating unit”. If the reasons for impairment cease to exist, the impairment loss is reversed to the income statement as income from revaluation. The value of the asset is written back to the lower of the recoverable amount and the original book value before impairment, less of the depreciation that would have been charged had no impairment loss been accounted for. Intangible assets Intangible assets include assets lacking physical substance, controlled by the company and capable of producing future economic benefits, and goodwill acquired in business combinations. Intangible assets are identified when Management is able to distinguish them clearly from goodwill. This condition is normally met when: (i) the intangible asset can be traced back to a legal or contractual right, or (ii) the asset is separable, i.e. can be sold, transferred, licensed, rented or exchanged either individually or as an integral part of other assets. An entity controls an asset if it has the power to obtain the future economic benefits flowing from the asset and to restrict the access of others to these benefits. Intangible assets are accounted for at cost, using the same criteria as that indicated for property, plant and equipment. Revaluations are not permitted even in application of specific laws. Intangible assets with a defined useful life are amortized on a straight-line basis over their useful life, estimated as the period over which the assets will be used by the company. The amount to be amortized and the recoverability of their book value are determined in accordance with the criteria described in the section “Property, plant and equipment”.
Intangible assets with an indefinite useful life are not amortized. The recoverability of their book value is reviewed at least annually and whenever events or changes in circumstances indicate that the book value may not be recoverable.
53
Versalis / Consolidated Financial Statements 2014/ Notes to the Financial Statements
Costs of technological development activities are capitalised when: (i) the cost attributable to the development activities can be reasonably determined; (ii) there is the intention, the availability of funding and the technical ability to make the asset available for use or sale; and (iii) it can be shown that the asset is able to produce future economic benefits. Grants Capital grants are are accounted for when there is reasonable assurance that the conditions laid down by government bodies for obtaining them have been met and recorded as a reduction of purchase price or production cost of the relevant assets.. Grants for operating expenditure are credited to the income statement on an accrual basis, in line with the incurrence of the costs to which they are related. In accordance with the warranties given at the time of conferral in 2002 of the “Strategic Chemical Activities” business unit, Versalis SpA charges Syndial SpA for the costs which it incurs for environmental, health and safety actions deriving from activities carried out before 2002. If these relate to capital expenditures, these recharges are accounted for as capital grants. If, instead, these relate to operating expenses, they are recorded for in “Other income and revenues”, as a recovery of costs. Financial assets Investments Investments in non-consolidated subsidiaries, joint ventures and associated companies are accounted for using the equity-accounting method10, whereby the investments are initially recorded at cost and subsequently adjusted to take account of: (i) the shareholder’s portion of the net income/loss realized after the acquisition date; and (ii) the shareholders’ portion of other elements of the comprehensive income. Changes in the net equity value of an investment, other than those related to economic performance and the other elements of comprehensive income, are accounted for in the income statement when they represent in substance the effects of a transfer of an interest in the investee. Dividends distributed by the investee are recorded as a reduction of the book value of the investment. For the purposes of applying the equity-accounting method, the adjustments provided for in the consolidation process are considered (see also the section “Principles of consolidation”). Where there exist objective evidence of impairment (see also “Current assets”), the recoverability is assessed by comparing the book value with the recoverable value of the assets determined adopting the criteria indicated in the section “Property, plant and equipment”. Where this does not result in a misrepresentation of the financial situation and income, subsidiaries excluded from consolidation, joint ventures and associated companies are accounted for at cost, adjusted for impairment losses. When the reasons for their impairment cease to exist, equity investments accounted for at cost are written back up to the limit of the impairment made and the effects are credited to the income statement under the item “Other income (expense) from investments”. Other equity investments included in non-current assets are stated at their fair value and their effects are included in shareholders’ equity under “Other comprehensive income”. Changes in fair value recorded under equity are charged to the income statement when the investment is sold or impaired. When equity investments are not traded in a regulated market and the fair value cannot be reasonably ascertained, these are accounted for at cost, adjusted for impairment losses; such impairment losses may not be reversed.11 The investor’s share of any losses exceeding the book value is accounted for in a specific provision to the extent that the investor is required to fulfil legal or implicit obligations towards the investee or to cover its losses.
10 In the case of taking on joint control of a company, in the later stages the investment is recorded at the amount equal to that resulting from the application of the equity method as if it had been applied from the start; the effect of the revaluation of the book value of the shares of the investment, held prior to taking on the joint control, is charged to shareholders’ equity.
11 Impairment losses are not reversed even when, considering conditions existing in a subsequent interim period, they would have been recorded for a smaller amount or would not have been recorded at all.
54

Versalis / Consolidated Financial Statements 2014/ Notes to the Financial Statements
Receivables and held-to-maturity financial assets Receivables and financial assets to be held to maturity are stated at cost, represented by the fair value of the initial price paid, plus transaction costs. The initial book value is subsequently adjusted to take into account repayments of principal, impairments and amortization of the difference between the redemption value and the initial book value; amortization is carried out on the basis of the effective internal rate of return represented by the rate that, at the moment of initial recognition, discounts the present value of expected future cash flows to the initial book value (the so-called amortized cost method). Receivables originating from assets granted in financial leasing are stated for the amount corresponding to the present value of the leasing fees and of the redemption price or of any residual value of the asset; the discounting is carried out adopting the implicit interest rate of the lease. If there is objective evidence that an impairment loss has occurred (see also “Current assets”), the impairment is calculated by comparing the book value with the present value of the expected cash flows discounted at the effective interest rate computed at initial recognition or at the time of its updating to reflect re-pricings contractually established. Receivables and held-to-maturity financial assets are accounted for net of the provision for impairment losses. When the impairment loss is definite, the provision is used, otherwise it is released. The receivables and/or financial assets variations arising from amortised cost valuations are recorded as “Financial income (expenses)”.
Financial liabilities Payables are assessed at amortized cost (see “Financial assets” above). Provisions for risks and charges Provisions for risks and charges concern risks and charges of a definite nature and whose existence is certain or probable, but for which at period end the amount or date of occurrence remains uncertain. Provisions are made when: (i) there is a present obligation, either legal or implicit, deriving from a past event; (ii) fulfilment of that obligation will probably result in an outflow of resources; and (iii) the amount of the obligation can be reliably estimated. Provisions represent the best estimate of the expenditure required settle the obligation or to transfer it to third parties at the balance-sheet date; provisions relating to onerous contracts are stated at the lower of the cost necessary to fulfil the contract obligation, net of the economic benefits expected to be received under it and any compensation or penalties arising from termination of the contract. When the financial effect of time is significant and the timing of settlement can be estimated reliably, the provisions should be discounted using a pre-tax discount rate that reflects the current market assessments of the time value of money and the risks specific to the liability. The increase in the provision related to the passage of time is recorded in the income statement under the heading “Financial income (expense)”. When the liability regards property, plant or equipment (e.g. decommissioning and site remediation), the provision is stated with a corresponding entry to the asset to which it refers and taken to the income statement through the depreciation process. The costs that the company expects to bear to carry out restructuring plans are accounted for in the year in which the company formally defines the plan and the interested parties have developed a valid expectation that the restructuring will occur. Provisions are periodically updated to show the variations in cost estimates, realization times and discount rates; increases and decreases for changes in estimates are recorded in the same income statement item used to accrue the provision, or, when the liability regards property, plant or equipment (e.g. dismantling and site remediation), through an entry corresponding to the assets to which they refer.
55

Versalis / Consolidated Financial Statements 2014/ Notes to the Financial Statements
Employee benefits Post-employment benefit plans, even if not formalized, are classified as either “defined contribution plans” or “defined benefit plans”, depending on the economic substance of the plan as derived from its principal terms and conditions. In defined-contribution plans the company’s obligation, which is limited to the payment of contributions to the State or to a separate legal entity (a fund), is determined on the basis of the contributions due. The liability relating to defined-benefit plans, net of any plan assets, is determined on the basis of actuarial assumptions and provided for on an accrual basis over the period of service necessary for the benefits to vest. Net interest includes the item return on plan assets and the interest expense to be stated in the income statement. Net interest is determined by applying to the liabilities, net of any plan assets, the discount rate defined for the liabilities; the net interest of defined-benefit plans is recorded in the item "Financial income (expense)". For defined-benefit plans, the changes in the value of the net liability (so-called write-downs) from actuarial earnings (losses), resulting from changes in actuarial assumptions used or adjustments based on past experience, and from return on plan assets different from the item included in net interest, are stated in the statement of comprehensive income. In the presence of net assets, value changes different from the item included in net interest are also recorded in the statement of comprehensive income. Additionally, obligations for other long-term benefits are determined by adopting actuarial assumptions; the effect of changes in actuarial assumptions or of a change in the characteristics of the benefits recognized in the income statement in their entirety. Revenues and costs Revenues from sales of products and services are recorded when the significant risks and rewards of ownership pass to the customer or when the transaction can be considered settled and associated revenue can be reliably measured. In the case of sales of goods, revenues are generally accounted for upon shipment when, at that date, the risks of loss are transferred to the buyer. Revenues related to partially rendered services are recorded in accordance to the stage of completion providing this can be measured reliably and that there is no significant uncertainty regarding the collectability of the amount and the related costs. Otherwise they are accounted for only to the extent of the recoverable costs incurred. If the contract provides for the issue of specific performance warranties for the benefit of the licensee, the company discloses this fact in the notes to the financial statements, or recognizes specific provisions for contingencies on the basis of an assessment of the degree of probability that a liability may arise from these warranties. Revenues are stated net of returns, discounts, rebates and bonuses, as well as directly related taxation. Exchanges of goods and services of a similar nature and value do not give rise to revenues and costs, as they do not represent sale transactions. Costs are accounted for when the related goods and services are sold, consumed or allocated or when their future usefulness cannot be determined. Costs related to emission quotas, determined on the basis of the average market prices, are stated in relation to the amount of carbon dioxide emissions exceeding the quotas assigned. Costs related to the purchase of emission rights are capitalized and accounted for as intangible assets net of any negative difference between the amount of emissions made and quotas assigned. Revenues related to emission quotas are stated when realized through sale. In the case of sale, where present, emission rights purchased are considered sold first. Cash receivables assigned in lieu of free assignment of emission quotas are recorded in the item “Other revenues” in the income statement. Operating lease instalments are recorded in the profit and loss account over the duration of the contract. The costs for the acquisition of new knowledge or inventions, the study of products or alternative processes, new techniques or models, the planning and construction of prototypes or any costs sustained for other scientific research activities or technological development which do not satisfy conditions for recognition in the balance sheet, are generally considered current costs and recorded in the profit and loss account when incurred.
56

Versalis / Consolidated Financial Statements 2014/ Notes to the Financial Statements
Exchange rate differences Revenues and costs relating to transactions in currencies other than the functional currency are recorded at the exchange rate in force at the transaction date. Monetary assets and liabilities in currencies other than the functional currency are converted by applying the year-end exchange rate and the effect is recorded in the income statement. Non-monetary assets and liabilities in currencies other than the functional one measured at cost are translated at the initial exchange rate. Non-monetary assets that are re-measured at fair value, recoverable amount or realizable value are stated at the exchange rate applicable on the date or re-measurement. Dividends Dividends are recorded at the date of the Shareholders’ Meeting in which they were approved, except when the sale of shares before the ex-dividend date is reasonably certain. Income taxes Current income taxes are determined on the basis of estimated taxable income; the estimated liability is recorded in the item “Current income taxes payables”. Current tax assets and liabilities are measured at the amount expected to be paid to/recovered from the tax authorities using the tax rates and tax laws in force or substantively enacted at the reporting date. From the financial year 2008 onwards, Versalis SpA, jointly with Eni SpA, has adhered to the National Tax Consolidation tax system, which enables IRES (corporation tax) to be determined on a taxable base corresponding to the sum of the positive and negative taxable incomes of the single companies that take part in the consolidation. The economic relationships, as well as the responsibilities and reciprocal obligations, between Eni spa and the other companies of the Eni Group who have signed up to the National Tax Consolidation system are defined in the “Regulations for participation in the National Tax Consolidation system for Eni Group companies”, according to which: (i) the subsidiaries with a positive taxable income will transfer to Eni SpA the financial resources corresponding to the higher tax payable by the latter as a result of their participation in the National Tax Consolidation, (ii) those with a negative taxable income will receive compensation, on a proportional basis, equivalent to the related tax savings made by Eni spa, providing and to the extent that they have income prospects that would have allowed, in the absence of National Tax Consolidation, the effective use of the tax losses generated. Consequently, the relevant tax, net of advances paid, withholdings made and tax credits in general, is recorded as a payable to or receivable from the parent company. Current income taxes are calculated on the basis of estimated taxable income of the company as well as the taxable income of subsidiaries and other companies resident in countries with preferential tax regimes, in proportion to the shareholding, where the conditions exist for tax imputation as provided for in Art. 167 and 168 of the Consolidated Income Tax Act. Deferred tax assets and liabilities are calculated on the temporary differences arising between the book value of the assets and liabilities and the corresponding amounts recorded for fiscal purposes on the basis of the tax rates and laws enacted or substantively enacted for future years. Deferred tax assets are accounted for when their recovery is considered probable. In particular, the recovery of deferred taxes is considered probable when sufficient taxable income is expected for the year in which the temporary difference is reversed, such as to enable the activation of the tax deduction. Deferred tax assets and liabilities are recorded under non-current assets and liabilities and are offset at single entity level, if related to off settable taxes. The balance of the offset, if positive, is accounted for under “Deferred tax assets”, and if negative under “Deferred tax liabilities”. When the results of transactions are recorded directly in shareholders’ equity, current taxes, deferred tax assets and liabilities are also charged to shareholders’ equity. Derivatives Derivatives, including embedded derivatives that are separated from the host contract, are assets and liabilities stated at their fair value, estimated using the criteria described in the section “Valuation at fair value”. When there is objective evidence that an impairment loss has occurred (see also the section “Current assets”) derivative assets are accounted for net of provisions for impairment losses. The fair value of liabilities for derivatives considers the adjustments to take account of the issuer’s non-performance risk (see “Valuation at fair value” below).
57

Versalis / Consolidated Financial Statements 2014/ Notes to the Financial Statements
Derivatives are designated as hedging instruments when the relationship between the derivative and the hedged item is formally documented and the effectiveness of the hedge, which is checked regularly, is demonstrated to be high. When derivatives hedge the risk of fluctuations in the fair value of the hedged instruments (fair value hedges, e.g. hedging against changes in the fair value of fixed-rate assets/liabilities), the derivatives are stated at fair value with changes taken to the income statement. Hedged items are accordingly adjusted to reflect changes in their fair value attributable to the hedged risk. When derivatives hedge the cash flow variation risk of the hedged item (cash flow hedge; e.g. hedging the variability of the cash flows of assets/liabilities as a result of the fluctuations of exchange rates), changes in the fair value of the derivatives considered effective are initially recorded in net equity and then recorded in the income statement, consistently with the economic effects produced by the hedged transaction. Changes in the fair value of derivatives which do not satisfy the conditions required to qualify as hedging instruments are recorded in the income statement. Specifically, changes in the fair value of non-hedging interest rates and exchange rates derivatives are accounted for in the income statement under “Financial income (expense)”; conversely, changes in the fair value of non-hedging commodity derivatives are recorded in the income statement under “Other operating (expense) income.” The economic effects of transactions which relate to purchase or sales contracts for commodities stipulated for the purpose of the entity’s normal operating requirements and for which settlement is envisaged on delivery of the goods, are accounted for on an accruals basis (the so-called “normal sale and normal purchase exemption” or “own use exemption”). Valuation at fair value Fair value is the price that would be received for the sale of an asset or paid for the transfer of a liability in a normal transaction between market participants (i.e. not in a forced liquidation or sale under cost) at the date of valuation (so-called exit price).
Determination of fair value is based on the market conditions existing at the date of valuation and on assumptions of market-based operators. The fair value measurement assumes that the asset or liability is exchanged on the principal market or, in its absence, on the most beneficial market the company has access to, regardless of the intention of the company to sell the asset or transfer the liability being valued.
Determination of the fair value of a non-financial asset is performed by considering market operators’ capacity to generate economic benefits, employing such asset at its fullest and best use, or selling it to another market operator who would employ it at its fullest and best use.
Determination of the fullest and best use of the asset is performed from the perspective of market operators even when the company intends to use it differently. It is assumed that the company’s current use of a non-financial asset is the fullest and best use of it, unless the market or other factors suggest that a different use made by market operators would maximize its value.
The fair value of a liability, whether financial or non-financial, or of equity instrument, in the absence of a quoted price, is valued by considering the valuation of the corresponding asset held by a market operator at the date of valuation.
The fair value of a liability reflects the effect of a risk of a default; the risk of default includes, among other things, the entity’s credit risk.
In the absence of available market prices, fair value is determined using valuation techniques that are appropriate to the circumstances and maximize the use of significant observable inputs, reducing the use of unobservable inputs to a minimum.
58

Versalis / Consolidated Financial Statements 2014/ Notes to the Financial Statements
Financial Statements Balance sheet assets and liabilities are classified as current and non-current. Income statement items are presented by nature. The statement of Comprehensive Loss shows the net loss plus income and expenses that are recorded directly in the shareholders’ equity in accordance with the IFRSs. The Statement of Changes in Shareholders’ Equity presents net profit or loss for the year, transactions with shareholders and other changes in shareholders’ equity. The Cash Flow Statement is presented using the indirect method, whereby net profit/(loss) is adjusted for the effects of non-monetary transactions. Changes to accounting criteria Regulation No. 475/2012 issued by the European Commission on June 5, 2012 also approved the new version of the IAS 19 "Employee Benefits" (hereinafter “IAS 19”). The new provisions of IAS 19 are applied retroactively by adjusting the opening values of the balance sheet at January 1, 2012 and the economic data of 2012. Application of the new provisions of IAS 19 has resulted in: (i) a reduction of shareholders' equity at January 1, 2012 of €1 million; (ii) a reduction of shareholders’ equity at December 31, 2012 of €11 million, relating to the actuarial profits and losses of 2012 recorded in the other items of comprehensive income. The effect on the 2012 income statement is not significant. The representation of the “net interest” of the defined-benefit plans under “Finance income (expense)", in place of the previous representation as an element of payroll and related costs, resulted in an increase in operating profit for 2012 of €2 million.
Use of accounting estimates The preparation of financial statements in accordance with generally accepted accounting standards requires management to make accounting estimates based on complex or subjective judgements, past experience and assumptions deemed to be reasonable and realistic based on the information available at the time. The use of these estimates and assumptions affects the reported amounts of assets and liabilities and the disclosure of contingent assets and liabilities at the balance sheet date and the reported amounts of income and expenses during the reporting period. Actual results may differ from these estimates given the uncertainty surrounding the assumptions and conditions upon which the estimates are based, especially in the current context characterized by the economic and financial crisis which made it necessary to make assumptions regarding the future which are marked by significant uncertainty. The principal accounting estimates used that required subjective judgements, assumptions and estimates relating to issues which, by their very nature, are uncertain, are summarized below. Changes in the conditions on which such assumptions and estimates are based may have a significant effect on future results. Impairment of assets Impairment losses are accounted for if events or changes in circumstances indicate that their carrying amount is no longer recoverable. Such indicators include changes in the Group’s business plans, changes in market prices leading to unprofitable performance and reduced utilization of the plants. Determining whether and to what extent an asset is impaired involves management estimates on complex and highly uncertain factors, such as future prices, the effects of inflation and technological improvements on operating costs, production profiles and the outlook for the global or regional market demand or supply. The amount of an impairment loss is determined by comparing the carrying amount of an asset with its recoverable amount. The recoverable amount is the greater of fair value net of disposal costs and value in use. The value in use is measured based on the values of expected future cash flows net of disposal costs. The expected future cash flows are quantified considering information available at the date of review on the basis of subjective judgements on trends in future variables - such as prices, costs, growth rate of demand, production volumes - and are discounted using a rate which takes into account the risk inherent in the activity involved.
59

Versalis / Consolidated Financial Statements 2014/ Notes to the Financial Statements
Decommissioning and remediation of production sites At present, the companies of the Versalis Group have no obligation to restore sites, in compliance with legislation, administrative regulations or contractual clauses and, therefore, in consideration also of the current corporate plans, which do not envisage any decommissioning of the operational industrial sites, given the strategic importance of these sites for the achievement of the corporate objectives, management considers the probability of incurring costs relating to the decommissioning and reclamation of these sites to be remote. Recoverability of deferred tax assets Management has identified the necessary requisites for recognition of the deferred tax assets on the future profitability estimates of the Versalis Group’s companies. It is also important to note that Art. 23, paragraph 9, of Law Decree No. 98 of July 6, 2011 establishes that the recoverability of tax losses in effect at the date of the decree has no time limit. Business combination Accounting for business combinations requires the allocation of the purchase price to the various assets and liabilities of the acquired business at their respective fair values. Any positive residual difference is accounted for as goodwill. Negative residual differences are accounted for in the income statement. Management uses all available information to make these fair value determinations and, for major business acquisitions, typically engages an independent appraisal firm to assist in the fair value determination of the acquired assets and liabilities. Environmental liabilities In common with other companies in the industries in which it operates, Versalis is subject to numerous EU, national, regional and local environmental laws and regulations concerning its oil and gas operations, production and other activities, including legislation that implements international conventions or protocols. Provisions for future costs are set aside when it is likely that a liability has been incurred and the amount can be reasonably estimated. Although at present Versalis does not believe that non-compliance with environmental regulations will have a particularly significant adverse impact on the financial statements - taking into account the actions already taken, the insurance policies underwritten and the provisions accrued – it is not possible to exclude the possibility that Versalis may incur additional costs and liabilities, even of a significant amount, given that, at present, it is impossible to foresee the effects of future developments, also taking into account the following aspects: (i) the possibility of as yet unknown contamination; (ii) the results of the on-going surveys and the other possible effects deriving from the application of current legislation; (iii) the possible effects of future environmental legislation and rules; (iv) the effect of possible technological changes relating to environmental remediation; and (v) the possibility of litigation and the difficulty of determining any consequences, also in relation to the liability of other parties and to possible compensation. Employee benefits Defined-benefit plans and other long-term benefits are evaluated with reference to uncertain events and actuarial assumptions, including, amongst others, discount rates, expected rates of salary increases, mortality rates, estimated retirement dates and future trends in healthcare costs. The main assumptions used to quantify such benefits are determined as follows: (i) discount and inflation rates, which reflect the rates at which the benefits could be effectively settled, are based on rates that accrue on high-quality corporate bonds (or, in the absence of a “deep market” for such bonds, on the return on government bonds) and on inflation forecasts in the countries involved; (ii) future salary levels are determined on the basis of inflation forecasts, productivity, promotion and seniority; (iii) future healthcare costs are determined on the basis of elements such as present and past healthcare cost trends, including assumptions on the inflation of such costs, and changes in the health status of participants; (iv) demographic assumptions reflect the best estimate of variables such as mortality, turnover and disability in relation to the population of participants. Differences normally occur in the value of the net liability (asset) of employee benefit plans arising from so-called revaluations represented by, among other things, changes in the actuarial assumptions employed, the difference between the actuarial assumptions adopted previously and those that are actually realized and the
60
Versalis / Consolidated Financial Statements 2014/ Notes to the Financial Statements
different return on plan assets compared to that considered in net interest. The revaluations for defined-benefit plans are recorded in the statement of comprehensive income and in the income statement for long-term plans. Provisions for risk and charges Besides recognizing environmental liabilities and liabilities for employee benefits, Versalis sets aside provisions associated mainly with legal and tax litigation. Determining appropriate amounts to set aside is a complex process that entails subjective judgements by management.
Recent accounting standards Accounting standards and interpretations issued by IASB/IFRIC and endorsed by the European Commission Regulation No. 2015/29 issued by the European Commission on December 17, 2014, approved the amendment to IAS 19 “Defined benefit plans: Employee Contributions”, based on which it is permitted to enter contributions connected to defined-benefit plans, owed by the employee or by third parties, to reduce the service cost in the period when the relative service is supplied, as long as those contributions have the following conditions: (i) are indicated in the formal plan conditions, (ii) are connected to the service carried out by the employee and (iii) are independent of the employee's number of years of service (e.g. the contributions are a fixed percentage of the salary or a fixed amount for the entire work period or related to the employee's age). The amendment is effective starting from periods beginning on or after February 1, 2015 (for Versalis: 2016 financial statements). Regulation No. 2015/28 and No. 1361/2014 issued by the European Commission on 17 and 18 December 2014 respectively, the documents "Annual Improvements to IFRSs 2010-2012 Cycle" and “Annual Improvements to IFRSs 2011-2013 Cycle" were approved, containing amendments, mainly of a technical and editorial nature, to the international accounting standards. The amendments to the standards indicated in the document “Annual Improvements to IFRS 2011–2013 Cycle” are effective for periods beginning on or after January 1, 2015. Otherwise, the amendments indicated in the document “Annual Improvements to IFRS 2010-2012 Cycle” are effective starting from periods beginning on, or after February 1, 2015 (for Versalis: 2016 financial statements).
Accounting standards and interpretations issued by IASB/IFRIC and not yet endorsed by the European Commission On May 6, 2014, the IASB issued the amendment to IFRS 11 "Accounting for Acquisitions of Interests in Joint Operations" (hereinafter amendment to IFRS 11), which governs the accounting treatment to be adopted for the acquisition of the initial interest or additional interests in joint operation (without changing the classification as a joint operation) whose activity is in line with the definition of business provided by IFRS 3. In particular, the share acquired in the joint operation is identified by adopting the provisions envisaged for the operations of business combinations applicable to such cases, which include but are not limited to: (i) evaluation at fair value of the identifiable assets and liabilities, other than those for which there is a different evaluation criterion; (ii) the recognition in the income statement of costs directly attributable to the acquisition at the time they were incurred; (iii) the recognition of deferred tax assets related to the initial recognition of assets (other than goodwill) or liabilities in the presence of temporary differences between the carrying amount and tax; (iv) the recognition of goodwill arising from the difference between the revenue transferred and the fair value of the identifiable net assets acquired; (v) the evaluation of the recoverable value of the cash-generating unit to which goodwill has been allocated at least annually, or in the presence of impairment indicators. The amendment to IFRS 11 is effective for periods beginning on or after January 1, 2016. On May 12, 2014, the IASB issued amendments to IAS 16 and IAS 38 "Clarification of Acceptable Methods of Depreciation and Amortization" (hereinafter amendments to IAS 16 and IAS 38), on the basis of which the adoption of a revenue-based depreciation method is considered inappropriate. Limited to intangible assets, this indication is considered a rebuttable presumption which can only be overcome if any of the following circumstances occurs: (i) the right of use of an intangible asset is related to reaching a predetermined threshold of revenues to be produced; or (ii) when it can be shown that the achievement of revenues and the use of the asset's economic benefits are highly correlated. Amendments to IAS 16 and IAS 38 are effective for periods beginning on or after January 1, 2016.
61

Versalis / Consolidated Financial Statements 2014/ Notes to the Financial Statements
On May 28, 2014, the IASB issued IFRS 15 "Revenue from Contracts with Customers" (hereinafter IFRS 15), which governs the timing and amount of revenue earned from contracts with customers (including contracts related contract work in progress). In particular, IFRS 15 requires that the recognition of revenue is based on the following 5 steps: (i) identification of the contract with the customer; (ii) identification of performance obligations (i.e. contractual promises to transfer goods and/or services to a customer) ; (iii) determination of the price of the transaction; (iv) allocation of the transaction price to the performance obligation identified on the basis of the standalone selling price of each good or service; and (v) recognition of the revenue when its performance obligation is satisfied. Furthermore, IFRS 15 integrates the disclosure of the financial statements to be provided with reference to the nature, amount, timing and uncertainty of revenues and related cash flows. The provisions of IFRS 15 are effective for periods beginning on or after January 1, 2017. On July 24, 2014, the IASB finalized the draft revision of accounting standards regarding financial instruments with the issuance of the full version of IFRS 9 "Financial Instruments" (hereinafter IFRS 9). In particular, the new provisions of IFRS 9: (i) modify the model of classification and assessment of financial assets; (ii) introduce a new method of depreciation of financial assets which takes account of expected losses (the so-called expected credit losses); and (iii) modify the provisions relating to hedge accounting. The provisions of IFRS 9 are effective for periods beginning on or after January 1, 2018. On August 12, 2014, the IASB issued the amendment to IAS 27 "Equity Method in Separate Financial Statements", which introduces the possibility of using the equity-accounting method for the assessment of investments in subsidiaries, joint ventures and associated companies in the separate financial statements. The amendment to IAS 27 is effective for periods beginning on or after January 1, 2016. On September 11, 2014, the IASB issued amendments to IFRS 10 and IAS 28 "Sale or Contribution of Assets between an Investor and its Associate or Joint Venture" (hereinafter amendments to IFRS 10 and IAS 28) which defined the methods for recognizing the economic effects chiefly connected with the loss of control of a subsidiary due to its transfer to an associate or a joint venture. Amendments to IAS 10 and IAS 28 are effective for periods beginning on or after January 1, 2016. On December 18, 2014, the IASB issued amendments to IAS 1 "Disclosure Initiative", essentially containing clarification on the presentation method for financial statement disclosures, focusing on the use of the concept of materiality. Amendments to IAS 1 are effective for periods beginning on or after January 1, 2016. On September 25, 2014 the IASB issued the document “Annual Improvements to IFRSs 2012 - 2014 Cycle” containing amendments of an essentially technical and editorial nature of the international accounting principles. Amendments to the principles are effective starting from financial years beginning on or after January 1, 2016. Versalis is currently analysing the above standards to assess whether their adoption will have a significant impact on the financial statements.
62
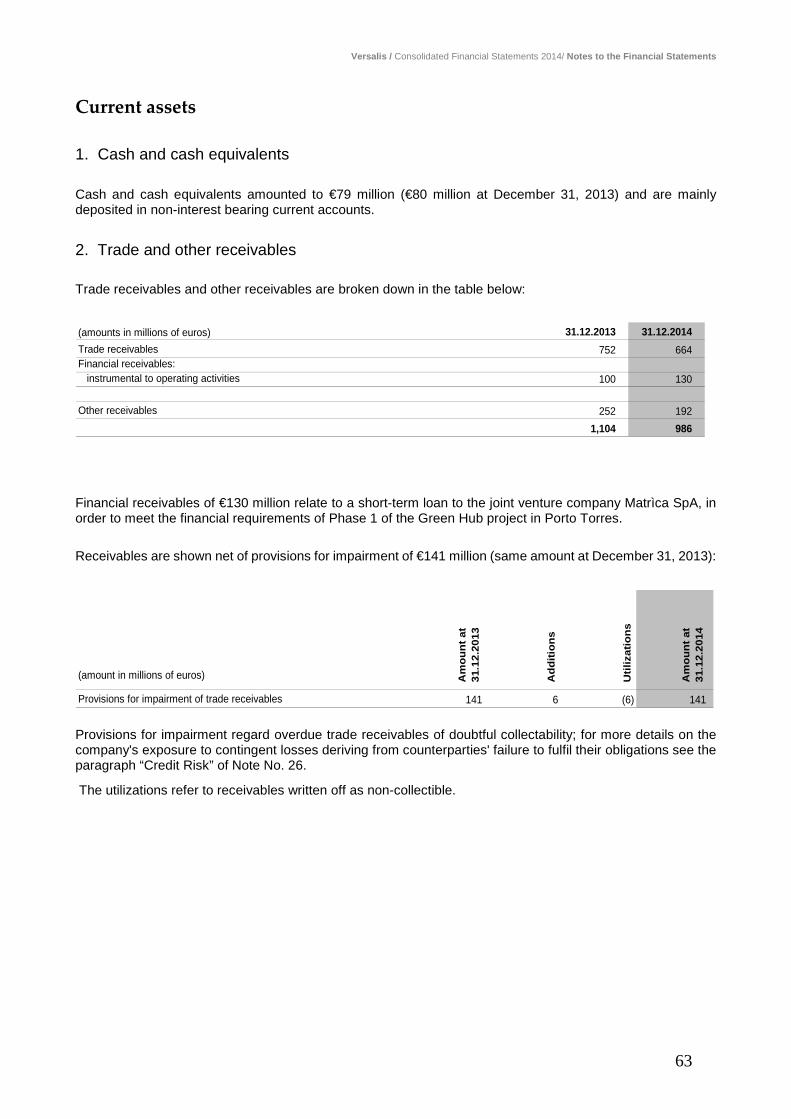
Versalis / Consolidated Financial Statements 2014/ Notes to the Financial Statements
Current assets 1. Cash and cash equivalents Cash and cash equivalents amounted to €79 million (€80 million at December 31, 2013) and are mainly deposited in non-interest bearing current accounts. 2. Trade and other receivables Trade receivables and other receivables are broken down in the table below:
(amounts in millions of euros) 31.12.2013 31.12.2014Trade receivables 752 664Financial receivables: instrumental to operating activities 100 130
Other receivables 252 1921,104 986
Financial receivables of €130 million relate to a short-term loan to the joint venture company Matrìca SpA, in order to meet the financial requirements of Phase 1 of the Green Hub project in Porto Torres. Receivables are shown net of provisions for impairment of €141 million (same amount at December 31, 2013):
(amount in millions of euros) Am
ount
at
31.1
2.20
13
Add
ition
s
Util
izat
ions
Am
ount
at
31.1
2.20
14Provisions for impairment of trade receivables 141 6 (6) 141
Provisions for impairment regard overdue trade receivables of doubtful collectability; for more details on the company's exposure to contingent losses deriving from counterparties' failure to fulfil their obligations see the paragraph “Credit Risk” of Note No. 26.
The utilizations refer to receivables written off as non-collectible.
63

Versalis / Consolidated Financial Statements 2014/ Notes to the Financial Statements
Trade receivables and other overdue receivables can be broken down as follows:
(amounts in millions of euros)Trade
receivablesOther
receivables TotalTrade
receivablesOther
receivables Total
Receivables neither overdue nor written off 710 201 911 623 181 804Receivables written down (net of write down) 6 6 7 7Net receivables overdue nor written down: - up to 90 days overdue 18 18 25 (9) 16 - between 3 to 6 months overdue 6 1 7 2 2 - between 6 to 12 months overdue 5 (25) (20) 1 1 2 - over 12 months overdue 7 75 82 6 19 25
36 51 87 34 11 45752 252 1,004 664 192 856
31.12.2013 31.12.2014
Trade receivables overdue, but not written down, relate mainly to receivables for supplies of petrochemical products subject to repayment or debt restructuring plans which have been complied with so far. The other receivables are comprised of the following:
(amounts in millions of euros) 31.12.2013 31.12.2014Receivables from Eni Group companies 63 77Receivables from parent company 58 36Advances for services and guarantee deposits 21 24Receivables for patents and royalties 9 13Receivables relating to personnel 6 3Other receivables 95 39
252 192
Receivables from Eni Group companies mainly relate to relations with Syndial SpA (€73 million), and the Raffineria di Gela SpA (€2 million). Receivables from the parent company relate mainly to Versalis SpA's adhesion to the group VAT (€28 million). Trade receivables and other receivables in currencies other than the euro amounted to €142 million and are mainly denominated in US dollars. Because of the short-term nature of trade and other receivables, their fair value approximated their carrying amount. Receivables from related parties are disclosed in Note 34.
64

Versalis / Consolidated Financial Statements 2014/ Notes to the Financial Statements
3. Inventories Inventories are comprised of the following:
(amount in millions of euros)Petroleum
productsChemical products Other Total
Petroleum products
Chemical products Other Total
Raw materials and consumables 108 173 49 330 119 173 60 352Work in progress and semi-finished products 1 14 15 11 11Finished products and goods 36 764 800 41 673 714
145 951 49 1,145 160 857 60 1,077
31.12.2013 31.12.2014
The following movements took place in inventories and in provisions for impairment:
(amount in millions of eu Val
ue a
t the
be
ginn
ing
of th
e ye
ar
Var
iatio
n du
ring
th
e ye
ar
Add
ition
s
Util
izat
ions
Ope
ratio
ns o
n bu
sine
ss u
nits
Fore
ign
curr
ency
tr
ansl
atio
n di
ffer
ence
s
Oth
er
mov
emen
ts
Val
ue a
t the
end
of
the
year
31.12.2013Gross value 1,324 (105) (3) 3 1,219Provisions for impairmen (73) (11) 10 (74)Net inventories 1,251 (105) (11) 10 (3) 3 1,14531.12.2014Gross value 1,219 (46) (5) 1 (1) 1,168Provisions for impairmen (74) (26) 9 (91)Net inventories 1,145 (46) (26) 9 (5) 1 (1) 1,077
Business operations refer to the divestment of the Sarroch Aromatics business. There are no secured guarantees on inventories.
4. Current income tax assets Current income tax assets amounted to €14 million (€25 million as at December 31, 2013) and referred to IRAP advances paid in previous years (€8 million) and tax credits for earnings produced abroad (€5 million). Further details are provided in Note 33.
65

Versalis / Consolidated Financial Statements 2014/ Notes to the Financial Statements
5. Other current tax assets Other current tax assets include the following:
(amounts in millions of euros) 31.12.2013 31.12.2014VAT receivables 10 12Other receivables 1
10 13
6. Other Assets Other assets include the following:
(amounts in millions of euros) 31.12.2013 31.12.2014Deferred charges 3 3Fair value on non-hedging derivatives 2
3 5
Other assets amount to €5 million (€3 million as at December 31, 2013) and mainly include the prepaid expenses and the fair value of derivatives without the formal requirements to be classified as hedge accounting. The fair value of derivatives (not qualifying as “hedges” but not of a speculative nature) is accounted for on the basis of the values determined and communicated by the parent company Eni SpA. These are derivatives which, while not having a trading or speculative purpose, do not meet the requirements of the IAS/IFRS standards to qualify as hedges. The nominal value of a derivative is the contractual amount on the basis of which the differentials are exchanged. This amount can be expressed either on a value basis or on a physical quantities basis (barrels, metric tons, etc.). Monetary amounts expressed in foreign currency are translated into euro by applying the exchange rate at the year end. The notional amounts of derivatives summarized below do not represent amounts exchanged by the parties and consequently do not constitute a measure of the company’s exposure to credit risk, which is limited to the positive market value (fair value) of the contracts at the year end, less the effect of possible general offset arrangements. The fair value of non-hedging derivatives can be broken down as follows:
(amount in millions of euros) Fair value Commitments Fair value CommitmentsDerivatives on exchange rates: - Outright 82 2 5 - Currency swap 65 113 - Over the counter 65
212 2 118
31.12.2013 31.12.2014
66

Versalis / Consolidated Financial Statements 2014/ Notes to the Financial Statements
Non-current assets 7. Property, plant and equipment Property, plant and equipment can be broken down as follows:
(amount in millions of euros) Net
val
ue a
t the
be
ginn
ing
of th
e ye
ar
Inve
stm
ents
Dep
reci
atio
n an
d am
ortiz
atio
n
Impa
irm
ent l
osse
s an
d re
vers
als
Cur
renc
y tr
ansl
atio
n di
ffere
nces
Ope
ratio
ns o
n bu
sine
ss u
nits
Oth
er v
aria
tions
Net
val
ue a
t the
end
of
the
year
Gro
ss v
alue
at t
he
end
of th
e ye
ar
Pro
visi
ons
for
depr
ecia
tion
and
impa
irm
ents
31.12.2013Land 105 105 113 8
Buildings 55 (5) (5) 4 49 330 281
Plant and machinery 581 50 (73) (20) 39 577 3,432 2,855
Industrial and commercial equipment 3 (2) 2 3 110 107 Other assets 2 1 3 55 52
Assets under construction and advances 147 238 (16) (46) 323 578 255 893 288 (80) (41) 1,060 4,618 3,558
31.12.2014Land 105 (2) 103 111 8 Buildings 49 1 (4) 15 61 346 285 Plant and machinery 577 38 (79) (76) 110 570 570 Industrial and commercial equipment 3 (2) 1 110 109 Other assets 3 3 55 52
Assets under construction and advances 323 231 (20) 4 (126) 412 687 275 1,060 270 (85) (96) 4 (2) (1) 1,150 1,879 729
The investments of €270 million (€288 million in 2013) are discussed in the relevant section of the Director’s report. Finance expenses eligible for capitalization, determined by using a 3.20% interest rate (3.34% in 2013), amounted to €6 million (€4 million in 2013). Capitalized increases for internal work incurred during the year amounted to €12 million (€10 million in 2013) and consisted of work carried out by internal personnel.
The following annual depreciation rates were:
(annual %) 2013 2014Buildings 4 - 16 4 - 16Plant and machinery 4 - 25 4 - 25Industrial and commercial equipment 10 - 30 10 - 30Other assets 12 - 20 12 - 20
The net write-downs of €96 million stem from the results of impairment tests and refer to the following Cash
Generating Units (CGU):
- Dunkirk facility (€63 million); - SBR and Latex plants in Ravenna (€14 million); - Sarroch facility (€9 million);
67

Versalis / Consolidated Financial Statements 2014/ Notes to the Financial Statements
- Porto Marghera facility (€7 million); - Ragusa facility (€4 million); - Hythe facility (utilized €1 million of the provision for impairment).
Impairment losses are net of the use of public funds relating to the plants in Sarroch and Priolo (€3 million). For further details, see the paragraph “Grants” in “Accounting policies”. Despite the gradual improvement recorded in 2014 and the expectations envisaged by the 2015-18 plan, the operating loss recorded during the year, caused by Europe weak demand, the oversupply in some businesses (Butadiene and Elastomers) and the intrinsic negative profit conditions of some critical sites, represented impairment indicators for the management. These are further discussed in the sections “Comment on the economic and financial results” and “Business Outlook” of the Director’s report to which reference is made. Consequently, the management carried out impairment tests on non-financial fixed assets; for this purpose, these assets were grouped together in Cash Generating Units, which correspond mainly to the production facilities. Management has identified the production sites as CGUs, due both to the high operational autonomy of the individual plants, and to the fact that, even within the same business sector, operating and profit conditions may differ. Nevertheless, where present at the same site, or at least linked together within the same geographical area, the close interdependence between the olefin cycle and the polyethylene and aromatics cycles entailed the need to group certain sites together, while in certain cases the co-existence of the styrene, elastomer and intermediates businesses, which are characterized by greater reciprocal independence, within the same production site, led to the sub-division of the sites involved into a set of different CGUs. On the basis of the above, management identified the following CGUs: styrenes at Mantua; intermediates at Mantua; Porto Marghera site (olefins and aromatics); polyethylene at Ferrara; elastomers at Ferrara; SBR/latexes at Ravenna; BR/TPR at Ravenna; Cracker and polyethylene at Brindisi; butadiene at Brindisi; Sarroch facility; Priolo facility (olefins and aromatics); Ragusa site; olefins, aromatics and polyethylene at Porto Torres; elastomers at Porto Torres; Dunkirk site; Oberhausen site; Grangemouth site and Szàzhalombatta site. The impairment loss was calculated by comparing the carrying amount of each CGU with its value in use determined by discounting to present the expected cash flows deriving from use of the assets in a time period coinciding with the average remaining useful life of the CGU. The cash flows for the period 2015-2018 were determined on the basis of the forecast for operating profits contained in the Strategic Plan approved by the Board of Directors; cash flows for the subsequent years were determined taking as a reference an average operating profit calculated taking into account both the final figures and the forecasts included in the 2015-2018 Plan, in order to represent in an adequate manner the marked cyclical effects that characterize the petrochemical industry. In identifying the reference time period, the management also took into consideration the assessments of useful life carried out by independent experts in previous years. In discounting the cash flows determined with the above methods and according to the above criteria, management adopted the discount rate of 6.0% (7.4% as of December 31, 2013) communicated by the parent company Eni SpA. Business operations refer to the divestment of the Sarroch Aromatics business (€2 million). The other changes mainly included the reclassification from fixed assets under construction to the relative finished asset category. There are no mortgages or special privileges existing on the plant, property and equipment. The net amount of government grants and refunds from third parties is stated as a reduction in the value of property, plant and equipment amounted to €63 million (€70 million as of December 31, 2013). The award of public grants entails a number of constraints on the assets in relation to which they were awarded. These constraints consist essentially of the obligation not to remove the subsidized assets from the use envisaged for at least five years from the date of their commissioning. Non-compliance with this obligation entitles the granting body to seek repayment of the grant, plus interest.
68

Versalis / Consolidated Financial Statements 2014/ Notes to the Financial Statements
8. Intangible assets Intangible assets are comprised of the following:
(amounts in millions of euros) Net
val
ue a
t the
be
ginn
ing
of th
e ye
ar
Add
ition
s
Dep
reci
atio
n a
nd
amor
tizat
ion
Net
val
ue a
t the
end
of
the
year
Gro
ss v
alue
at t
he
end
of th
e ye
ar
Acc
umul
ated
am
ortiz
atio
n an
d im
pair
men
t
31.12.2013Intangible assets with finite useful lives - Research and development costs 3 3
- Industrial patents and intellectual property rights 3 3 - Concessions, licenses, trademarks and similar items 2 2 98 96
- Fixed assets in progress and advances 1 3 4 9 5
- Other intangible assets 66 (5) 61 146 85
69 3 (5) 67 259 192 31.12.2014Intangible assets with finite useful lives - Research and development costs 3 3
- Industrial patents and intellectual property rights 3 3
- Concessions, licenses, trademarks and similar items 2 1 3 99 96
- Fixed assets in progress and advances 4 3 7 12 5
- Other intangible assets 61 (4) 57 146 89
67 4 (4) 67 263 196 Concessions, licenses and trademarks relate essentially to industrial licenses. Other intangible assets relate mainly to intellectual property rights for the license contract with Union Carbide (€48 million). It should be noted that this license contract was subject to an impairment test as it is included within the scope of the Brindisi production plant cash generating unit (for further details on the criteria for identifying cash generating units see Note 7). The remaining amortization period for the Union Carbide royalties is 12 years. The following annual amortization rates were adopted:
(annual %) 2013 2014Intangible assets with finite useful lives - Concessions, licenses, trademarks and similar items 4 - 33 4 - 33 - Other intangible assets 4 - 15 4 - 15
No grants were recorded as deductions from the value of intangible assets.
69

Versalis / Consolidated Financial Statements 2014/ Notes to the Financial Statements
9. Equity-accounted investments Equity-accounted investments include the following:
(amounts in millions of euros) Net
val
ue
at t
he
beg
inn
ing
of
the
year
Acq
uis
itio
ns
and
su
bsc
rip
tio
ns
Dis
po
sals
Sh
are
of
pro
fit
on
eq
uit
y-ac
cou
nte
d
inve
stm
ents
Ded
uct
ion
s fo
r d
ivid
end
s
Oth
er c
han
ges
Net
val
ue
at t
he
end
o
f th
e ye
ar
31.12.2013Investments in:- subsidiaries 10 (6) 4
- associates 23 41 36 100
- joint ventures 16 29 (1) 44
49 70 (1) 30 148 31.12.2014Investments in:- subsidiaries 4 4
- associates 100 (2) 1 99
- joint ventures 44 13 (5) 52
148 13 (2) (5) 1 155
Acquisitions and subscriptions relate to the share capital increase of the joint ventures Lotte Versalis Elastomers Co. Ltd (€10 million) and Newco Tech SpA (€3 million). The disposal of €2 million relates to the investment in the associated company Priolo Servizi Scarl. Capital losses on equity-accounted investments of €5 million relate to Newco Tech SpA. The equity-accounted investments relate to the following companies:
The ownership percentages are shown in Note 38.
Other information on investments
The assets, liabilities, revenues, costs and operating profit/(loss) of unconsolidated subsidiaries, associated companies and joint ventures are detailed in the table below:
(amount in millions of euros) 31.12.2013 31.12.2014Novamont SpA 77 77 Lotte Versalis Elastomers Co Ltd 21 31 Matrìca SpA 17 17 Priolo Servizi Industriali Scarl 16 15 New co Tech SpA 5 3 Versalis Kimya Ticaret Limited Sirketi 4 4 Servizi Porto Marghera Scarl 3 3 Ravenna Servizi Industriali ScpA 2 2 Brindisi Servizi Generali Scarl 1 1 Polimeri Europa Polska Sp.zo.o.Polimeri Europa Norden A/SPolimeri Europa Hellas SAOthers (*) 2 2
148 155(*) Amounts of less than €1 million
70

Versalis / Consolidated Financial Statements 2014/ Notes to the Financial Statements
(amounts in millions of euros) Subs
idia
ries
Join
t ven
ture
s
Asso
ciat
es
Subs
idia
ries
Join
t ven
ture
s
Asso
ciat
es
Current assets 3 25 33 2 39 32Non-current assets 77 78 3 133 121Total assets 3 102 111 5 172 153Current liabilities 1 51 46 7 110 38Non-current liabilities 10 7 1 10 15Total liabilities 1 61 53 8 120 53
Revenue 2 2 93 2 7 91Costs (1) (68) (93) (1) (15) (87)Operating profit (loss) 1 (66) 1 (8)Profit (Loss) for the period 1 54 (1) (1) (8) (1)
31.12.2013 31.12.2014
10. Other investments
Other investments include the following:
(amount in millions of euros) Net
val
ue a
t the
be
ginn
ing
of th
e ye
ar
Acq
uisi
tions
and
su
bscr
iptio
ns
Oth
er c
hang
es
Net
val
ue a
t the
end
of
the
year
31.12.2013Investments in:- other companies 52 (37) 15
52 (37) 15 31.12.2014Investments in:- other companies 15 15
15 15
Other investments relate to the following companies:
(amounts in millions of euros) 31.12.2013 31.12.2014Genomatica Inc. 12 12 Consorzio Exeltium SAS 3 3
15 15
The ownership percentages are shown in Note 39.
71

Versalis / Consolidated Financial Statements 2014/ Notes to the Financial Statements
11. Other financial assets Other financial assets of €72 million (€1 million as at December 31, 2013) essentially refer to the loan granted to Matrìca SpA, the joint venture with Novamont SpA, for Phase 1 of the Green Hub project in Porto Torres. 12. Deferred tax assets Deferred tax assets amounted to €617 million (€427 million as of December 31, 2013) net of deferred tax liabilities of €63 million (€65 million as of December 31, 2013).
(amount in millions of euros) 31.12.2013 31.12.2014Deferred tax assets 492 680 Deferred tax liabilities available for offset (65) (63)
Net deferred tax assets 427 617
Income taxes are discussed in Note 33.
The deferred tax assets derive from the following timing differences:
(amount in millions of euros) Am
ount
at
31.1
2.20
13
Add
ition
s
Ded
uctio
ns
Oth
er c
hang
es
Am
ount
at
31.1
2.20
14
Deferred tax assets: - non-deductible impairment losses 139 9 (31) 117 - expenses with deferred deductibility 20 3 (12) 2 13 - tax losses 267 182 449 - provisions for risks and charges 17 7 (5) 19 - other 67 28 (4) 9 100 - (impairments)/reversal of prepaid tax assets (18) (18)
492 229 (52) 11 680Deferred tax liabilities: - excess amortization/depreciation 44 (3) 41 - other 21 3 (2) 22
65 3 (5) 63Net deferred tax assets 427 226 (47) 11 617
13. Other Assets Other assets of €4 million (unchanged from December 31, 2013) relate essentially to a refund claim on IRAP receivables.
72

Versalis / Consolidated Financial Statements 2014/ Notes to the Financial Statements
Current liabilities 14. Short-term debt Short-term debt amounting to €1,788 million (€1,040 million at December 31, 2013) mainly relates to loans granted by Eni SpA and Eni Finance International SA.
(amount in millions of euros) 31.12.2013 31.12.2014Payables to parent companies for loans 831 1,519 Commercial papers 21 61 Other financial institutions 188 208
1,040 1,788 Short-term debt in foreign currencies other than euro amounted to €56 million (€8 million at December 31, 2013), in pounds sterling and US dollars. The average annual interest rate for the year was 1.07% (1.42% in 2013). 15. Current portion of long-term debt The current portion of long-term debt amounted to €3 million (unchanged from December 31, 2013) as indicated in Note 20 “Long-term debt and current portion of long-term debt”, to which the reader is referred. 16. Trade and other payables Trade and other payables include the following:
(amounts in millions of euros) 31.12.2013 31.12.2014Trade payables 1,006 853Other payables:- relating to capital expenditures 31 34- other 84 82
1,121 969
Trade payables of €853 million relate to payables to suppliers (€354 million), payables to associates, joint ventures and other Eni Group companies (€359 million) and payables to the parent company Eni SpA (€140 million). Payables related to capital expenditures amounted to €34 million. Other payables which amounted to €82 million are comprised mainly of payables towards personnel (€49 million) and payables to social security authorities (€16 million). Because of the short-term nature of trade and other payables, the fair value of these payables does not significantly differ from their carrying value. Payables to related parties are reported in Note 34.
73

Versalis / Consolidated Financial Statements 2014/ Notes to the Financial Statements
17. Current income tax payable Income taxes payable of €1 million (unchanged from December 31, 2013) relate to the income tax of foreign consolidated companies.
18. Other current taxes payable Other taxes payable of €10 million (unchanged from December 31, 2013) relate mainly to withholding tax.
19. Other liabilities Other liabilities can be broken down as follows:
(amount in millions of euros) 31.12.2013 31.12.2014Accrued expenses 3Fair value on non-hedging derivatives 2 5
2 8
The fair value and commitments of non-hedging derivatives can be broken down as follows:
(amount in millions of euros) Fair value Commitments Fair value CommitmentsDerivatives on exchange rates: - Outright 1 152 22 - Currency swap 66 1 17 - Over the counter 1 5 4 31
2 223 5 70
31.12.2013 31.12.2014
The fair value of derivatives not qualifying as “hedges” but not of a speculative nature is accounted for on the basis of the values determined and communicated by the parent company Eni SpA. These are derivatives which, while not having a trading or speculative purpose, do not meet the requirements of the IAS/IFRS standards to qualify as hedges. The nominal value of a derivative is the contractual amount on the basis of which the differentials are exchanged. This amount can be expressed either on a value basis or on a physical quantities basis (barrels, metric tons, etc.). Monetary amounts expressed in foreign currency are translated into euro by applying the exchange rate at the year-end. The nominal values of derivatives do not represent amounts exchanged by the parties and consequently do not constitute a measure of the company’s exposure to credit risk, which is limited to the negative market value (fair value) of the contracts at the year end, less the effect of any general offset arrangements.
Non-current liabilities 20. Long-term debt and current portion of long-term debt Long-term debt and current portion thereof amounts to €825 million (€705 million at December 31, 2013), detailed in the table below:
74

Versalis / Consolidated Financial Statements 2014/ Notes to the Financial Statements
Portions at Portions at Portions at Portions at(amount in millions of euros) long-term short-term Total long-term short-term TotalBanksShareholders for loans 600 3 603 670 3 673Other financial institutions 102 102 152 152
702 3 705 822 3 825
31.12.2013 31.12.2014
The average effective interest rate for the year was 3.41% (4.46% in 2013). For more information see the section “Leverage and net borrowings” of the Directors’ Report. The table below shows the maturity of long-term debt, inclusive of the current portion: (amount in millions of euros)Type 2013 2014 Mat. 2015 2016 2017 2018 2019 Beyond TotalShareholders for loans 603 673 3 300 300 70 673Other financial institutions 102 152 15 135 2 152
705 825 3 315 435 72 825
Value at December 31 Long-term maturity
The financial liabilities are not guaranteed by mortgages or privileges on the company's real estate. The breakdown of net borrowings indicated in the “Comments on the economic and financial results” in the “Directors' Report” is as follows:
(amount in millions of euros) Current Non-current Total Current Non-current TotalA. Cash and cash equivalents 80 80 79 79B. Available-for-sale securities C. Liquidity (A+B) 80 80 79 79D. Financial receivables
E. Short-term debt towards banks 61 61
F. Long-term debt towards banksG. BondsH. Short-term debt towards related entities 1,037 1,037 1,727 1,727I. Long-term debt towards related entities 3 702 705 3 820 823L. Other short-term debt 2 2M. Other long-term debt 2 2N. Total borrowings (E+F+G+H+I+L+M) 1,042 702 1,744 1,791 822 2,613O. Net borrowings (N-C-D) 962 702 1,664 1,712 822 2,534
31.12.2013 31.12.2014
75

Versalis / Consolidated Financial Statements 2014/ Notes to the Financial Statements
21. Provisions for risks and charges
(amount in millions of euros) 31.12.2013 31.12.2014Provisions for disposal and restructuring 56 59Provision for legal and other proceedings 39 34Provision for environmental risks 15 22Provisions for redundancy incentives 33 17Provision for losses on investments 7 7Provision for tax litigation risks 3 2Provision for OIL insurance 2 2Other provisions 4 4
159 147
The following movements took place in provisions for risk and charges:
Provisions for disposal and restructuring of €59 million are related to the shutdown of the Hythe (UK) site and divestment of the Sarroch Aromatics business. The provisions for litigation of €34 million relate mainly to litigation over revocation actions (€18 million) and litigation over antitrust legislation (€16 million), discussed in greater detail in the paragraph “Litigation”). Provisions for environmental risks of €22 million include costs for environmental expenses relating to the various Versalis SpA sites for the part not covered by the warranty issued by Syndial SpA at the time of the transfer of the “Strategic Chemical Activities” business unit (see the section “Accounting policies – Grants”) amounting to €8 million and costs for environmental liabilities of €14 million relating to Versalis France SAS. Provisions for redundancy incentives of €17 million relate to expenses for ordinary redundancy procedures.
(amount in millions of euros) Val
ue a
t the
be
ginn
ing
of th
e ye
ar
Add
ition
s
Util
izat
ion
of
prov
isio
ns
Rev
ersa
l of
unut
ilize
d pr
ovis
ions
Oth
er c
hang
es
& fo
reig
n cu
rrenc
y tra
nsla
tion
Val
ue a
t the
en
d of
the
year
31.12.2013Provisions for disposal and restructuring 56 56 Provision for legal and other proceedings 62 4 (27) 39 Provisions for redundancy incentives 17 22 (4) (2) 33 Provision for environmental risks 10 5 15 Provision for losses on investments 9 (2) 7 Provisions for tax litigation 4 1 (2) 3 Provision for OIL insurance 3 (1) 2 Other provisions 5 1 (2) 4
110 89 (36) (4) 159 31.12.2014Provisions for disposal and restructuring 56 20 (21) 4 59 Provision for legal and other proceedings 39 (5) 34 Provision for environmental risks 15 8 (1) 22 Provisions for redundancy incentives 33 2 (12) (6) 17 Provision for losses on investments 7 7 Provisions for tax litigation 3 2 (2) (1) 2 Provision for OIL insurance 2 (1) 1 2 Other provisions 4 4
159 32 (42) (7) 5 147
76

Versalis / Consolidated Financial Statements 2014/ Notes to the Financial Statements
Provisions for losses on investments of €7 million include provisions against losses exceeding the shareholders’ equity of associated companies and relate to Polimeri Europa Elastomères France SA in liquidation. Provisions for tax litigation of €2 million are commented on in the section “Litigation”. Provisions for OIL insurance of €2 million include the expenses related to the surcharge on insurance premiums to be paid in the next five financial years to Mutua Assicurazione Oil Insurance Ltd in which the Eni Group, along with other oil companies, has an interest. The other provisions of €4 million consist mainly of social security contributions and employee termination benefits relating to the deferred cash incentive for senior managers of €2 million and future charges for the purchase of green certificates of €1 million. 22. Provisions for employee benefits Provisions for employee benefits amounted to €76 million as detailed in the table below:
(amounts in millions of euros) 31.12.2013 31.12.2014Employee termination indemnities (TFR) 46 50 Supplementary medical reserve for Eni managers (FISDE) and other foreign medical plans 9 10 Foreign pension plans 5 3 Other benefits 14 13
74 76
Employee termination indemnities (“TFR”) due upon termination of employment are regulated by Art. 2120 of the Italian Civil Code and represent the obligation, calculated on the basis of actuarial techniques, due to employees of Italian companies at the moment of termination of their employment. The indemnity, to be paid in capital lump sum, is calculated on the basis of the salary paid and revalued annually up until termination of employment. Following the legislative changes introduced with effect from January 1, 2007, the amount of severance indemnity accruing after that date is placed into pension funds, or into the treasury fund held by the Italian Pension Agency (INPS) or, in the case of companies with fewer than 50 employees, it can be placed at the employer. This means that a significant portion of this accruing amount will be classified as a defined contribution plan, because the entity’s obligation corresponds exclusively to the payment of contributions to pension fund or to the INPS. The liability for termination indemnities set aside prior to January 1, 2007 continues to be a defined-benefit plan and must be assessed based on actuarial assumptions. Foreign defined-benefit schemes are related in particular to provisions for pension plans, which relate to defined-benefit pension schemes adopted by non-Italian companies chiefly in Germany and the UK. The benefit is an income determined on the basis of seniority and the salary paid during the last year of service or according to the average annual salary paid in a given period and prior to the end of the employment relationship. The liability for healthcare costs relative to the Managers Supplementary Healthcare Fund for companies of the Eni Group (FISDE) and other foreign medical plans are determined with reference to the contribution that the company pays for retired senior managers. The other provisions for long-term employee benefits mainly regard the deferred cash incentive plans, the long-term incentive plan and the seniority bonuses. The figures for deferred cash incentive plans include the estimated amount of variable remuneration linked to business performance which will be paid to senior managers who have achieved the individual targets set. The long-term incentive plan (ILT) provides for payment, after three years of assignment, of a variable monetary benefit linked to the trend in a performance parameter compared to a benchmark group of international oil companies. The seniority awards are benefits distributed upon the achievement of a minimum period of service with the company and, with regard to Italy, are paid in kind.
77

Versalis / Consolidated Financial Statements 2014/ Notes to the Financial Statements
Provisions for employee benefits, measured applying actuarial techniques, are analysed as follows:
(amounts in millions of euros) TFR
Foreign defined-
benefit schemes
FISDE and foreign
medical plans
Other provisions
for long-term
employee benefits Total
Present value of obligations at the beginning of the year 47 36 10 15 108Current cost 1 3 4Interest costs 1 1 1 3Remeasurements: (1) (1) (2) (4)
- From financial assumptions (1) (1)- From past experience (1) (1) (1) (3)
Cost for past services and Gains/losses by extinction (3) (3)Benefits paid (2) (1) (1) (4)Effect of business combinations, disposals, transfers 1 1Currency exchange differences and other changes (1) (1)
Present value of obligations at the end of the period (a) 46 35 9 14 104Plan assets at the beginning of the year 29 29Interest income 1 1Return on plan assetsContributions to the scheme: 1 1
- Contributions by the employer 1 1Benefits paid (1) (1)Currency exchange differences and other changesPlan assets at the end of the year (b) 30 30Redemption rights at the end of the year (c)Ceiling of assets/liabilities incurred at the beginning of the year Ceiling of assets/liabilities incurred at the end of the year (d)Net liabilities recognized in the financial statements (a-b±d) 46 5 9 14 74
31.12.2013
78

Versalis / Consolidated Financial Statements 2014/ Notes to the Financial Statements
(amounts in millions of euros) TFR
Foreign defined-
benefit schemes
FISDE and foreign
medical plans
Other provisions
for long-term
employee benefits Total
Present value of obligations at the beginning of the year 46 35 9 14 104Current cost 3 3Interest costs 1 1 2Remeasurements: 6 2 1 9
- Actuarial gains and losses from changes in demographic assumptions- From financial assumptions 7 4 1 12- From past experience (1) (2) (3)
Cost for past services and Gains/losses by extinctionBenefits paid (2) (2) (3) (7)Effect of business combinations, disposals, transfers (1) (1)Currency exchange differences and other changes 2 (1) 1
Present value of obligations at the end of the period (a) 50 38 10 13 111Plan assets at the beginning of the year 30 30Interest income 1 1Return on plan assets 3 3Contributions to the scheme:
- Contributions by the employer 1 1Benefits paid (2) (2)
of which by extinctionEffect of business combinations, divestitures, transfersChange in the consolidation areaCurrency exchange differences and other changes 3 3Plan assets at the end of the year (b) 35 35Redemption rights at the end of the year (c)Ceiling of assets/liabilities incurred at the beginning of the year Ceiling of assets/liabilities incurred at the end of the year (d)Net liabilities recognized in the financial statements (a-b±d) 50 3 10 13 76
31.12.2014
Other provisions for long-term employee benefits of €13 million (€14 million at December 31, 2013) primarily concern seniority awards for €6 million (€7 million at December 31, 2013), deferred monetary incentives for €6 million (unchanged from December 31, 2013) and the long-term incentive plan for €1 million (unchanged from December 31, 2013).
79

Versalis / Consolidated Financial Statements 2014/ Notes to the Financial Statements
The costs relating to liabilities for employee benefits recorded in the income statement include the following:
(amounts in millions of euros) TFR
Foreign defined-
benefit schemes
FISDE and other
foreign medical
plans
Other provisions
for long-term
employee benefits Total
2013Current cost 3 3 Cost for past services and gains/loss by extinction (3) (3)Net interest expense (income):
- Interest expense on the obligation 1 1 1 3 - Interest income on the plan assets (1) (1)
Total net interest expense (income) 1 1 2 - of which recognized in payroll and related costs 1 1 - of which recognized in financial income (expense) 1 1
Total 1 1 2 - of which recognized in the cost of labour 1 1 - of which recognized in financial income (expense) 1 1
2014Current cost 3 3 Cost for past services and gains/loss by extinctionNet interest expense (income):
- Interest expense on the obligation 1 1 2 - Interest income on the plan assets (1) (1)
Total net interest expense (income) 1 1 - of which recognized in financial income (expense) 1 1
Total 1 3 4 - of which recognized in the cost of labour 3 3 - of which recognized in financial income (expense) 1 1
The cost of defined-benefit plans included in the other items of the comprehensive income/loss are analysed as follows:
(amount in millions of euros) TFR
Foreign defined-
benefit schemes
FISDE and
foreign medical
plans
Other provisions
for long-term
employee benefits Total TFR
Foreign defined-
benefit schemes
FISDE and
foreign medical
plans
Other provisions
for long-term
employee benefits Total
Remeasurements:- Actuarial gains and losses from changes in financial assumptions (1) (1) 7 4 1 12- Effect of past experience (1) (1) (1) (4) (1) (2) (3)
(1) (1) (2) (5) 6 2 1 9
31.12.2013 31.12.2014
The main actuarial assumptions used to measure the liabilities at the end of the year and to determine the cost of the next year are indicated below:
80

Versalis / Consolidated Financial Statements 2014/ Notes to the Financial Statements
(%)
TFR Foreign defined-
benefit schemes
FISDE and other
foreignmedical
plans
Other provisions
for long-term
employee benefits
2013Discount rate 3.0 2.8 3.0 1.1-3.0Wage growth trend rate 2.5Inflation rate 2.0 2.7 2.0 2.02014Discount rate 2.0 2.0-3.4 2.0 0.5-2.0Wage growth trend rate 2.0-3.4 3.0Inflation rate 2.0 2.0-2.9 2.0 2.0
The discount rate used was determined based on corporate bond yields (rating AA) in countries where the relevant market is sufficiently significant, or otherwise government bond yields. The demographic tables adopted are those used by each country for the assessments of IAS 19. The inflation rate was determined by considering the long-term forecasts issued by national or international banks. The amount of contributions expected to be paid into defined-benefit plans in the next year totals €6 million. 23. Deferred tax liabilities Deferred tax liabilities amounted to €14 million (€19 million at December 31, 2013) net of deferred tax assets of €34 million (€24 million at December 31, 2013).
(amount in millions of euros) 31.12.2013 31.12.2014Deferred tax liabilities 43 48 Deferred tax assets available for offset (24) (34)Net deferred tax liabilities 19 14
81

Versalis / Consolidated Financial Statements 2014/ Notes to the Financial Statements
The most significant timing differences are detailed below:
(amount in millions of euros) Am
ount
at
31.1
2.20
13
Add
ition
s
Ded
uctio
ns
Am
ount
at
31.1
2.20
14
Deferred tax liabilities: - excess amortization/depreciation 40 (1) 39 - other 3 6 9
43 6 (1) 48
Deferred tax assets: - tax losses 117 26 143 - other 7 7 - impairment of deferred tax assets (100) (16) (116)
24 10 34Net deferred tax assets 19 (4) (1) 14
24. Other non-current liabilities
These amount to €9 million (€6 million at December 31, 2013) and relate primarily to payables to pension and social security authorities for redundancy expenses.
25. Shareholders' equity
The shareholders’ equity amounts to €407 million (€952 million at December 31, 2013) as detailed below: (amount in millions of euros) 31.12.2013 (*) 31.12.2014Share capital 1,553 1,553
Reserve for exchange differences (6) (2)Other reserves: (5) (9)
Business combination under common control reserve 2 2 Reserve for defined-benefit plans for employees net of tax effect (7) (11)
Retained earnings/(losses) brought forward 35 (590)Loss for the period (625) (545)
952 407 (*) Data reclassified for consistency of presentation.
Share capital The share capital consists of 1,553,400,000 ordinary shares without par value, owned exclusively by Eni SpA. For information on management of the capital, see the specific section “Financial Risk Management – Capital Management”.
82

Versalis / Consolidated Financial Statements 2014/ Notes to the Financial Statements
Reconciliation of net profit and shareholders’ equity of Versalis SpA with the consolidated data
(amount in millions of euros) 2013 2014 31.12.2013 31.12.2014
As recorded in annual Financial Statements of Versalis SpA (551) (594) 997 398
Difference between the equity value of individual accounts of consolidated subsidiaries, with respect to the corresponding carrying amount in the statutory accounts of the parent company (51) 71 (63) 11Consolidation adjustments:- elimination of tax adjustments and compliance with accounting policies (29) (43) 29 (12)- deferred taxation 6 21 (11) 10As recorded in Consolidated Financial Statements (625) (545) 952 407
Profit (loss) for the period Shareholders' equity
26. Guarantees, commitments and risks Guarantees Guarantees can be broken down as follows:
31.12.2013 31.12.2014
(amount in millions of euros) FidejussionsOther
guarantees Total FidejussionsOther
guarantees TotalConsolidated subsidiaries 91 91 82 82Other 1 4 5 1 7 8
1 95 96 1 89 90
The fidejussions provided in the interest of others of €1 million relate to the guarantee issued in favour of Serfactoring SpA, on behalf of employees of Versalis SpA who have obtained loans from Serfactoring SpA. Other guarantees of €82 million provided on behalf of consolidated companies relate to indemnities given to Eni SpA and Syndial SpA, which in turn grant guarantees in favour of third parties on behalf of the Versalis Group companies. The effective commitment at December 31, 2014 amounted to €82 million.
Commitments and risks Commitments and risks can be broken down as follows:
(amount in millions of euros) 31.12.2013 31.12.2014CommitmentsOperating leases 3 3
3 3RisksThird party assets 7 5Other risks 39
7 4410 47
Third-party assets held by the Group relate mainly to Syndial technical material (€3 million) stored at various
Versalis Group sites. Other risks concern costs related to the divestment of the Sarroch Aromatics business.
83

Versalis / Consolidated Financial Statements 2014/ Notes to the Financial Statements
Financial risk management Introduction The following main financial risks are identified, monitored and, as regards those specified below, actively managed by the Versalis Group: (i) market risk deriving from exposure to fluctuations in interest rates and exchange rates, and to the volatility of commodity prices; (ii) credit risk deriving from the possibility of default of a counterpart; (iii) liquidity risk deriving from the lack of financial resources to cover short-term commitments. Financial risk management is based on guidelines issued centrally by the parent company Eni SpA with the aim of harmonizing and coordinating Eni's policies on financial risks. The paragraphs below provide a description of the main financial risks, the methods adopted for the management thereof, as well as details of the exposure to market risks (the indication of the exposure to market risks is based on a sensitivity analysis12 or through an indication of the Value at Risk results). Market risk Market risk is the possibility that changes in foreign currency exchange rates, interest rates or commodity prices will adversely affect the value of the assets, liabilities or expected future cash flows. Market risk management is governed by the “Guidelines” approved by the company's Board of Directors and by internal procedures, which make reference to a centralized financial asset management model, based on distinct Operational Finance structures (Eni Corporate Finance, Eni Finance International, Eni Finance USA and Banque Eni, this last within the limits set by banking legislation on “Concentration Risk”) which ensure coverage of the requirements and absorption of financial surpluses of the Italian and foreign Versalis Group companies. In addition, as regards trading in derivatives on commodities, management is entrusted to Eni Trading & Shipping SpA and Eni SpA. In particular, all the Versalis Group’s transactions in foreign currency and in derivatives are managed by Eni SpA, together with the trading of emission certificates. Commodity price risk is managed by the individual business units and Eni Trading & Shipping trades in hedging derivatives. The Versalis Group uses derivative financial instruments and derivatives on commodities in order to minimize exposure to market risks related to changes in exchange rates and interest rates and to manage exposure to commodity price fluctuations. The Versalis Group does not enter into derivative transactions for speculative purposes. Versalis has defined financial activity guidelines which quantify the maximum exchange and interest rate risk that can be assumed and define the characteristics of suitable counterparties. As regards commodity risk, Versalis has set maximum limits on price risk deriving from commercial activities. The steering functions in this case are entrusted to a Commodity Risk Committee. Exchange rate risk Exchange rate risk derives from the fact that operations are conducted in currencies other than the euro (in particular the US dollar) and from the timing difference between recognition of revenues and costs in a currency other than the reporting currency and their collection/payment (transaction exchange rate risk). Exchange-rate derivatives are measured at fair value on the systematic basis of market prices provided by leading info-providers. The value at risk technique (VaR) deriving from exchange rate risk positions is calculated daily using the parametric approach (variance/covariance), adopting a 99% confidence level and a 20-day holding period.
12 Sensitivity analysis is applied to financial instruments at floating interest rate, to instruments carried at fair value (non-hedging derivatives, cash flow hedging derivative, financial assets available for sale); and to financial instruments exposed to exchange rate risk.
84

Versalis / Consolidated Financial Statements 2014/ Notes to the Financial Statements
Interest rate risk Fluctuations in interest rates affect the market value of the financial assets and liabilities of the company and the level of its net finance expense. The Versalis Group’s risk management objective is the minimization of interest rate risk in pursuance of the financial structure targets defined and approved in the “Financial Plan”. The Eni Operational Finance Units, in accordance with the centralized finance model, receive information on the Group's requirements and manage the resulting positions, including operations of a structural nature, in keeping with the targets of the “Financial Plan”, ensuring that the risk profile remains within the set limits. Commodity risk The Versalis Group’s results are affected by changes in prices of the products sold. A decrease in the prices of plastics and chemical intermediates generally has a negative impact on the company's operating profit and vice versa. Conversely, an increase in the costs of petroleum feedstock leads to a reduction in operating profit and vice versa. For example, it can be estimated that an increase of US $10 per metric ton of petroleum feedstock would lead to a reduction in the annual operating profit of around €35 million while a rise of 10 cents in the euro against the US dollar would lead to an increase of around €215 million in the annual operating profit. Credit risk Credit risk is the potential exposure of the Group to losses in the event that counterparties fail to fulfil their obligations. Versalis approaches the risks relating to counterparties for commercial transactions with different policies, with respect to those relating to counterparties for financial transactions, in accordance also, as far as the latter are concerned, with the centralized finance model adopted. As regards counterparty risk in commercial contracts, credit management is the responsibility of the business units and of the dedicated specialist Eni Corporate units, on the basis of formal procedures to assess and grant credit to commercial partners, including credit recovery activities and possible litigation management. At the Corporate level, guidelines and methodologies are defined to quantify and control customer risk. As regards the financial counterparty risk deriving from the use of cash, positions in derivative contracts and transactions with an underlying physical basis with financial counterparties, the above-mentioned "Guidelines" identify the objective of risk management as the optimization of the risk profile in pursuance of the operating targets. The maximum risk limits are expressed in terms of the maximum credit granted by classes of counterparties, defined at the Board of Directors level and based on ratings provided by the leading Agencies. The risk is managed by Eni's Operational Finance Units, by Eni Trading & Shipping and Eni SpA for trading in commodity derivatives, and by the companies and Divisions only for transactions with an underlying physical basis with financial counterparties, in keeping with the centralized finance model. As regards the ceilings defined for rating classes, for each operating structure the lists of names of authorized counterparties are identified, assigning to each a maximum credit limit, which is monitored and checked daily. The critical situation that occurred on the markets starting from financial year 2008 led to the adoption of stricter rules, namely risk diversification and rotation of financial counterparties, and of selectivity for transactions in derivatives with duration of more than three months.
During 2014 the trade receivables situation improved, even though the macroeconomic situation showed further significant deterioration compared to the previous year, in line with the improvement trend that has been ongoing in recent years. In particular, overdue receivables have decreased compared to 2013, due to constant monitoring of potential issues which has allowed working capital to be contained. In 2014, the phenomenon associated with customers in crisis filing for composition with creditors on a going concern basis has reduced. It should be noted that the significant exposure in relation to the customer Vinyls SpA, whom was admitted to Receivership procedures for large companies in crisis in June 2009 and was declared bankrupt in 2013. The receivables due from this counterparty were completely written off. Liquidity risk Liquidity risk represents the risk that, owing to an inability to raise new funds (funding liquidity risk) or to sell off assets on the market (asset liquidity risk), the company may not be able to fulfil its payment commitments, causing an impact on net income if the company is forced to incur additional costs to meet its commitments or, as an extreme consequence, a situation of insolvency representing a risk to its survival as a going concern. The aim of the Group’s risk management is to put in place, within the scope of the “Financial Plan”, a financial structure which, in keeping with the business targets and with the limits defined by the Board of Directors (in
85

Versalis / Consolidated Financial Statements 2014/ Notes to the Financial Statements
terms of maximum percentage levels of leverage and minimum percentage levels of ratios between medium/long-term debt and total debt and between fixed-rate debt and total medium/long-term debt), can ensure an adequate level of liquidity for the entire Group, minimizing the related opportunity cost, and can maintain a balance in terms of duration and composition of the debt. At this time, the Versalis Group believes that it can meet its liquidity needs with the support of the Eni Group, whose cash assets it has the right to use without contractually defined borrowing limits in virtue of the existing agreements with the parent company Eni SpA. At the reporting date, the Versalis Group had no unutilized credit facilities. The tables below show the amounts of payments contractually owed in relation to financial debts, including payments of interest and the time horizon of disbursements for trade and other payables. Future payments against debt (amount in millions of euros) 2015 2016 2017 2018 2019 Beyond TotalShort-term debt 1,788 1,788
Long-term debt including current portion 3 315 435 72 825Interest on financial debt 28 24 16 2 1 1 72
Future payments against trade and other payables
(amount in millions of euros) 2015 2016 2017 2018 2019 Beyond TotalTrade payables 853 853 Advances from customers, other payables 116 116
969 969
Year of maturity
Future payments against obligations
In addition to the financial and trade payables shown in the Balance Sheet, the Versalis Group has a set of contractual obligations that entail making payments in future years. The table below shows the non-discounted payments owed by the Versalis Group in future years against the main existing contractual obligations.
(amount in millions of euros) 2015 2016 2017 2018 2019 Beyond TotalCosts (charges) relating to environmental provisions 5 6 6 1 4 22Other commitments 167 151 159 16 15 24 532
172 157 165 17 15 28 554
Year of maturity
The Other Commitments of €532 million include essentially an undertaking to purchase supplies of petrochemical products for €387 million and commitments for the purchase of services and utilities for €139 million. Investment commitments Over the next few years, the Versalis Group plans to carry through a programme of capital expenditure of €307 million. The table below shows the time schedule for the investments relating to the more significant committed projects. A project is considered committed when it has obtained the necessary approval from Management and when the relative purchase contracts have been awarded or are being finalized.
86

Versalis / Consolidated Financial Statements 2014/ Notes to the Financial Statements
(amount in millions of euros) 2015 2016 2017 2018 2019 Beyond TotalOther commitments (*) 57 250 307
57 250 307
Year of maturity
(*) Commitments for investments will be partially refunded by Syndial in the amount of €2 million in 2015 against existing guarantees. For further information see the paragraph "Accounting policies - Grants".
Capital management Versalis management uses leverage ratios to assess the degree of solidity and efficiency of the asset structure in terms of relative proportion of sources of financing between own and third-party assets, as well as to carry out benchmark analysis with the industry standards. Leverage measures the degree of company indebtedness and is calculated as the ratio between net borrowings and shareholders’ equity. The Management’s aim in the medium term is to maintain a solid financial structure summarized by a leverage figure of not more than 1. Fair value of financial instruments In carrying out its business, the Versalis Group uses various kinds of financial instruments. The market value of the company’s financial instruments is substantially in line with their book value, for the following reasons: Receivables included in current assets: the market value of trade, financial and other receivables falling due within one year are estimated to be practically equivalent to the respective carrying amount because of the short interval between the recording of the receivable and its due date. Financial payables included in non-current liabilities: the market value of financial payables falling due after one year, including the short-term portion, is estimated to be substantially equal to the book value, because they were entered into at fixed market rates. Trade, financial and other payables included in current liabilities: the market value of trade, financial and other payables falling due within one year is estimated to be practically equivalent to the book value because of the short interval between the recording of the payable and its due date. Other non-current financial assets and liabilities: other non-current financial assets and liabilities are of an immaterial amount. The classification of financial assets and liabilities is indicated below; these are measured at fair value in the Balance Sheet according to the fair value hierarchy defined on the basis of the significance of the inputs used in the measurement process. In particular, on the basis of the features of the inputs used in making the measurements, the fair value hierarchy has the following levels:
- Level 1: prices quoted (and unadjusted) in active markets for identical financial assets or liabilities; - Level 2: measurements carried out on the basis of inputs, other than the quoted prices as above, which,
for the assets and liabilities to be measured, can be observed directly (e.g. prices) or indirectly (e.g. deriving from prices).
- Level 3: inputs not based on observable market data. In relation to the above, the Versalis Group’s financial instruments carried at fair value at December 31, 2014 regard “level 2” derivative contracts. During the year, there were no transfers between the different fair value hierarchy levels. Environmental regulations As regards environmental risk, at present Versalis currently does not foresee any particularly significant negative effects on the financial statements arising from compliance with environmental legislation, taking into account the steps already taken, the insurance policies signed and the provisions for risks set aside. However, we cannot exclude the risk that Versalis may incur further costs or liabilities in the future, as it is currently impossible to foresee the effects of future developments considering the following: (i) the possibility of as yet unknown contamination; (ii) the results of the ongoing surveys and the other possible effects of statements required by Italian Decree No. 471/1999 of the Ministry of Environment; (iii) new development in environmental regulation; (iv) the effect of possible technological changes relating to future remediation; and (v) the possibility of litigation and the difficulty of determining the eventual consequences, also considering the responsibility of other parties and eventual insurance indemnity. As explained in greater detail in the section “Accounting
87

Versalis / Consolidated Financial Statements 2014/ Notes to the Financial Statements
policies – grants”, the environmental costs of actions to be taken at the manufacturing facilities acquired by the Versalis Group through the business conferral by Syndial SpA are covered by a specific warranty issued by the latter. Emission trading Italian Legislative Decree no. 216 of April 4, 2006 implemented both the Emission Trading Directive 2003/87/EC relative to greenhouse gas emissions and Directive 2004/101/EC relative to the use of carbon credits deriving from projects for the reduction of emissions based on the Kyoto Protocol. On November 27, 2008, the National Committee for Management and Implementation of Directive 2003/87/EC published Resolution 20/2008 relative to the European Emission Trading Scheme – ETS (in operation since January 1, 2005), assigning the emissions allowances for the 2008-2012 period to the existing plants. It should be noted that, at the request of the European Commission, changes were made by the National Committee for Management and Implementation of Directive 2003/87/EC which expanded the scope of application of the Directive with respect to the provisions in force for the period 2005-2007, extending it to certain types of combustion plants including those present in the steam cracking plants (see also the section Commitments for sustainable development in the Directors' Report on Operations). On the basis of the estimates of the emissions made, at December 31, 2014, the Versalis Group presented an overall emission rights surplus (a so-called “long position”)13; therefore, in accordance with the accounting criteria adopted, management will recognize the related income from these surplus rights at the moment of sale. Litigation Versalis is a party to civil and administrative proceedings and legal disputes related to transactions carried out in the ordinary course of its business. On the basis of the information currently available Versalis considers that such proceedings and cases will not have a significant adverse impact on its financial statements. A summary of the more important proceedings is given below. Unless otherwise stated, no provisions were made for such risks given that it was considered improbable that the proceedings would have a negative outcome.
13 Provisional data: the definitive data will be available only after the final results have been certified by the Accredited Auditor. This will, however, not affect the company's position, which will certainly remain long.
88

Versalis / Consolidated Financial Statements 2014/ Notes to the Financial Statements
Antitrust litigation Butadiene Rubber litigation With regards to the claims for damages (based on the European Commission’s decision) brought by some tyre manufacturers using BR/E-SBR products, in August 2007 eni initiated proceedings at the Court of Milan with the aim of obtaining a verdict about the non-existence of alleged damages suffered by manufacturers of tyres using BR/SBR products. Subsequently some subsidiaries of the Dow Chemical Group served a writ on Eni and Versalis in order to be indemnified and held harmless as part of a proceeding initiated before the Commercial Court of London by several tyre producers who have been claiming compensation for the damages allegedly caused by the companies in the alleged BR cartel (including the Dow Chemical Group, but not eni/Versalis). In May 2014, the eni Group agreed a settlement with the tyre manufacturers and Dow Chemical. Based on this agreement the proceeding pending before the Court of Milan and that before the Court of London can be considered as finally closed. Chloroprene Rubber litigation With regards to elastomers (CR), the European Court of First Instance judgment of December 2012 reduced to approximately €106 million the original fine of €132.16 million imposed jointly on Polimeri Europa (now Versalis SpA) and eni by the European Commission on December 5, 2007, for the alleged execution, along with other chemical companies, of a restrictive competition agreement concerning the sale of the elastomer in question. In March 2013, eni SpA and Versalis SpA lodged an appeal against the judgement at the European Court of Justice, in order to overturn the decision of the Commission, which has in turn appealed against the judgement. As all the stages of the proceedings have been exhausted, the judgement of the Court of Justice is pending. In consideration of these disputes the opportune provisions for risks were accrued. Polieco litigation The “Polieco affair”, which has been going on for more than a decade, triggered by some shortcomings in Article 48 of the Italian Legislative Decree of February 5, 1997 (the so-called “Ronchi Decree") reached its definitive solution in 2014. Currently between Versalis and Polieco, the following civil actions are pending: (Court of Rome): Versalis (formerly Polimeri Europa), Dow Italia Commercial Division and Ineos Manufacturing vs Polieco: lawsuit for the negative ascertainment and request for compensation for damages in relation to the letters received from Polieco on November 19, 2007 aimed at disputing that the plaintiff companies produce only polyethylene raw material and, consequently, demanding registration with the Consortium and payment of membership fees. (Rome Court of Appeal): Polieco vs Versalis (formerly Polimeri Europa), Ineos Manufacturing, Dow Poliuretani Italia, and Resital SpA: appeal filed by Polieco against the judgement of the Court of Rome dated 6-11 March 2009. At the hearing held on March 15, 2011, the Judge scheduled the hearing to discuss the conclusions for May 6, 2015. Considering the long time that has passed since the cross examination was started, the changes to the regulatory framework that have occurred in the meantime and those in the market, the private companies involved, including Versalis SpA, have decided not to continue with the lawsuits. It was not possible to assess the outcome of these lawsuits because, among other things, of the way they were playing out. As a result of some informal meetings, an agreement was reached to settle the above disputes, with a reciprocal and definitive waiver of the respective actions and claims, and each side bearing their own litigation, legal and related costs. On October 7, 2014, the Board of Directors of Versalis SpA approved the proposed settlement which had already been approved by the Boards of the other parties in the proceedings and the Chief Executive Officer was authorized to sign the settlement agreement and all other necessary and useful deeds. The lawsuit was abandoned by the parties in accordance with Art. 309 of the Italian Civil Procedure Code at the first appropriate hearing after the signing of the settlement and the parties committed themselves to perform all the actions necessary to dismiss the claims (including communication via Certified Electronic Mail to the Official Technical Consultant that a settlement has been reached), and also committed themselves not to undertake any further defensive action after the signing of the settlement. The following proceeding is still pending: (Bar Tax Commission) Italian Revenues Agency vs Versalis: appeals proceeding with which the Revenues Agency has challenged the ruling given by the Brindisi Province Tax Commission on 19/09/2011, which had annulled the notice of assessment No. 887030300694/2007 (and the relative payment order), for the year 2002, served on Polimeri Europa on 13/11/07, and the related administrative fine in the amount of € 485,366.25
89

Versalis / Consolidated Financial Statements 2014/ Notes to the Financial Statements
for failure to pay, in the tax year 2002, the contribution to the Polieco Consortium, deeming that Versalis falls under the “category of producers and importer of polyethylene raw material”, and is thus excluded from the obligation of Polieco membership. The Memorandum of Appearance was filed on December 27, 2012. The discussion of the case has been scheduled for March 26, 2015. On this point, it should be noted that the judgement of the Lecce Regional Tax Commission of 2003 rejected the claim of the Brindisi Revenues Agency and, furthermore, the Bari and Milan Revenues Agencies have not included the Polieco “irregularities” in the Assessments issued for the following years. Tax litigation Following the inspections carried out by the Milan tax inspectors in 2006 and in 2010 relative to the costs deriving from transactions performed with residents in tax havens (mainly Switzerland) under the terms of Art. 110, paragraphs 10 and 11 of the Consolidated Income Tax Act (Decree of the President of the Republic 917/86), during the tax years from 2003 to 2009: - for the year 2003, the judgement of 1/04/2014 no. 912/24/14 (filed on 15/04/2014) became final. The judgement was issued by the Bari Regional Tax Commission, which upheld the company’s appeal, setting the non-deductible costs at €663 thousand. - with the support of the eni Tax department, whose opinion was confirmed by the Tax Office, Department of Assessment and Litigation, Rome, the management settled with the competent Offices the years 2004, 2005, 2006, 2007, 2008 and 2009, paying respectively: - for the year 2004 taxes, fines and interest of €6.8 million instead of the €152 million originally assessed; - for the year 2005 taxes, fines and interest of €3.4 million instead of the €123 million originally assessed; - for the year 2006 taxes, fines and interest of €8.6 million (of which €5 million referring to use of the 2003 tax loss subject of the above-indicated litigation not yet concluded) instead of the €115 million originally assessed; - for the year 2007 taxes, fines and interest of €2.3 million instead of the €197 million originally assessed; - for the year 2008 taxes, fines and interest of €1.5 million instead of the €85 million originally assessed; - for the year 2009 taxes, fines and interest of €88 thousand. On 17/02/2011 the Siracusa tax Office served a demand for payment of registry tax of €731 thousand relating to the sale of shares in the consortium Priolo Servizi; together with the other companies in the consortium, the company appealed to the Tax Commission and has not set accrued any provisions, having reasonable confidence in a positive outcome for the dispute. On 12/04/2011 the Milan Tax Office served a demand for payment of registry tax of €340 thousand relating to the sale transaction regarding the equity investment in eni Trading & Shipping to eni SpA as a result of the conferral of the “SHIPPING” business unit. The company appealed to the Tax Commission together with eni SpA and eni Trading & Shipping and has not accrued any provisions, as it reasonably confident of a positive outcome for the dispute. Judgement no. 735/43/14 of 13/05/2014 filed on 23/01/2014 - with which the Milan Provincial Tax Commission upheld the company’s appeal and cancelled the demand for payment - became final. On 22/09/2011 the Milan Tax Office served a demand for payment of registry, mortgage and cadastral tax of €1.7 million relating to the sale transaction relating to the sale of the equity investment in Raffineria di Gela SpA to Eni SpA as a result of the conferral of the “SPLITTER” business unit. The company appealed to the Tax Commission together with Eni and Raffineria di Gela SpA and has not accrued any provisions, as it is reasonably confident of a positive outcome for the dispute. The Tax Office has filed an appeal against judgement no. 2870 of 12/12/2013 filed on 21/03/2014 of the Milan Provincial Tax Commission which upheld the company’s appeal. The Milan Tax Office served a demand for payment of higher registry, mortgage and cadastral tax of approximately €1 million relating to the sale of the TAF business unit in Brindisi to Syndial SpA. The company, in conjunction with the jointly-responsible Syndial, having failed to settle the dispute using the proposed tax settlement procedure, intends to appeal; the estimated cost is approximately €500 thousand. The Lombardy Regional Large Taxpayers Office sent a VAT Assessment Notice with regard to irregular intra-Community VAT transactions in 2008 and the company intends to comply, taking advantage of the fine reduction, by paying the total amount of the tax, fines and interest of approximately €132 thousand. At the end of December 2013, the Lombardy Regional Large Taxpayers Office sent a VAT Assessment Notice with regard to irregular intra-Community VAT transactions in 2008 and the company intends to comply, taking advantage of the fine reduction, by paying the total amount of the tax, fines and interest of approximately €132 thousand.
90

Versalis / Consolidated Financial Statements 2014/ Notes to the Financial Statements
At the end of December 2013, the Municipality of Priolo Gargallo (SR) served an assessment notice for higher property tax (ICI) for the years 2007 to 2011 for a total of €2.7 million; the company used the tax settlement procedure and has settled the dispute for the total amount of €563 thousand for taxes, sanctions and interest. The Municipality of Melilli (SR) served an assessment notice for higher property tax (ICI) for the year 2011 for a total of €47 thousand; the company considers it prudent to set aside this amount for 2012 as well, deeming it probable that an assessment notice will be served for that year too. On 19/12/2014, the Milan Revenues Agency 3 served a demand on the company for payment of higher registry, mortgage and cadastral tax of approximately €323 thousand relating to the transfer of the “Catalysis and Sustainable Chemistry” business unit in Novara. The company, in conjunction with the jointly responsible eni, intends to proceed using the proposed tax settlement procedure; the estimated cost is approximately €200 thousand. On October 15, 2014 the Milan Finance Police started an inspection on Versalis SpA (formerly Polimeri Europa SpA) for the tax years 2010 to October 15, 2014 relating to transactions with foreign subsidiaries/associates, and to personnel (for the year 2014 until October 15, 2014) also with regard to employment and social security, in accordance with, among others, Law No. 689 of 24.11.1981. The inspection is ongoing. 27. Revenue The main “Revenue” items are analysed below. The most significant changes in Revenues are explained in the “Operating Review” in the Directors' Report. Net sales from operations Net sales from operations are detailed in the table below:
(amounts in millions of euros) 2013 2014Sales of petrochemical products 5,648 5,096Sales of other products 2 2Other services 209 186
5,859 5,284
Net sales by business line are indicated in the “Business review” in the Director’s Report. The table below shows the geographical distribution of net sales from operations:
(amounts in millions of euros) 2013 2014Italy 2,758 2,565Rest of Europe 2,704 2,433Asia 238 157America 126 105Africa 28 10Other areas 5 14
5,859 5,284
91

Versalis / Consolidated Financial Statements 2014/ Notes to the Financial Statements
Other income and revenues Other income and revenues are comprised of the following:
(amounts in millions of euros) 2013 2014Recovery of other costs and expenses 49 53License rights and royalties 58 21Income from the sale of Energy Efficiency Certificates. 16Income for emission rights 17 12Real estate revenues 6 6Insurance payouts 17 3Contract penalties 2 1Other 10
The recovery of other costs and expenses refer to the re-charging of operating expenses to Syndial SpA in virtue of the guarantees issued at the time of conferral in 2002 of the “Strategic Chemical Activities” business unit (€35 million, for further details see the paragraph “Accounting policies - Grants”) and to the recharging of sundry costs and expenses to other companies working at the production sites (€18 million). 28. Operating expenses The following is a summary of the main items of “Operating expenses”. Purchases, services and other costs Purchases, services and other costs include the following:
(amounts in millions of euros) 2013 2014Production costs - raw, ancillary and consumable materials and goods 4,523 4,018Service costs 1,463 1,285Leasing and rental charges 25 26Net provisions for risks and charges 37 2Change in inventories 107 63Impairment of receivables 17 6Other expenses 76 139less:
Capitalized direct costs associated with internally constructed assets (1)6,247 5,539
The service costs of €1,285 million refer mainly to costs for utilities (€530 million), logistics and transport (€265 million), maintenance (€189 million) and professional services and consulting (€32 million). Leasing and other charges of €26 million consist mainly of fees for concessions and licenses of €9 million, rent for land and buildings of €5 million, vehicle hire of €5 million and other rentals and leases of operating assets of €6 million. Information relating to provisions for risks and charges is provided in Note 21. Information relating to changes in inventories is provided in Note 3. Information relating to the impairment of receivables is provided in Note 2. The Other Expenses of €139 million include mainly the capital loss of €45 million related to the divestment of the Sarroch Aromatics business, the costs related to the Polyethylene plant at the Gela site (€18 million) and the Aromatics plant at the Sarroch site (€10million), expenses for tax and indirect tax for €20 million and contractual penalties for €6 million. Non-capitalisable research and development costs amounted to €40 million (€39 million in 2013).
92

Versalis / Consolidated Financial Statements 2014/ Notes to the Financial Statements
Payroll and related costs Payroll and related costs can be broken down as follows:
(amounts in millions of euros) 2013 2014Wages and salaries 266 271Social security contributions 77 78Costs related to defined benefit plans and defined contribution plans 17 19Redundancy incentives 23Other costs 1 1
384 369Less:Net revenue for seconded personnel (1) Capitalized direct cost associated with self-constructed assets (10) (12)
373 357
Costs related to employee benefits include expenses for defined-contribution plans of €15 million and expenses for defined-benefit plans of €4 million. The expenses for defined-contribution and defined-benefit plans are analysed in Note 22. The remuneration for persons responsible for the planning, direction and control functions of the company, including executive and non-executive directors, managers and senior managers with strategic responsibilities (so-called key management personnel) in office at December 31, 2014 amounted to €5 million as follows:
(amounts in millions of euros) 2013 2014Wages and salaries 4 4Costs related to defined benefit plans and defined contribution plans 1 1
5 5
The remuneration paid to directors amounted to €179 thousand. The remuneration paid to statutory auditors amounted to €110 thousand. The remuneration includes emoluments and all other kinds of remuneration, and pension and welfare contributions payable for the performance of the duties, which constituted a cost for the company, even if not subject to personal income tax. The average number of employees, classified by category, is as follows:
2013 2014Managers 109 109Managers/supervisors and employees 3,392 3,388Workers 2,202 2,085
5,703 5,582 The average number of employees was calculated as the arithmetic mean of the number of employees at the beginning and at the end of the year. The average number of senior managers includes managers employed and operating in foreign countries whose organizational role is equivalent to the “Italian manager” grade. 29. Other operating (expenses) income The other operating expenses include the following:
93

Versalis / Consolidated Financial Statements 2014/ Notes to the Financial Statements
(amounts in millions of euros) 2013 2014Income from commodity derivatives 2 11Expenses from commodity derivatives (3) (38)
(1) (27) Other operating expenses of €27 million (€1 million in 2013) relate to the recognition in income statement of net expenses incurred on commodity derivatives which do not fulfill the formal requisites necessary to be classified as “hedges” in accordance with IAS 39. 30. Depreciation, amortization and impairment Depreciation, amortization and impairment include the following:
(amounts in millions of euros) 2013 2014Depreciation and amortization: - Property, plant and equipment 80 85 - Intangible assets 4 4
84 89Impairment losses: - Property, plant and equipment 41 96
41 96125 185
Information regarding depreciation rates and the impairment of property, plant and equipment is provided in Note 7, to which the reader is referred, while that regarding intangible assets is provided in Note 8.
94

Versalis / Consolidated Financial Statements 2014/ Notes to the Financial Statements
31. Financial income (expense) Financial income (expense) includes the following:
(amounts in millions of euros) 2013 2014Financial income (expense)Financial income 58 35Financial expense (102) (76)
Derivatives (9) 11(53) (30)
The net amount of financial income (expense) can be broken down as follows:
(amounts in millions of euros) 2013 2014Financial income (expenses) related to net borrowings- Interest and other expenses to banks and other financial institutions (48) (39)
Positive (negative) exchange differences- Positive exchange differences 56 23- Negative exchange differences (52) (31)
Derivatives (9) 11
Other financial income and expense- Capitalized financial expense 4 6- Other financial income (expense) (4)
(53) (30)
Net income (expense) on derivatives regard derivative contracts that do not meet the formal conditions to be classified as “hedges” as specified by IAS 39 and, therefore, the related fair value changes are stated in the income statement. Net income on derivative instruments of €11 million regards contracts on currencies. Income (expense) on derivative contracts is determined as a result, essentially, of recognition in the income statement of the effects of measurement at fair value of those derivative contracts that cannot be considered for hedging according to the IFRSs, because they relate to the net exposure to exchange rate and interest-rate risks and, therefore, are not relative to specific commercial or financial transactions. The same lack of the formal requisites for being considered as derivative hedging contracts entails the recognition of the net payable exchange differences, given that the effects of the adjustment of assets and liabilities in foreign currencies to the year-end exchange rate are not offset in the accounts by the change in fair value of the derivative contracts. 32. Income (expense) from investments (amount in millions of euros) 2013 2014Losses from valuations using equity-accounting method (5)Dividends 2
(3)
Losses from valuations using the equity-accounting method concern Newco Tech SpA. The dividends are related to Versalis Kimya Ticaret Limited Sirketi.
95
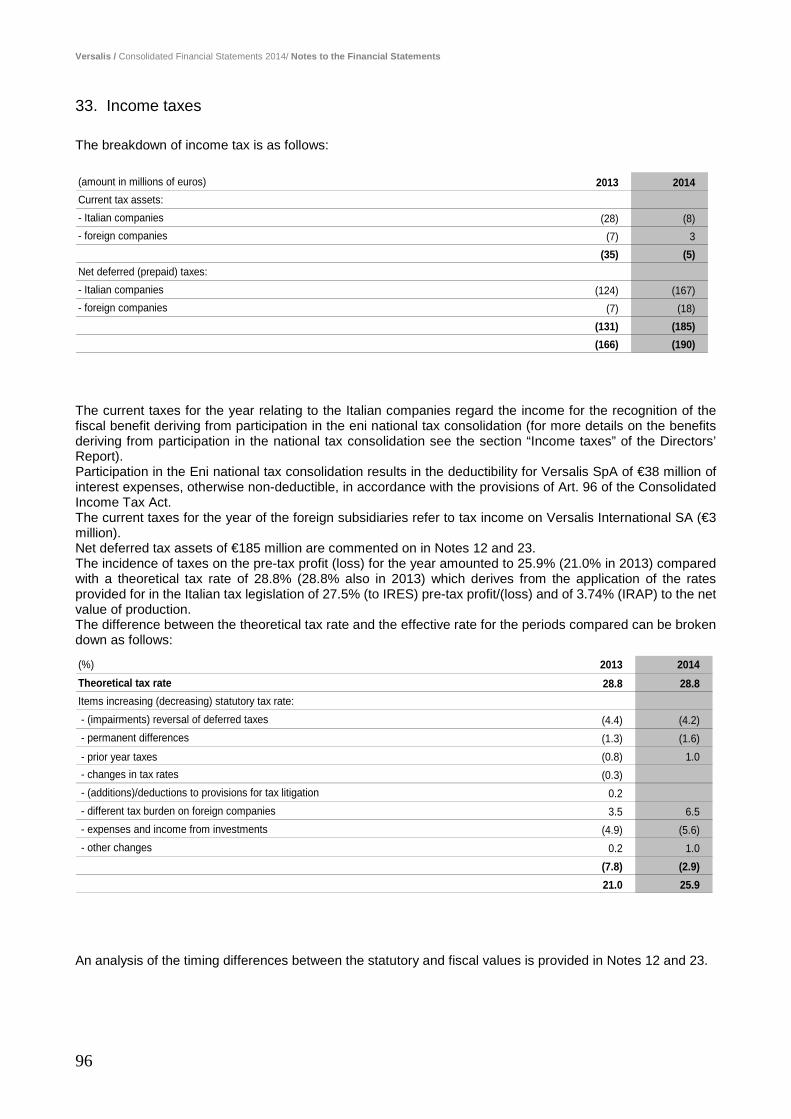
Versalis / Consolidated Financial Statements 2014/ Notes to the Financial Statements
33. Income taxes The breakdown of income tax is as follows:
(amount in millions of euros) 2013 2014Current tax assets:- Italian companies (28) (8)- foreign companies (7) 3
(35) (5)Net deferred (prepaid) taxes:- Italian companies (124) (167)- foreign companies (7) (18)
(131) (185) (166) (190)
The current taxes for the year relating to the Italian companies regard the income for the recognition of the fiscal benefit deriving from participation in the eni national tax consolidation (for more details on the benefits deriving from participation in the national tax consolidation see the section “Income taxes” of the Directors’ Report). Participation in the Eni national tax consolidation results in the deductibility for Versalis SpA of €38 million of interest expenses, otherwise non-deductible, in accordance with the provisions of Art. 96 of the Consolidated Income Tax Act. The current taxes for the year of the foreign subsidiaries refer to tax income on Versalis International SA (€3 million). Net deferred tax assets of €185 million are commented on in Notes 12 and 23. The incidence of taxes on the pre-tax profit (loss) for the year amounted to 25.9% (21.0% in 2013) compared with a theoretical tax rate of 28.8% (28.8% also in 2013) which derives from the application of the rates provided for in the Italian tax legislation of 27.5% (to IRES) pre-tax profit/(loss) and of 3.74% (IRAP) to the net value of production. The difference between the theoretical tax rate and the effective rate for the periods compared can be broken down as follows:
(%) 2013 2014Theoretical tax rate 28.8 28.8Items increasing (decreasing) statutory tax rate: - (impairments) reversal of deferred taxes (4.4) (4.2) - permanent differences (1.3) (1.6) - prior year taxes (0.8) 1.0 - changes in tax rates (0.3) - (additions)/deductions to provisions for tax litigation 0.2 - different tax burden on foreign companies 3.5 6.5 - expenses and income from investments (4.9) (5.6) - other changes 0.2 1.0
(7.8) (2.9)21.0 25.9
An analysis of the timing differences between the statutory and fiscal values is provided in Notes 12 and 23.
96

Versalis / Consolidated Financial Statements 2014/ Notes to the Financial Statements
34. Related party transactions The transactions with related parties carried out by Versalis SpA mainly regard the trading of goods, the performance of services, the provision/receipt of funding and the use of financial resources with the parent company Eni SpA and with companies directly or indirectly controlled by the latter, and with its own non-consolidated subsidiaries and associates , and with other companies owned or controlled by the Italian State. All of the transactions carried out form part of ordinary operations and took place at arm’s length, that is, at conditions that would have been applied by independent parties on the open market, and were carried out in the best interest of the Versalis Group. The main transactions carried out were with the following companies: a) Eni SpA: purchase of petroleum feedstock and virgin naphtha for the cracker plants; purchase of natural
gas; sale of basic chemicals and transactions of an administrative and financial nature, procurement and information technology services, legal services, research services and services for personnel, treasury services and administrative activities;
b) Ecofuel SpA (controlled by Eni SpA): sale of olefin cycle products, transactions deriving from rental of the “MTBE/ETB and BTH” business unit at Ravenna;
c) Eni Finance International SA (controlled by Eni International Holding BV): financial transactions; d) Eni Insurance Limited (controlled by Eni SpA) insurance cover for risks; e) EniPower SpA (controlled by Eni SpA), EniPower Mantova SpA and Società EniPower Ferrara Srl
(controlled by EniPower SpA): purchase of electricity and steam; provision of auxiliary and general services; f) EniServizi SpA (controlled by Eni SpA): receiving general services; g) Eni Trading & Shipping SpA (controlled by Eni SpA): transport by sea, purchase and sale of raw materials
of basic chemical products, and derivative contracts on commodities; h) Matrìca SpA: financing of assets instrumental to operating activities; i) Raffineria di Gela SpA (controlled by Eni SpA): transactions deriving from rental of the “Polyethylene”
business unit at Gela; j) Saipem SpA (controlled by Eni SpA): receiving goods and services related to the construction and upgrading
of plants; k) Syndial SpA (controlled by Eni SpA): product marketing, purchase and sale of products and exchange of
services and utilities; l) Priolo Servizi Scarl (associate of Versalis SpA): supply of general and auxiliary services at sites where
Versalis SpA is also present; m) Ravenna Servizi Industriali SCpA (associate of Versalis SpA): supply of general and auxiliary services at
sites where Versalis SpA is also present; n) Servizi Porto Marghera Scarl (associate of Versalis SpA): supply of general and auxiliary services at sites
where Versalis SpA is also present; o) Gruppo Ferrovie dello Stato: rail transport. Trade and other transactions with unconsolidated subsidiaries, associates and jointly controlled companies and with other companies owned or controlled by Eni SpA or by the State can be broken down as follows:
97

Versalis / Consolidated Financial Statements 2014/ Notes to the Financial Statements
(amounts in millions of euros)
Name Tra
de a
nd o
ther
rece
ivable
s
Tra
de a
nd o
ther
paya
ble
s
Posi
tive
deriva
tives
Negativ
e
deriva
tives
Guara
nte
es
Goods
Serv
ices
Oth
er
Oth
er
opera
ting
exp
ense
s
Goods
Serv
ices
Oth
er
Oth
er
opera
ting
inco
me
AssociatesBrindisi Servizi Generali Scarl 5Priolo Servizi Scarl 10 15Ravenna Servizi Industriali ScpA 1 10 4Servizi Porto Marghera Scarl 2 5 18 4
3 15 48 4 4Joint venturesMatrìca SpA 3 1 4 1Lotte Versalis Elastomers Co Ltd 1 13
4 1 4 14Parent companyEni SpA 45 140 2 5 78 457 212 3 38 7 3 21 11
45 140 2 5 78 457 212 3 38 7 3 21 11Eni Group companiesEcofuel SpA 11 2 14 1 108 10 1Eni Corporate University SpA 2 2Eni Insurance Ltd 11 2EniPower SpA 15 35 176 85 1EniPower Mantova SpA 1 15 91 4EniServizi SpA 1 6Eni Trading and Shipping SpA (1) 211 1,229 98 1 31 12Ing. Luigi Conti Vecchi SpA 1Raffineria di Gela SpA 4 48 19 1Saipem SpA 13 33 37Serfactoring SpA 3 1Società EniPower Ferrara Srl 2 13Syndial SpA 79 32 5 5 12 6 6 36
109 364 6 1,282 446 27 139 105 53
Entities owned or controlled by the StateGruppo Ferrovie dello Stato 12 1Gruppo Terna 4
12 4 1161 520 2 5 84 1,739 718 30 38 150 116 93 11
Costs Revenue31.12.2014 2014
Financial transactions with the parent company, non-consolidated subsidiaries, associates and jointly controlled companies and with other companies owned or controlled by Eni SpA or by the State include the following:
98

Versalis / Consolidated Financial Statements 2014/ Notes to the Financial Statements
31.12.2014 2014
Name Receivables Payables Guarantees Charges Gains DerivativesParent companyEni SpA 2,194 44 6 11Eni Group companiesEni Finance International SA 410 3Serfactoring SpA 1Joint venturesMatrica SpA 200 5
201 2,604 47 11 11
Impact of transactions and balances with related parties on the Group’s balance sheet, profit and loss account and cash flow statement. The impact on the Group's balance sheet, income statement and cash flow statement of transactions or balances with related parties are disclosed in the tables below: (amounts in millions of euros)
31.12.2013 31.12.2014Related Related
Total parties Proportion % Total parties Proportion %Trade and other receivables 1,104 280 25 986 288 29Other current assets 3 1 33 5 3 60Other financial assets 72 71 99Other non-current assets 4 3 75 4 3 75Short-term debt 1,040 1,038 100 1,788 1,781 100Trade and other payables 1,121 534 48 969 520 54Other current liabilities 3 1 33 8 6 75Long-term debt (including short-term portions) 705 703 100 825 823 100Other non-current liabilities 6 9 The impact on the income statement of transactions with related parties is illustrated in the table below: (amount in millions of euros)
2013 2014Related Related
Total parties Proportion % Total parties Proportion %Net sales from operations 5,859 299 5 5,284 266 5Other income and revenues 149 71 48 122 93 76Purchases, services and other costs 6,247 3,169 51 5,539 2,483 45Payroll and related costs 373 2 1 357Other operating income and expense (1) (1) 100 (27) (27) 100Financial income 58 2 3 35 11 31Financial expenses (102) (48) 47 75 47 63Derivatives (9) (9) 100 11 11 100Income and charges on investments (3) 1 (33)
99
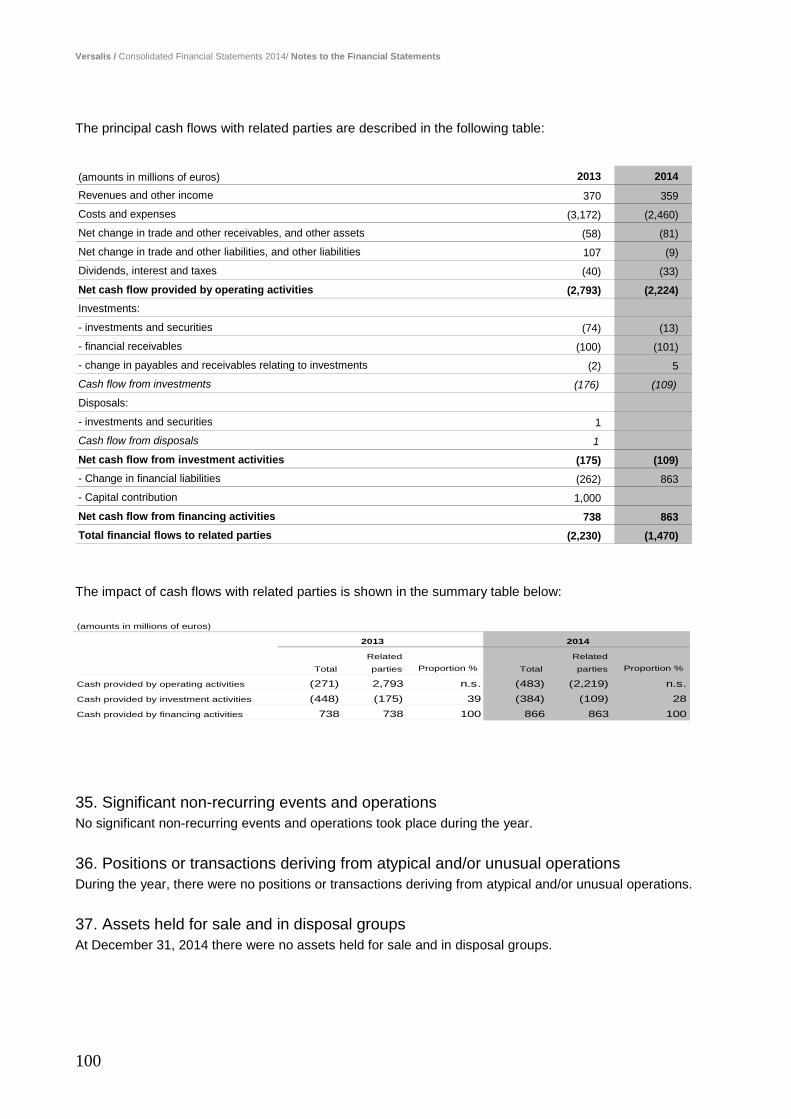
Versalis / Consolidated Financial Statements 2014/ Notes to the Financial Statements
The principal cash flows with related parties are described in the following table:
(amounts in millions of euros) 2013 2014Revenues and other income 370 359Costs and expenses (3,172) (2,460)Net change in trade and other receivables, and other assets (58) (81)Net change in trade and other liabilities, and other liabilities 107 (9)Dividends, interest and taxes (40) (33)Net cash flow provided by operating activities (2,793) (2,224)Investments:
- investments and securities (74) (13)- financial receivables (100) (101)- change in payables and receivables relating to investments (2) 5Cash flow from investments (176) (109)Disposals:
- investments and securities 1Cash flow from disposals 1
Net cash flow from investment activities (175) (109)- Change in financial liabilities (262) 863- Capital contribution 1,000Net cash flow from financing activities 738 863Total financial flows to related parties (2,230) (1,470)
The impact of cash flows with related parties is shown in the summary table below:
35. Significant non-recurring events and operations No significant non-recurring events and operations took place during the year. 36. Positions or transactions deriving from atypical and/or unusual operations During the year, there were no positions or transactions deriving from atypical and/or unusual operations. 37. Assets held for sale and in disposal groups At December 31, 2014 there were no assets held for sale and in disposal groups.
(amounts in millions of euros)
2013 2014
Related Related
Total parties Proportion % Total parties Proportion %
Cash provided by operating activities (271) 2,793 n.s. (483) (2,219) n.s.Cash provided by investment activities (448) (175) 39 (384) (109) 28Cash provided by financing activities 738 738 100 866 863 100
100

Versalis / Consolidated Financial Statements 2014/ Notes to the Financial Statements
38. Main events subsequent to December 31, 2014 For a description of the main events subsequent to December 31, 2014, see the “Significant events after the reporting date” in the “Other information” section of the Directors' Report. 39. List of investments Versalis SpA Group companies and equity investments at December 31, 2014 In accordance with the provisions of Arts 38 and 39 of Italian Legislative Decree No. 127/1991, Art 126 of Consob Resolution No. 11971 of May 14, 1999 and subsequent amendments and Consob Communication No. DEM/6064293 of July 28, 2006, the lists of the subsidiary and associated companies of Versalis SpA at December 31, 2014, and of other significant equity investments are provided below. The companies are listed in alphabetical order and divided into Italian and foreign companies. For each company the following details are shown: company name, location of registered office, share capital or consortium fund, shareholders and their interests, for consolidated companies the percentage held by Versalis SpA is shown; the accounting criterion (equity or cost accounting method) for investments in non-consolidated companies.
Subsidiary and associated companies of Versalis SpA at December 31, 2014
CONSOLIDATING COMPANY
% Method ofConsolidated consolidation
Shares % pertaining to or criterion of Name Registered office Currenc Capital Shareholde Ownership the Group measurement (*)
Versalis SpA San Donato Milanese (MI) EUR 1,553,400,000 Eni SpA 100.00 100.00 L.b.L.
(*) L.b.L. = line by line, N.E. = measurement at net equity, Co. = measurement at cost
SUBSIDIARIES
In Italy
% Method ofConsolidated consolidation
Share % pertaining to or criterion of Name Registered office Currenc Capital Shareholders Ownership the Group measurement (*)
Consorzio San Donato Milanese (MI) EUR 124,000 Versalis SpA 53.55 53.55 N.E.Industriale Raffineria di Gela SpA 18.74Gas Naturale Eni SpA 15.37
Syndial SpA 0.76Raffineria di Milazzo SpA 11.58
(*) L.b.L. = line by line, N.E. = measurement at net equity, Co. = measurement at cost
101

Versalis / Consolidated Financial Statements 2014/ Notes to the Financial Statements
SUBSIDIARIES
Outside Italy
% Method of Consolidated consolidation Share % pertaining to or criterion of Name Registered office Currenc Capital Shareholders Ownership the Group measurement (*)
Dunastyr Polystyrene Budapest HUF 8,092,160,000 Versalis SpA 96.34 100.00 L.b.L. Manufacturing Company Ltd (Hungary) Versalis International 1.83 Versalis Deutschland GmbH 1.83
Eni Chemicals Trading (Shanghai) Co Ltd Shanghai USD 5,000,000 Versalis SpA 100.00 100.00 L.b.L.
Polimeri Europa Elastomères Champagnier EUR 13,011,904 Versalis SpA 100.00 100.00 N.E.France SA in liquidation (France)
Versalis France SAS Mardyck EUR 126,115,582.90 Versalis SpA 100.00 100.00 L.b.L.(France)
Versalis Deutschland GmbH Eschborn EUR 100,000 Versalis SpA 100.00 100.00 L.b.L.(Germany)
Versalis Kimya Ticaret Limited Sirketi Istanbul TRY 20,000 Versalis International SA 100.00 100.00 N.E.
(Turkey)
Versalis UK Ltd Hythe GBP 4,004,041 Versalis SpA 100.00 100.00 L.b.L.(Great Britain)
Versalis International SA Brussels EUR 15,449,174 Versalis SpA 59.00 100.00 L.b.L.Versalis Deutschland GmbH 23.71Dunastyr Polystyrene Ltd 14.43Versalis France SAS 2.86
Versalis Pacific Trading (Shanghai) Co Ltd Shanghai CNY 1,000,000 Eni Chemicals Trading 100.00 100.00 L.b.L.
Versalis Pacific Mumbai INR 100,000.00 Versalis Pacific Trading 99.99 99.99 N.E.(India) Private Limited (India) Third parties 0.01
(*) L.b.L. = line by line, N.E. = measurement at net equity, Co. = measurement at cost
102

Versalis / Consolidated Financial Statements 2014/ Notes to the Financial Statements
ASSOCIATED COMPANIES
In Italy
% Method of Consolidated consolidation Share % pertaining to or criterion of Name Registered office Currency Capital Shareholders Ownership the Group measurement (*)
Brindisi Servizi Generali Scarl Brindisi (BR) EUR 1,549,060 Versalis SpA 49.00 49.00 N.E.
Syndial SpA 20.20EniPower SpA 8.90Third parties 21.90
Novamont SpA Novara (NO) EUR 13,333,500 Versalis SpA 25.00 25.00 N.E.Third parties 75.00
Priolo Servizi Scpa Melilli (SR) EUR 25,600,000 Versalis SpA 33.16 33.16 N.E.Syndial SpA 4.38Third parties 62.46
Ravenna Servizi Industriali ScpA Ravenna (RA) EUR 5,597,400 Versalis SpA 42.13 42.13 N.E.
EniPower SpA 30.37Ecofuel SpA 1.86Third parties 25.64
Servizi Porto Marghera Scarl Venice, EUR 8,751,500 Versalis SpA 48.13 48.13 N.E.
Porto Marghera (VE) Syndial SpA 38.14Third parties 13.73
JOINT VENTURES
% Method of
Consolidated consolidation Share % pertaining to or criterion of Name Registered office Currency Capital Shareholders Ownership the Group measurement (*)
Lotte Versalis Yeosu (Jeollanam) KRW 87,200,010,000 Versalis SpA 49.99 49.99 N.E.Elastomers Co Ltd (South Korea) Third parties 50.01
Matrìca SpA Porto Torres (SS) EUR 37,500,000 Versalis SpA 50.00 50.00 N.E.Third parties 50.00
Newco Tech SpA Novara (NO) EUR 300,000 Versalis SpA 83.03 83.03 N.E.Genomatica Inc 16.97
103

Versalis / Consolidated Financial Statements 2014/ Notes to the Financial Statements
JOINT VENTURES
OTHER COMPANIES
In Italy
% Method of Consolidated consolidation Share % pertaining to or criterion of Name Registered office Currency Capital Shareholders Ownership the Group measurement (*)
IFM Ferrara ScpA Ferrara EUR 5,270,466 Versalis SpA 19.74 19.74 Co(FE) Syndial SpA 11.58
Società EniPower Ferrara Srl 10.70Third parties 57.98
Consorzio Crea Cagliari EUR 70,000 Versalis SpA 7.14 7.14 Co Assemini (CA) Third parties 92.86
IAS Industria Acqua Siracusa EUR 102,000 Versalis SpA 1.00 1.00 CoSiracusana SpA (SR) Third parties 99.00
Outside Italy
% Method of Consolidated consolidation Share % pertaining to or criterion of Name Registered office Currency Capital Shareholders Ownership the Group measurement (*)
Genomatica Inc San Diego (USA) USD 130,707,444.76 Versalis SpA 5.12 5.12 CoThird parties 94.88
BKV Beteiligungs-und Frankfurt EUR 15,106,118.63 Versalis GmbH 1.11 1.11 CoKunststoffverwert- (Germany) Third parties 98.89ungsgesellschaft mbH
EXELTIUM 2 SAS Paris EUR 9,473.00 Versalis France SAS 1.88 1.88 Co(France) Third parties 98.12
EXELTIUM SAS Paris EUR 174,420,200.00 Versalis France SAS 1.66 1.66 Co(France) Third parties 98.34
(*) L.b.L. = line by line, N.E. = measurement at net equity, Co. = measurement at cost
Changes in the consolidation scope There are no changes compared to 2013.
104
Versalis / Financial Statements 2014/ Independent Auditors’ Report
Independent Auditors’ Report
105