Suicide In Kansas - KDHE in Kansas: 2011 Report In 2007, suicide was the 10th leading cause of death...
23
KANSAS DEPARTMENT OF HEALTH AND ENVIRONMENT Suicide In Kansas Injury Prevention and Disability Program March 2012
-
Upload
truongdien -
Category
Documents
-
view
215 -
download
2
Transcript of Suicide In Kansas - KDHE in Kansas: 2011 Report In 2007, suicide was the 10th leading cause of death...

KANSAS DEPARTMENT OF HEALTH AND ENVIRONMENT
Suicide In Kansas Injury Prevention and Disability Program
March 2012

2
Suicide in Kansas Robert Moser, MD Secretary, KDHE Paula Clayton, M.S., R.D., L.D. Director, Bureau of Health Promotion, KDHE Lori Haskett Director of Injury Prevention and Disability Program Bureau of Health Promotion, KDHE Report Preparation Ghazala Perveen, M.B.B.S, Ph.D., M.P.H Director of Science and Surveillance/Health Officer II Bureau of Health Promotion, KDHE Dan Dao, M.P.H Epidemiologist Kansas Injury Prevention and Disability Program Bureau of Health Promotion, KDHE Contact Information For additional information please contact Bureau of Health Promotion Kansas Department of Health and Environment 1000 SW Jackson STE 230 Topeka, KS 66612 Phone: (785) 291-3742
3
Suicide in Kansas: 2011 Report In 2007, suicide was the 10th leading cause of death among Kansans of all ages. Nationally the Kansas age-adjusted suicide death rate was ranked 17th highest in the country among all adults and 13th highest suicide death rate among those 0-25 years old1
.
Many believe that suicides are due to singular events or circumstances in a person’s life but suicide is a complex issue2. Many approaches are needed to address the suicide. The Objectives of Healthy People 2020 are to reduce the suicide rate in adults and adolescents3
. Other objectives related to reducing suicide in Healthy People 2020 are related to increasing mental health treatment for those with mental health disorders and increasing depression screening.
This report will describe trends and characteristics of suicide burden in Kansas and provide some resources for help. The summary table below shows the data that are provided in this report and some quick facts. Multiple data sources are used as the suicide attempts described by hospital discharges (stays in the hospital of more than 24 hours) and emergency department visits (stays is the hospital lasting less than 24 hours) are reported in the Kansas Hospital Discharge Database and Emergency Department Database. In addition, deaths are analyzed from the state mortality database. Multiple years are used to produce adequate numbers to conduct analysis for calculating scientifically reliable rates.
Emergency Department
Visit (2007-2009)
Hospital Discharge
(2005-2009) Deaths
(2006-2010) Suicide Related Events 3,251 7,692 1,891 % of all Injury Events 1% 9% 21% Leading Cause of Suicide: Poisoning Poisoning Firearm
Suicide Related Events (% of all Suicide Related Events due to Leading Cause)
1,895 (58%)
7,158 (93%)
1,076 (57%)
Poisoning Suicides (Special focus)
Prescription drug abuse is the fastest growing drug problem in the United States and in Kansas4. Prescription medication makes up a majority of the suicide poisonings in Kansas. For poisoning related suicide hospital discharges the leading primary cause was poisoning using tranquilizers and psychotropic drugs (42%, n: 2,991, ICD-9 Code: E950.3)5
. The second leading cause of suicide in hospital discharges was poisoning via analgesics, antipyretics, and antirheumatics (27%, n: 1,893, ICD-9 Code: E950.0).
4
Emergency Department
Source: 2007-2009 Kansas Emergency Department Database, Kansas Hospital Association.
• From 2007 to 2009
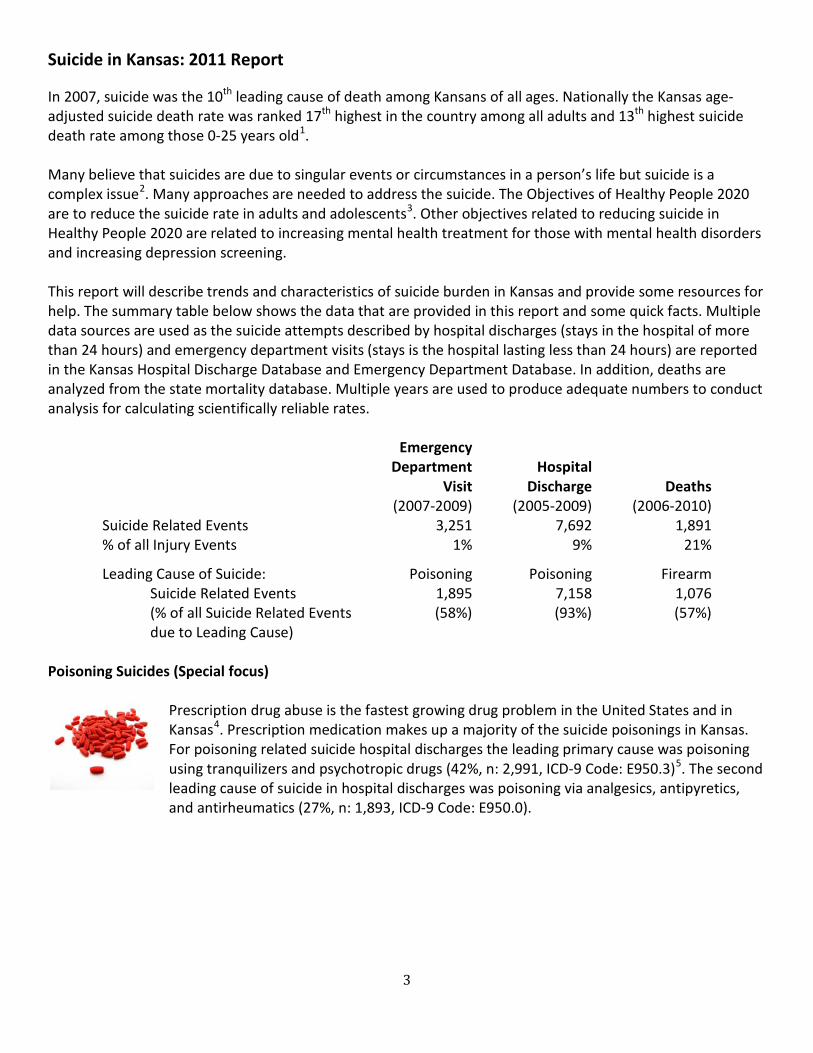
o The age-specific suicide emergency department visit (EDV) rate was higher among those between the ages of 15 and 19 years old as compared to those 55-64 years old. 15-19 years old: 122.2 suicide EDV per 100,000 population, 95% CI: 113.5-131.4 55-64 years old: 9.5 suicide EDV per 100,000 population, 95% CI: 7.6-11.7
Source: 2007-2009 Kansas Emergency Department Database, Kansas Hospital Association.
• From 2007 to 2009
o The age-specific suicide EDV rate for females was consistently higher than males across most of the age groups.
o The highest suicide EDV rate for females was seen among persons aged 15-19 years. 151.1 suicide EDVs per 100,000 population, 95% CI: 136.5-164.7
o The suicide EDV rate peaks in males among those ages 15-19 and 20-24 years. 15-19 years old: 95.7 suicide EDV per 100,000 population, 95% CI: 84.8-106.5 20-24 years old: 82.1 suicide EDV per 100,000 population, 95% CI: 72.4-91.7
27.6
122.2
96.4
69.7
47.4
27.6
9.5
0
30
60
90
120
10-14 15-19 20-24 25-34 35-44 45-54 55-64
Suicide EDV Rate per 100,000 population
Age Group
Age-Specific Suicide Emergency Department Visit (EDV) Rate Kansas 2007-2009
16
96 82
66
38 23
7
40
151
112
73 57
32 12
0
100
200
10-14 15-19 20-24 25-34 35-44 45-54 55-64
Suicide EDV Rate per 100,000 population
Age Group
Age-Specific Emergency Department Visit (EDV) Rate by Gender Kansas 2007-2009
Males
Female
5
NHOPI: Non-Hawaiian and other Pacific Islander Source: 2007-2009 Kansas Emergency Department Database, Kansas Hospital Association. Rates were age-adjusted to the U.S. 2000 Standard population using the direct method. See Technical Appendix for details on how rates were calculated.
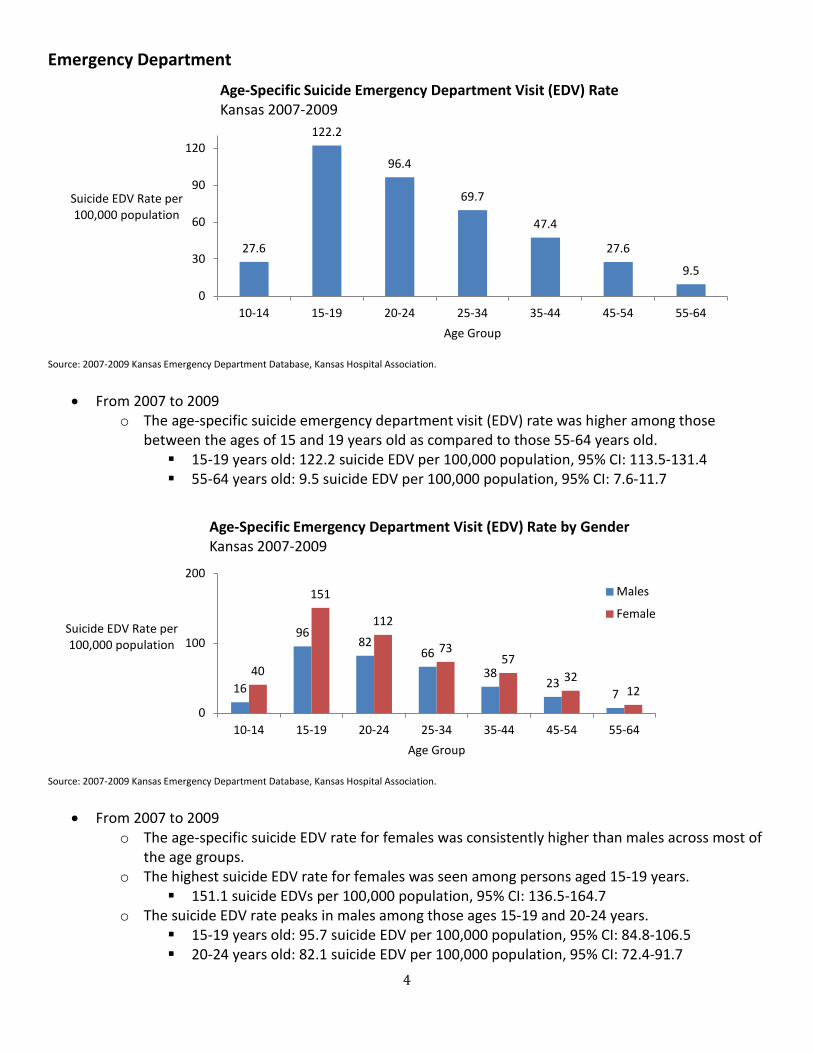
• From 2007 to 2009 o Asian /NHOPI (Non-Hawaiian and other Pacific Islander) had the highest age-adjusted suicide
EDV rate among Kansans and was statistically higher than Whites and African Americans: Asian / NHOPI: 61.5 suicide EDV per 100,000 population, 95% CI: 51.2-74.4 Whites: 36.1 suicide EDV per 100,000 population, 95% CI: 34.8-37.6 African Americans: 35.5 suicide EDV per 100,000 population, 95% CI: 30.9-40.8
Cause of Suicide Emergency Department Visit by Gender Kansas 2007-2009
Source: 2007-2009 Kansas Emergency Department Database, Kansas Hospital Association.
36.1 35.5
61.5
0
20
40
60
80
White African American Asian/NHOPI
Race
Suic
ide
EDV
Rate
per
100
,000
pop
ulat
ion
Age-Adjusted Suicide Emergency Department Visit (EDV) Rate by Race Kansas 2007-2009
Poisoning 65%
Cut/ Pierce 28%
All Others 7%
Females
Poisoning 49%
Cut/ Pierce 28%
All Others 23%
Males

6
• From 2007 to 2009 o Poisoning is the leading cause of suicide EDV among both gender groups. o 65% of all suicide EDV among women were due to poisoning. o 49% of all suicide EDV among men were due to poisoning.
Source: 2007-2009 Kansas Emergency Department Database, Kansas Hospital Association. *Note: Due to small numbers, rates are not calculated for all age groups
• From 2007 to 2009 o The poisoning suicide rate is significantly higher among the 15-19 year age group compared to
all other age groups. o The cut/pierce suicide EDV rate was significantly lower among age groups 10-14 years as
compared to age groups for 15-44 years. o “All others” suicide EDV rate was significantly lower among age groups 10-14 years as
compared to age groups for 15-34 years. o 95% Confidence Intervals for age-specific suicide EDV rates can be found in Table ED1.
Poisoning
Cut/Pierce All Others 0
25
50
75
10-14 15-19 20-24 25-34 35-44 45-54 55-64 Suic
ide
EDV
Rate
per
100
,000
pop
ulat
ion
Age Group
Age and Cause Specific Suicide Emergency Department Visit (EDV) Rate* Kansas 2007-2009

7
Table ED1. Age and Cause Specific Suicide Emergency Department Visit (EDV) Rates, Kansas 2007-2009
Poisoning Cut / Pierce All Other
Age Group # EDV EDV
Rate* 95% CI** # EDV EDV
Rate* 95% CI** # EDV EDV
Rate* 95% CI**
05-09
5 10-14 86 15.2 12.2- 18.8 37 6.6 4.6- 9.0 33 5.8 4.0- 8.2
15-19 426 70.7 64.2- 77.8 185 30.7 26.5- 35.5 125 20.8 17.3- 24.7
20-24 315 49.0 43.7- 54.7 207 32.2 27.9- 36.9 98 15.2 12.4- 18.6
25-34 418 38.1 34.5- 41.9 248 22.6 19.9- 25.6 99 9.0 7.3- 11.0
35-44 337 31.3 28.1- 34.8 124 11.5 9.6- 13.7 49 4.6 3.4- 6.0
45-54 227 18.6 16.3- 21.2 81 6.7 5.3- 8.3 28 2.3 1.5- 3.3
55-64 62 6.8 5.2- 8.7 14
11 65-74 11
75+ 9
*Suicide EDV Rate is per 100,000 population. **95% CI are calculated around rate. Source: 2007-2009 Kansas Emergency Department Database, Kansas Hospital Association. Rates were age-adjusted to the U.S. 2000 Standard population using the direct method. See Technical Appendix for details on how rates were calculated.
Table ED2. Gender Specific Age-Adjusted Suicide Emergency Department Visit (EDV) Rate by Year Kansas 2007-2009
Year Gender #EDV Suicide EDV
Rate* 95% CI**
2007 Female 744 55.8 51.8- 60.0
Male 582 41.4 38.0- 44.9
Overall 1,326 48.3 45.7- 51.0
2008 Female 552 41.1 37.7- 44.8
Male 401 28.6 25.8- 31.6
Overall 953 34.7 32.5- 37.0
2009 Female 561 41.9 38.5- 45.6
Male 411 29.1 26.3- 32.1
Overall 972 35.3 33.1- 37.7 *Suicide EDV Rate is per 100,000 population. **95% CI are calculated around rate. Source: 2007-2009 Kansas Emergency Department Database, Kansas Hospital Association. Rates were age-adjusted to the U.S. 2000 Standard population using the direct method. See Technical Appendix for details on how rates were calculated.
• It is hard to make any year to year determinations of increasing or decreasing suicide EDV trends due to the numbers of years for which database are available
• Females have had significantly higher rates of suicide EDV compared to males for all years we have measured (Table ED2).

8
Table ED3. Emergency Department Section Review Table Suicide Emergency Department Visit (EDV) Rate by Selected Demographic groups, Causes of Suicide, and Risk Factors, Kansas 2007-2009 Demographic Groups #EDV
EDV Rate* 95% CI**
Overall 3,251 39.4 38.1- 40.8
Gender Female 1,857 46.3 44.2- 48.4
Male 1,394 33.0 31.2- 34.8
Age Groups (Age Specific)
05-09 8 .
10-14 156 27.6 23.5- 32.3
15-19 736 122.2 113.5-131.4
20-24 620 96.4 89.0-104.3
25-34 765 69.7 64.8- 74.8
35-44 510 47.4 43.4- 51.7
45-54 336 27.6 24.7- 30.7
55-64 87 9.5 7.6- 11.7
65-74 14 .
75+ 16 .
Race White 2,634 36.1 34.8- 37.6
African American 221 35.5 30.9- 40.8
Asian 134 61.5 51.2- 74.4
Native American 19 .
Cause Poisoning 1,894 23.1 22.1- 24.2
Cut/Pierce 903 10.9 10.2- 11.6
All Other 454 5.4 5.0- 6.0
Risk Factors Alcohol 428 5.3 4.8- 5.8
*Suicide EDV Rate is per 100,000 population. **95% CI are calculated around rate. All rates are age-adjusted unless noted otherwise. Source: 2007-2009 Kansas Emergency Department Database, Kansas Hospital Association. Rates were age-adjusted to the U.S. 2000 Standard population using the direct method. See Technical Appendix for details on how rates were calculated.

9
Hospital Discharges:
Source: 2005-2009 Kansas Hospital Discharge Database, Kansas Hospital Association.
• From 2005 to 2009
o The suicide hospital discharge (HD) rate is higher in the 15-64 year age groups. The suicide hospital discharge HD rate was lower among age group for 10-14 years as
compared to age groups for 15-64 years. The suicide HD rate was lower among age group for 65 years and older as compared to
age groups for 15-64 years. o 95% Confidence Intervals for age-specific suicide HD rate can be found in Table HD3.
Source: 2005-2009 Kansas Hospital Discharge Database, Kansas Hospital Association.
17.3
81.9 77.0 78.9 80.3
56.1
25.4
12.6 7.3
0
30
60
90
10-14 15-19 20-24 25-34 35-44 45-54 55-64 65-74 75+
Suicide HD Rate per 100,000 population
Age Group
Age-Specific Suicide Hospital Discharge (HD) Rate Kansas 2005-2009
8
67 75 80 78
58
25 12 12
35
132
110 112 114
76
37
18 7
0
50
100
10-14 15-19 20-24 25-34 35-44 45-54 55-64 65-74 75+ Suic
ide
HD
Rat
e pe
r 10
0,00
0 po
pula
tion
Age Group
Age-Specific Hospital Discharge (HD) Rate by Gender Kansas 2005-2009
Male Female

10
• From 2005 to 2009 o Females made up 59% of all suicide HD (n=4,562) and males made up 41% (n=3,130). o The age-specific suicide HD rate of females was consistently higher than compared to males
across most age groups. o The highest suicide HD rate in females was seen among 15-19 years olds
15-19: 132.4 suicide HD per 100,000 population, 95% CI: 122.4-143.0 o The suicide HD rate is nearly nine times higher among males 15-19 years old as compared to
males 10-14 years old. 15-19: 66.7 suicide HD per 100,000, 95% CI: 59.9-74.1 10-14: 7.8 suicide HD per 100,000, 95% CI: 5.6-10.8
NHOPI: Non-Hawaiian and other Pacific Islander. Source: 2005-2009 Kansas Hospital Discharge Database, Kansas Hospital Association. Rates were age-adjusted to the U.S. 2000 Standard population using the direct method. See Technical Appendix for details on how rates were calculated.
• From 2005 to 2009
o The age-adjusted suicide HD rates were not significantly different among Whites and African Americans. Whites: 50.0 suicide HD per 100,000 population, 95% CI: 48.7-51.3 African Americans: 48.8 suicide HD per 100,000 population, 95% CI: 44.3-53.9
o Non-Hispanics had a higher age-adjusted suicide HD rate compared to Hispanics. Non-Hispanics: 54.4 suicide HD per 100,000 population, 95% CI: 53.1-55.7 Hispanics: 22.6 suicide HD per 100,000 population, 95% CI: 20.0-25.8
50.0 48.9
24.4
54.4
22.6
0
20
40
60
White African American Asian /NHOPI Non-Hispanic Hispanic
Race Ethnicity Suic
ide
HD
Rat
e pe
r 10
0,00
0 po
pula
tion
Age-Adjusted Suicide Hospital Discharge (HD) Rate by Race & Ethnicity Kansas 2005-2009

11
Cause of Suicide Hospital Discharge by Gender Kansas 2005-2009
Source: 2005-2009 Kansas Hospital Discharge Database, Kansas Hospital Association.
• From 2005 to 2009
o Poisoning was the leading cause of suicide HD among both genders. o 97% of all suicide HD in women were due to poisoning. o 87% of all suicide HD in men were due to poisoning.
Source: 2005-2009 Kansas Hospital Discharge Database, Kansas Hospital Association.
• From 2005 to 2009
o The poisoning suicide HD rate is lower among age groups 55 years and older compared to age group 15-54 years.
o 95% Confidence Intervals for age-specific rates can be found in Table HD1.
Poisoning 97%
All other 3%
Females
Poisoning 87%
Cut/ Pierce
4%
Firearm 4%
All other 5%
Males
20.3
92.9 83.2
88.6 89.6
62.6
28.6
13.4 6.6
0
20
40
60
80
100
10-14 15-19 20-24 25-34 35-44 45-54 55-64 65-74 75+ Suic
ide
HD
Rat
e pe
r 10
0,00
0 po
pula
tion
Age Group
Poisoning Suicide Hospital Discharge (HD) Rate by Age Kansas 2005-2009

12
Table HD1. Age and Cause Specific Suicide Hospital Discharge (HD) Rates, Kansas 2005-2009
Poisoning Cut/Pierce All Other
Demographic # HD HD
Rate* 95% CI** # HD HD
Rate* 95% CI** # HD HD
Rate* 95% CI**
05-09 5 . . . . .
10-14 192 20.3 17.6- 23.4 . . . .
15-19 935 92.9 87.0- 99.0 23 2.3 1.4- 3.4 33 3.3 2.3- 4.6
20-24 890 83.2 77.8- 88.9 37 3.5 2.4- 4.8 54 5.0 3.8- 6.6
25-34 1,609 88.5 84.3- 93.0 43 2.4 1.7- 3.2 79 4.3 3.4- 5.4
35-44 1,643 89.6 85.3- 94.1 39 2.1 1.5- 2.9 68 3.7 2.9- 4.7
45-54 1,264 62.6 59.2- 66.1 35 1.7 1.2- 2.4 62 3.1 2.4- 3.9
55-64 421 28.6 25.9- 31.4 14 . 24 1.6 1.0- 2.4
65-74 118 13.4 11.1- 16.1 8 . 9 .
75+ 61 6.6 5.0- 8.4 7 . 13 . *Suicide HD Rate is per 100,000 population. **95% CI are calculated around rate. Source: 2005-2009 Kansas Hospital Discharge Database, Kansas Hospital Association.
*Suicide HD Rate is per 100,000 population. **95% CI are calculated around rate. Source: 2005-2009 Kansas Hospital Discharge Database, Kansas Hospital Association. Rates were age-adjusted to the U.S. 2000 Standard population using the direct method. See Technical Appendix for details on how rates were calculated.
• From 2000 to 2009 o The age-adjusted suicide HD rate in Kansas steadily increased by 50%. In 2000 the age-adjusted
suicide HD rate was at 41.2 suicide HD per 100,000 population (95% CI: 38.8-43.7) and in 2009, rose to 60.8 suicide hospital discharges per 100,000 population (95% CI: 57.9-63.8).
o Increase in suicide HD rates was seen in both males and females (Table HD2).
0
20
40
60
80
2000 2001 2002 2003 2004 2005 2006 2007 2008 2009
Suic
ide
HD
Rat
e Pe
r 10
0,00
0 po
pula
tion
Year
Age-Adjusted Suicide Hospital Discharge (HD) Rate by Gender Kansas 2000-2009
Overall Female Male

13
Table HD2. Age and Gender Specific Suicide Hospital Discharge (HD) Rates by Year Kansas 2005-2009 Year Gender #HD HD Rate* 95% CI**
2000 Female 741 55.7 51.8- 59.9
Male 370 27.4 24.6- 30.3
Overall 1,111 41.2 38.8- 43.7
2001 Female 737 55.2 51.3- 59.3
Male 404 29.6 26.8- 32.6
Overall 1,141 42.2 39.7- 44.7
2002 Female 713 53.1 49.2- 57.1
Male 422 30.8 27.9- 33.9
Overall 1,135 41.7 39.3- 44.3
2003 Female 843 63.2 59.0- 67.7
Male 513 37.8 34.6- 41.2
Overall 1,356 50.2 47.6- 53.0
2004 Female 887 66.3 62.0- 70.8
Male 537 38.9 35.6- 42.3
Overall 1,424 52.3 49.6- 55.1
2005 Female 844 62.9 58.7- 67.3
Male 547 39.9 36.6- 43.4
Overall 1,391 51.1 48.4- 53.9
2006 Female 865 65.2 60.9- 69.7
Male 551 40.1 36.8- 43.7
Overall 1,416 52.4 49.7- 55.3
2007 Female 934 70.1 65.6- 74.8
Male 589 43.0 39.5- 46.6
Overall 1,523 56.2 53.4- 59.1
2008 Female 979 73.0 68.4- 77.7
Male 717 51.7 47.9- 55.7
Overall 1,696 62.1 59.1- 65.1
2009 Female 940 69.5 65.1- 74.2
Male 726 52.4 48.6- 56.4
Overall 1,666 60.8 57.9- 63.8 *Suicide HD Rate is per 100,000 population. **95% CI are calculated around rate. Source: 2005-2009 Kansas Hospital Discharge Database, Kansas Hospital Association. Rates were age-adjusted to the U.S. 2000 Standard population using the direct method. See Technical Appendix for details on how rates were calculated.

14
Table HD3.Hospital Discharge Section Review Table Suicide Hospital Discharge (HD) Rate by Selected Demographic groups, Causes of Suicide, and Risk Factors, Kansas 2007-2009 Demographic Groups # HD HD Rate* 95% CI**
Overall 7,692 56.6 55.3- 57.8
Gender Female 4,562 68.2 66.2- 70.2
Male 3,130 45.4 43.8- 47.1
Age Groups (Age Specific Rates)
05-09 5 .
10-14 198 21.0 18.2- 24.1
15-19 991 98.4 92.4-104.8
20-24 981 91.7 86.1- 97.6
25-34 1,731 95.3 90.8- 99.9
35-44 1,750 95.5 91.0-100.0
45-54 1,361 67.4 63.8- 71.1
55-64 459 31.1 28.4- 34.1
65-74 135 15.4 12.9- 18.2
75+ 81 8.7 6.9- 10.8
Race White 6,077 50.0 48.7- 51.3
African American 436 48.9 44.3- 53.9
Asian / NHOPI 85 24.4 19.3- 31.4
Native American 21 11.4 7.0- 19.2
Ethnicity Non-Hispanic 6,708 54.4 53.1- 55.7
Hispanic 302 22.6 20.0- 25.8
Cause Poisoning 7,138 52.5 51.3- 53.8
Cut/Pierce 208 1.5 1.3- 1.7
All Other 346 2.5 2.2- 2.8
Risk Factors Alcohol 1,979 14.7 14.0- 15.4
NHOPI: Non-Hawaiian and other Pacific Islander *Age-Adjusted Suicide HD Rate is per 100,000 population. All rates are age-adjusted unless noted otherwise. **95% CI are calculated around rate. Source: 2005-2009 Kansas Hospital Discharge Database, Kansas Hospital Association. Rates were age-adjusted to the U.S. 2000 Standard population using the direct method. See Technical Appendix for details on how rates were calculated.

15
Mortality Data
Source: 2000-2010 Kansas Vital Statistics, Bureau of Epidemiology and Public Health Informatics, KDHE.
• From 2006 to 2010
o The suicide death rate is higher in the 20-64 year age groups. The suicide death rate is significantly lower among age groups for 15-19 years as
compared to age groups for 20-64 years. The suicide death rate is significantly lower among age groups for 65 years and older as
compared to age groups for 20-64 years. o 95% Confidence Intervals for age-specific rates can be found in Table MD3.
Source: 2000-2010 Kansas Vital Statistics, Bureau of Epidemiology and Public Health Informatics, KDHE.
10.6
16.7 17.6 18.9
20.5
16.4 14.6 14.1
0
10
20
15-19 20-24 25-34 35-44 45-54 55-64 65-74 75+
Suicide Death Rate per 100,000 population
Age Group
Overall Suicide Death Rate by Age Group Kansas 2006-2010
17.5
28.3 28.6 30.1 31.7
25.6 26.8
32.6
4.1 6.0 7.4
9.5 7.5
0
10
20
30
15-19 20-24 25-34 35-44 45-54 55-64 65-74 75+
Suicide Death Rate per 100,000 population
Age Group
Age-Specific Suicide Death Rate by Gender Kansas 2006-2010
Male Female

16
• From 2006 to 2010 o Males made up 81% of all suicide deaths (n=1,540) and females made up 19% (n=351) o The age-specific suicide death rate for males was consistently higher compared to females
across all age groups. o The age-adjusted suicide death rate for males was four times higher than compared to females
(Table MD3). Males: 5.0 suicide deaths per 100,000 population, 95% CI: 4.5-5.5 Females: 22.3 suicide deaths per 100,000 population, 95% CI: 21.2-23.5
Source: 2006-2010 Kansas Vital Statistics, Bureau of Epidemiology and Public Health Informatics, KDHE. Rates were age-adjusted to the U.S. 2000 Standard population using the direct method. See Technical Appendix for details on how rates were calculated.
• From 2006 to 2010
o The age-adjusted suicide death rate was higher among Whites compared to African Americans. Whites: 13.7 suicide deaths per 100,000 population, 95% CI: 13.0-14.3 African Americans: 7.0 suicide deaths per 100,000 population, 95% CI: 5.3-9.0
o The age-adjusted suicide death rate was higher among Non-Hispanics compared to Hispanics. Hispanics: 8.3 suicide deaths per 100,000 population, 95% CI: 6.6-10.6 Non-Hispanics: 13.8 suicide deaths per 100,000 population, 95% CI: 13.1-14.5
13.7
7.0
13.8
8.3
0
5
10
15
White African American Non-Hispanic Hispanic
Race Ethnicity
Suicide Death Rate per 100,000 population
Age-Adjusted Suicide Death Rate by Race & Ethnicity Kansas 2006-2010

17
Cause of Suicide Deaths by Gender Kansas 2006-2010
Source: 2006-2010 Kansas Vital Statistics, Bureau of Epidemiology and Public Health Informatics, KDHE
• From 2006 to 2010
o 42% of all suicide deaths in women were caused by poisoning. o 60% of all suicide deaths in men were caused by firearm.
Not all rates calculated due to insufficient numbers. Source: 2006-2010 Kansas Vital Statistics, Bureau of Epidemiology and Public Health Informatics, KDHE .
• From 2006 to 2010
o The firearm suicide death rate is significantly lower among age groups for 15-19 years compared to age groups 20 years and older.
o The suffocation suicide death rate is significantly higher among age groups for 15-54 years as compared to those 65 years and older.
Poisoning 42%
Firearm 28%
Suffocation 21%
All Others 9%
Females
Firearm 60%
Suffocation 22%
Poisoning 12%
All Others 6%
Males
0
5
10
15
15-19 20-24 25-34 35-44 45-54 55-64 65-74 75+
Suic
ide
Dea
th R
ate
per
100,
000
popu
latio
n
Age Group
Age and Cause Specific Suicide Death Rate Kansas 2006-2010
Firearm
Poisoning
Suffocation

18
o The poisoning suicide death rate is significantly higher among age groups for 45-54 as compared to age groups 25-34 years.
o 95% Confidence Intervals for age-specific suicide death rates available in Table MD1 Table MD1. Age and Cause Specific Suicide Death Rate, Kansas 2006-2010
Firearm Suffocation Poisoning
Age Group # Deaths Death Rate* 95% CI** # Deaths
Death Rate* 95% CI** # Deaths
Death Rate* 95% CI**
10-14 6 . 5 . 15-19 49 4.9 3.6- 6.4 47 4.7 3.4- 6.2 20-24 104 9.8 8.0- 11.9 45 4.2 3.1- 5.7 11 .
25-34 161 8.8 7.5- 10.3 87 4.8 3.8- 5.9 53 2.9 2.2- 3.8
35-44 154 8.6 7.3- 10.0 85 4.7 3.8- 5.8 75 4.2 3.3- 5.2
45-54 200 9.9 8.5- 11.3 81 4.0 3.2- 5.0 113 5.6 4.6- 6.7
55-64 154 10.0 8.5- 11.8 33 2.2 1.5- 3.0 52 3.4 2.5- 4.4
65-74 102 11.3 9.3- 13.8 8 . 16 .
75+ 98 10.5 8.6- 12.8 10 . 13 . *Suicide Death Rate is per 100,000 population. **95% CI are calculated around rate. Source: 2006-2010 Kansas Vital Statistics, Bureau of Epidemiology and Public Health Informatics, KDHE.
Source: 2006-2010 Kansas Vital Statistics, Bureau of Epidemiology and Public Health Informatics, KDHE. Rates were age-adjusted to the U.S. 2000 Standard population using the direct method. See Technical Appendix for details on how rates were calculated.
• From 2000 to 2010 (Table MD2) o The age-adjusted suicide death rate is higher among males then females. o The overall age-adjusted suicide death rate has remained fairly consistent between 11 and 14
suicide deaths per 100,000.
0
10
20
30
2000 2001 2002 2003 2004 2005 2006 2007 2008 2009 2010
Suic
ide
Dea
th R
ate
Per
100,
000
popu
latio
n
Year
Age Adjusted Suicide Death Rate by Gender Kansas 2000-2010
Overall Male Female

19
Table MD2. Age-Adjusted Gender Specific Suicide Death Rates by Year, Kansas 2006-2010
*Suicide Death Rate is per 100,000 population. **95% CI are calculated around rate. Source: 2006-2010 Kansas Vital Statistics, Bureau of Epidemiology and Public Health Informatics, KDHE. Rates were age-adjusted to the U.S. 2000 Standard population using the direct method. See Technical Appendix for details on how rates were calculated.
Year Gender #Deaths Death Rate* 95% CI**
2000 Female 57 4.3 3.3- 5.6
Male 274 21.1 18.6- 23.7
Overall 331 12.4 11.1- 13.8
2001 Female 56 4.3 3.3- 5.6
Male 241 18.1 15.9- 20.6
Overall 297 11.0 9.8- 12.4
2002 Female 60 4.6 3.5- 5.9
Male 286 21.5 19.1- 24.2
Overall 346 12.6 11.3- 14.0
2003 Female 75 5.6 4.4- 7.0
Male 269 20.4 18.0- 23.0
Overall 344 12.6 11.3- 14.0
2004 Female 79 5.9 4.6- 7.3
Male 289 21.4 19.0- 24.1
Overall 368 13.4 12.1- 14.8
2005 Female 61 4.6 3.5- 5.9
Male 295 21.7 19.2- 24.3
Overall 356 12.9 11.6- 14.3
2006 Female 70 5.2 4.1- 6.7
Male 307 22.6 20.2- 25.4
Overall 377 13.7 12.3- 15.2
2007 Female 71 5.2 4.0- 6.6
Male 309 22.5 20.1- 25.2
Overall 380 13.6 12.2- 15.0
2008 Female 53 3.7 2.8- 4.9
Male 297 21.5 19.1- 24.1
Overall 350 12.4 11.1- 13.8
2009 Female 67 4.8 3.7- 6.1
Male 309 22.5 20.0- 25.2
Overall 376 13.4 12.0- 14.8
2010 Female 90 6.2 5.0- 7.7
Male 318 22.4 20.0- 25.1
Overall 408 14.2 12.9- 15.7

20
Table MD3. Deaths Section Review Table Suicide Death Rate by Selected Demographics groups, Causes of Suicide, and Risk Factors, Kansas 2006-2010
NHOPI: Non-Hawaiian and other Pacific Islander. *Suicide Death Rate is per 100,000 population. All rates are age-adjusted unless noted otherwise. **95% CI are calculated around rate. Source: 2006-2010 Kansas Vital Statistics, Bureau of Epidemiology and Public Health Informatics, KDHE. Rates were age-adjusted to the U.S. 2000 Standard population using the direct method. See Technical Appendix for details on how rates were calculated.
Demographic Groups #Deaths
Death Rate* 95% CI**
Overall 1,891 13.5 12.9- 14.1
Gender Female 351 5.0 4.5- 5.5
Male 1,540 22.3 21.2- 23.5
Age Group (Age Specific)
10-14 14 .
15-19 107 10.6 8.7- 12.8
20-24 177 16.7 14.3- 19.4
25-34 322 17.6 15.7- 19.6
35-44 339 18.9 16.9- 21.0
45-54 416 20.5 18.6- 22.6
55-64 252 16.4 14.5- 18.6
65-74 131 14.6 12.2- 17.3
75+ 131 14.1 11.8- 16.7
Race White 1,734 13.7 13.0- 14.3
African-American 64 6.8 5.2- 8.9
Asian / NHOPI 11 .
Native American 10 .
Ethnicity Non-Hispanic 1,774 13.8 13.1- 14.4
Hispanic 102 8.5 6.7- 10.7
Cause Firearm 1,028 7.2 6.8- 7.7
Suffocation 403 2.9 2.7- 3.2
Poisoning 337 2.4 2.2- 2.7
All Other 123 0.9 0.7- 1.1
Risk Factors Alcohol 51 0.4 0.3- 0.5

21
Technical Appendix Cause Coding: Causes are determined by using an injury matrix that is recommended by Safe States Alliance. This is a system that uses the diagnosis code (ED data and HD data) and underlying cause (Mortality Database) to give a cause and intent to an injury. Data are selected and coded for hospital discharges according to the Consensus Recommendations for Using Hospital Discharge Data for Injury Surveillance from the Safe States Alliance. This method codes injuries based on e-codes using the injury matrix provided by the CDC6. Data for emergency departments is similar to hospital discharge but closely follows the selection method from State Injury Indicators: Instructions for Preparing 2005 Data from the Centers for Disease Control and Prevention. Mortality Data is coded using the ICD-10 injury matrix provided by the CDC7
. This is similar to the method described in Instructions for Preparing 2005 Data but uses a different coding scheme.
Suicide ICD Codes were defined as follows: ICD-9: E950-E959 ICD-10: U03, X60-X84 Counts: Counts are the actual number of events that occurred. Counts below five are not displayed in this report. Rates: Age-Specific rates are calculated by dividing the number of events by the population in that specific age group. By using rates, two differently sized communities/regions can be compared to each other. Note that rates in which the number of events is below 20 are not calculated as rates calculated for numbers less than 20 are inaccurate and scientifically unreliable. Age-specific rates are calculated by dividing the number of events by the population of Kansas or by Kansas subpopulation of interest. Population denominators are taken from estimates produced by the U.S. Census Bureau. To be consistent with other KHDE publications, 2000-2009 midyear population estimates produced for each year are used, rather than using the most recent estimate. For example, a 2005 rate will be based on the Kansas population estimate published in 2005 (2005 vintage), rather than using the most recent 2005 population estimate (2009 vintage). For 2001, the 2002 vintage estimates were used. For 2000, the census 2000 populations were used. For 2010, the census 2010 populations were used. Age adjusted rates: Age adjustment is a statistical method for standardizing rates for groups that have different underlying age distributions to be more comparable. Age-adjusted rates should be used to compare Kansas with the United States as a whole, or for comparing two groups, or the same group over time, if the underlying population distribution is different or changes (for example, comparing rates for Hispanics and Non-Hispanics). Age-adjusted rates should be understood as relative indices, not as actual measures of burden, and should not be compared to unadjusted rates. All age-adjusted rates in this report are computed using the direct method. Briefly, rates are first computed within each age group stratum. The products of each age-specific rate multiplied by the proportion of the 2000 U.S. Standard Population in that age category are summed across the age group strata. Age-specific rates

22
are based on 10 age groups: 0 to 4, 5 to 9, 10 to 14, 15 to 19, 20 to 24 ,25 to 34, 35 to 44, 45 to 54, 55 to 64, 65 to 74, 75 years and older. Confidence intervals: All rates, proportions and prevalence estimates presented in this report can be thought of as estimates of a theoretical true value, or population parameter. These estimates are subject to random variation. To characterize this variability, some of the statistics presented in this report include 95% confidence intervals. This can be thought of as a range of values that will contain the population parameter (theoretical true value) 95% of the time. To compute confidence intervals presented in this report, events were assumed to follow a Poisson distribution. If the number of events was 100 or higher, confidence limits were produced using the normal approximation. If the number of deaths or discharges was fewer than 100, limits are taken directly from the Poisson distribution. Age-adjusted confidence intervals were calculated using gamma method described by the Washington Department of Health8
.
Databases: The three databases used for the purposes of this document are the hospital discharge database, the emergency department database, and the mortality database. See table below for detailed information on all three databases.
Database Who’s Counted?
Coding System
Used Years Provided In this
Report
Emergency Department Database* Kansas Hospital Association**
A person who is admitted for less than 24 hours to a non-federal, short stay community or general hospital who is reporting emergency department visits to Kansas Hospital Association.
ICD-9 2007-2008
Hospital Discharge Database* Kansas Hospital Association**
A person who is admitted for at least 24 hours to a non-federal, short stay community or general hospital who is reporting hospital discharge data to Kansas Hospital Association.
ICD-9 2005-2009
Mortality Database Kansas Department of Health and Environment
Any persons who dies in the state of Kansas, and also Kansans who die outside of the state.
ICD-10 2000-2010
*Special Focus, Unlinked Data: The records in the Kansas emergency department and hospital discharge database are not unique. Records are not unique when they are unlinked. Suppose someone breaks their arm and goes to the emergency department but is then transferred to another emergency department due to a complication. In a linked system this one event can be tied together and counted as one event but with an unlinked system these are counted as two separate events. Serious injuries can inflate the counts if the person is transferred more than once. This is why we refer to events as hospital discharges (not unique). ** Federal and specialty hospitals in Kansas do not report their discharges and emergency department visits to these databases. All non federal, short stay community or general hospitals in Kansas do not report their emergency department visits or hospital discharge data to Kansas Hospital Association, therefore these databases do not include 100% of emergency department visits and hospital discharges.

23
References 1 CDC - Fatal Injury Data - WISQARS - Injury. (2011, January 1).CDC- WISQARS - Injury. Retrieved January 11,
2012, from http://www.cdc.gov/injury/wisqars/fatal.html 2 AFSP: About Suicide. (n.d.).AFSP: About Suicide. Retrieved January 11, 2012, from
http://www.afsp.org/index.cfm?fuseaction=home.viewPage&page_id=74295647-AAD5-B47F-340249697DAC238A
3 Mental Health and Mental Disorders. (2012, March 1).Mental Health and Mental Disorders. Retrieved March
13, 2012, from http://healthypeople.gov/2020/topicsobjectives2020/objectiveslist.aspx?topicId=28 4 CDC. (2012, January 13). CDC Grand Rounds: Prescription Drug Overdoses — a U.S. Epidemic. CDC Grand Rounds: Prescription Drug Overdoses — a U.S. Epidemic. Retrieved January 12, 2012, from http://www.cdc.gov/mmwr/preview/mmwrhtml/mm6101a3.htm?s_cid=mm6101a3_w 5 ingenix. (2005). 2006 Coder’s Desk Reference (3rd ed.). 6 CDC. (2011, August 10). CDC - Proposed Matrix of E-code Groupings - WISQARS - Injury. CDC-code Groupings
- WISQARS - Injury. Retrieved January 12, 2012, from http://www.cdc.gov/injury/wisqars/ecode_matrix.html
7 Arialdi M. Minino. (2006). Deaths: Injuries, 2002. National Vital Statistics Report, 54(10), 125. 8 Washington State Department of Health - Assessment Guidelines: Confidence Intervals. (2010, July
1).Washington State Department of Health: Confidence Intervals. Retrieved January 12, 2012, from http://www.doh.wa.gov/data/guidelines/confintguide.htm