Sugeno Fuzzy Inference Optimization With Firefly and K ...
14
Journal of Information Technology and Computer Science Volume 3, Number 1, 2018, pp. 35-48 Journal Homepage: www.jitecs.ub.ac.id Sugeno Fuzzy Inference Optimization With Firefly and K- Means Clustering Algorithms For Rainfall Forecasting M.Shochibul Burhan 1 , Wayan Firdaus Mahmudy 2 , Fitra A. Bachtiar 3 , Rizdania 4 Intelligent System Research Group, Faculty of Computer Science, Brawijaya University, Indonesia [email protected], [email protected], [email protected], [email protected] Received 06 November 2017; accepted 24 April 2018 Abstract. Rainfall is very influential in our daily lives, ranging from agriculture, aviation, to flood-prone areas. The intensity of rainfall is used as an early detection for preventing harmful effects of rainfall. This research used Sugeno Fuzzy Logic, where the prediction is accomplished by mapping rules from the data obtained using the K-Means Clustering Algorithm as the classification to form the membership function and mapping rules and Firefly Alghorithm for optimization output. The test result from the 30 examined data found is 2.93 RMSE. This shows that the data support from K-Means Clustering and Firefly Algorithms of the fuzzy logic can predict precipitation accurately. 1 Introduction Rainfall is very influential in our daily lives, ranging from agriculture, aviation, travel to flood-prone areas. The intensity of rainfall is used as an early detection to undertake preventive measures against harmful effects it causes. Rainfall intensity is the amount of rainfall per unit of time [1]. If the intensity is great, it is called heavy rain, and it can be dangerous because it can cause flood, landslides and other negative effects. By using the data provided by BMKG (Agency for Meteorology, Climatology and Geophysics) from time to time, which can be formulated into mathematical form, the intensity of rainfall can be mapped and predicted. In earlier studies, some rainfall forecasting methods have been used. Wigena [2] used the method with projection pursuit regression to form a prediction pattern of the data obtained from the Global Climate Model (GCM). Apriyanti [3] used artificial neural networks and genetic algorithm to produce the best data. Mirawati et al [4] made predictions of rainfall in Semarang using Kalman filter. This research used Sugeno fuzzy logic, in which the prediction is done by mapping the rules of the data obtained, using the K-Means clustering algorithm as the
Transcript of Sugeno Fuzzy Inference Optimization With Firefly and K ...

Journal of Information Technology and Computer Science Volume 3, Number 1, 2018, pp. 35-48
Journal Homepage: www.jitecs.ub.ac.id
Sugeno Fuzzy Inference Optimization With Firefly and K-
Means Clustering Algorithms For Rainfall Forecasting
M.Shochibul Burhan1, Wayan Firdaus Mahmudy2, Fitra A. Bachtiar3, Rizdania4
Intelligent System Research Group, Faculty of Computer Science, Brawijaya
University, Indonesia [email protected], [email protected], [email protected],
Received 06 November 2017; accepted 24 April 2018
Abstract. Rainfall is very influential in our daily lives, ranging from agriculture, aviation, to flood-prone areas. The intensity of rainfall is used as an early detection for preventing harmful effects of rainfall. This research used Sugeno Fuzzy Logic, where the prediction is accomplished by mapping rules from the data obtained using the K-Means Clustering Algorithm as the classification to form the membership function and mapping rules and Firefly Alghorithm for optimization output. The test result from the 30 examined data found is 2.93 RMSE. This shows that the data support from K-Means Clustering and Firefly Algorithms of the fuzzy logic can predict precipitation accurately.
1 Introduction Rainfall is very influential in our daily lives, ranging from agriculture,
aviation, travel to flood-prone areas. The intensity of rainfall is used as an early detection to undertake preventive measures against harmful effects it causes.
Rainfall intensity is the amount of rainfall per unit of time [1]. If the intensity is great, it is called heavy rain, and it can be dangerous because it can cause flood, landslides and other negative effects. By using the data provided by BMKG (Agency for Meteorology, Climatology and Geophysics) from time to time, which can be formulated into mathematical form, the intensity of rainfall can be mapped and predicted.
In earlier studies, some rainfall forecasting methods have been used. Wigena [2] used the method with projection pursuit regression to form a prediction pattern of the data obtained from the Global Climate Model (GCM). Apriyanti [3] used artificial neural networks and genetic algorithm to produce the best data. Mirawati et al [4] made predictions of rainfall in Semarang using Kalman filter.
This research used Sugeno fuzzy logic, in which the prediction is done by mapping the rules of the data obtained, using the K-Means clustering algorithm as the
36 JITeCS Volume 3, Number 1, 2018, pp 35-48
p-ISSN: 2540-9433; e-ISSN: 2540-9824
classification to form the membership function and mapping rules. Sugeno method was introduced by Takagi-Sugeno Kang in 1985 [5]. By using Fuzzy Inference Sugeno, the rain intensity can be mapped using role models obtained from BMKG data. By applying Fuzzy Inference Sugeno that can predict the worst effects of high rainfall, they can be resolved beforehand.
2 Related Work
Some studies on the rainfall forecasting have been conducted by applying some algorithms for prediction, including projection pursuit regression, artificial neural network and Kalman filter.
Wigena [2] conducted a study predicting the rainfall using projection persuit regression, which utilized climate data from Global Climate Model (GCM), which were used to form a prediction model. There were thousands of data from GCM, so it took quite a long time to compute them. Apriyanti [3] conducted a study using artificial neural network but the level of error (RMSE) was not that significant. Mirawati et al [4] used Kalman filter to predict rainfall in Semarang City. Because this method has a model based on the minimum and maximum limits, the results of the rainfall forecasting were also in the form of minimum and maximum data. Thus, the data generated were still in the form of limits rather than exact number.
Fuzzy methods have been applied in some studies that generated highly accurate predictions. Burhan [6] conducted a study by predicting the procurement of goods using fuzzy logic to create rules based on inventory data, generating a valid level of prediction with 70% of the data having a level of error of 0% and the highest error was only 19% of the real data. Hidayat et al [7] used fuzzy method as an expert system to determine the need for English language learning. With the level of accuracy of 95%, this method successfully presented data validly.
In this study, Sugeno fuzzy method was used for predicting the rainfall intensity based on the data from Global Climate Model (GCM). By using K-Means clustering algorithm, the accuracy of the data defuzzification will be optimal for K-Means clustering method takes data approach called centroid method for determining the results of the defuzzyfication. By using mamdani fuzzy method and K-Means clustering algorithm, the level of accuracy of the rainfall forecast result will be high.
3 Intensity of Rainfall
Intensity of rainfall is the amount of rainfall per unit of time [1]. In this study, the intensity of rainfall was obtained from the Global Climate Model (GCM) around Perak, Surabaya. Based on data from GCM, there are several parameters used for determining rainfall, including temperature, humidity and wind speed [8].

M.Shochibul Burhan et al., Sugeno Fuzzy Inference Optimization ... 37
p-ISSN: 2540-9433; e-ISSN: 2540-9824
Rain is formed from the evaporation of water exposed to the sun, and then the water vapor will rise into the air along with the other vapor to be collected into one. The high temperature due to the heat of the sun transforms the water vapor into dew and makes it to form clouds. With the help of the wind, the cloud will move to a different place, and as it moves, it will merge with other clouds, making the water droplets heavy, and eventually, causing rain to fall.
4 K-Mean Clustering
K-Means clustering method was introduced by J-Macqueen [9]. K-Means clustering method devides the data into a specified constant. It is aimed to classify the data so that the classified data are easier to identify. There are two ways for classifying data, namely the minimum distance (Euclidean Distance), Manhattan Distance and maximum matrix distance between vectors (Chebichev Distance).
4.1 Euclidean Distance This method searches for the closest data to classify data with the following formula:
1-dimension formula
(𝑥 − 𝑦)! = |𝑥 − 𝑦| (1)
2-dimension formula
𝑑 𝑝, 𝑞 = (𝑝1 − 𝑞1)! + (𝑝2 − 𝑞2)! (2)
3-dimension formula
𝑑 𝑝, 𝑞 = (𝑝1 − 𝑞1)! − (𝑝2 − 𝑞2)! − (𝑝3 − 𝑞3)! (3)
4.2 Manhattan Distance This method is also called as taxicab distance with the following formula:
𝑑1 𝑝, 𝑞 = 𝑝 − 𝑞 1 = ∑!!!! |pi – q1| (4)
4.3 Chebicev Distance This method uses maximum matrix distance between vectors by taking the greatest distance of each dimension coordinate, with the following formula:
𝐷𝑐ℎ𝑒𝑏 𝑝, 𝑞 = max (|𝑝𝑖 − 𝑞1|) (5)
5 Firefly Algorithm Optimization

38 JITeCS Volume 3, Number 1, 2018, pp 35-48
p-ISSN: 2540-9433; e-ISSN: 2540-9824
To get a solution rule of the data, optimization is made on all possible rules using firefly algorithm to get the minimum output combination. Previously, data classification using K-Means clustering algorithm was performed to determine the category of low or high.
5. 1 Firefly Algorithm
By adopting the behavior of fireflies and the way fireflies flash, in 2007-2008, Xin-Sheyang developed firefly algorithm under the following rules [1]:
1. Fireflies have unisex nature so the attraction to others is not based on the sex. 2. The attraction toward others is influenced by the brightness of fireflies’ flash. In
a long distance, the brightness decreases, so the firefly that has less brightness will move toward the brighter one. The fireflies will move to any direction or move randomly if there is no bighter light.
3. The light of the fireflies is determined by the objective condition and function to determine the brightness.
The attractiveness of a firefly is determined by the brightness perceived by the fireflies nearby. Thus the attractiveness formula β can be expressed as
𝛽 = 𝛽! 𝑒!!"! (6) β0 = attractiveness at r = 0.
γ = Light absorption coefficient, which controls the light decline.
𝑟!" = || 𝑥! - 𝑥! || = 𝑥!,! − 𝑥!,!!!
!!! (7)
Xi – Xj = the distance between the two fireflies.
Xi,k = K to the component of the spatial coordinates Xi of a firefly i.
d = the number of dimensions.
The movement of fireflies i interested in firefly j is formulated as::
𝑥!!!! = 𝑥!! + 𝛽! 𝑒!!"! (𝑥!! − 𝑥!!) + 𝛼!𝜀! (8) 𝑥!! = starting position of firefly i.
𝛽! 𝑒!!"! (𝑥!! − 𝑥!!) = The appeal or attractiveness.
𝛼!𝜀! = Random movement of fireflies. α is a random number from 0 to 1.
5.2 Fitness K-Means method calculation is used for finding the value closest to the output value

M.Shochibul Burhan et al., Sugeno Fuzzy Inference Optimization ... 39
p-ISSN: 2540-9433; e-ISSN: 2540-9824
(𝑦 − 𝑦′)! (9)
6. Sugeno Fuzzy Method for Rainfall Forecasting
There are several steps to determine the rainfall prediction using Sugeno fuzzy method, namely:
6.1 Establishment of input variable and output variables The input variables are in the forms of three parameters used as references, namely the variables of temperature, humidity and wind speed. Meanwhile, the output variable is the rainfall based on the data from the GCM.
6.2 Formation of fuzzy sets
From the three input variables and the output variable, the following rules were made:
• The variable of temperature = {Low, Medium, High} • The variable of humidity = {Low, Medium, High} • The variable of wind speed = {Low, Medium, High} • The variable of rainfall = {0, 1, 1.5, ... } 6.3 Universe of Discourse (Fuzzy Rule) Universe of Discourse is a daily possibility that occurrs from variables based on the data generated by K-Means on the Global Climate Model (GCM) data. Universe of discourse is shown in the following table.
Table 1. Universe of Discourse
Function Variable VALUE
Temperature [25,31]
Input Humidity [51,94]
Wind speed [0.0,9.9]
Output Rainfall [0,1,1.5, ... ]
6.7 Membership Function
Membership function is a set in determining the membership value of each variable. The membership functions in this study are :
a. The variable of temperature It has fuzzy set form with the following membership form :

40 JITeCS Volume 3, Number 1, 2018, pp 35-48
p-ISSN: 2540-9433; e-ISSN: 2540-9824
• µlow (x) = (25) • µhight (x) = (28)
Fig. 1 The variable of temperature
b. The variable of humidity It has fuzzy set form with the following membership form :
• µlow (x) = (51,72.5) • µhight (x) = (72.5,94)
Fig. 2 The variable of humidity
c. The variable of wind speed It has fuzzy set form with the following membership form:
• µlow (x) = (0.0) • µhight (x) = (9.9)
Fig. 3 The variable of wind speed
d. The variable of rainfall In mamdani method, the output variable is in the form of a constant or linear equation based on the existing rule. From the calculation of the test data from May

M.Shochibul Burhan et al., Sugeno Fuzzy Inference Optimization ... 41
p-ISSN: 2540-9433; e-ISSN: 2540-9824
2011 to June 2015 using K-Means clustering, the rule in the table below was obtained.
Table 2. Rainfall Variable (Rule)
Temperatur Humidity Wind Speed Rainfall Low High Low High Low High
√ √ √ a*0 + b*0+c*0
√ √ √ a*0 + b*0+c*0
√ √ √ a* -0,53 + b*0,28+c*-0,44
√ √ √ a*0 + b*0+c*0
√ √ √ a*0 + b*0+c*0
√ √ √ a*0 + b*0+c*0
√ √ √ a*0,47 + b*-0,37+c*1,56
√ √ √ a*0 + b*0+c*0
e. System stages
It takes some stages to make a prediction. In this research, rainfall data training was conducted at Perak Station, Surabaya, from 2011 to 2013. Data training was carried out to map the data, and then to find a rule pattern. The system stages are as follows:
Fig. 4 System Stages
7. Manual Calculation
Taking History Data
Making Fuzzy Memebersip
Making Fuzzy Rule
Determining the Output FIS Using Firefly Algorithm

42 JITeCS Volume 3, Number 1, 2018, pp 35-48
p-ISSN: 2540-9433; e-ISSN: 2540-9824
From the data derived from the Global Climate Model (GCM) we have the following data:
1. Temperature = 27.3 2. Humidity = 83 3. Wind Speed = 6.7
Previously, we got low temperature = 25, medium temperature = 28 and high temperature = 31; low humidity = 51, medium humidity = 72 and high humidity = 94, and; low wind speed = 0, medium wind speed = 4.95 and high wind speed = 9.9. There are two solving methods, namely:
7. 1 Data Classification Using K-Means Clustering
Classification is done to seek the membership function of each parameter to be used as a rule derived from real data. By using the Euclidean distance method K-Means clustering, 3 dimension is formulated as follows:
(𝑥 − 𝑦)! = |𝑥 − 𝑦|
Determining the proximity of the membership functions Low Temperature, Medium Temperature and High Temperature:
(27,3 − 25)! = 5,29. (27,3 − 31)! = 7,29
The smallest figures 5.29 was taken and Low Temperature was obtained. Determining the proximity of the membership functions Low Humidity and High Humidity:
(83 − 51)! = 1024. (83 − 94)! =. 1212
The smallest figures 1024 was taken and selected Humidity Average, taken a positive reduction before squared:
(6,7 − 0)! = 44,89 (6,7 − 9,9)! =10,24
Determining the proximity of the membership function of wind speed. Low, High: The smallest figures 10.24 was taken and High Wind was obtained.
7.2 Firefly Algorithm Optimization
Firefly algorithm optimization uses 4 solutions, namely temperature, humidity, wind and actual rainfall. Firefly algorithm uses 15-200 solutions to solve a problem [10]. In this study, 30 solutions were used as this number is not too heavy for the computation and the outcomes are more optimum [11]. The steps of the calculation are as follows:
M.Shochibul Burhan et al., Sugeno Fuzzy Inference Optimization ... 43
p-ISSN: 2540-9433; e-ISSN: 2540-9824
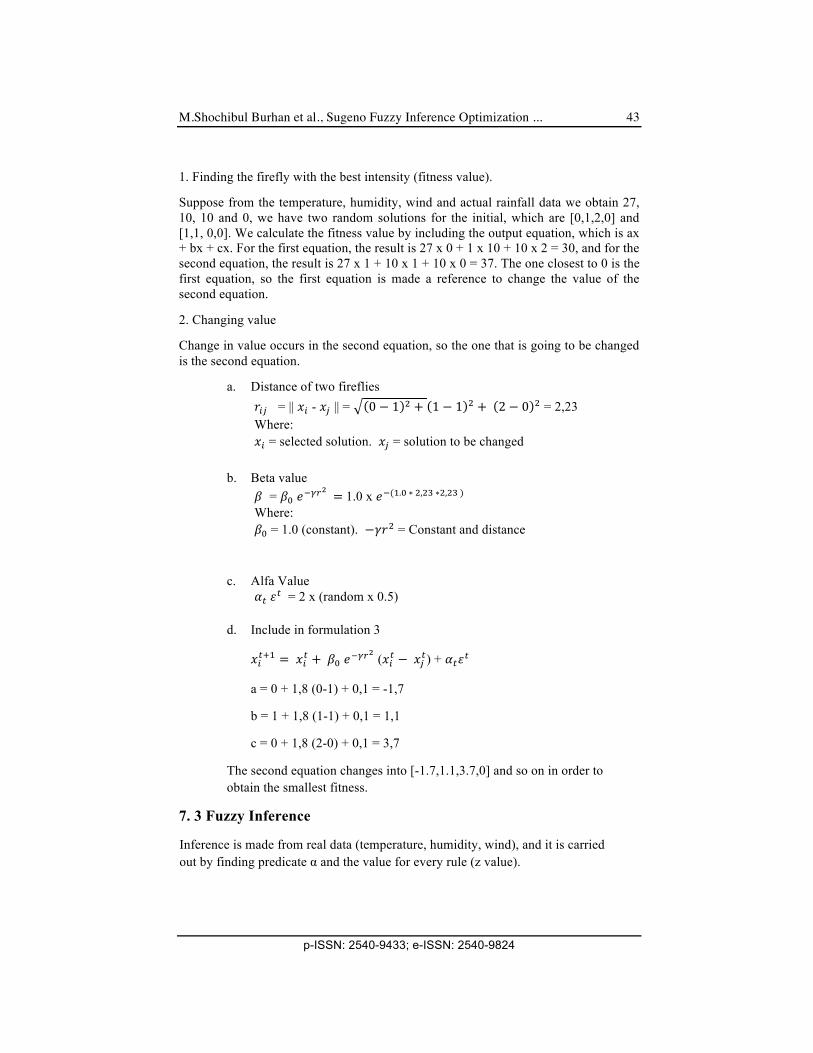
1. Finding the firefly with the best intensity (fitness value).
Suppose from the temperature, humidity, wind and actual rainfall data we obtain 27, 10, 10 and 0, we have two random solutions for the initial, which are [0,1,2,0] and [1,1, 0,0]. We calculate the fitness value by including the output equation, which is ax + bx + cx. For the first equation, the result is 27 x 0 + 1 x 10 + 10 x 2 = 30, and for the second equation, the result is 27 x 1 + 10 x 1 + 10 x 0 = 37. The one closest to 0 is the first equation, so the first equation is made a reference to change the value of the second equation.
2. Changing value
Change in value occurs in the second equation, so the one that is going to be changed is the second equation.
a. Distance of two fireflies 𝑟!" = || 𝑥! - 𝑥! || = 0 − 1 ! + 1 − 1 ! + 2 − 0 ! = 2,23 Where: 𝑥! = selected solution. 𝑥! = solution to be changed
b. Beta value 𝛽 = 𝛽! 𝑒!!"! = 1.0 x 𝑒!(!.! ∗ !,!" ∗!,!" ) Where:
𝛽! = 1.0 (constant). −𝛾𝑟! = Constant and distance c. Alfa Value
𝛼! 𝜀! = 2 x (random x 0.5)
d. Include in formulation 3
𝑥!!!! = 𝑥!! + 𝛽! 𝑒!!"! (𝑥!! − 𝑥!!) + 𝛼!𝜀!
a = 0 + 1,8 (0-1) + 0,1 = -1,7
b = 1 + 1,8 (1-1) + 0,1 = 1,1
c = 0 + 1,8 (2-0) + 0,1 = 3,7
The second equation changes into [-1.7,1.1,3.7,0] and so on in order to obtain the smallest fitness.
7. 3 Fuzzy Inference
Inference is made from real data (temperature, humidity, wind), and it is carried out by finding predicate α and the value for every rule (z value).

44 JITeCS Volume 3, Number 1, 2018, pp 35-48
p-ISSN: 2540-9433; e-ISSN: 2540-9824
[Rule 1]
IF the Temperature is LOW, the Humidity is LOW and the Wind is LOW, the rain = 27.3 x 0 + 83 x 0 + 6.7 x 0;
Predicate α = MODERATE temperature µ (27.3), HIGH humidity µ (83), HIGH wind µ (6.7)
= Min (0.76; 0.5; 0.6) = 0.5
Z1 Value = 0
And so on up to the rule 8, in order to get the z value:
𝑧 = !!∗!"! !!∗!"! !!∗!"! … ! !!"∗!"# !!! !!! !!!⋯! !!"
= !,! ! !!!,! ! !"! ….
!,!!!,!!⋯. = 3,7
Rainfall prediction is 3,7
8. Testing
The testing was done by applying K-Means clustering algorithm to classify the temperature, humidity and wind speed data, and then applied to the fuzzy logic.
8.1 K-Means Clustering
Classification is applied to the temperature, humidity and wind speed. The temperature classification is shown in Fig. 5-7. Temperature was also categorised into two classifications, which are low and high value. The high temperature was 31 while the low one was 25. Humidity was categorised into two classifications, which are low and high value. The high temperature was 94 while the low one was 51. Wind speed was categorised into two classifications, which are low and high value. The high temperature was 9.9 while the low one was 0.0.

M.Shochibul Burhan et al., Sugeno Fuzzy Inference Optimization ... 45
p-ISSN: 2540-9433; e-ISSN: 2540-9824
Fig. 5 Temperature clasification
Fig. 6 Humidity classification
Fig. 7 Wind speed clasification

46 JITeCS Volume 3, Number 1, 2018, pp 35-48
p-ISSN: 2540-9433; e-ISSN: 2540-9824
8.2 Rule Optimization
Optimization rule is conducted in every combination rule to get low level of error. It was conducted with 100 iterations to get the smallest error value as shown in the following graph:
Fig. 8 Rule Optimation
The graph shows the optimization of the lowest level of error of 3.07. So we use it as an output parameter rule.
9. Conclusion
The rainfall prediction using Sugeno fuzzy method and K-Means clustering is able to produce a sufficiently accurate result, test data obtained from 30 to 75% accuracy significantly. This shows the accuracy of the data support from algortma K-Means of the fuzzy able to predict precipitation accurately.
No. Actual Rainfall
FIS-FA-K-Means Regession
Predic RMSE Predic RMSE
1 0 0.8 0.8 5.5 5.5
2 0 0.7 0.7 2.2 2.2
3 5.4 0.8 4.6 5.4 0.08
4 0 0.6 0.6 3.2 3.2
3.624
6.203
4.646 4.958 5.344
4.837
3.53
5.63 4.63
3.07
0
2
4
6
8
10 20 30 40 50 60 70 80 90 100
Fitness
Iterasi
Rule OpKmaKon

M.Shochibul Burhan et al., Sugeno Fuzzy Inference Optimization ... 47
p-ISSN: 2540-9433; e-ISSN: 2540-9824
5 0 0.5 0.5 -1.6 1.6
6 0 0.5 0.5 2.2 2.2
7 0 0.4 0.4 1.9 1.9
8 0 0.5 0.5 1.2 1.2
9 0 0.9 0.9 6.8 6.8
10 13.2 0.5 12.7 3.2 9.9
11 13.2 0.7 12.5 5.3 7.8
12 14.6 0.9 13.7 9.8 4.7
13 0 0.1 0.1 -8.3 8.3
14 0 0.7 0.7 5.0 5.0
15 0 0.4 0.4 2.3 2.3
16 0 0.4 0.4 4.0 4.0
17 0 0.4 0.4 3.8 3.8
18 21.1 0.7 20.4 8.6 12.4
19 13.3 1.1 12.2 8.2 5.0
20 0.4 0.7 0.3 5.9 5.5
21 0 0.6 0.6 5.9 5.9
22 0 0.4 0.4 3.1 3.1
23 0 0.5 0.5 3.7 3.7
24 0 0.8 0.8 3.1 3.1
25 0 0.4 0.4 3.3 3.3
26 0 0.5 0.5 2.9 2.9
27 0 0.6 0.6 2.4 2.4
28 0 0.4 0.4 3.2 3.2
29 0 0.4 0.4 3.5 3.5
30 0.8 0.7 0.1 6.6 5.8
RMSE 2.93 4.38
48 JITeCS Volume 3, Number 1, 2018, pp 35-48
p-ISSN: 2540-9433; e-ISSN: 2540-9824
References
1. M. I. Nasution, “MAPPING ANALYSIS VALIDATION WITH RAINFALL PREDICTION MODEL AND NEURAL NETWORK WAVELET USING ARC VIEW 3.3,” Medan, 2010.
2. A. H. Wigena, “MODELING statistical downscaling WITH PROJECTION PURSUIT REGRESSION FOR MONTHLY RAINFALL FORECAST Case monthly rainfall in Indramayu,” 2006.
3. N. Apriyanti, “RAINFALL FORECAST FOR GENETIC,” 2005.
4. T. D. Mirawati, H. Yasin, and A. Rusgiyono, “Prediction of rainfall in Semarang with Kalman filter,” no. 1983, 2013.
5. S. Kusumadewi, Artificial Intelligence (Teknik and Aplication), 1st ed. Yogyakarta: Graha Ilmu, 2003.
6. M. S. Burhan, “procurement estimation method using fuzzy Sugeno,” Malang, 2011.
7. H. R. Hidayat, R. Regasari, M. Putri, and W. F. Mahmudy, “INGGRIS DENGAN METODE FUZZY INFERENCE SYSTEM MAMDANI,” no. 3, pp. 1–8, 2014.
8. S. S. Sharifi, R. Delirhasannia, V. Nourani, A. A. Sadraddini, and A. Ghorbani, “Using Artificial Neural Networks ( ANNs ) and Adaptive Neuro-Fuzzy Inference System ( ANFIS ) for Modeling and Sensitivity Analysis of Effective Rainfall,” no. 2008, pp. 133–139, 2009.
9. M. Single, “Single Linkage Analysis Methods and Application of K-Means for zoning pattern Rain South Sumatra Province Based Arc View,” pp. 1–8.
10. X. Yang, “Firefly Algorithms for Multimodal Optimization,” Dep. Eng. Univ. Cambridge, pp. 169–178, 2009.
11. B. P. Hadhi, R. S. Wibowo, and I. Robandi, “Considers Cost Function Seamlessly With Firefly Algorithm,” vol. 3, no. 1, 2014.