Substructure Analysis of Metabolic Pathways by Graph-Based ...
25
Substructure Analysis of Metabolic Pathways by Graph-Based Relational Learning Chang hun You, Lawrence B. Holder, and Diane J. Cook School of Electrical Engineering and Computer Science, Washington State University, Pullman, WA 99164-2752 {changhun,holder,cook}@eecs.wsu.edu Systems biology has become a major field of post-genomic bioinformatics research. A biological network containing various objects and their relation- ships is a fundamental way to represent a bio-system. A graph consisting of vertices and edges between these vertices is a natural data structure to rep- resent biological networks. Substructure analysis of metabolic pathways by graph-based relational learning provides us biologically meaningful substruc- tures for system-level understanding of organisms. This chapter presents a graph representation of metabolic pathways to describe all features of metabolic pathways and describes the application of graph-based relational learning for structure analysis on metabolic pathways in both supervised and unsupervised scenarios. We show that the learned substructures can not only distinguish between two kinds of biological net- works and generate hierarchical clusters for better understanding of them, but also have important biological meaning. 1 Introduction A biological organism has one ultimate goal: to continue the life of its species and itself in the natural environment. This goal requires two important ac- tivities, maintaining low entropy in the environment and reproducing oneself. Biological organisms need to process various functions to maximize free en- ergy and minimize entropy. These two basic processes are preformed by a variety of interactions in an organism. Fundamentally the organism is a system itself as well as a property of a bio- ecosystem. A biological organism is not just composed of various objects, but also has dynamic and interactive relationships among them. A system-level understanding is a more efficient way to approach the organisms. With ad- vances in computer science, bioinformatics plays a central role in life science. Traditional bioinformatics has been focused on molecular-level research. Ge- nomics and proteomics, main areas in molecular-level research, have studied function and structure of macromolecules in organisms, and produced a huge amount of results. However almost every biomolecule plays its role only in A.S. Sidhu et al. (Eds.): Biomedical Data and Applications, SCI 224, pp. 237–261. springerlink.com c Springer-Verlag Berlin Heidelberg 2009
Transcript of Substructure Analysis of Metabolic Pathways by Graph-Based ...

Substructure Analysis of Metabolic Pathwaysby Graph-Based Relational Learning
Chang hun You, Lawrence B. Holder, and Diane J. Cook
School of Electrical Engineering and Computer Science, Washington StateUniversity, Pullman, WA 99164-2752{changhun,holder,cook}@eecs.wsu.edu
Systems biology has become a major field of post-genomic bioinformaticsresearch. A biological network containing various objects and their relation-ships is a fundamental way to represent a bio-system. A graph consisting ofvertices and edges between these vertices is a natural data structure to rep-resent biological networks. Substructure analysis of metabolic pathways bygraph-based relational learning provides us biologically meaningful substruc-tures for system-level understanding of organisms.
This chapter presents a graph representation of metabolic pathways todescribe all features of metabolic pathways and describes the application ofgraph-based relational learning for structure analysis on metabolic pathwaysin both supervised and unsupervised scenarios. We show that the learnedsubstructures can not only distinguish between two kinds of biological net-works and generate hierarchical clusters for better understanding of them,but also have important biological meaning.
1 Introduction
A biological organism has one ultimate goal: to continue the life of its speciesand itself in the natural environment. This goal requires two important ac-tivities, maintaining low entropy in the environment and reproducing oneself.Biological organisms need to process various functions to maximize free en-ergy and minimize entropy. These two basic processes are preformed by avariety of interactions in an organism.
Fundamentally the organism is a system itself as well as a property of a bio-ecosystem. A biological organism is not just composed of various objects, butalso has dynamic and interactive relationships among them. A system-levelunderstanding is a more efficient way to approach the organisms. With ad-vances in computer science, bioinformatics plays a central role in life science.Traditional bioinformatics has been focused on molecular-level research. Ge-nomics and proteomics, main areas in molecular-level research, have studiedfunction and structure of macromolecules in organisms, and produced a hugeamount of results. However almost every biomolecule plays its role only in
A.S. Sidhu et al. (Eds.): Biomedical Data and Applications, SCI 224, pp. 237–261.springerlink.com c© Springer-Verlag Berlin Heidelberg 2009

238 C.h. You, L.B. Holder, and D.J. Cook
harmony with other components of the cytoplasmic environment. Molecular-level understanding is definitely a fundamental step, but it is not the finalstep. It is time to steer our steps to system-level approaches to bio-systems.
A biological network is a fundamental and indispensable way to describea complex system in terms of both the structure and its dynamics. The fi-nal goal of systems biology is to model and simulate the biological networksfor better understanding of bio-systems and contribution for drug discovery.An efficient way to model unrecognized biological networks is to discoverpatterns in existing biological networks. Biological networks contain variousbiomolecules and their relationships. The patterns of relationships in biolog-ical networks are crucial to understanding organisms and to modeling themat the system-level. Structure analysis of biological networks is a primarymovement in systems biology.
Logic-based and graph-based approaches, as subfields of multi-relationaldata mining, are applied to mine patterns in biological networks. Logic-baseddata mining, also called inductive logic programming, represents networksusing logic [22]. But this approach requires complicated syntax and the defi-nition of prior knowledge. A graph has been widely used to represent a varietyof relational data such as computer networks, social networks, and biologicaldata. A biological network is another appropriate domain to be representedas a graph. Graph-based relational learning can be applied to find the mean-ingful patterns in the biological network that is represented as a graph.
In this paper, we review systems biology and some multi-relational datamining approaches applied to biological networks, and we describe the knowl-edge discovery approach used in the SUBDUE graph-based relational learningsystem. We then show the application of SUBDUE to metabolic pathways,which are downloaded from the KEGG PATHWAY database and representedas a graph. The goal of this research is to show that the learned substructuresdescribe the system-level features in metabolic pathways and convey impor-tant biological meaning. Structure analysis on the same metabolic pathwaysfrom different species finds the substructure showing the unique features forspecific species. Supervised learning shows that the learned substructures canidentify what is unique about a specific type of pathway, which allows us tounderstand better how pathways differ. Unsupervised learning produces hi-erarchical clusters that describe what is common about a specific group ofpathways, which provides us better understanding of common structure inpathways. Ultimately, these substructures can improve both our ability tounderstand recognized pathways and categorize unrecognized ones.
2 Systems Biology and Biological Networks
Systems biology is a novel stream of life science focusing on a compre-hensive bio-system including integrated and interacting biological networkswhich are relations of genes, proteins and other biomolecules [15]. A systemshould be studied in a system-level manner including using comprehensive

Substructure Analysis of Metabolic Pathways 239
Fig. 1. TCA cycle biological network of Homo Sapiens [26]
methodologies, integrating heterogeneous data and understanding interac-tions with other data and various conditions. A system cannot be compre-hended as a part but as a whole system.
Fundamentally an organism is a system itself as well as a property ofa bio-ecosystem. The organism has a systematically well-organized structureconsisting of multi-level compositions such as tissue, organ and organ system,all of which are based on a cell as a functional and structural basic unit.Each constituent is cooperating with others interactively as well as organizedsystematically. Even the basic unit, the cell, is also a system itself. A cellhas a variety of biomolecules that are working with interactive relationshipsamong them.
A huge amount of biological data has been generated by long-term re-search. Each result cannot allow us to understand a whole biological system,because any molecule or constituent in the organism never works alone. Theyalways interact with others in the system. For this reason an organism shouldbe explored as a system.
A biological system can be described as a large biological network, whichconsists of numerous small networks. Each network has various biomoleculesand their relationships. Generally a cellular system is represented by threekinds of biological networks: metabolic pathways, protein-protein interactionsand gene regulatory networks [16]. Our research is currently focused on themetabolic pathways.
240 C.h. You, L.B. Holder, and D.J. Cook
Figure 1 shows a metabolic pathway called the TCA cycle which isa metabolic pathway for the production of ATP (a fundamental energymolecule in a cell). A rectangle represents an enzyme (protein) or a gene,and a circle represents a chemical compound. Each arrow describes a relation-ship between these molecules. In marked area (A), a compound, (S)-Malate(L-Malic acid), as a substrate is changed to another compound, Fumarate,as a product by an enzyme, ec:4.2.1.2. This is a basic biochemical reaction.The metabolic pathway is a complex network of biochemical reactions. Afundamental step to study metabolic pathways is the identification of struc-tures covering a variety of biomolecules and their relationships. Dynamicsand control methods of metabolic pathways are also included, because bi-ological systems are interactive and well-controlled optimized systems [15].Our current research is focused on identifying the structure. Our ultimategoal is to make a blueprint for system-level understanding and its applica-tion based on an understanding of the structure, dynamics and control ofmetabolic pathways.
The KEGG PATHWAY is a widely known database which contains infor-mation on various kinds of pathways including pathway image files (figure 1)[14]. The KEGG PATHWAY database has 84,441 pathways generated from344 reference pathways (on December, 2008). It has six fundamental cat-egories of pathways: Metabolism, Genetic information processing, Environ-mental information processing, Cellular processes and human diseases andDrug development . This database contains not only various informationon pathways, but also plentiful information of their components as linkeddatabases. It also has the KGML (KEGG Markup Language) as an exchangeformat for KEGG pathways, based on XML.
3 Related Work
Biological networks consist of various molecules and their relationships. Eachmolecule can have its own properties and can also influence relationships withother molecules. For this reason, traditional data mining, focusing only onthe properties, is not applicable to biological networks. Multi-relational datamining is focused not only on properties of molecules but also their relation-ships [7]. To apply multi-relational data mining, it is necessary to representthe data along with its multiple relations. First-order logics and graph rep-resentations are used for representation of multi-relational data. These rep-resentation methods lead to two general approaches of multi-relational datamining: logic-based data mining and graph-based data mining.
In this section, we introduce several approaches to analyze biological net-works. Then, we will introduce the multi-relational data mining approach asa method to analyze biological networks including inductive logic program-ming as a logic-based data mining method and two categories of graph-baseddata mining: graph-based relational learning and frequent subgraph mining

Substructure Analysis of Metabolic Pathways 241
[10]. Graph-based relational learning, as our main focus, will be described insection 4.
3.1 Analysis of Biological Networks
Aittokallio and Schwikowski survey recent works of graph-based methods foranalysis of biological networks [1]. They categorize graph-based approachesinto three levels: global structural property, local structural connectivityand hierarchical functional description. They also introduced some recentapproaches including integrating data from multiple source, graph-basedsoftware tools for network analysis and network reconstruction by reverseengineering.
Cheng et al. [3] show an approach of mining bridges and motifs from bio-logical networks. They use a statistical method to detect structural bridgesand motifs, and compare their bridges and motifs with functional units in thebiological networks. They suggest the structures of the discovered bridges andmotifs are significantly related to their function. Hwang et al. [13] introducean approach of detecting novel functional patterns in protein-protein inter-action networks using graph properties and signal transduction behavior.They model the dynamic relationships between two proteins using a sig-nal transduction model to represent functional similarity between proteins.Huan et al. [12] try to discover spatial patterns in protein structures usingthe subgraph mining approach. They use Delaunay tessellation to representthree-dimensional structure of proteins, where Delaunay tessellation is de-fined based on the coordinates of molecules in the proteins. If two Voronoicells share a common face, two points are connected by an edge. In thisway, they represent the protein structure as a graph, and apply the frequentsubgraph mining approach.
Mathematical modeling abstractly describes a system using mathematicalformulae [20, 27]. Most of these approaches, as a type of quantitative analysis,model the kinetics of pathways and analyze the trends in the amounts ofmolecules and the flux of biochemical reactions. But most of them disregardrelations among multiple molecules.
Our research applies graph-based data mining to learn the patterns inthe dynamics of biological networks [29, 30]. We introduce a dynamic graphcontaining a sequence of graphs that represent the time-based versions ofbiological networks to represent the structural changes of biological networks.Our approach first discovers graph rewriting rules between two sequentialgraphs to represent how one network is changed to another, and then discovermore general transformation rules in the set of the graph rewriting rules todescribe how biological networks change over time.
There are many computational approaches to analyze biological networks.Biosystems are organized as networks and perform their function in relationsto molecules and systems. For this reason, we need to focus on the structuralproperties of biological networks rather than the molecules themselves.

242 C.h. You, L.B. Holder, and D.J. Cook
3.2 Logic-Based Data Mining
Logic-based data mining is a multi-relational data mining technique usingfirst order logic to represent data. Inductive Logic Programming (ILP), atypical logic-based data mining technique, is an approach to induce hypothe-ses (rules, concepts, or knowledge) from observations (examples, instances,or experiences) by using logic to represent hypotheses and observations [7].ILP has been applied in several ways to biological domains such as genomicsand proteomics. ILP in company with other approaches has been applied tometabolic pathways.
Support Vector Inductive Logic Programming (SVILP) is the intersectionapproach between Support Vector Machines (SVM) and ILP. By using logicto represent background knowledge, the SVILP technique has been appliedto the prediction of toxicity of given materials [23]. Stochastic methods arealso applied to logic programming to model metabolic pathways. This ap-proach models rates of biochemical reactions using probabilities in additionto representation of metabolic pathways by logic [21]. A last approach isa cooperation between induction and abduction. This approach generateshypotheses from not only abductive reasoning from experimental data (con-centrations of metabolites), but also inductive reasoning from general rules(from the KEGG database) to model inhibition in metabolic pathways [25].An inhibitor is a chemical compound to control biochemical reactions.
Several ILP-related techniques have been successfully applied to metabolicpathways. Logic programming can efficiently represent relational data, butprior rules and examples may be necessary to represent entire pathways.
3.3 Frequent Subgraph Mining
The graph is an abstract data structure consisting of vertices and edges whichare relationships between vertices. Graph-based data mining denotes a col-lection of algorithms for mining the relational aspects of data represented asa graph. Graph-based data mining has two major approaches: frequent sub-graph mining and graph-based relational learning. Frequent subgraph miningis focused on finding frequent subgraphs in a graph. There are two well-knownapproaches to bioinformatics domains. Frequent SubGraph discovery, FSG,finds all connected subgraphs that appear frequently in a set of graphs. FSGstarts by finding all frequent single and double edge graphs. During eachiteration FSG expands the size of frequent subgraphs by adding one edgeto generate candidate subgraphs. Then, it evaluates and prunes discoveredsubgraphs with user-defined constraints [19].
Graph-based Substructure Pattern Mining, gSpan, uses the depth-firstsearch and lexicographic ordering. First gSpan sorts the labels, removes in-frequent vertices and edges, and it relabels the remaining vertices and edges.Next it starts to find all frequent one-edge subgraphs. The labels on theseedges and vertices define a code for each graph. Larger subgraphs map them-selves to longer codes. If the code of B is longer than A, the B code is a

Substructure Analysis of Metabolic Pathways 243
child of the A code in a code tree. If there are two not-unique codes in thetree, one of them is removed during the depth-first search traversal to reducethe cost of matching frequent subgraphs [28]. There are a few approaches offrequent subgraph mining applied to metabolic pathways. Pathway Miner, asimplified graph-mining approach on metabolic pathways, proposes a simpli-fied graph representation consisting of just enzyme relationships. In this way,the approach may avoid the NP-hard subgraph isomorphism problem andfind frequent patterns quickly [17]. However, the over-simplified representa-tion makes this approach focus on just enzyme relationships, missing someimportant features of metabolic pathways.
Mining coherent dense subgraphs uses the correlation of graphs whichrepresent gene regulatory networks [11]. This approach compresses a groupof graphs into two meta-graphs using correlated occurrences of edges forefficient clustering. This approach also loses some biological characteristicsof gene regulatory networks, because its representation of a graph is derivedonly from the similarity of the gene expression patterns between two genes,not representing how the practical biological interactions exist.
4 Graph-Based Relational Learning
Graph-based relational learning is focused on novel and meaningful, but notnecessarily most frequent, substructures in a graph representation of data. Weuse the SUBDUE graph-based relational learning approach to discover pat-terns which not only abstract instances of the patterns by compression, butalso provide better understanding of the data [5]. SUBDUE can perform un-supervised learning and supervised learning by substructure discovery basedon Minimum Description Length (MDL). Using background knowledge givenas predefined substructures can guide graph-based relational learning to findmore meaningful substructures. SUBDUE has been applied to a variety ofareas such as Chemical Toxicity [4], Molecular Biology [24], Security [9] andWeb Search [6].
SUBDUE accepts input data which is represented as a graph with labeledvertices and labeled, directed or undirected edges between vertices. The ob-jects and attribute values of the data are usually represented as vertices, whileattributes and relationships between objects are represented as edges. Figure3 shows a graph representation of a KEGG biological network. There are five‘Entry’ vertices which represents Enzyme or Compound. Each Entry has twoattributes: name and type. Relationships are given as directed and labelededges from Entry to its attributes. More detail on this graph representationwill be provided later.
4.1 Discovery Algorithm
The SUBDUE discovery algorithm is based on a beam search as shown in fig-ure 2. The algorithm starts with three parameters: input graph, beam length

244 C.h. You, L.B. Holder, and D.J. Cook
Subdue(graph G, beam B, limit L)Q = {v | v is a vertex in G with a unique label}bestSub = first substructure in Qrepeat
foreach substructure S ∈ Q doadd Extend(S) into extSubsforeach newSub ∈ extSubs do
Evaluate(newSub)add newSub in Q′ (length < B)
if best Sub ∈ Q′ better than bestSub thenbestSub = best Sub ∈ Q′
Q = Q′
until Q is empty or Num.OfSubs.Extended > Lreturn bestSub
Extend(S): extend Sub. S by one edge in all possible waysEvaluate(S): evaluate Sub. S using MDL
Fig. 2. SUBDUE’s discovery algorithm
and limit value. The beam length limits the length of the queue which con-tains extended substructures, and the limit value restricts the total numberof substructures considered by the algorithm. The initial state of the searchis the set of substructures representing each uniquely labeled vertex and theirinstances. The Extend(S) function extends each instance of a substructure inthe Q in all possible ways by adding a single edge and a vertex, or by addinga single edge if both vertices are already in the substructure. The substruc-tures in the Q′ are ordered base on their ability to compress the input graphas evaluated by Evaluate(S), using the minimum description length (MDL)principle. This search (repeat loop) terminates when the number of substruc-tures considered reaches the limit value, or the algorithm exhausts the searchspace. Then it returns the best substructure.
SUBDUE can be given background knowledge in the form of predefinedsubstructures. SUBDUE finds the instances of these substructures and com-presses them. Using this approach, we can verify whether the patterns learnedfrom a graph belong to another graph.
4.2 MDL and Heuristic Methods
The discovery algorithm of SUBDUE fundamentally is guided by theminimum description length principle. The heuristic evaluation by the MDLprinciple assumes that the best substructure is the one that minimizes thedescription length of the input graph when compressed by the substructure[5]. The description length of the substructure S is represented by DL(S), thedescription length of the input graph is DL(G), and the description length

Substructure Analysis of Metabolic Pathways 245
of the input graph after compression is DL(G|S). SUBDUE’s discovery algo-rithm tries to minimize DL(S) + DL(G|S) which represents the descriptionlength of the graph G given the substructure S. The compression of the graphcan be calculated as
Compression =DL(S) + DL(G|S)
DL(G)
where description length DL() is calculated as the number of bits in aminimal encoding of the graph. Cook and Holder describe the detailed com-putation of DL(G) in [5].
The discovery algorithm of SUBDUE is computationally expensive as othergraph-related algorithms. SUBDUE uses two heuristic constraints to main-tain polynomial running time: Beam and Limit. Beam constrains the numberof substructures by limiting the length of the Q′ in figure 2. Limit is a user-defined bound on the number of substructures considered by the algorithm.
4.3 Unsupervised Learning
Once the best structure is discovered, the graph can be compressed usingthe best substructure. The compression procedure replaces all instances ofthe best substructure in the input graph with a pointer, a single vertex, tothe discovered best substructure. The discovery algorithm can be repeatedon this compressed graph for multiple iterations until the graph cannot becompressed any more or on reaching the user-defined number of iterations.Each iteration generates a node in a hierarchical, conceptual clustering of theinput data. On the ith iteration, the best substructure Si is used to compressthe input graph, introducing a new vertex labeled Si to the next iteration.Consequently, any subsequently discovered subgraph Sj can be defined interms of one or more Si, where i < j. The result is a lattice, where eachcluster can be defined in terms of more than one parent subgraph.
4.4 Supervised Learning
The SUBDUE discovery algorithm has been extended to perform graph-basedrelational concept learning, or supervised learning [8]. The main approach ofsupervised learning is to find a substructure that appears often in the pos-itive examples, but not in the negative examples. The substructure value isincreased when positive examples are covered by the substructure, but is de-creased where negative examples are covered. Positive examples not coveredby the substructure and negative examples covered by the substructure areconsidered errors. The substructure value is calculated by
value = 1 − error
where the error is calculated by

246 C.h. You, L.B. Holder, and D.J. Cook
error =#PosEgsNotCvd + #NegEgsCvd
#PosEgs + #NegEgs
#PosEgsNotCvd is the number of positive examples not containing the sub-structure, and #NegEgsCvd is the number of negative examples containingthe substructure. #PosEgs is the number of positive examples remaining inthe experimental set, of which the positive examples that have already beencovered in a previous iteration were removed, and #NegEgs is the totalnumber of negative examples, which is constant, because negative examplesare not removed.
SUBDUE’s supervised learning uses two approaches to minimize error.First, by using the definition of description length SUBDUE tries to finda substructure S minimizing DL(G+|S) + DL(S) + DL(G−) − DL(G−|S),where the last two terms represent the incorrectly compressed negative ex-ample graph. This approach will lead the discovery algorithm toward a largersubstructure that characterizes the positive examples, but not the negativeexamples.
In addition to the compression-based evaluation, SUBDUE can use a set-cover approach based on the error measure. At each iteration SUBDUE addsa new substructure to the disjunctive hypothesis and removes covered positiveexamples. This process continues until either all positive examples are coveredor no substructure exists discriminating the remain positive examples fromthe negative examples.
5 Substructure Analysis in Metabolic Pathways
Our goal is the application of the SUBDUE graph-based relational learningsystem to the KEGG metabolic pathways to find better understanding andbiologically meaningful substructures. These substructures can distinguishtwo pathways or provide the common features in several pathways. Researchshows that topological features of biological networks are closely related tobiological functions [13, 2].
A simple way to apply supervised or unsupervised learning to the pathwaysis based on molecules, such as genes, proteins and other macro molecules.Because each molecule has a specific structure and other biochemical fea-tures, we can easily distinguish two groups or find the common features ina group. But our research is focused on the pattern of the relationship be-tween molecules for system-level understanding of pathways. The pattern ofrelationship can be shown in a variety of forms, such as biochemical reaction,enzyme activity and signal transduction.
This section first introduces our graph representation (section 5.1). As apreliminary task, we describe substructure analysis on individual metabolicpathways (section 5.2). Then we represent our main experiments in this re-search: supervised learning (section 5.3) and unsupervised learning (section5.4) on groups of metabolic pathways. The ultimate goal of our exploration

Substructure Analysis of Metabolic Pathways 247
is to show that the substructures found by graph-based relational learningare biologically important and meaningful.
5.1 Graph Representation
Input graphs for SUBDUE are converted from KGML files. KGML is a stan-dard data format to express and distribute a biological network from KEGG.There are three major entities in KGML: Entry, Relation and Reaction. Entryrepresents various biomolecules in the metabolic pathway, such as enzyme,gene, compound and so on. Relation denotes a relationship between two ormore enzymes, genes and maps. The maps denote the types of the Entrynodes linked to the other pathways [26]. The names of these Entry nodesrepresent the name of the linked pathways. Reaction is a biochemical reac-tion between two or more compounds catalyzed by one or more enzymes.Detailed information on KGML is described in [26]. In biochemical seman-tics, Entries are nodes of metabolic pathways, and Relations and Reactionsare relationships between two or more Entries.
entry
enzyme ec:1.4.1.5
entry
enzyme ec:1.4.1.3relation
GErel
entry
compound cpd:06563
entry
compound cpd:06560
entry
compound cpd:06562
reaction
reversible
Rn:R05573
reaction
reversible
Rn:R05575
valueE_to_Rct
Rct_to_Pname
typeS_to_Rct
Rct_to_P
E_to_RelRel_to_E
typenamenametype
S_to_Rct
name
type
E_to_Rct
typename
nametypetypesubtype
nametype
compound
Fig. 3. A graph representation of a metabolic pathway
In our graph representation, Relations and Reactions are also representedas vertices in order to describe the properties of Relations and Reactions.Vertices representing major entities have two satellite vertices which are con-nected to their main vertex by edges, labeled as Name and Type, to explainits property. A name vertex linked by the Name edge denotes the KEGG ID,and a type vertex linked by the Type edge describes the property of the entityvertex. A Relation represents the association between two or more Entries(genes or enzymes) by an edge whose label represents a direction from one

248 C.h. You, L.B. Holder, and D.J. Cook
Entry to another. Reaction also has connections with two compounds (de-scribed as a substrate and a product) and an enzyme (as a catalyst). Figure3 shows an example of our graph representation, which has five Entries: threecompounds and two enzymes. There is also a Relation between two enzymes,and two Reactions sharing a compound and having relationships with twoother compounds.
Our research uses two kinds of graph representation: named and unnamedgraph. The graph in figure 3 is the named graph, which includes the KEGGIDs. The unnamed graph is the same graph only excluding any unique IDsof each Entry and Reaction; all vertices and edges regarding “name” areremoved from the graph in figure 3.
Unique IDs can pose potential problems when SUBDUE searches for sub-structures that distinguish two groups of graphs, which contain a group ofpathways as positive examples and another group of pathways as negativeexamples. For example, when we try to distinguish two metabolic pathwaysG1 and G2, an enzyme which exists only in G1, but not in G2, is sufficientto distinguish. Because our research is focused on the pattern of metabolicpathways, a specific name is not useful for finding the pattern. For this rea-son, our supervised (section 5.3) and unsupervised (section 5.4) learning ongroups of pathways use the unnamed graphs (the first phase). The namedgraphs are used at the second phase to verify the biological meaning of thepatterns. The following sections describe this process in more detail.
5.2 Substructure in Metabolic Pathway
This section shows a brief example substructure analysis on metabolic path-ways. Here we have two metabolic pathways. SUBDUE tries to find the sub-structures that exist in one pathway, but not in another. In this experiment,we show that the species-specificity is related to the structure of metabolicpathways. Species-specificity is one of the most important concepts in biol-ogy. Basically species-specificity is derived from protein structure and genesequence.
We arrange two glycolysis pathways from Human and E.coli : hsa00010 andeco00010. Glycolysis is a representative energy generating process in almostevery cell. We seek a slightly structural difference between these pathwaysfrom two species. A named graph of hsa00010 has 1047 vertices and 1208edges, and the one of eco00010 has 1002 vertices and 1132 edges. The formeris a positive example and the latter is a negative example for supervisedlearning of SUBDUE. Then we run SUBUDE to find substructures that existin hsa00010, but not in eco00010.
As a result, the best substructure is found as shown in figure 4. While thissubstructure is discovered in eco00010 as well as hsa00010, it is still possibleto show how the two pathways differ. The instances of the best substructurein figure 4 are found 10 times in hsa00010 and 6 times in eco00010. After

Substructure Analysis of Metabolic Pathways 249
entry
gene
entry
entry
compound
relation
compound
relation
compound
relation
ECrel compound
reaction
reversible
type
type
E_to_Rel
subtype
E_to_Rel
Rel_to_E
subtype
type
Rel_to_E
subtype link
type
E_to_Rct Rct_to_P
Fig. 4. An instance of the best substructure found in hsa00010
inspecting locations of these instances on each pathway, we can identify struc-tural differences between two pathways.
Five cases out of 10 instances in hsa00010 are also found in eco00010. Theother five instances are found only in hsa00010. These five instances showunique parts exist only in hsa00010. Figure 5 shows an example of one ofthese five instances. Figure 5 (A) and (B) show the part of the glycolysispathways in human and E.coli respectively. Connected circled entities de-note the instance of the best substructure. The marked instance includes areaction (R00710) catalyzed by an enzyme (ec:1.2.1.5) and three relationsrelated with the enzyme. The reaction R00710 exists only in hsa00010, butnot in eco00010. We can confirm this concept in figure 5. Rectangles and cir-cles denote enzymes and compounds. There is no symbol of relation in thisfigure. Grayed rectangles represent existing enzymes in the species and whiterectangles denote only conceptual views (practically do not exist). As shownin this figure eco00010 does not include ec:1.2.1.5 and ec.1.1.1.2, which existin hsa00010. The process of Acetaldehyde (NAD+ oxidoreductase) does notexist in eco00010. SUBDUE discovers this substructure existing in hsa00010,but not in eco00010. In this way structure analysis by SUBDUE can charac-terize the unique features of metabolic pathways.
We execute the same method on other experiment sets: 00020 (TCA cycle),00051 (Fructose and mannose metabolism), 00061 (Fatty acid biosynthesis)and 00272 (Cysteine metabolism) from human and E.coli. The results areshown in table 1. The first column shows the name of the pathway. Thesecond column shows the number of instances of the best substructure foundin hsa pathways, and the third column shows the number of instances of thebest substructure found in eco pathways.
The best substructure of the 00020 experiment is found in both pathwaysas in the 00010 experiment. But in the other three experiments the best sub-structures are found only in the hsa pathway. The best substructure existingonly in one pathway precisely shows the unique features of the pathway. In

250 C.h. You, L.B. Holder, and D.J. Cook
Fig. 5. Part of Glycolysis pathways in human (A) and E.Coli (B) [26]. Connectedthree circled entities represents an instance of the best substructure in figure 4.
Table 1. Results of structure analysis on pathways
Pathway Number of instance in hsa Number of instances in eco
00010 10 600020 66 4700051 6 000061 171 000272 3 0
the case of the best substructure existing in both pathways, the number orthe location of the instances can also indicate distinguishing features of thepathways: how many instances are in the pathway or what process is included
Substructure Analysis of Metabolic Pathways 251
into the pathway. In this way substructure analysis allows us to reveal thesystem-level features of metabolic pathways.
5.3 Supervised Learning in Metabolic Pathways
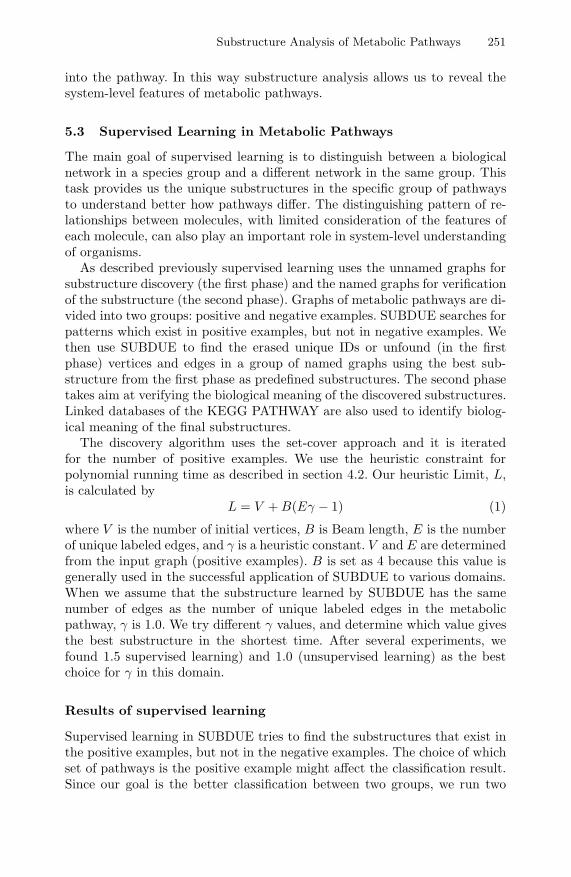
The main goal of supervised learning is to distinguish between a biologicalnetwork in a species group and a different network in the same group. Thistask provides us the unique substructures in the specific group of pathwaysto understand better how pathways differ. The distinguishing pattern of re-lationships between molecules, with limited consideration of the features ofeach molecule, can also play an important role in system-level understandingof organisms.
As described previously supervised learning uses the unnamed graphs forsubstructure discovery (the first phase) and the named graphs for verificationof the substructure (the second phase). Graphs of metabolic pathways are di-vided into two groups: positive and negative examples. SUBDUE searches forpatterns which exist in positive examples, but not in negative examples. Wethen use SUBDUE to find the erased unique IDs or unfound (in the firstphase) vertices and edges in a group of named graphs using the best sub-structure from the first phase as predefined substructures. The second phasetakes aim at verifying the biological meaning of the discovered substructures.Linked databases of the KEGG PATHWAY are also used to identify biolog-ical meaning of the final substructures.
The discovery algorithm uses the set-cover approach and it is iteratedfor the number of positive examples. We use the heuristic constraint forpolynomial running time as described in section 4.2. Our heuristic Limit, L,is calculated by
L = V + B(Eγ − 1) (1)
where V is the number of initial vertices, B is Beam length, E is the numberof unique labeled edges, and γ is a heuristic constant. V and E are determinedfrom the input graph (positive examples). B is set as 4 because this value isgenerally used in the successful application of SUBDUE to various domains.When we assume that the substructure learned by SUBDUE has the samenumber of edges as the number of unique labeled edges in the metabolicpathway, γ is 1.0. We try different γ values, and determine which value givesthe best substructure in the shortest time. After several experiments, wefound 1.5 supervised learning) and 1.0 (unsupervised learning) as the bestchoice for γ in this domain.
Results of supervised learning
Supervised learning in SUBDUE tries to find the substructures that exist inthe positive examples, but not in the negative examples. The choice of whichset of pathways is the positive example might affect the classification result.Since our goal is the better classification between two groups, we run two

252 C.h. You, L.B. Holder, and D.J. Cook
cases. First (A+), we make a positive example set and a negative exampleset. The second (B+) is vice versa. We present the classification accuracyand running time for both in each experimental set. Assuming that we runtwo cases in parallel, the maximum accuracy expresses the best case of theclassification and the maximum running time represents the worst case of therunning time.
Table 2. Results of supervised learning
Set Ex. Size Time Acc. Time Acc. Time Acc.(A B:src) (A / B) (V+E) A+(s) A+(%) B+(s) B+(%) Max(s) Max(%)
00300 00310:euk 9/16 14,715 1.26 44.00 1.17 64.00 1.26 64.0000520 00530:euk 14/17 15,689 2.19 83.87 1.44 67.74 2.19 83.8700010 00900:euk 17/16 38,804 79.00 100.00 8.84 100.00 79.00 100.0000010 00061:euk 17/15 56,914 27.72 100.00 54.12 100.00 54.12 100.0000230 00240:euk 17/17 75,086 49.38 100.00 111.31 55.88 111.31 100.0000010 00230:euk 17/17 75,786 57.62 100.00 50.79 94.12 57.62 100.0000300 00310:45 33/42 41,569 11.22 44.00 18.50 56.00 18.50 56.0000520 00530:45 39/40 42,092 17.48 64.56 18.71 54.43 18.71 64.5600010 00510:45 44/31 82,767 129.71 100.00 337.25 44.00 337.25 100.0000010 00900:45 44/41 88,041 109.42 100.00 130.19 100.00 130.19 100.0000010 00020:45 44/39 110,701 302.62 63.86 876.96 50.60 876.96 63.8600251 00252:45 45/45 116,621 354.47 61.11 226.82 53.33 354.47 61.1100010 00061:45 44/39 117,582 247.18 100.00 305.51 46.99 305.51 100.0000010 00251:45 44/45 129,187 410.27 94.38 503.64 61.80 503.64 94.3800010 00230:45 44/45 179,393 1322.95 76.40 650.40 91.01 1322.95 91.0100230 00240:45 45/45 183,701 368.12 100.00 2349.60 60.00 2349.60 100.0000520 00530:150 137/136 150,363 874.79 53.85 1236.14 53.41 1236.14 53.8500300 00310:150 136/143 157,267 441.32 48.75 587.7 53.41 587.7 53.4100010 00900:150 149/143 286,091 1610.45 95.21 1117.41 100.00 1610.45 100.0000010 00061:150 149/140 371,032 3107.66 100.00 4013.80 48.44 4013.80 100.00
Table 2 shows the experimental sets and the results for supervised learn-ing. The first column shows the name of the set which consists of three parts:A, B and source group. A and B represent two groups of pathways [26], andthe source group represents the species set. The Eukaryote set consists ofall eukaryote species (17) in the KEGG PATHWAY database. The 45 sethas 45 species, and the 150 set has 150 species. The second column providesthe number of pathways in each group. This number is less than or equalto the number of each source set, since the metabolic pathway may not yetbe constructed (or not presented) in the specific species. For example all 17species of the eukaryote cell have the 00010 network. But, Encephalitozooncuniculi (fungi) and Danio rerio (Zebra fish) do not have the 00061 network.The third column shows the total size of the graphs, which is calculated assize(G) = |V | + |E|, where a graph G = (V, E), V is the set of verticesand E is the set of edges. The 4th and the 6th columns show the running
Substructure Analysis of Metabolic Pathways 253
0 100000 200000 300000 4000000
500
1000
1500
2000
2500
3000
3500
4000
4500
Size
Ru
nn
ing
Tim
e
MaxRun
A+
B+
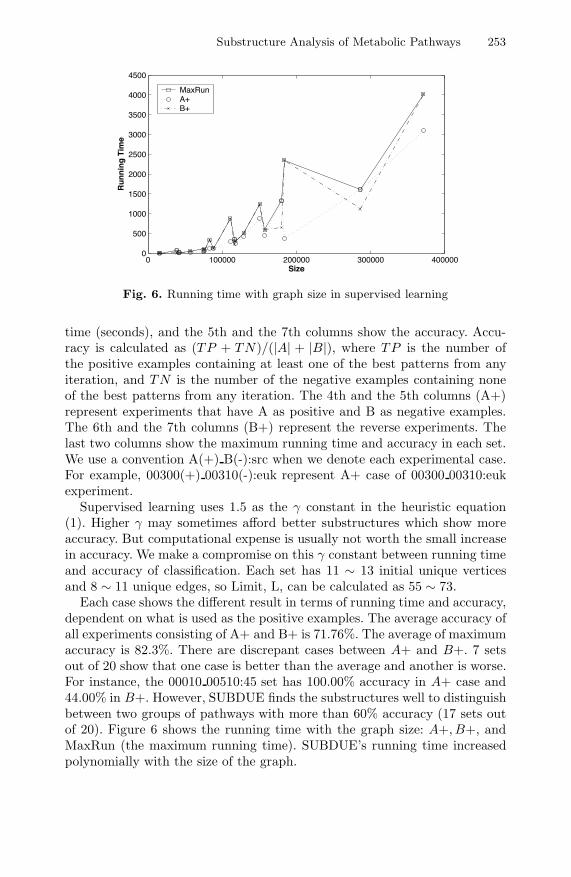
Fig. 6. Running time with graph size in supervised learning
time (seconds), and the 5th and the 7th columns show the accuracy. Accu-racy is calculated as (TP + TN)/(|A| + |B|), where TP is the number ofthe positive examples containing at least one of the best patterns from anyiteration, and TN is the number of the negative examples containing noneof the best patterns from any iteration. The 4th and the 5th columns (A+)represent experiments that have A as positive and B as negative examples.The 6th and the 7th columns (B+) represent the reverse experiments. Thelast two columns show the maximum running time and accuracy in each set.We use a convention A(+) B(-):src when we denote each experimental case.For example, 00300(+) 00310(-):euk represent A+ case of 00300 00310:eukexperiment.
Supervised learning uses 1.5 as the γ constant in the heuristic equation(1). Higher γ may sometimes afford better substructures which show moreaccuracy. But computational expense is usually not worth the small increasein accuracy. We make a compromise on this γ constant between running timeand accuracy of classification. Each set has 11 ∼ 13 initial unique verticesand 8 ∼ 11 unique edges, so Limit, L, can be calculated as 55 ∼ 73.
Each case shows the different result in terms of running time and accuracy,dependent on what is used as the positive examples. The average accuracy ofall experiments consisting of A+ and B+ is 71.76%. The average of maximumaccuracy is 82.3%. There are discrepant cases between A+ and B+. 7 setsout of 20 show that one case is better than the average and another is worse.For instance, the 00010 00510:45 set has 100.00% accuracy in A+ case and44.00% in B+. However, SUBDUE finds the substructures well to distinguishbetween two groups of pathways with more than 60% accuracy (17 sets outof 20). Figure 6 shows the running time with the graph size: A+, B+, andMaxRun (the maximum running time). SUBDUE’s running time increasedpolynomially with the size of the graph.

254 C.h. You, L.B. Holder, and D.J. Cook
Verification of the substructures
The goal of supervised learning is to find the patterns which are not onlyable to distinguish between two sets of examples, but are also biologicallymeaningful. The pattern found by SUBDUE can differentiate well betweentwo examples. We verify biological meaning of these patterns by using thelinked database of KEGG PATHWAY [26]. Figure 7 shows the best substruc-ture, which is found in 40 instances of 40 examples in the first iteration of the00010(+) 00900(-):45 experiment. This substructure which covers 90.9% ofthe positive examples (40 out of 44) is related to two reactions. Because theedge E to Rct represents a relationship between reaction and enzyme (gene),the entry should be the enzyme or the gene.
entryreaction reactionE_to_RctE_to_Rct
Fig. 7. First best pattern from supervised learning on 00010(+) 00900(-):45 set
[entry]
aae:aq_1065 gene
entry
cpd:C00118 compound
entry
cpd:C00236compound
[reaction]rn:R01061
reversible
[reaction]rn:R01063
reversible
name type
name type name type
name
type
[E_to_Rct]S_to_Rct
Rct_to_P
name
type[E_to_Rct]
S_to_Rct
Rct_to_P
Fig. 8. Updated best pattern from supervised learning on 00010(+) 00900(-):45 set
In the second phase (verification phase) SUBDUE runs on the named graphof the same example set 00010(+) 00900(-):45 with the first best pattern(figure 7) as the predefined substructure. SUBDUE can find clearly all fortyinstances in the named graph. The second phase adds more vertices and edgeswhich are erased in the unnamed graph or are not found at the first phase.The substructure in figure 8, which is the updated pattern from the result ofthe first phase, is the final result of this experiment. The vertices and edgesmarked by “[ ]” are included from the original substructure learned in the firstphase. With this completed substructure, we can refer to linked databases inthe KEGG PATHWAY database.
SUBDUE supervised learning finds the substructure representing that anenzyme catalyzing two reactions, which share the same substrate and prod-uct. Generally an enzyme catalyzes a reaction, but some enzymes can berelated to two or more reactions. Figure 8 shows two reaction vertices areconnected to an entry (enzyme) vertex by two E to Rct edges, which denote
Substructure Analysis of Metabolic Pathways 255
links between an enzymes and a reaction. The two reactions include a sharedsubstrate (linked by a S to Rct edge) and product (linked by a Rct to Pedge). The S to Rct edge denotes a link from a substrate to a reaction, andthe Rct to P edge represents a link from a reaction to a product. SUBDUEfinds that this substructure exists only in 00010 examples, not in 00090 ex-amples.
In this substructure aae:aq 1065 which is the gene name, represents the en-zyme ec:1.2.1.12 (glyceraldehyde-3-phosphate dehydrogenase). This enzymecatalyzes two reactions, R01061 and R01063, which are oxidoreductase re-actions of NAD+ and NADP+ [26]. NAD+ and NADP+ are coenzymesthat function as carriers of hydrogen atoms and electrons in some oxidation-reduction reactions, especially ATP (Adenosine TriPhosphate: energy mate-rial) related reactions. In our experiment the learned substructure is foundonly in the positive examples (Glycolysis), not in the negative examples(Terpenoid biosynthesis). Glycolysis is an energy generating process whichdegrades a molecule of glucose in a series of enzyme-catalyzed reactions toyield two molecules of the Pyruvates and ATPs. The conclusion of verifica-tion shows that the substructure found by SUBDUE can distinguish betweentwo metabolic pathways and has an understandable biological meaning.
Two different metabolic pathways have unique relations as well as uniquebiochemical molecules. This research is focused on the unique relations. Incase of 00010(+) 00900(-):45, an enzyme has relations with two reactions atthe same time. The enzyme has an important feature called substrate speci-ficity, which indicates that an enzyme can be active only when binding witha specific compound. For this reason, the enzyme, ec:1.2.1.12, catalyzes tworeactions which have a common relation with the compound, cpd:C00118.In addition that identification of the unique biomolecules in each biologi-cal network is a fundamental step, but discovery of the unique relations isalso important to classify metabolic pathways. The pattern of relations inthe metabolic pathway can be a guide to model an unrecognized metabolicpathway.
5.4 Unsupervised Learning in Metabolic Pathways
Unsupervised learning tries to find common substructures in a set of dif-ferent pathways of one species. The ultimate purpose of applying unsuper-vised learning to metabolic pathways is to provide a better understandableblueprint of metabolic pathways by using hierarchical topologies. This ex-periment allows us to understand what common structures the different net-works have. The common patterns of relationships in metabolic pathwayscan contribute to biological network research accompanied with traditionalbioinformatics.
Like supervised learning, unsupervised learning also employs the unnamedgraphs in the first phase and the named graphs in the second phase. In thefirst phase SUBDUE discovers the substructures and generates hierarchical

256 C.h. You, L.B. Holder, and D.J. Cook
Table 3. Results of unsupervised learning
Set Number of examples Size Running time(Species) (Number) (V+E) (sec.)
ath 100 68,585 267.81dme 92 58,166 204.52eco 102 78,252 418.42rno 96 61,409 183.60sce 86 63,078 249.69
mmu 106 81,634 556.81hsa 110 90,157 598.99
clusters using iterative discovery. Then SUBDUE adds eliminated uniqueIDs or unfound vertices and edges from the first phase. This process usesthe substructures discovered from the first phase as predefined substructuresin the second phase. The second phase also tries to verify the biologicalmeaning of the discovered substructures by referring to the linked databasesof the KEGG PATHWAY, which are used to identify biological meaning ofthe final substructures. The same heuristic equation (1) is used to computethe limit, L, as in supervised learning.
55000 65000 75000 85000 950000
100
200
300
400
500
600
700
800
Size
Ru
nn
ing
Tim
e
Fig. 9. Running time with graph size
Results of unsupervised learning
Table 3 shows the experimental sets used in unsupervised learning. Set rep-resents the name of the species [26]. The number of examples denotes thenumber of metabolic pathways which the species has in the KEGG PATH-WAY database. The 110 metabolic pathways in hsa (Homo Sapiens) is thelargest number in the KEGG, when we include just metabolic pathways, notregulatory networks. Other species have fewer metabolic pathways, because
Substructure Analysis of Metabolic Pathways 257
they do not exist or are yet to beconstructed. Size is the size of the graph asdescribed above. The last column shows the running time. Each run iterates10 times to construct hierarchical clusters. Unlike supervised learning, thisexperiment uses MDL as the evaluation method. Unsupervised learning uses1.0 as the γ constant in the heuristic equation (1). Each set has 14 ∼ 16initial unique labeled vertices and 8 ∼ 11 unique labeled edges. Limit, L, iscalculated as 42 ∼ 54. SUBDUE runs in polynomial time with the size of thegraph as shown in figure 9.
Verification of the substructures
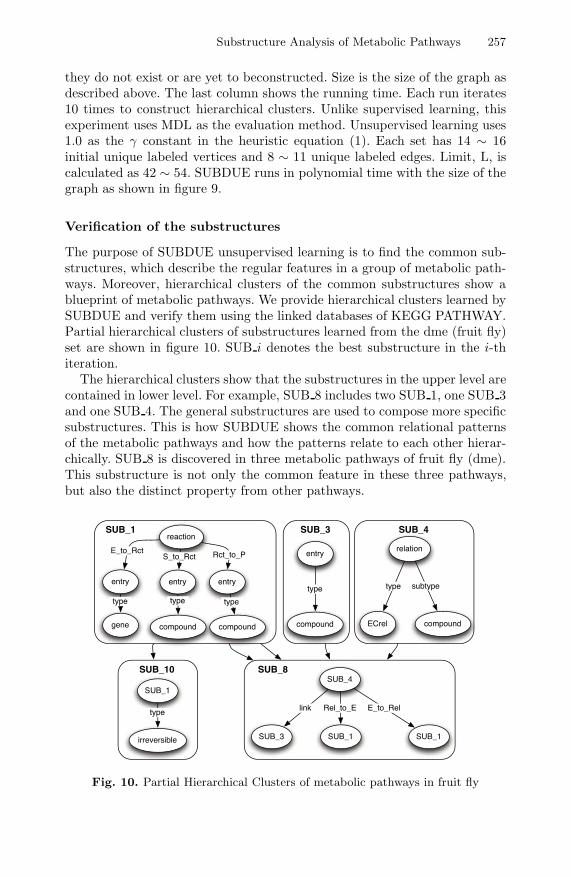
The purpose of SUBDUE unsupervised learning is to find the common sub-structures, which describe the regular features in a group of metabolic path-ways. Moreover, hierarchical clusters of the common substructures show ablueprint of metabolic pathways. We provide hierarchical clusters learned bySUBDUE and verify them using the linked databases of KEGG PATHWAY.Partial hierarchical clusters of substructures learned from the dme (fruit fly)set are shown in figure 10. SUB i denotes the best substructure in the i-thiteration.
The hierarchical clusters show that the substructures in the upper level arecontained in lower level. For example, SUB 8 includes two SUB 1, one SUB 3and one SUB 4. The general substructures are used to compose more specificsubstructures. This is how SUBDUE shows the common relational patternsof the metabolic pathways and how the patterns relate to each other hierar-chically. SUB 8 is discovered in three metabolic pathways of fruit fly (dme).This substructure is not only the common feature in these three pathways,but also the distinct property from other pathways.
SUB_1
compound
entry
compound
entry
reaction
gene
entry
SUB_4
compoundECrel
relation
SUB_3
compound
entry
SUB_4
SUB_3 SUB_1 SUB_1
SUB_8
SUB_1
irreversible
SUB_10
typeE_to_RelRel_to_Elink
typetype
S_to_Rct
type
subtypetypetype
Rct_to_PE_to_Rct
Fig. 10. Partial Hierarchical Clusters of metabolic pathways in fruit fly

258 C.h. You, L.B. Holder, and D.J. Cook
[entry]
dme:CG5288-PA
[gene]
[entry]dme:CG9092-PA
[gene]
[entry]
cpd:C00124 [compound]
[entry]
cpd:C00446 [compound]
[entry]
[cpd:C05796] [compound]
[relation]
[ECrel][compound]
[reaction]
rn:R01092reversible
[reaction]
rn:R01105irreversible
name
type
name
type
name type name typename type
[type]
[E_to_Rel][Rel_to_E]
[subtype]
[link]
nametype
[E_to_Rct]
[S_to_Rct] [Rct_to_P]nametype
[E_to_Rct]
[S_to_Rct] [Rct_to_P]
Fig. 11. Updated eighth substructure from figure 10
SUB 1 shows a basic reaction that is found in 972 instances of 90 exam-ples. SUB 3 is found in 3,659 instances of 47 examples at the third iteration.SUB 4, found in 1,136 instances of 21 examples, represents a relation with theECrel property. The ECrel relation is an enzyme-enzyme relation where twoenzymes catalyze successive reaction steps [26]. SUB 8 discovered in 264 in-stances of 3 examples includes one relation of two enzymes which catalyze twosuccessive reactions. Moreover, SUB 8 has an additional meaning to SUB 4such that the “link” edge connects to a compound which is a product of thefirst reaction of this relation and a substrate of the second reaction at thesame time [26].
SUB 8 includes an enzyme-enzyme relation which relates three consecutivechemical compounds. Figure 11 shows an example of SUB 8 which is foundin the dme00052, Galactose metabolic pathway of the fruit fly. Figure 11 isa fully updated substructure thorough the second phase. Like the previouscase, the nodes and edges checked with “[ ]” are found in the first phase;others were added in the second phase. This substructure shows a relationbetween two enzymes which shares a compound as a substrate by one anda product by another. The enzyme-enzyme relation has a relationship withtwo reactions: R01092 and R01105 [26]. R01092 is catalyzed by the enzymeof the gene, dme:CG5288-PA, and R01105 is catalyzed by the enzyme of thegene, dme:CG9092-PA. The substrate of R01092 is the C05796 compound(Galactin). The product of this reaction is C00124 (D-Galactose), which isalso the substrate of R01092. R01092 produces C00446 (alpha-D-Galactose 1-phosphate) as the product compound. The relation in this substructure has thelink as a pointer to C00124 because this compound is the shared metabolite intwo reactions catalyzed by two enzymes connected within this relation.
SUB 1 and SUB 4 are found in all experimental sets (species), and SUB 8is commonly found in ath, dme, eco and sce. A hierarchical clusteringpresents the common relations, which shows how biological molecules workinteractively with others in the different species. This provides system-levelunderstanding of metabolic pathways.

Substructure Analysis of Metabolic Pathways 259
6 Conclusion
Systems biology views an organism as a system. System-level understand-ing indispensably involves integrating heterogeneous data and a variety ofrelations among the entities. The biological network is a crucial way to de-scribe the biological system. Biological networks include various biomoleculesand assorted relationships among molecules. Structure analysis of metabolicpathways allows us to understand how biomolecules interact with others. Theresearch on the relations can play a contributive role in systems biology.
This research shows several methods of structure analysis on metabolicpathways. Substructure discovery on the same metabolic pathways from twospecies reveals the unique features of the pathways related to the species.Even in the cases that SUBDUE cannot find a unique substructure distin-guishing two pathways, the number or the location of the instances of thesubstructure is able to distinguish them; how many specific relations or whatspecific relations are included into the pathway. Supervised learning showsthe substructures that can identify what is unique about a specific type ofpathway, which allows us to understand better how pathways differ. Unsu-pervised learning generates hierarchical clusters that reveal what is commonabout a specific type of pathways, which provides us better understanding ofthe common structure in pathways.
Moreover, our results show that the substructures discovered by SUBDUEhave understandable biological meaning. These substructures, when consid-ered as building blocks, can be used to construct new metabolic pathways.Ultimately, we can consider these substructures as guides to define a graphgrammar for metabolic pathways that would improve both our ability to gen-erate new networks and our comprehension of pathways [18]. These buildingblocks of metabolic pathways open our sights to an advanced application:drug discovery. The substructure of metabolic pathways learned by SUBDUEallows us to identify the target place of the drug in pathways. In addition agraph grammar of relational patterns on metabolic pathways can guide us tosimulate the drug interaction on pathways.
Our future works include graph-based relational learning on graphs repre-senting dynamics of biological networks and association with other method-ologies for efficient learning on biological networks.
References
1. Aittokallio, T., Schwikowski, B.: Graph-based methods for analysing networksin cell biology. Briefings in Bioinformatics 7(3), 243–255 (2006)
2. Bu, D., Zhao, Y., Cai, L., et al.: Topological structure analysis of the protein-protein interaction network in budding yeast. Nucleic Acids Research 31, 2443–2450 (2003)

260 C.h. You, L.B. Holder, and D.J. Cook
3. Cheng, C.Y., Huang, C.Y., Sun, C.T.: Mining bridge and brick motifs fromcomplex biological networks for functionally and statistically significant dis-covery. IEEE Transactions on Systems, Man, and Cybernetics, Part B 38(1),17–24 (2008)
4. Chittimoori, R., Holder, L., Cook, D.: Applying the subdue substructure dis-covery system to the chemical toxicity domain. In: Proceedings of the FloridaAI Research Symposium, pp. 90–94 (1999)
5. Cook, D., Holder, L.: Substructure discovery using minimum description lengthand background knowledge. Journal of Artificial Intelligence Research 1, 231–255 (1994)
6. Cook, D., Manocha, N., Holder, L.: Using a graph-based data mining system toperform web search. International Journal of Pattern Recognition and ArtificialIntelligence 17(5) (2003)
7. Dzerosk, S.: Multi-relational data mining: an introduction. SIGKDD Explo-rations Newsletter 5(1), 1–16 (2003)
8. Gonzalez, J., Holder, L., Cook, D.: Graph-based relational concept learning. In:Proceedings of the International Conference on Machine Learning, pp. 219–226(2002)
9. Holder, L., Cook, D., Coble, J., Mukherjee, M.: Graph-based relational learningwith application to security. Fundamenta Informaticae Special Issue on MiningGraphs, Trees and Sequences 6, 83–101 (2005)
10. Holder, L., Cook, D., Gonzalez, J., Jonyer, I.: Structural Pattern Recognition inGraphs. In: Pattern Recognition and String Matching, pp. 255–280. Springer,Heidelberg (2003)
11. Hu, H., Yan, X., Huang, Y., Han, J., Zhou, X.J.: Mining coherent dense sub-graphs across massive biological networks for functional discovery. Bioinformat-ics 21(1), 213–221 (2005)
12. Huan, J., Wang, W., Bandyopadhyay, D., Snoeyink, J., Prins, J., Tropsha, A.:Mining protein family specific residue packing patterns from protein structuregraphs. In: Eighth Annual International Conference on Research in Computa-tional Molecular Biology (RECOMB), pp. 308–315 (2004)
13. Hwang, W., Cho, Y.R., Zhang, A., Ramanathan, M.: A novel functional moduledetection algorithm for protein-protein interaction networks. Algorithms forMolecular Biology 1 (2006)
14. Kanehisa, M., Goto, S., Kawashima, S., Okuno, U., Hattori, M.: KEGG re-source for deciphering the genome. Nucleic Acids Research 32, 277–280 (2004)
15. Kitano, H.: Systems biology: A brief overview. Science 295, 1662–1664 (2002)16. Klipp, E., Herwig, R., Kowald, A., Wierling, C., Lehrach, H.: Systems Biology
in Practice: Concepts, Implementation and Application, 1st edn. WILEY-VCH,Weinheim (2005)
17. Koyuturk, M., Grama, A., Szpankowski, W.: An efficient algorithm for detect-ing frequent subgraphs in biological networks. In: Proceedings of the Interna-tional Conference on Intelligent Systems for Molecular Biology, vol. 20, pp.200–207 (2004)
18. Kukluk, J., You, C., Holder, L., Cook, D.: Learning node replacement graphgrammars in metabolic pathways. In: Proceedings of International Conferenceon Bioinformatics and Computational Biology, BIOCOMP 2007 (2007)
19. Kuramochi, M., Karypis, G.: Frequent subgraph discovery. In: Proceedings ofthe IEEE Conference on Data Mining, pp. 313–320 (2001)

Substructure Analysis of Metabolic Pathways 261
20. Laub, M., Loomis, W.: A molecular network that produces spontaneous os-cillations in excitable cells of dictyostelium. Mol. Biol. Cell 9(12), 3521–3532(1998)
21. Lodhi, H., Muggleton, S.H.: Modelling metabolic pathways using stochasticlogic programs-based ensemble methods. In: Danos, V., Schachter, V. (eds.)CMSB 2004. LNCS (LNBI), vol. 3082, pp. 119–133. Springer, Heidelberg (2005)
22. Muggleton, S.: Inductive logic programming. New Generation Computing 8,295–318 (1991)
23. Muggleton, S.H., Lodhi, H., Amini, A., Sternberg, M.J.E.: Support Vector In-ductive Logic Programming. In: Hoffmann, A., Motoda, H., Scheffer, T. (eds.)DS 2005. LNCS, vol. 3735, pp. 163–175. Springer, Heidelberg (2005)
24. Su, S., Cook, D., Holder, L.: Application of knowledge discovery to molecularbiology: Identifying structural regularities in proteins. In: Proceedings of thePacific Symposium on Biocomputing, vol. 4, pp. 190–201 (1999)
25. Tamaddoni-Nezhad, A., Kakas, A., Muggleton, S., Pazos, F.: Modelling inhi-bition in metabolic pathways through abduction and induction. In: Camacho,R., King, R., Srinivasan, A. (eds.) ILP 2004. LNCS, vol. 3194, pp. 305–322.Springer, Heidelberg (2004)
26. KEGG, http://www.genome.jp27. Wolf, J., Sohn, H., Heinrich, R., Kuriyama, H.: Mathematical analysis of a
mechanism for autonomous metabolic oscillations in continuous culture of sac-charomyces cerevisiae. FEBS Lett. 499(3), 230–234 (2001)
28. Yan, X., Han, J.: Gspan: Graph-based substructure pattern mining. In: Pro-ceedings of the IEEE Conference on Data Mining, pp. 721–724 (2002)
29. You, C., Holder, L., Cook, D.: Graph-based data mining in dynamic net-works: Empirical comparison of compression-based and frequency-based sub-graph mining. In: IEEE International Conference on Data Mining (ICDM)Workshop on Analysis of Dynamic Networks (2008)
30. You, C., Holder, L., Cook, D.: Graph-based temporal mining of metabolic path-ways with microarray data. In: ACM SIGKDD Workshop on Data Mining inBioinformatics, BIOKDD (2008)