
Minneapolis Heart Institute Foundation Minneapolis, Minnesota
Upload
center-for-energy-and-environmentCategory
view
132download
3
Mid-Sized City Building Energy
Benchmarking Workshop

CITY OF MINNEAPOLIS
Minneapolis Energy Benchmarking
2
March 29, 2017
Katie Jones Schmitt
City of Minneapolis and Center for Energy and Environment

Activity!
3

Contents
• Why did the city adopt a benchmarking ordinance?
• How does the program function?
• What is being done with the data?
• Who is part of the process?
4

Why?
5

Green jobs
6

Climate change
7
Global Temperature Scenarios Source: World Bank

Mpls GHG inventory
8

Energy dollars outflow
9
Total Energy Spending by City in 2013 Source: Regional Indicators Initiative
Do
llars
in 1
00
0s
Nearly $600,000,000 spent annually on energy
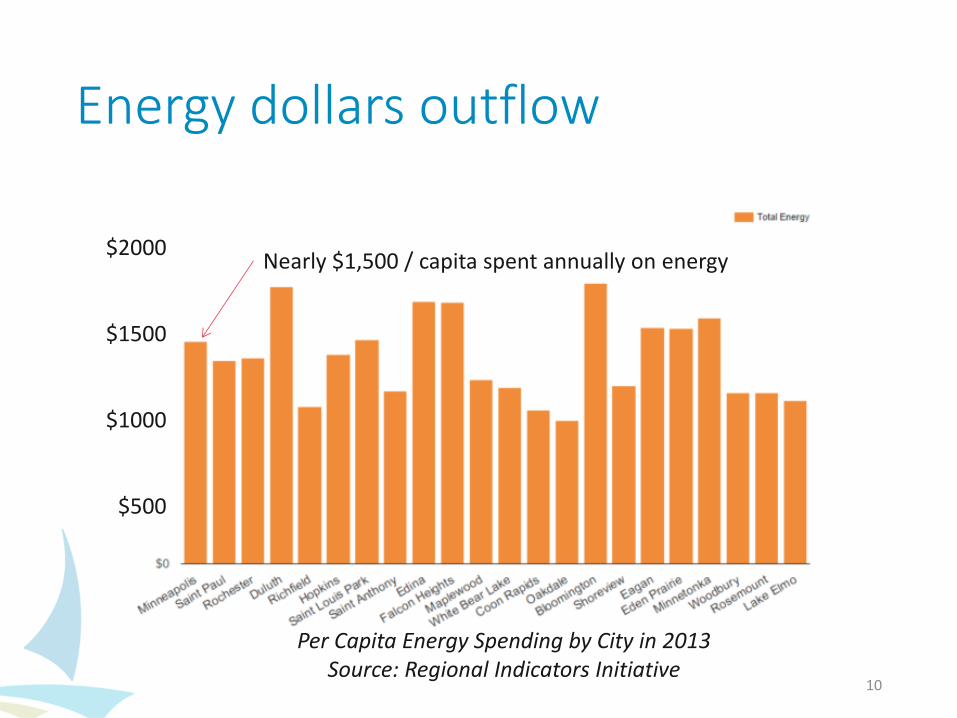
Energy dollars outflow
10
Per Capita Energy Spending by City in 2013 Source: Regional Indicators Initiative
$2000
$1500
$1000
$500
Nearly $1,500 / capita spent annually on energy

Climate Action Plan
11

That big pie piece
12
How to spur energy reductions in this sector to: • Increase green jobs • Address GHGs • Have a light
regulatory touch?
Energy benchmarking

How?
13

Policy
• Developed with help from: CM Glidden, Environmental Health, Sustainability Office
• “You can’t manage what you don’t measure.”
• Commercial Building Rating and Disclosure • Council members and staff engaged stakeholders
• Passed in 2013 with little opposition
14

What buildings are included:
• Private commercial ≥ 50,000 sq.ft.
• Public commercial ≥ 25,000 sq.ft.

>50,000 sq.ft.
• ‘Covered building list’ determined by tax records

Timeline
Resources
• Benchmarking tool:
• Technical support: • Workshops
• Helpline
• One-on-one consultations
18
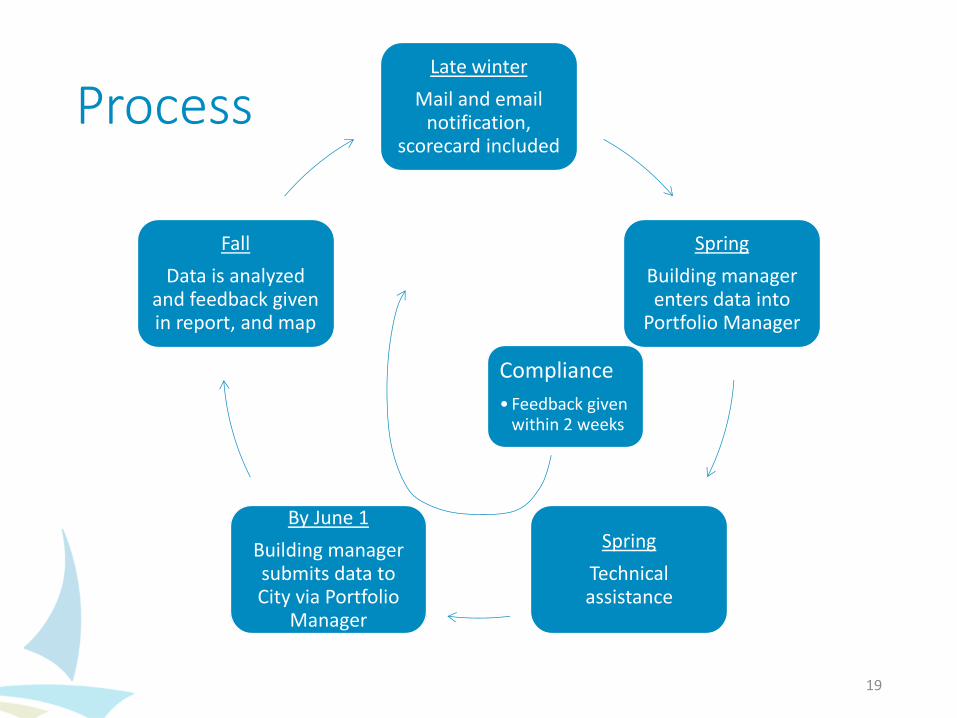
Process
19
Late winter
Mail and email notification,
scorecard included
Spring
Building manager enters data into
Portfolio Manager
Spring
Technical assistance
By June 1
Building manager submits data to City via Portfolio
Manager
Fall
Data is analyzed and feedback given in report, and map
Compliance
• Feedback given within 2 weeks
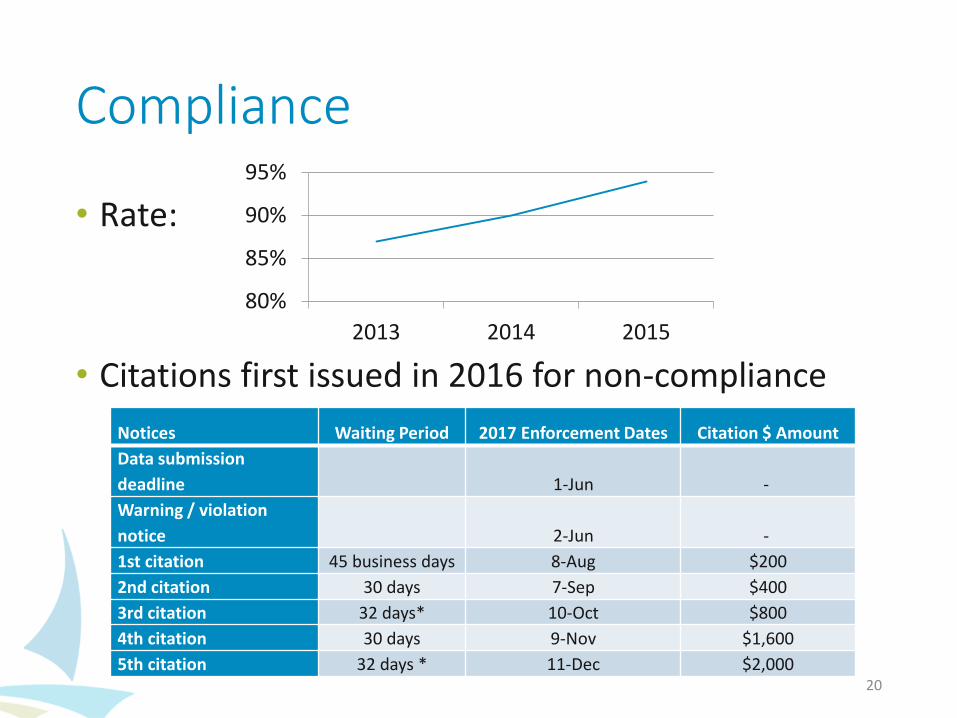
Compliance
• Rate:
• Citations first issued in 2016 for non-compliance
20
Notices Waiting Period 2017 Enforcement Dates Citation $ Amount
Data submission
deadline 1-Jun -
Warning / violation
notice 2-Jun -
1st citation 45 business days 8-Aug $200
2nd citation 30 days 7-Sep $400
3rd citation 32 days* 10-Oct $800
4th citation 30 days 9-Nov $1,600
5th citation 32 days * 11-Dec $2,000
80%
85%
90%
95%
2013 2014 2015

What?
21

Results
22
Buildings
Analyzed
417
Represents
75% of all
commercial
building space
Median
ENERGY STAR
Score
71
Response Rate
94%

Public buildings
*Includes only consistently benchmarked buildings from 2012-2015. Shows aggregate change since 2012 for each entity.

Private buildings
*Includes only consistently benchmarked buildings from 2014-2015.

$31,000 savings
annually
$27,000,000 savings
annually
Potential dollar savings

High-using property types
• hospitals
• hotels
• worship facilities
• individual offices

Individual high users
• Identify high energy users from the list
27
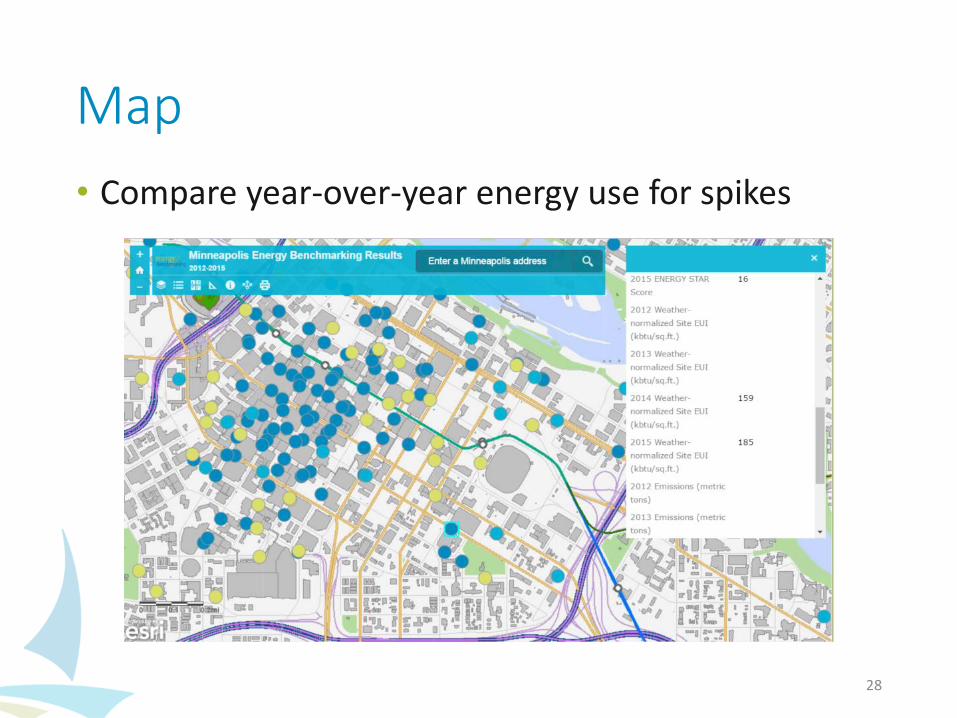
Map
• Compare year-over-year energy use for spikes
28

Scorecard
29

Building Energy Challenge
www.minneapolisenergybenchmarking.org
Calhoun Square 20%!

• Grants up to $20,000 to help fund energy efficiency practices at Minneapolis benchmarked businesses.
• Owners must be able to provide 80% matching funds for project.
Green Business Cost Share
31

Who?
32

Partners:
• Environmental Health Department – compliance and cost share
• Sustainability Office – policy and programs
• CEE – technical assistance and outreach
• RETAP – deep technical assistance
How do these partners interact?
33

5 step process
34
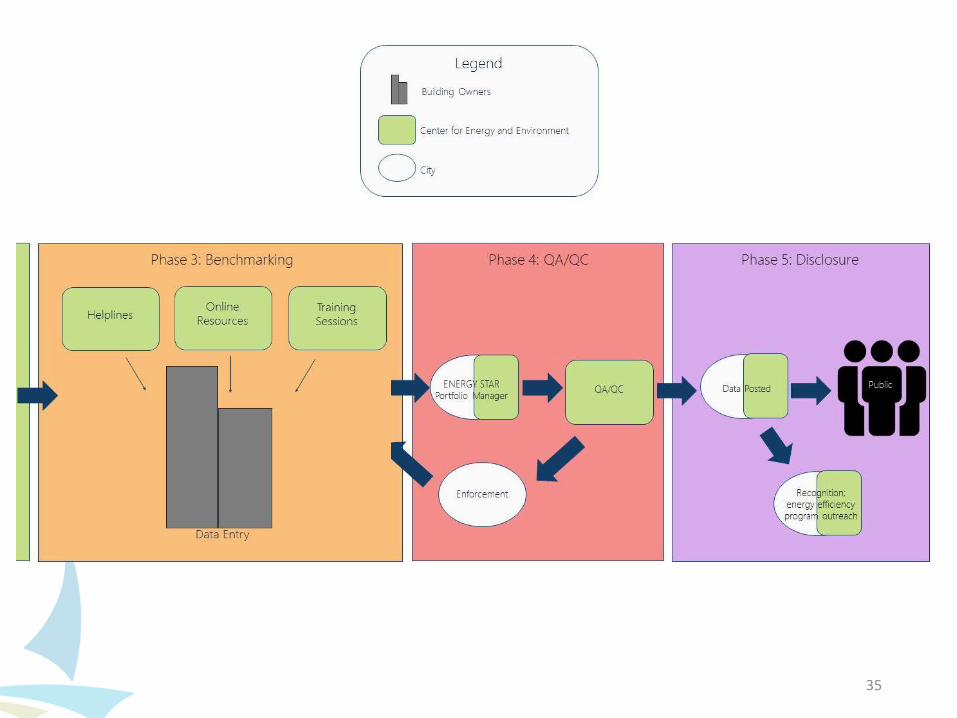
35

CITY OF MINNEAPOLIS
Thank you! Katie Jones Schmitt
612-741-0596
www.minneapolisenergybenchmarking.org

BUTLER SQUARE OUR STORY

Question & Answer