Subjective Cognitive Decline Among Adults Aged ≥45 Years ... · Subjective Cognitive Decline...
20
Morbidity and Mortality Weekly Report Weekly / Vol. 67 / No. 27 July 13, 2018 U.S. Department of Health and Human Services Centers for Disease Control and Prevention Subjective Cognitive Decline Among Adults Aged ≥45 Years — United States, 2015–2016 Christopher A. Taylor, PhD 1 ; Erin D. Bouldin, PhD 1,2 ; Lisa C. McGuire, PhD 1 Subjective cognitive decline (SCD) is the self-reported expe- rience of worsening or more frequent confusion or memory loss within the previous 12 months (1,2) and one of the earliest noticeable symptoms of Alzheimer’s disease (Alzheimer’s), a fatal form of dementia (i.e., a decline in mental abilities severe enough to interfere with everyday life) (1). Alzheimer’s is the most common form of dementia, although not all memory loss results from Alzheimer’s (3). To examine SCD, CDC analyzed combined data from the 2015 and 2016 Behavioral Risk Factor Surveillance System (BRFSS) surveys. Overall, 11.2% of adults aged ≥45 years reported having SCD, 50.6% of whom reported SCD-related functional limitations. Among persons living alone aged ≥45 years, 13.8% reported SCD; among persons with any chronic disease, 15.2% reported SCD. Adults should discuss confusion or memory loss with a health care professional who can assess cognitive decline and address possible treatments and issues related to chronic disease management, medical care, and caregiving. BRFSS is a state-based, random-digit–dialed telephone survey of noninstitutionalized adults aged ≥18 years in all 50 states, the District of Columbia (DC), and several U.S. territories.* The six-question cognitive decline module (optional for states in 2015 and 2016) examines how SCD affects the life of respondents aged ≥45 years, including difficulties performing activities or caring for themselves. Overall, 49 states (all except Pennsylvania), Puerto Rico, and DC administered the module in one or both years. For five states that administered the module in both years, only 2016 data were included in this analysis. For the BRFSS surveys in 2015 and 2016, the overall combined landline and cellular * https://www.cdc.gov/brfss. telephone response rates among states, Puerto Rico, and DC ranged from 30.7% to 65.0% (median = 47.1%). † Respondents who answered affirmatively to the question “During the past 12 months, have you experienced confusion or memory loss that is happening more often or is getting worse?” were classified as having SCD. Respondents with SCD were asked if SCD caused them to give up day-to-day activities such as cooking, cleaning, taking medications, driv- ing, or paying bills; how often they needed and could receive necessary assistance with those activities; how often SCD interfered with their ability to work, volunteer, or engage in social activities; and whether they had discussed SCD with a health care professional. Respondents who reported “always,” “usually,” or “sometimes” (as opposed to “rarely” or “never”) † https://www.cdc.gov/brfss/annual_data/2015/pdf/2015-sdqr.pdf and https:// www.cdc.gov/brfss/annual_data/2016/pdf/2016-sdqr.pdf. INSIDE 758 Hypertension Among Youths — United States, 2001–2016 763 Occupational Mercury Exposure at a Fluorescent Lamp Recycling Facility — Wisconsin, 2017 767 Notes from the Field: Overdose Deaths with Carfentanil and Other Fentanyl Analogs Detected — 10 States, July 2016–June 2017 769 Notes from the Field: Toxic Leukoencephalopathy Associated with Tianeptine Misuse — California, 2017 771 QuickStats Continuing Education examination available at https://www.cdc.gov/mmwr/cme/conted_info.html#weekly.
Transcript of Subjective Cognitive Decline Among Adults Aged ≥45 Years ... · Subjective Cognitive Decline...

Morbidity and Mortality Weekly ReportWeekly / Vol. 67 / No. 27 July 13, 2018
U.S. Department of Health and Human ServicesCenters for Disease Control and Prevention
Subjective Cognitive Decline Among Adults Aged ≥45 Years — United States, 2015–2016
Christopher A. Taylor, PhD1; Erin D. Bouldin, PhD1,2; Lisa C. McGuire, PhD1
Subjective cognitive decline (SCD) is the self-reported expe-rience of worsening or more frequent confusion or memory loss within the previous 12 months (1,2) and one of the earliest noticeable symptoms of Alzheimer’s disease (Alzheimer’s), a fatal form of dementia (i.e., a decline in mental abilities severe enough to interfere with everyday life) (1). Alzheimer’s is the most common form of dementia, although not all memory loss results from Alzheimer’s (3). To examine SCD, CDC analyzed combined data from the 2015 and 2016 Behavioral Risk Factor Surveillance System (BRFSS) surveys. Overall, 11.2% of adults aged ≥45 years reported having SCD, 50.6% of whom reported SCD-related functional limitations. Among persons living alone aged ≥45 years, 13.8% reported SCD; among persons with any chronic disease, 15.2% reported SCD. Adults should discuss confusion or memory loss with a health care professional who can assess cognitive decline and address possible treatments and issues related to chronic disease management, medical care, and caregiving.
BRFSS is a state-based, random-digit–dialed telephone survey of noninstitutionalized adults aged ≥18 years in all 50 states, the District of Columbia (DC), and several U.S. territories.* The six-question cognitive decline module (optional for states in 2015 and 2016) examines how SCD affects the life of respondents aged ≥45 years, including difficulties performing activities or caring for themselves. Overall, 49 states (all except Pennsylvania), Puerto Rico, and DC administered the module in one or both years. For five states that administered the module in both years, only 2016 data were included in this analysis. For the BRFSS surveys in 2015 and 2016, the overall combined landline and cellular
* https://www.cdc.gov/brfss.
telephone response rates among states, Puerto Rico, and DC ranged from 30.7% to 65.0% (median = 47.1%).†
Respondents who answered affirmatively to the question “During the past 12 months, have you experienced confusion or memory loss that is happening more often or is getting worse?” were classified as having SCD. Respondents with SCD were asked if SCD caused them to give up day-to-day activities such as cooking, cleaning, taking medications, driv-ing, or paying bills; how often they needed and could receive necessary assistance with those activities; how often SCD interfered with their ability to work, volunteer, or engage in social activities; and whether they had discussed SCD with a health care professional. Respondents who reported “always,” “usually,” or “sometimes” (as opposed to “rarely” or “never”)
† https://www.cdc.gov/brfss/annual_data/2015/pdf/2015-sdqr.pdf and https://www.cdc.gov/brfss/annual_data/2016/pdf/2016-sdqr.pdf.
INSIDE758 Hypertension Among Youths — United States,
2001–2016763 Occupational Mercury Exposure at a Fluorescent
Lamp Recycling Facility — Wisconsin, 2017767 Notes from the Field: Overdose Deaths with
Carfentanil and Other Fentanyl Analogs Detected — 10 States, July 2016–June 2017
769 Notes from the Field: Toxic Leukoencephalopathy Associated with Tianeptine Misuse — California, 2017
771 QuickStats
Continuing Education examination available at https://www.cdc.gov/mmwr/cme/conted_info.html#weekly.

Morbidity and Mortality Weekly Report
754 MMWR / July 13, 2018 / Vol. 67 / No. 27 US Department of Health and Human Services/Centers for Disease Control and Prevention
The MMWR series of publications is published by the Center for Surveillance, Epidemiology, and Laboratory Services, Centers for Disease Control and Prevention (CDC), U.S. Department of Health and Human Services, Atlanta, GA 30329-4027.Suggested citation: [Author names; first three, then et al., if more than six.] [Report title]. MMWR Morb Mortal Wkly Rep 2018;67:[inclusive page numbers].
Centers for Disease Control and PreventionRobert R. Redfield, MD, Director
Anne Schuchat, MD, Principal Deputy DirectorLeslie Dauphin, PhD, Acting Associate Director for Science
Joanne Cono, MD, ScM, Director, Office of Science Quality Chesley L. Richards, MD, MPH, Deputy Director for Public Health Scientific Services
William R. Mac Kenzie, MD, Acting Director, Director, Center for Surveillance, Epidemiology, and Laboratory Services
MMWR Editorial and Production Staff (Weekly)Charlotte K. Kent, PhD, MPH, Acting Editor in Chief, Executive Editor
Jacqueline Gindler, MD, EditorMary Dott, MD, MPH, Online EditorTeresa F. Rutledge, Managing Editor
Douglas W. Weatherwax, Lead Technical Writer-EditorGlenn Damon, Soumya Dunworth, PhD, Teresa M. Hood, MS,
Technical Writer-Editors
Martha F. Boyd, Lead Visual Information SpecialistMaureen A. Leahy, Julia C. Martinroe,
Stephen R. Spriggs, Tong Yang,Visual Information Specialists
Quang M. Doan, MBA, Phyllis H. King, Terraye M. Starr, Moua Yang,
Information Technology Specialists
MMWR Editorial BoardTimothy F. Jones, MD, Chairman
Matthew L. Boulton, MD, MPHVirginia A. Caine, MD
Katherine Lyon Daniel, PhDJonathan E. Fielding, MD, MPH, MBA
David W. Fleming, MD
William E. Halperin, MD, DrPH, MPHRobin Ikeda, MD, MPH
Phyllis Meadows, PhD, MSN, RNJewel Mullen, MD, MPH, MPA
Jeff Niederdeppe, PhD
Patricia Quinlisk, MD, MPH Patrick L. Remington, MD, MPH
Carlos Roig, MS, MAWilliam Schaffner, MD
giving up day-to-day activities or interference with ability to work, volunteer, or engage in social activities were classified as having SCD-related functional limitations.
Data were examined by age group, sex, race/ethnicity, edu-cation level, veteran status, employment, and living alone. Chronic disease status was ascertained by history of heart disease; stroke, or cerebrovascular disease; asthma; lung dis-ease; cancer (other than skin); arthritis; or diabetes. Data were analyzed using statistical software and methods that accounted for the complex survey design and weighted data. Prevalence rates were unadjusted.
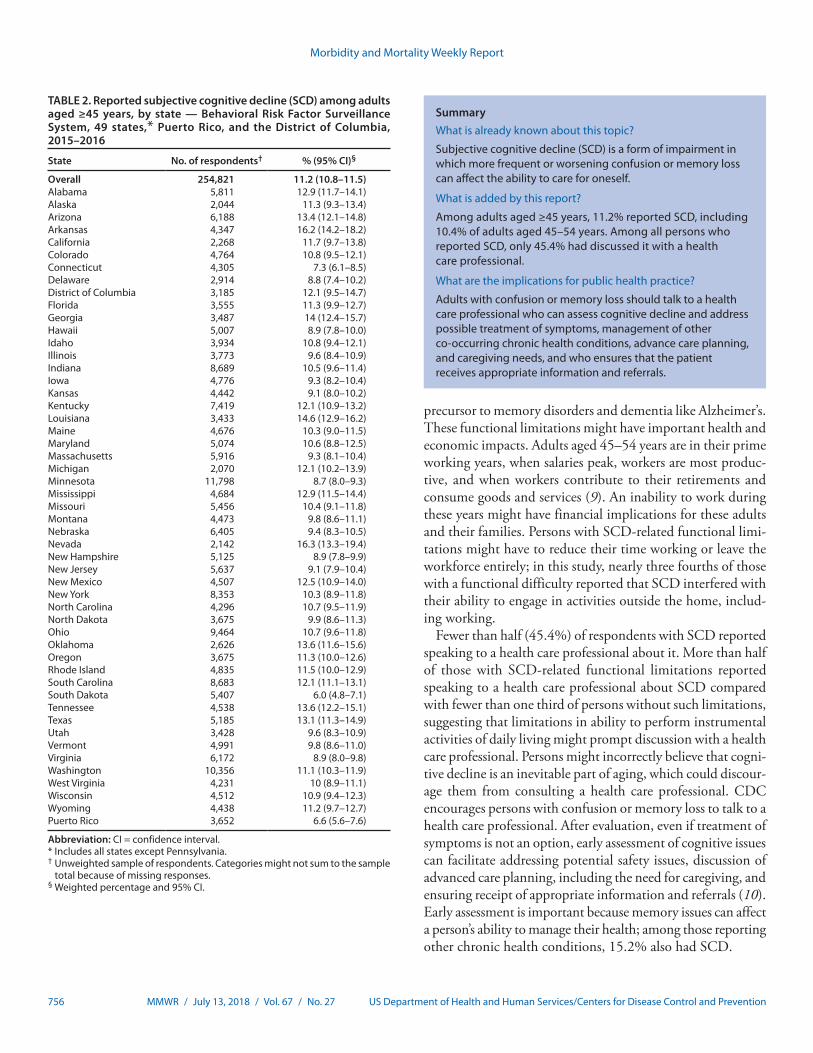
Among adults aged ≥45 years, 11.2% reported SCD, 50.6% of whom reported SCD-related functional difficulties (Table 1). SCD prevalence increased with age, from 10.4% among adults aged 45–54 years to 14.3% among those aged ≥75 years and was lower among college graduates (7.0%) than among those with less than high school education (18.2%). The prevalence of SCD-related functional difficulties among college graduates (30.8%) was half that of those without a high school diploma (64.9%). Among persons living alone, 13.8% reported SCD; 55.7% of those reported SCD-related functional difficulties (Table 1).
The prevalence of SCD varied by state (Table 2). The lowest prevalence of SCD was reported in South Dakota (6.0%), and the highest was reported in Nevada (16.3%).
Nearly twice the percentage of persons reporting SCD-related functional limitations had talked to a health care professional (58.1%) compared with those without functional
limitations (30.4%) (Table 3). Among persons with a func-tional difficulty, 81.1% reported having given up household activities or chores because of SCD, and 73.3% reported that SCD interfered with their ability to work, volunteer, or engage in social activities.
Discussion
SCD can be a symptom of early-stage dementia conditions, including Alzheimer’s (1,2). Not everyone who reports SCD will develop dementia, but some studies have shown that half of older adults with subjective memory complaints go on to develop more severe cognitive decline within 7–18 years (1,4,5). Even without progression to more severe cognitive impairment, SCD might signify a decreased ability for self-care. Inability to perform activities important to daily living such as preparing meals or managing money affect the ability to live independently and might also affect the ability to socialize or remain fully employed.
These findings are similar to those from an analysis of per-sons aged ≥60 years in 21 states from the 2011 BRFSS survey, which found a 12.7% prevalence of SCD (6). In that study, the highest prevalence was among Hispanics (16.9%) and the lowest was among non-Hispanic blacks (11.8%), in contrast to the current study, which found the highest prevalence among non-Hispanic American Indians and Alaska Natives (19.6%) and the lowest among non-Hispanic Asians or Native Hawaiians/Other Pacific Islanders (6.8%). The inclusion of

Morbidity and Mortality Weekly Report
MMWR / July 13, 2018 / Vol. 67 / No. 27 755US Department of Health and Human Services/Centers for Disease Control and Prevention
TABLE 1. Characteristics of adults aged ≥45 years who reported subjective cognitive decline (SCD) and associated functional limitations — Behavioral Risk Factor Surveillance System, 49 states,* Puerto Rico, and the District of Columbia, 2015–2016
Characteristic
SCD Functional limitations among those reporting SCD
No. of respondents† % (95% CI)§ No. of respondents† % (95% CI)§
Overall 227,393 11.2 (10.8–11.5) 23,705 50.6 (49.0–52.2)Age group (yrs)45–54 48,563 10.4 (9.7–11.1) 4,868 59.8 (56.4–63.2)55–64 68,835 11.4 (10.8–12.0) 7,081 56.9 (54.3–59.6)65–74 64,472 9.9 (9.3–10.5) 5,978 39.3 (36.4–42.3)≥75 45,523 14.3 (13.3–15.2) 5,778 37.5 (34.1–41.0)SexMen 92,639 11.4 (10.8–11.9) 10,095 47.6 (45.3–49.9)Women 134,743 11.0 (10.6–11.5) 13,609 53.2 (51.0–55.5)Race/Ethnicity¶
White 184,742 10.8 (10.5–11.2) 18,622 44.9 (43.2–46.7)Black 16,370 13.2 (12.0–14.3) 1,991 64.4 (59.5–69.4)American Indian/Alaska Native 3,232 19.6 (16.0–23.2) 498 73.4 (64.8–82.1)Asian or Native Hawaiian/Other Pacific Islander 3,223 6.8 (4.3–9.3) 261 39.7 (23.9–55.5)Other race or multiracial 4,681 15.4 (12.6–18.2) 664 55.9 (46.0–65.8)Hispanic 11,680 11.2 (9.8–12.7) 1,267 65.8 (58.8–72.8)Highest education levelLess than a high school diploma 17,602 18.2 (16.8–19.5) 3,110 64.9 (60.6–69.1)High school diploma 65,474 11.6 (11.0–12.1) 7,415 53.2 (50.6–55.8)Some college 61,574 11.5 (10.8–12.2) 6,826 49.1 (46.0–52.1)College graduate 82,094 7.0 (6.5–7.5) 6,290 30.8 (27.7–33.8)Veteran statusVeteran 35,738 13.6 (12.7–14.5) 4,611 42.5 (39.0–54.1)Not a veteran 191,434 10.8 (10.4–11.1) 19,065 52.4 (50.6–54.1)Employment statusEmployed/Self-employed 91,486 6.0 (5.7–6.4) 5,209 31.1 (28.2–33.9)Unemployed 7,184 16.9 (14.5–19.3) 1,109 60.0 (51.5–68.5)Homemaker 12,313 8.4 (6.9–10.0) 1,057 45.7 (36.7–54.7)Student 431 5.8 (2.9–8.6) 40 76.3 (61.0–91.5)Retired 94,918 11.3 (10.8–11.9) 9,934 38.2 (35.7–40.7)Unable to work 19,832 34.8 (33.1–36.5) 6,221 79.4 (77.1–81.7)Household statusLives alone 78,274 13.8 (13.2–14.4) 9,640 55.7 (53.3–58.0)Does not live alone 148,038 10.4 (9.9–10.8) 13,957 48.2 (46.2–50.2)Any chronic diseaseYes 143,954 15.2 (14.7–15.7) 19,589 53.9 (52.2–55.6)No 83,381 5.2 (4.8–5.7) 4,103 36.1 (32.0–40.1)
Abbreviation: CI = confidence interval.* Includes all states except Pennsylvania.† Unweighted sample of respondents. Categories might not sum to the sample total because of missing responses.§ Weighted percentage and 95% CI.¶ All persons who reported a racial group were non-Hispanic. Those who reported Hispanic ethnicity might be members of any racial group.
additional states and the expansion of the age groups might have contributed to these differences.
In both 2011 (6) and 2015–2016, a higher SCD prevalence was found among adults aged ≥75 years than among those aged 45–74 years. This is similar to the prevalence of Alzheimer’s, according to 2018 data from the Alzheimer’s Association, which found an estimated 3% of persons aged 65–74 years, 17% of persons aged 75–84 years, and 32% of persons aged ≥85 years had Alzheimer’s (1,7). This analysis found a higher prevalence of SCD and related functional limitations in per-sons with less formal education, similar to previously reported
patterns of higher dementia prevalence in persons with less formal education (8).
Younger adults might be more likely to attribute limitations in their lifestyle to SCD or might be more sensitive to its effects. Conversely, older adults might be less aware of the effects of SCD or consider it a normal part of aging. Among persons aged 45–54 years, 10.4% reported SCD, and 59.8% of those persons reported SCD-related limitations that affected work, household chores, or social activities. Although Alzheimer’s is rare in persons aged <65 years, the finding of SCD and related functional limitations among younger adults could indicate early symptoms of cognitive decline that can be a
Morbidity and Mortality Weekly Report
756 MMWR / July 13, 2018 / Vol. 67 / No. 27 US Department of Health and Human Services/Centers for Disease Control and Prevention
TABLE 2. Reported subjective cognitive decline (SCD) among adults aged ≥45 years, by state — Behavioral Risk Factor Surveillance System, 49 states,* Puerto Rico, and the District of Columbia, 2015–2016
State No. of respondents† % (95% CI)§
Overall 254,821 11.2 (10.8–11.5)Alabama 5,811 12.9 (11.7–14.1)Alaska 2,044 11.3 (9.3–13.4)Arizona 6,188 13.4 (12.1–14.8)Arkansas 4,347 16.2 (14.2–18.2)California 2,268 11.7 (9.7–13.8)Colorado 4,764 10.8 (9.5–12.1)Connecticut 4,305 7.3 (6.1–8.5)Delaware 2,914 8.8 (7.4–10.2)District of Columbia 3,185 12.1 (9.5–14.7)Florida 3,555 11.3 (9.9–12.7)Georgia 3,487 14 (12.4–15.7)Hawaii 5,007 8.9 (7.8–10.0)Idaho 3,934 10.8 (9.4–12.1)Illinois 3,773 9.6 (8.4–10.9)Indiana 8,689 10.5 (9.6–11.4)Iowa 4,776 9.3 (8.2–10.4)Kansas 4,442 9.1 (8.0–10.2)Kentucky 7,419 12.1 (10.9–13.2)Louisiana 3,433 14.6 (12.9–16.2)Maine 4,676 10.3 (9.0–11.5)Maryland 5,074 10.6 (8.8–12.5)Massachusetts 5,916 9.3 (8.1–10.4)Michigan 2,070 12.1 (10.2–13.9)Minnesota 11,798 8.7 (8.0–9.3)Mississippi 4,684 12.9 (11.5–14.4)Missouri 5,456 10.4 (9.1–11.8)Montana 4,473 9.8 (8.6–11.1)Nebraska 6,405 9.4 (8.3–10.5)Nevada 2,142 16.3 (13.3–19.4)New Hampshire 5,125 8.9 (7.8–9.9)New Jersey 5,637 9.1 (7.9–10.4)New Mexico 4,507 12.5 (10.9–14.0)New York 8,353 10.3 (8.9–11.8)North Carolina 4,296 10.7 (9.5–11.9)North Dakota 3,675 9.9 (8.6–11.3)Ohio 9,464 10.7 (9.6–11.8)Oklahoma 2,626 13.6 (11.6–15.6)Oregon 3,675 11.3 (10.0–12.6)Rhode Island 4,835 11.5 (10.0–12.9)South Carolina 8,683 12.1 (11.1–13.1)South Dakota 5,407 6.0 (4.8–7.1)Tennessee 4,538 13.6 (12.2–15.1)Texas 5,185 13.1 (11.3–14.9)Utah 3,428 9.6 (8.3–10.9)Vermont 4,991 9.8 (8.6–11.0)Virginia 6,172 8.9 (8.0–9.8)Washington 10,356 11.1 (10.3–11.9)West Virginia 4,231 10 (8.9–11.1)Wisconsin 4,512 10.9 (9.4–12.3)Wyoming 4,438 11.2 (9.7–12.7)Puerto Rico 3,652 6.6 (5.6–7.6)
Abbreviation: CI = confidence interval.* Includes all states except Pennsylvania.† Unweighted sample of respondents. Categories might not sum to the sample
total because of missing responses.§ Weighted percentage and 95% CI.
SummaryWhat is already known about this topic?
Subjective cognitive decline (SCD) is a form of impairment in which more frequent or worsening confusion or memory loss can affect the ability to care for oneself.
What is added by this report?
Among adults aged ≥45 years, 11.2% reported SCD, including 10.4% of adults aged 45–54 years. Among all persons who reported SCD, only 45.4% had discussed it with a health care professional.
What are the implications for public health practice?
Adults with confusion or memory loss should talk to a health care professional who can assess cognitive decline and address possible treatment of symptoms, management of other co-occurring chronic health conditions, advance care planning, and caregiving needs, and who ensures that the patient receives appropriate information and referrals.
precursor to memory disorders and dementia like Alzheimer’s. These functional limitations might have important health and economic impacts. Adults aged 45–54 years are in their prime working years, when salaries peak, workers are most produc-tive, and when workers contribute to their retirements and consume goods and services (9). An inability to work during these years might have financial implications for these adults and their families. Persons with SCD-related functional limi-tations might have to reduce their time working or leave the workforce entirely; in this study, nearly three fourths of those with a functional difficulty reported that SCD interfered with their ability to engage in activities outside the home, includ-ing working.
Fewer than half (45.4%) of respondents with SCD reported speaking to a health care professional about it. More than half of those with SCD-related functional limitations reported speaking to a health care professional about SCD compared with fewer than one third of persons without such limitations, suggesting that limitations in ability to perform instrumental activities of daily living might prompt discussion with a health care professional. Persons might incorrectly believe that cogni-tive decline is an inevitable part of aging, which could discour-age them from consulting a health care professional. CDC encourages persons with confusion or memory loss to talk to a health care professional. After evaluation, even if treatment of symptoms is not an option, early assessment of cognitive issues can facilitate addressing potential safety issues, discussion of advanced care planning, including the need for caregiving, and ensuring receipt of appropriate information and referrals (10). Early assessment is important because memory issues can affect a person’s ability to manage their health; among those reporting other chronic health conditions, 15.2% also had SCD.
Morbidity and Mortality Weekly Report
MMWR / July 13, 2018 / Vol. 67 / No. 27 757US Department of Health and Human Services/Centers for Disease Control and Prevention
TABLE 3. Percentage of adults aged ≥45 years with subjective cognitive decline (SCD), by SCD-related functional limitation status in preceding 12 months — Behavioral Risk Factor Surveillance System, 49 states,* Puerto Rico, and the District of Columbia, 2015–2016
Characteristic
All with SCD With SCD and functional limitationsWith SCD but no functional
limitations
Unweighted no. % (95% CI) Unweighted no. % (95% CI) Unweighted no. % (95% CI)
Ever discussed SCD with a health care professional
23,853 45.4 (43.8–46.9) 11,111 58.1 (55.9–60.3) 12,398 30.4 (34.6–35.6)
Gave up household activities or chores because of SCD†
23,682 40.4 (38.9–42.0) 11,078 81.1 (79.0–83.1) 12,456 —§
SCD interfered with ability to work, volunteer, or engage in social activities outside the home†
23,675 36.5 (35.0–38.1) 11,049 73.3 (71.4–75.3) 12,456 —§
Abbreviation: CI = confidence interval.* Includes all states except Pennsylvania.† Always, usually, or sometimes.§ By definition.
The findings in this report are subject to at least three limitations. First, data on SCD are self-reported. Whereas the SCD module was cognitively tested, it is not administered alongside an objective measure of cognitive performance. Therefore, the accuracy of the reports of SCD is unknown. Second, response bias might affect response to SCD questions and might underestimate SCD prevalence. Finally, BRFSS is not administered to persons with known cognitive problems who might not generate reliable data. In addition, BRFSS is only administered to noninstitutionalized adults, excluding adults living in long-term care facilities, where a proportion of residents have SCD. Therefore, these results cannot be used to estimate the prevalence of SCD across all U.S. populations.
Cognitive decline is an important public health issue affect-ing older adults, their families, and their caregivers, as well as the economy and health care system. As a precursor to dementia, including Alzheimer’s, SCD can impair a person’s ability to care for themselves by limiting their ability to work, particularly those adults who report SCD in their prime working years (i.e., 45–54 years). Estimating the prevalence of SCD might allow states to plan for those who might develop dementia in the future.
Conflict of Interest
No conflicts of interest were reported.
1Division of Population Health, National Center for Chronic Disease Prevention and Health Promotion, CDC; 2Department of Health and Exercise Science, Beaver College of Health Sciences, Appalachian State University, Boone, North Carolina.
Corresponding author: Christopher A. Taylor, [email protected], 770-488-1121.
References 1. Alzheimer’s Association. 2018 Alzheimer’s disease facts and figures.
Alzheimers Dement 2018;14:367–429. https://doi.org/10.1016/j.jalz.2018.02.001
2. Reid LM, Maclullich AM. Subjective memory complaints and cognitive impairment in older people. Dement Geriatr Cogn Disord 2006;22:471–85. https://doi.org/10.1159/000096295
3. National Institute on Aging. Do memory problems always mean Alzheimer’s disease? Bethesda, MD: National Institutes of Health, National Institute on Aging; 2018. https://www.nia.nih.gov/health/do-memory-problems-always-mean-alzheimers-disease
4. CDC. Self-reported increased confusion or memory loss and associated functional difficulties among adults aged ≥60 years—21 states, 2011. MMWR Morb Mortal Wkly Rep 2013;62:347–50.
5. Kaup AR, Nettiksimmons J, LeBlanc ES, Yaffe K. Memory complaints and risk of cognitive impairment after nearly 2 decades among older women. Neurology 2015;85:1852–8. https://doi.org/10.1212/WNL.0000000000002153
6. Reisberg B, Shulman MB, Torossian C, Leng L, Zhu W. Outcome over seven years of healthy adults with and without subjective cognitive impairment. Alzheimers Dement 2010;6:11–24. https://doi.org/10.1016/j.jalz.2009.10.002
7. National Institute on Aging. What is Alzheimer’s disease? Bethesda, MD: National Institutes of Health, National Institute on Aging; 2017. https://www.nia.nih.gov/health/what-alzheimers-disease
8. Sharp ES, Gatz M. Relationship between education and dementia: an updated systematic review. Alzheimer Dis Assoc Disord 2011;25:289–304. https://doi.org/10.1097/WAD.0b013e318211c83c
9. Executive Office of the President of the United States. The long-term decline in prime-age male labor force participation. Washington, DC: Executive Office of the President of the United States; 2016. https://obamawhitehouse.archives.gov/sites/default/files/page/files/20160620_cea_primeage_male_lfp.pdf
10. National Institute on Aging. Assessing cognitive impairment in older patients. Bethesda, MD: National Institutes of Health, National Institute on Aging; 2014. https://www.nia.nih.gov/health/assessing-cognitive-impairment-older-patients

Morbidity and Mortality Weekly Report
758 MMWR / July 13, 2018 / Vol. 67 / No. 27 US Department of Health and Human Services/Centers for Disease Control and Prevention
Hypertension Among Youths — United States, 2001–2016Sandra L. Jackson, PhD1; Zefeng Zhang, MD, PhD1; Jennifer L. Wiltz, MD1,2; Fleetwood Loustalot, PhD1,2; Matthew D. Ritchey, DPT1,2;
Alyson B. Goodman, MD3; Quanhe Yang, PhD1
Hypertension is an important modifiable risk factor for cardiovascular morbidity and mortality, and hypertension in adolescents and young adults is associated with long-term negative health effects (1,2).* In 2017, the American Academy of Pediatrics (AAP) released a new Clinical Practice Guideline (3), which updated 2004 pediatric hypertension guidance† with new thresholds and percentile references calculated from a healthy-weight population. To examine trends in youth hyper-tension and the impact of the new guideline on classification of hypertension status, CDC analyzed data from 12,004 par-ticipants aged 12–19 years in the 2001–2016 National Health and Nutrition Examination Survey (NHANES). During this time, prevalence of hypertension declined, using both the new (from 7.7% to 4.2%, p<0.001) and former (from 3.2% to 1.5%, p<0.001) guidelines, and declines were observed across all weight status categories. However, because of the new percentile tables and lower threshold for hypertension (4), application of the new guideline compared with the for-mer guideline resulted in a weighted net estimated increase of 795,000 U.S. youths being reclassified as having hypertension using 2013–2016 data. Youths who were older, male, and those with obesity accounted for a disproportionate share of persons reclassified as having hypertension. Clinicians and public health professionals might expect to see a higher prevalence of hypertension with application of the new guideline and can use these data to inform actions to address hypertension among youths. Strategies to improve cardiovascular health include adoption of healthy eating patterns and increased physical activity (3).
NHANES is a nationally representative survey of noninsti-tutionalized persons in the United States. The survey includes an in-person examination with up to three brachial systolic blood pressure (SBP) and diastolic blood pressure (DBP) readings taken by certified examiners. Mean SBP and DBP values were used.§ Among 13,523 participating youths during
* https://www.nhlbi.nih.gov/files/docs/peds_guidelines_sum.pdf.† National High Blood Pressure Education Program Working Group on High
Blood Pressure in Children and Adolescents. The Fourth Report on the Diagnosis, Evaluation, and Treatment of High Blood Pressure in Children and Adolescents. https://www.nhlbi.nih.gov/files/docs/resources/heart/hbp_ped.pdf.
§ A maximum of three blood pressure readings were measured for each participant in the Mobile Examination Center under a standard protocol. For participants with only a single BP reading, that measurement was used in place of an average. https://wwwn.cdc.gov/nchs/data/nhanes/2013-2014/manuals/Phys_Exam_Manual_2013.pdf.
2001–2016, those missing SBP or DBP (999), or body mass index (BMI [kg/m2]) (136) were excluded. In addition, youths classified as underweight (BMI-for-age <5th percentile; 384) were excluded because of insufficient sample size, leaving 12,004 persons aged 12–19 years in the analytic sample.
Elevated blood pressure (BP) and hypertension were defined according to age-specific thresholds established in both the former and new guidelines. To apply the former guideline, among those aged 12–17 years, elevated BP (formerly “prehy-pertension”) was defined as BP ≥90th to <95th percentile or ≥120/80 mmHg to <95th percentile; hypertension was defined as BP ≥95th percentile (using 2004 age, sex, and height-specific percentile tables) or reported antihypertensive medication use (only available for persons aged >15 years¶) (Supplementary Table 1, https://stacks.cdc.gov/view/cdc/56579). Among persons aged 18–19 years, elevated BP was defined as SBP ≥120 mmHg to <140 mmHg or DBP ≥80 mmHg to <90 mmHg; hypertension was defined as BP ≥140/90 mmHg or reported antihypertensive medication use.
The new guideline used new percentile tables (from a refer-ence population excluding youths with overweight/obesity). To apply the new guideline, among adolescents aged 12–17 years, elevated BP was defined as BP ≥90th to <95th percentile or SBP ≥120 mmHg to <95th percentile; hypertension was defined as BP ≥95th percentile, BP ≥130/80 mmHg, or reported antihypertensive medication use. For persons aged 18–19 years, elevated BP was defined as SBP ≥120 mmHg to <130 mmHg and DBP <80 mmHg; hypertension was defined as BP ≥130/80 mmHg or antihypertensive medication use. The new guideline thresholds for persons aged 18–19 years align
¶ From NHANES Prescription Medication dataset, unpublished. The definition of hypertension used in this analysis did not include medications identified as being antihypertensives in the Prescription Medication dataset (in which interviewers asked to see all prescription medication containers for medications that the participant had taken within 30 days), because some of these medications might not have been taken for the purpose of controlling hypertension. Hypertension in this analysis only included self-reported antihypertensive use from the Blood Pressure and Cholesterol Module (e.g., “Because of your high blood pressure/hypertension, have you ever been told to take prescribed medicine?”). However, use of medications identified as being antihypertensives in the Prescription Medication dataset increased from 2001 to 2014, the last year for which this dataset was available.

Morbidity and Mortality Weekly Report
MMWR / July 13, 2018 / Vol. 67 / No. 27 759US Department of Health and Human Services/Centers for Disease Control and Prevention
with recommendations in the 2017 Hypertension Clinical Practice Guideline for persons aged ≥18 years.**
Weight status was categorized using age- and sex-specific reference values from the 2000 CDC growth charts†† (healthy weight: BMI-for-age ≥5th to <85th percentiles; overweight: ≥85th to <95th; obesity: ≥95th). In addition, a subset of the group with obesity (severe obesity, defined as BMI-for-age ≥120% of the 95th percentile) was examined (5). Race/ethnic-ity was classified as non-Hispanic white, non-Hispanic black, Mexican American, and other.§§
Participant characteristics across survey years were compared using Satterthwaite chi-squared tests and t-tests. Estimated prevalence of elevated BP, hypertension, and the combina-tion of these were calculated in 4-year increments (to assure sufficient sample size) from 2001 to 2016, and trends were assessed using survey logistic regression adjusted for age, sex, and race/ethnicity. Using prevalence estimates from 2013 to
** Guideline for the Prevention, Detection, Evaluation, and Management of High Blood Pressure in Adults. A Report of the American College of Cardiology/American Heart Association Task Force on Clinical Practice Guidelines. http://hyper.ahajournals.org/content/early/2017/11/10/HYP.0000000000000065.
†† https://www.cdc.gov/nccdphp/dnpao/growthcharts/resources/sas.htm. §§ During 1999–2006, certain groups, including Mexican Americans, were
oversampled, while the number of non-Mexican American Hispanics in the NHANES sample was too small for reliable estimates. Because of these sampling differences and sample size concerns, it is not recommended to examine “all Hispanics” from years before 2007. Hispanics other than Mexican Americans were included in the “other” category. https://www.cdc.gov/nchs/data/nhanes/analyticnote_2007-2010.pdf.
2016, population-level estimates of the number of youths classified as having hypertension were calculated. Bootstrap methodology with 1,000 resamples was used to estimate 95% confidence intervals for the percentage of the population reclas-sified as having hypertension. All analyses used exam sample weights and statistical procedures for complex surveys, and all tests were two-sided.
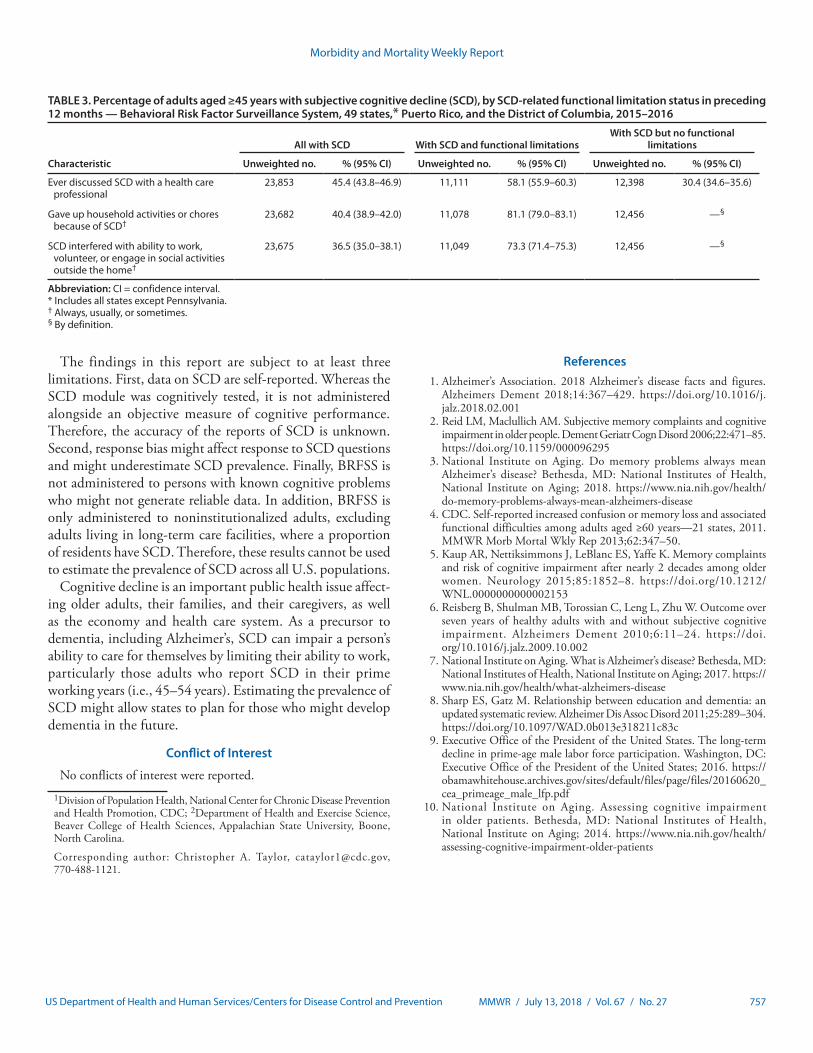
Population characteristics were mostly consistent from 2001 to 2016, although the prevalence of obesity increased from 17.8% (2001–2004) to 21.8% (2013–2016) (p = 0.016), as did the prevalence of severe obesity (5.7% to 8.8%, p = 0.003) (Table 1). During 2001–2016, the prevalence of hypertension declined, according to both the new (from 7.7% to 4.2%, p<0.001) and former (from 3.2% to 1.5%, p<0.001) guidelines (Figure) (Supplementary Table 2, https://stacks.cdc.gov/view/cdc/56580). This decline occurred across all BMI categories, although the prevalence of hypertension was consistently highest among persons with obesity and severe obesity. During 2013–2016, using the new guideline, the prevalence of elevated BP was approximately 10%, and the prevalence of combined elevated BP or hypertension was nearly 15% (Figure).
Compared with the former guideline, the new guideline classified fewer youths with elevated BP and more youths as having hypertension (Figure). Using data from 2013 to 2016, an additional 2.6% of U.S. youths aged 12–19 years would be reclassified as having hypertension, which translates to a net increase of approximately 795,000 persons (Table 2). Youths aged 18–19 years would account for approximately half of the
TABLE 1. Characteristics of youths aged 12–19 years — National Health and Nutritional Examination Survey (NHANES), United States, 2001–2016
Characteristic
% (95% CI)
P-value for trend*
NHANES 2001–2004 (N = 4,169)
NHANES 2005–2008 (N = 3,076)
NHANES 2009–2012 (N = 2,319)
NHANES 2013–2016 (N = 2,440)
Age group (yrs)12–17 78.0 (75.1–80.6) 77.6 (75.1–80.0) 78.1 (75.3–80.6) 78.9 (76.9–80.8) 0.53918–19 22.0 (19.4–24.9) 22.4 (22.0–24.9) 21.9 (19.4–24.7) 21.1 (19.2–23.1)SexMale 50.8 (48.9–52.7) 51.5 (49.2–53.9) 50.8 (48.2–53.4) 50.4 (48.0–52.8) 0.703Female 49.2 (47.3–51.1) 48.5 (46.1–50.8) 49.2 (46.6–51.8) 49.6 (47.2–52.0)Race/EthnicityWhite, non-Hispanic 63.2 (57.6–68.5) 61.7 (56.6–66.6) 56.5 (50.4–62.3) 54.0 (46.7–61.2) 0.024Black, non-Hispanic 14.0 (11.2–17.4) 15.2 (11.9–19.2) 15.0 (11.5–19.4) 14.1 (10.5–18.6) 0.987Mexican American 10.8 (8.3–14.1) 12.0 (9.6–14.8) 13.8 (10.5–17.9) 14.7 (10.9–19.4) 0.100Other 12.0 (9.1–15.7) 11.1 (8.5–14.4) 14.7 (12.2–17.6) 17.2 (14.9–19.8) 0.004Weight status†
Healthy 66.0 (63.0–68.9) 64.1 (61.8–66.6) 64.0 (61.4–66.5) 59.8 (56.7–62.7) 0.005Overweight 16.2 (14.4–18.2) 16.6 (15.1–18.2) 15.1 (13.6–16.7) 18.4 (16.7–20.3) 0.218Obesity (all) 17.8 (15.8–19.9) 19.2 (16.8–21.9) 20.9 (18.9–23.2) 21.8 (19.0–24.9) 0.016
Severe obesity 5.7 (4.6–7.1) 6.6 (5.2–8.3) 7.5 (5.8–9.7) 8.8 (7.3–10.6) 0.003
Abbreviations: BMI = body mass index; CI = confidence interval.* P-values for trends in participant characteristics across survey years were obtained using Satterthwaite chi-squared tests and t-tests. All tests were 2-tailed.† BMI is compared with age- and sex-specific reference values from the 2000 CDC growth charts (https://www.cdc.gov/growthcharts/cdc_charts.htm). Healthy = BMI-
for-age ≥5th to <85th, overweight = BMI-for-age ≥85th to <95th percentile, obesity = BMI-for-age ≥95% percentile. Severe obesity = BMI-for-age ≥120% of the 95th percentile. Persons classified as underweight (BMI-for-age <5th percentile) are excluded.
Morbidity and Mortality Weekly Report
760 MMWR / July 13, 2018 / Vol. 67 / No. 27 US Department of Health and Human Services/Centers for Disease Control and Prevention
FIGURE. Prevalence of elevated blood pressure (BP) and hypertension among youths, by new and former guidelines — United States, 2001–2016
0
5
10
15
20
25
30
35
40
45
100% Combined, former guideline % Combined, new guideline% Elevated BP, former guideline % Elevated BP, new guideline% Hypertension, former guideline % Hypertension, new guideline
All Healthy weight Overweight
Years
Obesity Severe obesity
2009–2012
2005–2008
2001–2004
2013–2016
2009–2012
2005–2008
2001–2004
2013–2016
2009–2012
2005–2008
2001–2004
2013–2016
2009–2012
2005–2008
2001–2004
2013–2016
2009–2012
2005–2008
2001–2004
2013–2016
Perc
enta
ge
net increase, and males would account for over two thirds. Nearly half of the net increase in new diagnoses of hypertension among youths would be among those with obesity (Table 2), although less than one quarter of U.S. youths have obesity (Table 1).
Discussion
According to the criteria of the 2017 AAP Clinical Practice Guideline, approximately one in seven U.S. youths aged 12–19 years had elevated BP or hypertension during 2013–2016. Prevalence of hypertension varied by weight status, ranging from 2% among healthy-weight youths to nearly 14% among those with severe obesity. The new guideline used a lower threshold of hypertension and new percentile references, and compared with the former guideline, the new guideline would reclassify 2.6% of U.S. youths, or nearly an additional 800,000, as having hypertension.
The application of the new guideline results in a net increase in the number of persons aged 12–19 years classified as having hypertension. Early screening (3) and intervention should be encouraged. Hypertension among youths is associated with increased risk for hypertension and other markers of cardio-vascular risk during adulthood (1,2); however, if children with hypertension can achieve normal BP by adulthood, this
risk might be reduced (1). Despite significant increases in the prevalence of obesity and severe obesity from 2001–2004 to 2013–2016, the prevalence of hypertension declined signifi-cantly (3.5 percentage points) across this time. This decline in adolescent hypertension is consistent with other reports (6,7), and might be related to improved diet quality or improved screening and earlier lifestyle or pharmacologic intervention (8,9). Increases in antihypertensive medication use, and subse-quent decreases in BP, might have partially contributed to the observed declines in hypertension. Information on medication use was not available for participants aged 12–15 years and thus could not be included in the definition of hypertension for this age group. In addition, there appeared to be an increase in antihypertensive medication use based on review of the participants’ actual medications, both among youths who self-reported medication use for BP control and were collected in the definition of hypertension, and among youths who did not self-report medication use for BP control and were not included in the definition of hypertension. Although antihypertensive, or BP-lowering, medications are primarily used to manage hypertension, they can also be used for other cardiovascular conditions, migraines, or anxiety. Declines in adolescent

Morbidity and Mortality Weekly Report
MMWR / July 13, 2018 / Vol. 67 / No. 27 761US Department of Health and Human Services/Centers for Disease Control and Prevention
TABLE 2. Estimated hypertension prevalence and population classification by new* and former† guidelines — National Health and Nutritional Examination Survey 2013–2016
Characteristic (no.) No. (weighted)
Estimated hypertension
prevalence (new guidelines)
% (95% CI)
Hypertension prevalence
(former guidelines % (95% CI)
No. of persons with
hypertension (new
guidelines)
No. of persons with
hypertension (former
guidelines)
Net increase in no. of persons
with hypertension
Percentage of population
reclassified as having
hypertension
All, aged 12–19 yrs (2,440) 30,855,000 4.11 (3.22–5.24) 1.54 (1.01–2.23) 1,269,000 474,000 795,000 2.58 (1.84–3.34)Age group (yrs)12–17 (1,898) 24,352,000 3.21 (2.40–4.28) 1.62 (0.97–2.52) 781,000 394,000 387,000 1.59 (0.95–2.29)18–19 (542) 6,503,000 7.50 (5.00–10.73) 1.23 (0.48–2.56) 488,000 80,000 408,000 6.29 (3.98–8.93)SexMale (1,220) 15,550,000 5.78 (4.33–7.67) 2.18 (1.39–3.25) 899,000 339,000 560,000 3.62 (2.35–5.00)Female (1,220) 15,305,000 2.42 (1.41–3.84) 0.88 (0.44–1.58) 370,000 135,000 235,000 1.53 (0.88–2.32)Race/EthnicityWhite, non-Hispanic (641) 16,669,000 2.97 (1.73–4.74) 0.80¶ (0.21–2.08) 495,000 133,000 362,000 2.17 (1.09–3.43)Black, non-Hispanic (583) 4,345,000 6.27 (3.84–9.59) 2.94 (1.44–5.30) 273,000 128,000 145,000 3.37 (1.89–5.05)Mexican American (549) 4,525,000 4.94 (3.01–7.59) 2.33 (1.19–4.09) 224,000 106,000 118,000 2.58 (1.29–4.04)Other (667) 5,315,000 5.22 (3.65–7.20) 2.02 (1.09–3.40) 277,000 107,000 170,000 3.23 (1.86–4.79)Weight status§
Healthy (1,423) 18,439,000 1.88 (1.12–2.97) 0.62¶ (0.28–1.18) 347,000 114,000 234,000 1.28 (0.63–2.11)Overweight (461) 5,689,000 1.86 (0.83–3.55) 1.86 (0.83–3.55) 287,000 106,000 181,000 3.16¶ (1.38–5.40)Obesity (all) (556) 6,726,000 9.43 (6.78–12.97) 3.79 (2.20–6.04) 634,000 255,000 380,000 5.64 (3.66–7.88)
Obesity (severe) (228) 2,705,000 14.70 (10.01–20.51) 5.87 (3.20–9.76) 397,000 159,000 239,000 8.76 (4.68–13.93)Obesity (not severe) (328) 4,022,000 5.89 (2.91–10.44) 2.38 (0.66–5.96) 237,000 96,000 141,000 3.52 (1.84–5.52)
Abbreviations: BMI = body mass index; CI = confidence interval.* New guideline: adolescents aged 12–17 years were classified as having hypertension if mean systolic or diastolic blood pressure was ≥95th percentile (using 2017
percentile tables), or systolic blood pressure was ≥130 mmHg, or diastolic blood pressure was ≥80 mmHg, or the participant reported were taking antihypertensive medication (available for ages 16–19 years). Persons aged 18–19 years were classified as having hypertension if systolic blood pressure was ≥130 mmHg, or diastolic blood pressure was ≥80 mmHg, or if the participant reported taking antihypertensive medication.
† Former guideline: adolescents aged 12–17 years were classified as having hypertension if mean systolic or diastolic blood pressure was ≥95th percentile (using 2004 age, sex, and height percentile tables), or if the participant reported use of antihypertensive medication. For persons aged 18–19 years, hypertension was defined as systolic blood pressure was ≥140 mmHg, or diastolic blood pressure was ≥90 mmHg, or if the participant reported use of antihypertensive medication.
§ BMI is compared with age- and sex-specific reference values from the 2000 CDC growth charts (https://www.cdc.gov/growthcharts/cdc_charts.htm). Healthy = BMI-for-age ≥5th to <85th, overweight = BMI-for-age ≥85th to <95th percentile, obesity = BMI-for-age ≥95th percentile. Severe obesity = BMI-for-age ≥120% of the 95th percentile. Those classified as underweight are excluded.
¶ Indicates relative standard error >30%.
hypertension prevalence should be interpreted with caution, as the underlying causes of the decline are uncertain (7).
The findings in this report are subject to at least three addi-tional limitations. First, surveys such as NHANES are subject to selection and response bias, which might affect the accuracy of national estimates, despite use of weights and survey pro-cedures. Second, multiple BP measurements were taken on a single day, rather than spread over two or more visits as is recommended for diagnosis (3). Finally, self-reported medica-tion use data are subject to recall bias.
Reducing hypertension prevalence among youths is a Healthy People 2020 objective (HDS-5.2).¶¶ Lifestyle inter-ventions for youths with elevated BP or hypertension include increased physical activity and adoption of healthy eating pat-terns such as the Dietary Approaches to Stop Hypertension (DASH) diet (3). Sodium reduction in the food supply and promotion of physical activity in communities and schools are population strategies for improving cardiovascular health ¶¶ https://www.healthypeople.gov/2020/topics-objectives/topic/heart-disease-
and-stroke/objectives.
(10). Pediatricians, family physicians, public health profession-als, policy makers, parents, and schools can all be involved in efforts to address hypertension in the adolescent population.
SummaryWhat is already known about this topic?
Elevated blood pressure during adolescence is associated with cardiovascular risk in adulthood. In 2017, the American Academy of Pediatrics released a new guideline that changed the criteria for diagnosing hypertension.
What is added by this report?
Using the new guideline, an estimated 800,000 additional youths aged 12–19 years (especially older youths, males, and those with obesity) would be reclassified as having hypertension during 2013–2016, compared with using the former guideline.
What are the implications for public health practice?
Clinicians and researchers transitioning to the new guideline might expect more youths to be classified as having hyperten-sion. Efforts to address hypertension in youths include lifestyle and environmental strategies that promote cardiovascular health.
Morbidity and Mortality Weekly Report
762 MMWR / July 13, 2018 / Vol. 67 / No. 27 US Department of Health and Human Services/Centers for Disease Control and Prevention
Conflict of Interest
No conflicts of interest were reported.
1Division for Heart Disease and Stroke Prevention, National Center for Chronic Disease Prevention and Health Promotion, CDC; 2United States Public Health Service; 3Division of Nutrition, Physical Activity, and Obesity, National Center for Chronic Disease Prevention and Health Promotion, CDC.
Corresponding author: Sandra L. Jackson, [email protected], 770-488-4221.
References 1. Juhola J, Magnussen CG, Berenson GS, et al. Combined
effects of child and adult elevated blood pressure on subclinical atherosclerosis: the International Childhood Cardiovascular Cohort Consortium. Circulation 2013;128:217–24. https://doi.org/10.1161/CIRCULATIONAHA.113.001614
2. Chen X, Wang Y. Tracking of blood pressure from childhood to adulthood: a systematic review and meta-regression analysis. Circulation 2008;117:3171–80. https://doi.org/10.1161/CIRCULATIONAHA.107.730366
3. Flynn JT, Kaelber DC, Baker-Smith CM, et al.; Subcommittee on Screening and Management of High Blood Pressure in Children. Clinical practice guideline for screening and management of high blood pressure in children and adolescents. Pediatrics 2017;140:e20171904. https://doi.org/10.1542/peds.2017-1904
4. Sharma AK, Metzger DL, Rodd CJ. Prevalence and severity of high blood pressure among children based on the 2017 American Academy of Pediatrics Guidelines. JAMA Pediatr 2018;172:557–65. https://doi.org/10.1001/jamapediatrics.2018.0223
5. Flegal KM, Wei R, Ogden CL, Freedman DS, Johnson CL, Curtin LR. Characterizing extreme values of body mass index-for-age by using the 2000 Centers for Disease Control and Prevention growth charts. Am J Clin Nutr 2009;90:1314–20. https://doi.org/10.3945/ajcn.2009.28335
6. Kit BK, Kuklina E, Carroll MD, Ostchega Y, Freedman DS, Ogden CL. Prevalence of and trends in dyslipidemia and blood pressure among US children and adolescents, 1999–2012. JAMA Pediatr 2015;169:272–9. https://doi.org/10.1001/jamapediatrics.2014.3216
7. Yang Q, Zhong Y, Merritt R, Cogswell ME. Trends in high blood pressure among United States adolescents across body weight category between 1988 and 2012. J Pediatr 2016;169:166–73.e3. https://doi.org/10.1016/j.jpeds.2015.10.007
8. Gu X, Tucker KL. Dietary quality of the US child and adolescent population: trends from 1999 to 2012 and associations with the use of federal nutrition assistance programs. Am J Clin Nutr 2017;105:194–202. https://doi.org/10.3945/ajcn.116.135095
9. George MG, Tong X, Wigington C, Gillespie C, Hong Y. Hypertension screening in children and adolescents—National Ambulatory Medical Care Survey, National Hospital Ambulatory Medical Care Survey, and Medical Expenditure Panel Survey, United States 2007–2010. MMWR Suppl 2014;63(No. Suppl 2).
10. Lloyd-Jones DM, Hong Y, Labarthe D, et al.; American Heart Association Strategic Planning Task Force and Statistics Committee. Defining and setting national goals for cardiovascular health promotion and disease reduction: the American Heart Association’s strategic impact goal through 2020 and beyond. Circulation 2010;121:586–613. https://doi.org/10.1161/CIRCULATIONAHA.109.192703

Morbidity and Mortality Weekly Report
MMWR / July 13, 2018 / Vol. 67 / No. 27 763US Department of Health and Human Services/Centers for Disease Control and Prevention
Occupational Mercury Exposure at a Fluorescent Lamp Recycling Facility — Wisconsin, 2017
Erica Wilson, MD1,2; Jeffery S. Lafferty, PhD3; Robert Thiboldeaux, PhD2; Carrie Tomasallo, PhD2; Barbara Grajewski, PhD2; Ryan Wozniak, PhD2; Jonathan Meiman, MD2
On May 9, 2017, Public Health Madison & Dane County contacted the Wisconsin Division of Public Health for assis-tance with investigation of mercury exposure among workers at a fluorescent lamp recycling facility. Public Health Madison & Dane County had been contacted by the Wisconsin Department of Natural Resources as part of an investigation of potential environmental contamination at the facility. Fluorescent lamps are composed of a phosphor-coated glass tube containing mercury vapor and argon. During the recy-cling process, lamps are crushed, releasing mercury vapor and mercury-containing dusts. State and county health officials, in collaboration with Wisconsin Department of Natural Resources, conducted an investigation of mercury exposure of workers and an environmental assessment of the facility, surrounding areas, and worker vehicles. All five workers who were tested had urine mercury levels exceeding the American Conference of Governmental Industrial Hygienists (ACGIH) biologic exposure index of 20.0 µg/g creatinine, and two had tremor on physical exam. Workers wore inadequate personal protective equipment (PPE). Mercury levels in indoor air var-ied within the building, with a maximum of 207.4 µg/m3 at floor level on the crushing platform, approximately eightfold higher than the ACGIH threshold limit value of 25 µg/m3 (1). Mercury also was found in workers’ vehicles, indicating risk for take-home exposure. Workers at risk for mercury exposure need to have access to and consistently wear National Institute of Occupational Safety and Health (NIOSH)-approved respi-ratory protection for mercury vapor, nitrile or other suitable gloves to prevent contact exposure, and disposable suits with booties and change shoes before leaving the worksite to prevent take-home exposures.
On May 12, 2017, the Wisconsin Division of Public Health, Public Health Madison & Dane County, and the Occupational Safety and Health Administration (OSHA) conducted a facility site visit to assess the work environment, interview workers, and perform environmental monitoring. Workers were advised to be tested for mercury exposure, and spot urine testing was offered at the time of the site visit. A case of mercury exposure was defined as a urine spot mercury level above the ACGIH biologic exposure index of 20.0 µg/g creatinine in a facility worker. Twenty-four–hour urine samples were not obtained because of potential contamination at the work site during
urine collection. Workers who received a diagnosis of mer-cury exposure were referred to an occupational health clinic for further evaluation. All workers were asked to participate in a survey that included employment history, symptoms of mercury toxicity, PPE use, and medical and social history.
The 6,000–square-foot lamp recycling facility consisted of a large storage area with offices and kitchenette at the front and a break room at the back. A processing area with a drum-type crusher was located on one side of the storage area, and a bay door opened from the outside into the storage area on the opposite side. Ambient air sampling of the facility was conducted using a Lumex RA-915+ mercury vapor analyzer (Ohio Lumex Co., Inc.). Because of the timing of the unan-nounced visit, sampling was conducted when the facility was not processing; the bay door was open during sampling. Mercury vapors were measured just above floor level to assess spilled mercury and phosphor powder and at breathing height (approximately 4–5 feet above floor level) to assess worker exposure levels. The processing platform was approximately 4-feet high. All areas of the facility were sampled, including the facility entrance, reception area, office, kitchenette, hallways, bathroom, lockers, break room, and processing floor.
Potential for take-home mercury exposure was assessed by wipe-sampling workers’ vehicle foot pedals on June 20. All workers declined assessment of their homes for mercury contamination. Wisconsin Department of Natural Resources sampled water and fish from two nearby ponds on May 25 and June 19 to evaluate potential contamination from the facility.
Seven persons worked at the facility, including the owner-man-ager and six persons who worked in processing, administration, or as drivers. Workers’ mean age was 35 years (range = 23–50 years), six of seven workers were male, and mean duration of employ-ment at the facility was 2 years (range = 0–5 years). Five workers had worked at the facility for a previous owner who had been cited by OSHA for elevated air mercury levels and failure to use respirators after an investigation on September 2, 2016. Appropriate respirators with mercury vapor cartridges were provided to workers after that investigation.
Spot urine samples were obtained from four of the seven workers; a fifth worker’s spot urine sample was obtained 1 week later. Two workers declined testing. All five tested workers met the case definition for mercury exposure; the

Morbidity and Mortality Weekly Report
764 MMWR / July 13, 2018 / Vol. 67 / No. 27 US Department of Health and Human Services/Centers for Disease Control and Prevention
average urine mercury/creatinine ratio was 49.6 µg/g creatinine (range: >23.8–71.2 µg/g creatinine). Follow-up during June–September 2017 for three workers evaluated at an occupational health clinic and one evaluated at a primary care clinic included repeat spot urines and 24-hour urine collections (Table 1). Repeat testing showed a decrease in mercury levels in urine, blood, or both for two workers and indeterminate results in one worker. One worker continued to have elevated blood and urine mercury levels indicative of continued exposure.
Four workers completed the survey. The symptom most commonly reported was breathing difficulty (reported by all four workers), followed by memory loss, irritability, insomnia, headaches, and weakness (three of four). No worker reported difficulty walking. One worker reported tremor, and another reported muscle twitches.
Two of three processing workers wore rubber gloves, respira-tors, goggles, and disposable coveralls only while processing; the third wore only cloth gloves. Only one worker wore booties. One worker said he only started wearing PPE within the past month. No workers changed clothes or shoes before leaving the facility. Three workers attended an occupational health appointment with a physician during the 5 months after the initial investigation. One patient had no physical findings of mercury toxicity, one had tremor of the hands and head, and one had tremor of the fingers and a Mini Mental Status Exam score of 27/30 (normal >24/30). No prior Mini Mental Status Exam score was available for comparison.
Spot air sampling found mercury vapor concentrations of 0.2–6.8 µg/m3 outside of processing areas, with differences of up to 1 µg/m3 between ground level and breathing height measurements; higher mercury levels at the ground were
reported, compared with breathing height (Table 2). Inside the processing area, mercury levels were 9.0 µg/m3 at the entrance and reached a maximum of 207.4 µg/m3 on the floor of the processing platform and 99.7 µg/m3 at breathing level on the processing platform ramp.
Wipe samples from the cars of two workers determined the presence of mercury, indicating a risk for take-home exposure. Samples of water and fish from two nearby ponds found mer-cury levels consistent with regional freshwater mercury levels.
Discussion
Workers at the lamp recycling facility were exposed to mercury in the air, had elevated urine mercury levels, and experienced signs and symptoms of mercury toxicity. Previous investigations have reported that 33% of mercury is released from bulbs in the first 8 hours after breakage (2), and that processing in an open area decreases exposure (3). According to a U.S. Department of Energy report, approximately 3.8 billion fluorescent lamps were installed in the United States during 2010 (4). Recycling used fluorescent lamps prevents release of mercury and other metals into the environment and allows reclamation of materials for reuse. Wisconsin state law requires businesses and institutions to recycle used fluorescent bulbs (5).
The risk for mercury exposure in the manufacturing of fluorescent lamps has been known since the first investigation of a fluorescent lamp manufacturer in 1965 reported elevated urine mercury levels among glass blowers who made and repaired lamps (6). However, risks associated with fluorescent lamp recycling have not been well documented. A case study reported membranous nephropathy and elevated mercury levels in two workers at a fluorescent lamp recycling facility
TABLE 1. Urine and blood mercury test results and personal protective equipment usage for workers at a fluorescent lamp recycling facility — Wisconsin, 2017
Worker ID*
Years at facility Duties
Test 1 (0 wks)†
Test 2 (2–3 wks)
Test 3 (8–10 wks)
Test 4 (11 wks)
Test 5 (15 wks)
Use of PPESpot urine (µg/g Cr)§
Blood (µg/L)¶
Spot urine (µg/g Cr)§
24-hr urine (µg/L)**
24-hr urine (µg/L)**
Blood (µg/L)¶
24-hr urine (µg/L)**
24-hr urine (µg/L)**
1 0 Management —†† —†† —†† —†† —†† —†† —†† —†† Unknown2 4 Sales/Logistics/Admin 71.2 24 >75 —†† 44 38 —†† —†† No3 1.5 Driver 39.2 —†† —†† —†† —†† —†† —†† —†† Unknown4 2 Warehouse/Sorting/Processing 64.0 —†† —†† 37 —†† —†† —†† —†† Inconsistent5 5 Warehouse/Sorting/Processing >23.8 —†† —†† 28 —†† —†† —†† —†† No6 1.5 Warehouse/Sorting/Processing 50.0 12 81.4 —†† 85 35 86 109 Inconsistent7 0 Driver —†† —†† —†† —†† —†† —†† —†† —†† Unknown
Abbreviation: Cr = creatinine, PPE = personal protective equipment. * Workers 1 and 7 declined testing. † First test May 2017. § American Conference of Governmental Industrial Hygienists biologic exposure index = 20.0 µg/g Cr. ¶ American Conference of Governmental Industrial Hygienists biologic exposure index = 15 µg/L. ** The biologic exposure index is determined by the American Conference of Governmental Industrial Hygienists as a guideline to assist in the control of health
hazards by industrial hygienists; however, no biologic exposure index or consensus standard exists for 24-hour urine testing. The analyzing lab indicated that the normal range is <10 µg/L.
†† Not tested.

Morbidity and Mortality Weekly Report
MMWR / July 13, 2018 / Vol. 67 / No. 27 765US Department of Health and Human Services/Centers for Disease Control and Prevention
TABLE 2. Mercury vapor air sampling results at a fluorescent lamp recycling facility* — Wisconsin, 2017
Location
Mercury vapor concentration (µg/m3)†
Floor level Breathing height§
20 Feet from warehouse entrance —¶ 0.3Warehouse entrance —¶ 0.2–1.710 Feet inside warehouse —¶ 3.2–3.520 feet inside warehouse, ground level 5.7–6.0 —¶
Entrance of warehouse office —¶ 4.0–5.0Inside office 4–4.5 2.5–3.0Reception area 3.5 3.8Main office 3.7 2.7Main office kitchenette —¶ 3.1–3.5Hallway 5.5 4.8Office bathroom —¶ 5.4Break room —¶ 6.4–6.8Center of warehouse —¶ 3.1Near lockers and Tyvek suits —¶ 2.7–3.0Back storage area, near forklift —¶ 2.8Entrance to processing area —¶ 910 Feet inside processing area, near
crushing door—¶ 38.1–57.9
On top of crushing platform 138.5–207.4 32.9Back of processing, side door —¶ 82.8Processing floor 85.1–100 —¶
Processing ramp —¶ 99.7
* Using a Lumex RA-915+ mercury vapor analyzer (LumexCo. Inc.).† Occupational Safety and Health Administration permissible exposure
limit = 0.1 µg/m3; National Institute for Occupational Safety and Health recommended exposure limit = 0.05 µg/m3; and American Conference of Governmental Industrial Hygienists threshold limit value = 0.025 µg/m3.
§ Breathing height is approximately 4–5 feet above the floor.¶ Not tested.
(7), and two studies have demonstrated levels of mercury vapor exceeding OSHA permissible exposure limit during processing of fluorescent lamps using drum-type crushers (3,8).
In this investigation, environmental measurements likely underestimated workers’ exposure to mercury because pro-cessing was suspended during the site visit and the bay door was open during sampling. Although the spot environmental mercury vapor concentrations measured in this investigation cannot be directly compared with the time-weighted averages used in OSHA (9), NIOSH (10), and ACGIH (1) guidelines, this investigation indicates increased risk for adverse health effects from mercury exposure to workers in fluorescent lamps recycling facilities, with potential for take-home exposure and environmental contamination. Despite changes implemented after the 2016 OSHA investigation that included access to correct respirators, workers did not consistently use PPE and had elevated mercury levels. To mitigate risks to workers, employers need to implement engineering control technology and housekeeping (mercury appropriate vacuum, regular clean-ing of surfaces with correct disposal of cleaning equipment) to reduce mercury contamination at their facilities. A clear protection program policy needs to be provided, and workers
SummaryWhat is already known about this topic?
The risk for mercury exposure from manufacture of fluorescent lights has been known for many years; risks for exposure from recycling are not well documented.
What is added by this report?
An investigation of environmental contamination at a fluores-cent light recycling facility in Wisconsin in 2017 found elevated mercury levels among five of seven workers and clinical signs of mercury toxicity in two. Use of personal protective equipment was inconsistent, and mercury levels for inside air exceeded recommended thresholds.
What are the implications for public health practice?
Employers at fluorescent light recycling facilities need to implement control technology, housekeeping, and exposure monitoring, and provide recommended PPE and training to their workers to reduce mercury exposures at their facilities.
need to receive training in PPE and wear the PPE needed for their task. In addition to reducing mercury exposure with engineering and administrative controls, regular mercury control housekeeping needs to be used. Periodic monitoring can be considered to ensure employee exposures remain within existing recommended limits.
Acknowledgments
John Hausbeck, Molly Young, Public Health Madison & Dane County, Madison, Wisconsin; Michael Metcalf, Bureau of Environmental and Occupational Health, Wisconsin Department of Health Services.
Conflict of Interest
No conflicts of interest were reported.
1Epidemic Intelligence Service, CDC; 2Bureau of Environmental and Occupational Health, Wisconsin Department of Health Services; 3Public Health Madison & Dane County, Madison, Wisconsin.
Corresponding author: Erica Wilson, [email protected], 608-266-5421.
References 1. American Conference of Governmental Industrial Hygienists. 2015
TLVs and BEIs: based on the documentation of the threshold limit values for chemical substances and physical agents 2015. Cincinnatti, OH: ACGIH Signature Publications; 2015.
2. Aucott M, McLinden M, Winka M. Release of mercury from broken fluorescent bulbs. J Air Waste Manag Assoc 2003;53:143–51. https://doi.org/10.1080/10473289.2003.10466132
3. Lucas A, Emery R. Assessing occupational mercury exposures during the on-site processing of spent fluorescent lamps. J Environ Health 2006;68:30–4, 40, 45.
4. Ashe M, Chwastyk D. Monasterio CD, Gupta M, Pegors M. 2010 U.S. lighting market characterization. Washington, DC: US Department of Energy; 2012.

Morbidity and Mortality Weekly Report
766 MMWR / July 13, 2018 / Vol. 67 / No. 27 US Department of Health and Human Services/Centers for Disease Control and Prevention
5. Wisconsin Department of Natural Resources. Recycling light bulbs. Madison, WI: Wisconsin Department of Natural Resources; 2017. https://dnr.wi.gov/topic/Recycling/bulbs.html
6. Lob M. Intoxications chroniques par le mercure dans l’industrie des tubes luminescents. Arch Mal Prof Med Trav Secur Soc 1965;26:289–92.
7. Aymaz S, Gross O, Krakamp B, Ortmann M, Dienes HP, Weber M. Membranous nephropathy from exposure to mercury in the fluorescent-tube-recycling industry. Nephrol Dial Transplant 2001;16:2253–5. https://doi.org/10.1093/ndt/16.11.2253
8. Kirschner DS, Billau RL, Macdonald TJ. Fluorescent light tube compaction: evaluation of employee exposure to airborne mercury. Applied Industrial Hygiene 1988;3:129–31. https://doi.org/10.1080/08828032.1988.10388528
9. Occupational Safety and Health Administration. Protecting workers from mercury exposure while crushing and recycling fluorescent bulbs. Washington, DC: US Department of Labor, Occupational Safety and Health Administration; 2012. https://www.osha.gov/Publications/mercuryexposure_fluorescentbulbs_factsheet.html
10. National Institute for Occupational Safety and Health. NIOSH pocket guide to chemical hazards: mercury compounds [except (organo) alkyls](as Hg). Atlanta, GA: US Department of Health and Human Services, CDC; 2016. https://www.cdc.gov/niosh/npg/npgd0383.html

Morbidity and Mortality Weekly Report
MMWR / July 13, 2018 / Vol. 67 / No. 27 767US Department of Health and Human Services/Centers for Disease Control and Prevention
Notes from the Field
Overdose Deaths with Carfentanil and Other Fentanyl Analogs Detected — 10 States, July 2016–June 2017
Julie O’Donnell, PhD1; R. Matthew Gladden, PhD1; Christine L. Mattson, PhD1; Mbabazi Kariisa, PhD1
Fentanyl and fentanyl analogs are increasingly involved in opioid overdose deaths, and new fentanyl analogs continue to be identified (1). Carfentanil, the most potent fentanyl analog detected in the United States, is intended for sedation of large animals and is estimated to have 10,000 times the potency of morphine (2). It has recently been reported in an alarming number of deaths in some states. Ohio reported nearly 400 carfentanil-involved deaths during July–December 2016, and Florida reported >500 such deaths for all of 2016 (3,4).
CDC funds 32 states and the District of Columbia (DC) to abstract detailed data on opioid overdose deaths from death certificates and medical examiner and coroner reports through the State Unintentional Drug Overdose Reporting System (SUDORS). Twelve states began reporting in August 2017, and 20 states and DC will begin reporting in August 2018.* CDC analyzed trends in overdose deaths testing positive for carfen-tanil and other fentanyl analogs during July 2016–June 2017 in 10 SUDORS states (Kentucky, Maine, Massachusetts, New Hampshire, New Mexico, Ohio, Oklahoma, Rhode Island, West Virginia, and Wisconsin).† States abstract data on all substances (both opioids and nonopioids) that contributed to death, as well as all substances for which the decedent tested positive.§
* CDC’s Enhanced State Opioid Overdose Surveillance (ESOOS) program funded 12 states through a competitive application process in fiscal year 2016 and an additional 32 states and the District of Columbia in fiscal year 2017. States are funded to collect and share data on fatal and nonfatal opioid overdoses. The State Unintentional Drug Overdose Reporting System (SUDORS) is the component of ESOOS that collects data on fatal opioid overdoses. https://www.cdc.gov/drugoverdose/foa/state-opioid-mm.html.
† Data for the period from July 2016 through June 2017 were collected only by the 12 states that began reporting in August 2017 (Kentucky, Maine, Massachusetts, Missouri, New Hampshire, New Mexico, Ohio, Oklahoma, Pennsylvania, Rhode Island, West Virginia, and Wisconsin). At the time of reporting, data for Missouri and Pennsylvania were not complete and were therefore excluded.
§ SUDORS estimates of opioid-involved overdose deaths might differ from those of the National Vital Statistics System because SUDORS uses preliminary death certificate data and collects additional information from medical examiner and coroner reports, which are abstracted within 8 months of death. In SUDORS, an opioid-involved overdose death either was identified through review of the medical examiner/coroner report or had International Classification of Disease, Tenth Revision (ICD-10) underlying cause-of-death codes X40–44 (unintentional) or Y10–Y14 (undetermined) and multiple cause-of-death codes of T40.0, T40.1, T40.2, T40.3, T40.4, or T40.6 on the death certificate. Data for this report were downloaded on April 25, 2018, and might differ from reports using earlier data.
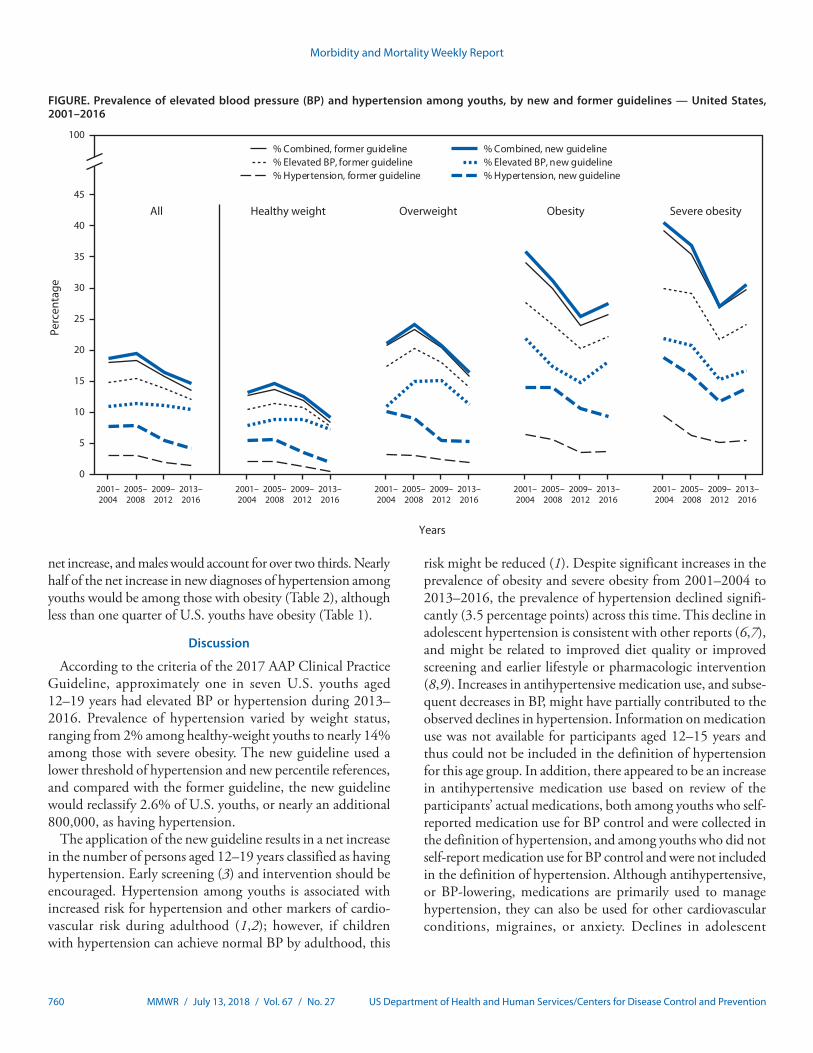
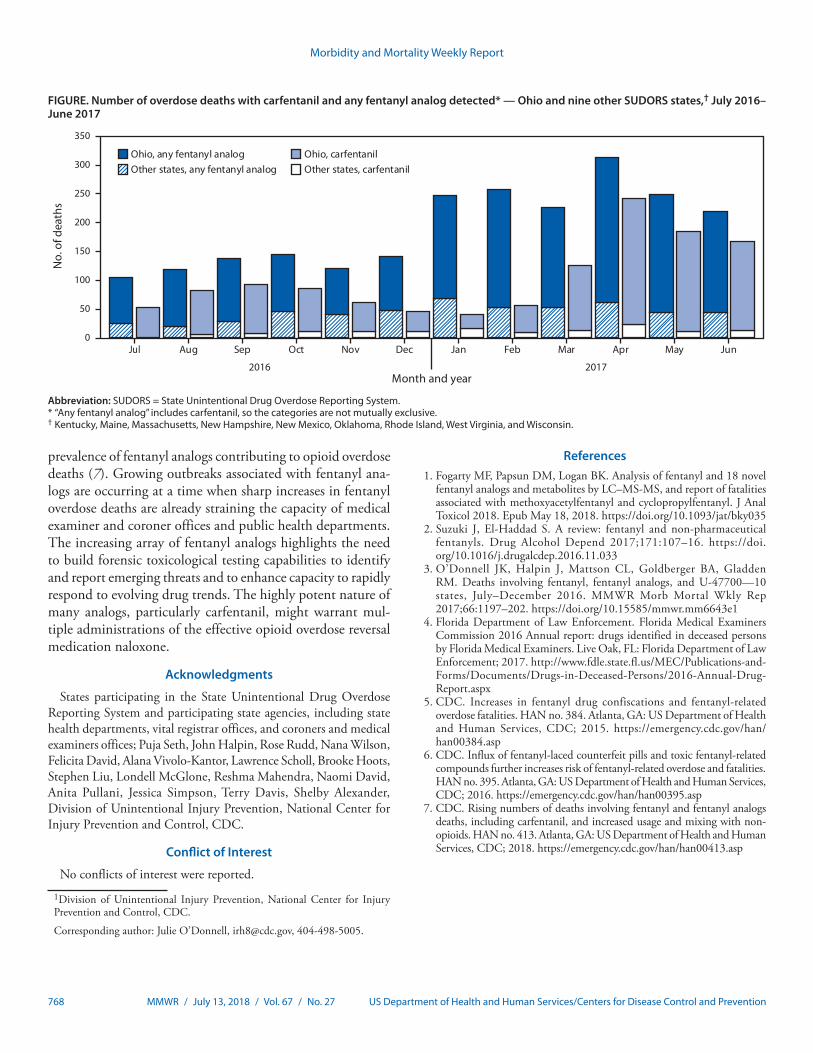
During July 2016–June 2017, among 11,045 opioid over-dose deaths, 2,275 (20.6%) decedents tested positive for any fentanyl analog, and 1,236 (11.2%) tested positive for carfentanil. Fourteen different fentanyl analogs were detected.¶ Among overdose deaths with fentanyl analogs detected, the analogs were determined by medical examiners or coroners to have contributed to the death in >95% of deaths. During the first half of 2017, the number of deaths with any fentanyl analog detected (1,511) nearly doubled, compared with the number during the second half of 2016 (764); deaths with carfentanil detected increased 94%, from 421 to 815. The pro-portions of deaths with any fentanyl analog or with carfentanil detected nearly doubled during this period.
Ohio reported the largest numbers and most substantial increases in deaths with any fentanyl analog detected, including carfentanil (Figure). The number of carfentanil deaths in Ohio initially peaked in September 2016 (86 deaths), decreased dur-ing October 2016–February 2017, and peaked again in April 2017 (218 deaths). Changes in the number of deaths with any fentanyl analog detected mirrored changes in deaths with carfentanil detected, except during October 2016–February 2017, when deaths with carfentanil decreased. During this period, the number of deaths with any fentanyl analog detected instead increased, mainly driven by acrylfentanyl (202 deaths) and furanylfentanyl (192 deaths). The number of deaths with carfentanil present in other states followed a similar pattern, with peaks occurring slightly after those in Ohio. During the first half of 2017, seven states reported detecting carfentanil in overdose deaths, compared with three during the second half of 2016; the number of counties in which overdose deaths with carfentanil present occurred increased from 54 to 77.
In 2015, CDC issued a nationwide public health advisory about increases in fentanyl-related overdose deaths in multiple states (5), and in 2016 issued an update to that advisory to warn about increasing availability of fentanyl and fentanyl-related substances being pressed into counterfeit pills, and the potential for broad distribution across the United States (6). In response to findings in SUDORS data, on July 11, 2018, CDC issued a second update highlighting the emerging
¶ Fentanyl analogs detected in at least one death: 3-methylfentanyl, 4-fluorobutyrfentanyl, 4-fluorofentanyl, 4-fluoroisobutyrfentanyl, acetylfentanyl, acrylfentanyl, butyrylfentanyl, carfentanil, cyclopropylfentanyl, cyclopentylfentanyl, furanylethylfentanyl, furanylfentanyl, isobutyrylfentanyl, and tetrahydrofuranylfentanyl. Decedents might have tested positive for more than one analog, as well as for other opioid and nonopioid substances. Multiple substances could have been used separately or mixed together, either with or without the decedents’ knowledge.
Morbidity and Mortality Weekly Report
768 MMWR / July 13, 2018 / Vol. 67 / No. 27 US Department of Health and Human Services/Centers for Disease Control and Prevention
FIGURE. Number of overdose deaths with carfentanil and any fentanyl analog detected* — Ohio and nine other SUDORS states,† July 2016–June 2017
Jul Aug Sep Oct
2016 2017
Nov Dec Jan Feb Mar Apr May Jun
No.
of d
eath
s
Month and year
Ohio, any fentanyl analog Ohio, carfentanilOther states, any fentanyl analog Other states, carfentanil
0
50
100
150
200
250
300
350
Abbreviation: SUDORS = State Unintentional Drug Overdose Reporting System.* “Any fentanyl analog” includes carfentanil, so the categories are not mutually exclusive.† Kentucky, Maine, Massachusetts, New Hampshire, New Mexico, Oklahoma, Rhode Island, West Virginia, and Wisconsin.
prevalence of fentanyl analogs contributing to opioid overdose deaths (7). Growing outbreaks associated with fentanyl ana-logs are occurring at a time when sharp increases in fentanyl overdose deaths are already straining the capacity of medical examiner and coroner offices and public health departments. The increasing array of fentanyl analogs highlights the need to build forensic toxicological testing capabilities to identify and report emerging threats and to enhance capacity to rapidly respond to evolving drug trends. The highly potent nature of many analogs, particularly carfentanil, might warrant mul-tiple administrations of the effective opioid overdose reversal medication naloxone.
Acknowledgments
States participating in the State Unintentional Drug Overdose Reporting System and participating state agencies, including state health departments, vital registrar offices, and coroners and medical examiners offices; Puja Seth, John Halpin, Rose Rudd, Nana Wilson, Felicita David, Alana Vivolo-Kantor, Lawrence Scholl, Brooke Hoots, Stephen Liu, Londell McGlone, Reshma Mahendra, Naomi David, Anita Pullani, Jessica Simpson, Terry Davis, Shelby Alexander, Division of Unintentional Injury Prevention, National Center for Injury Prevention and Control, CDC.
Conflict of Interest
No conflicts of interest were reported.
1Division of Unintentional Injury Prevention, National Center for Injury Prevention and Control, CDC.
Corresponding author: Julie O’Donnell, [email protected], 404-498-5005.
References1. Fogarty MF, Papsun DM, Logan BK. Analysis of fentanyl and 18 novel
fentanyl analogs and metabolites by LC–MS-MS, and report of fatalities associated with methoxyacetylfentanyl and cyclopropylfentanyl. J Anal Toxicol 2018. Epub May 18, 2018. https://doi.org/10.1093/jat/bky035
2. Suzuki J, El-Haddad S. A review: fentanyl and non-pharmaceutical fentanyls. Drug Alcohol Depend 2017;171:107–16. https://doi.org/10.1016/j.drugalcdep.2016.11.033
3. O’Donnell JK, Halpin J, Mattson CL, Goldberger BA, Gladden RM. Deaths involving fentanyl, fentanyl analogs, and U-47700—10 states, July–December 2016. MMWR Morb Mortal Wkly Rep 2017;66:1197–202. https://doi.org/10.15585/mmwr.mm6643e1
4. Florida Department of Law Enforcement. Florida Medical Examiners Commission 2016 Annual report: drugs identified in deceased persons by Florida Medical Examiners. Live Oak, FL: Florida Department of Law Enforcement; 2017. http://www.fdle.state.fl.us/MEC/Publications-and-Forms/Documents/Drugs-in-Deceased-Persons/2016-Annual-Drug-Report.aspx
5. CDC. Increases in fentanyl drug confiscations and fentanyl-related overdose fatalities. HAN no. 384. Atlanta, GA: US Department of Health and Human Services, CDC; 2015. https://emergency.cdc.gov/han/han00384.asp
6. CDC. Influx of fentanyl-laced counterfeit pills and toxic fentanyl-related compounds further increases risk of fentanyl-related overdose and fatalities. HAN no. 395. Atlanta, GA: US Department of Health and Human Services, CDC; 2016. https://emergency.cdc.gov/han/han00395.asp
7. CDC. Rising numbers of deaths involving fentanyl and fentanyl analogs deaths, including carfentanil, and increased usage and mixing with non-opioids. HAN no. 413. Atlanta, GA: US Department of Health and Human Services, CDC; 2018. https://emergency.cdc.gov/han/han00413.asp

Morbidity and Mortality Weekly Report
MMWR / July 13, 2018 / Vol. 67 / No. 27 769US Department of Health and Human Services/Centers for Disease Control and Prevention
Notes from the Field
Toxic Leukoencephalopathy Associated with Tianeptine Misuse — California, 2017Robert Goodnough, MD1,2; Kai Li, MD1,2; Fatemeh Fouladkou, PhD3;
Kara L. Lynch, PhD3; Maulik Shah, MD4; Craig G. Smollin, MD1,2; Paul D. Blanc, MD1,5
During the early morning of October 10, 2017, a California man aged 24 years was noted to be lethargic with slurred speech; at 2:30 p.m., he was found unresponsive. Emergency medical services transported him to an emergency depart-ment. The patient had a 2-year history of tianeptine misuse. Tianeptine is an atypical tricyclic antidepressant that enhances serotonin uptake, increases dopamine signaling, modulates glutamate signaling, and stimulates mu (µ) and delta (δ) opioid receptors (1,2). Tianeptine is taken for its anxiolytic, mood-enhancement, and euphoric effects (3). The patient had recent concomitant misuse of phenibut (β-Phenyl-γ-aminobutyric acid), a central nervous system depressant. Neither tianeptine nor phenibut is licensed in the United States; both were pur-chased online. The patient’s medical history included sleep apnea, depression, anxiety, and attention deficit hyperactivity disorder (treated with methylphenidate). He occasionally misused prescription benzodiazepines and opiates, reportedly taken from family members.
Upon hospitalization, the patient was comatose but with intact brainstem reflexes and was intubated because of a low respiratory rate. An initial urine toxicology screen was positive only for marijuana. Two days after admission, brain magnetic resonance imaging (MRI) indicated diffuse white matter dam-age characteristic of toxic leukoencephalopathy. The patient was transferred to a tertiary care facility. On October 15, repeat MRI imaging confirmed leukoencephalopathy involv-ing almost the entire supratentorial white matter. The patient’s neurologic status deteriorated with development of prolonged extensor and flexor posturing and loss of brainstem reflexes; he died 19 days after his initial admission.
Serum from October 10 was tested for a range of exogenous substances by liquid chromatography–high resolution mass spectrometry. The tianeptine level was 3,000 ng/mL (therapeu-tic range = 278–366 ng/mL) (3); phenibut was undetectable. Benzodiazepines and their metabolites within therapeutic ranges included clonazepam, 7-aminoclonazepam, midazolam, and alpha-hydroxymidazolam. Also detected were the central nervous system stimulant methylphenidate; tetrahydrocan-nabinol (THC) (the psychoactive constituent of cannabis); and its metabolite, hydroxyl-THC. The comprehensive blood testing and the initial urine screen were negative for opiates.
Given the role of tianeptine in this patient’s outcome, and its potential for public health impact, an adverse event report has been filed with the Food and Drug Administration.
Tianeptine overdose fatalities are associated with serum concentrations ranging from 4,000 to 18,000 ng/mL (4). Tianeptine dependence and a withdrawal syndrome of anxiety, sweating, myalgias, chills, and depression have been described (2). This is the first known case of toxic leukoencephalopathy reported associated with tianeptine. Toxic leukoencephalopa-thy can be distinguished from leukoencephalopathy associated with hypoxia by delayed onset and by radiographic features. Other illicit toxicants have been associated with acute toxic leu-koencephalopathy, including inhalation of heroin combustion byproducts (“chasing the dragon”) (5). The patient’s tianeptine use, with a blood concentration an order of magnitude higher than therapeutic levels, implicates it in this patient’s acute illness and findings although this does not confirm causality. The absence of supratherapeutic levels of other pharmaceuti-cals reduces the likelihood that they directly led to leukoen-cephalopathy although drug interactions cannot be excluded as contributors. The negative urine and blood testing for opiates and the absence of a history of heroin inhalation make this an unlikely etiology for the leukoencephalopathy in this case. Other pharmaceuticals have been implicated in toxic leuko-encephalopathy, further precluding any definitive etiological conclusion based on a single observation. Nevertheless, this case highlights the potential of tianeptine misuse to emerge as a public health issue, whether used alone or in the context of polysubstance use. Health care providers should be aware of tianeptine misuse, including its potential link to severe adverse outcomes.
Conflict of Interest
No conflicts of interest were reported.
1California Poison Control System San Francisco Division; 2Department of Emergency Medicine, University of California San Francisco; 3Department of Laboratory Medicine, University of California San Francisco; 4Department of Neurology, University of California San Francisco; 5Division of Occupational and Environmental Medicine, Department of Medicine, University of California San Francisco.
Corresponding author: Robert Goodnough, [email protected], 415-206-5752.
References1. McEwen BS, Chattarji S, Diamond DM, et al. The neurobiological
properties of tianeptine (Stablon): from monoamine hypothesis to glutamatergic modulation. Mol Psychiatry 2010;15:237–49. https://doi.org/10.1038/mp.2009.80

Morbidity and Mortality Weekly Report
770 MMWR / July 13, 2018 / Vol. 67 / No. 27 US Department of Health and Human Services/Centers for Disease Control and Prevention
2. Springer J, Cubała WJ. Tianeptine abuse and dependence in psychiatric patients: a review of 18 case reports in the literature. J Psychoactive Drugs 2018;1:1–6. https://doi.org/10.1080/02791072.2018.1438687
3. Dresse A, Rosen JM, Brems H, Masset H, Defrance R, Salvadori C. Influence of food on tianeptine and its main metabolite kinetics. J Clin Pharmacol 1988;28:1115–9. https://doi.org/10.1002/j.1552-4604.1988.tb05726.x
4. Baselt RC. Disposition of toxic drugs and chemicals in man. 7th ed. Foster City, CA: Biomedical Publications; 2004.
5. Buxton JA, Sebastian R, Clearsky L, et al. Chasing the dragon—characterizing cases of leukoencephalopathy associated with heroin inhalation in British Columbia. Harm Reduct J 2011;8:3. https://doi.org/10.1186/1477-7517-8-3

Morbidity and Mortality Weekly Report
MMWR / July 13, 2018 / Vol. 67 / No. 27 771US Department of Health and Human Services/Centers for Disease Control and Prevention
QuickStats
FROM THE NATIONAL CENTER FOR HEALTH STATISTICS
Percentage of Adults Aged ≥20 Years Told Their Cholesterol Was High Who Were Taking Lipid-Lowering Medications,* by Sex and Age Group — National
Health and Nutrition Examination Survey, 2005–2006 to 2015–2016
0
10
20
30
40
50
60
100
2005–2006
2007–2008
2009–2010
2011–2012
2013–2014
2015–2016
20–39 yrs 40–59 yrs ≥60 yrs
Men
2005–2006
2007–2008
2009–2010
2011–2012
2013–2104
2015–2016
Women
Survey years
Perc
enta
ge
* Based on a positive response to the question “Are you currently taking lipid-lowering medication?” asked of adults who had been told by a health professional that their cholesterol was high.
The percentage of men told by a health professional that their cholesterol was high who were taking lipid-lowering medications increased from 36% in 2005–2006 to 50% in 2015–2016 among those aged ≥60 years but not among those aged 20–39 years (1% to 2%) or 40–59 years (16% to 17%). The percentage taking lipid-lowering medications also increased (from 33% to 38%) among women aged ≥60 years but not among women aged 20–39 years (1% to 0.7%) or 40–59 years (from 13% to 11%). For each survey year from 2005–2006 to 2015–2016, the percentage of both men and women with high cholesterol taking lipid-lowering medications was higher among those aged ≥60 years than those in younger age groups.
Sources: Carroll MD, Mussilino ME, Wolz M, Srinivas PR. Trends in apolipoprotein B, non–high-density lipoprotein, and low-density lipoprotein for adults 60 years and older by use of lipid-lowering medications: United States, 2005–2006 to 2013–2014 [Research Letter]. Circulation 2018;138:208–10. http://circ.ahajournals.org/content/138/2/208.
National Center for Health Statistics, National Health and Nutrition Examination Survey, 2015–2016. https://www.cdc.gov/nchs/nhanes.htm.
Reported by: Margaret D. Carroll, MSPH, [email protected], 301-458-4136.

Morbidity and Mortality Weekly Report
ISSN: 0149-2195 (Print)
The Morbidity and Mortality Weekly Report (MMWR) Series is prepared by the Centers for Disease Control and Prevention (CDC) and is available free of charge in electronic format. To receive an electronic copy each week, visit MMWR at https://www.cdc.gov/mmwr/index.html.
Readers who have difficulty accessing this PDF file may access the HTML file at https://www.cdc.gov/mmwr/index2018.html. Address all inquiries about the MMWR Series, including material to be considered for publication, to Executive Editor, MMWR Series, Mailstop E-90, CDC, 1600 Clifton Rd., N.E., Atlanta, GA 30329-4027 or to [email protected].
All material in the MMWR Series is in the public domain and may be used and reprinted without permission; citation as to source, however, is appreciated.
Use of trade names and commercial sources is for identification only and does not imply endorsement by the U.S. Department of Health and Human Services.
References to non-CDC sites on the Internet are provided as a service to MMWR readers and do not constitute or imply endorsement of these organizations or their programs by CDC or the U.S. Department of Health and Human Services. CDC is not responsible for the content of these sites. URL addresses listed in MMWR were current as of the date of publication.