Estimating prevalence of subjective cognitive decline in ...
14
RESEARCH Open Access Estimating prevalence of subjective cognitive decline in and across international cohort studies of aging: a COSMIC study Susanne Röhr 1,2* , Alexander Pabst 1 , Steffi G. Riedel-Heller 1 , Frank Jessen 3,4 , Yuda Turana 5 , Yvonne S. Handajani 6 , Carol Brayne 7 , Fiona E. Matthews 8,9 , Blossom C. M. Stephan 9 , Richard B. Lipton 10,11,12 , Mindy J. Katz 10 , Cuiling Wang 11 , Maëlenn Guerchet 13,14,15 , Pierre-Marie Preux 13,14,16 , Pascal Mbelesso 13,14,17 , Karen Ritchie 18,19 , Marie-Laure Ancelin 18 , Isabelle Carrière 18 , Antonio Guaita 20 , Annalisa Davin 20 , Roberta Vaccaro 20 , Ki Woong Kim 21,22,23 , Ji Won Han 21 , Seung Wan Suh 22 , Suzana Shahar 24 , Normah C. Din 25 , Divya Vanoh 26 , Martin van Boxtel 27 , Sebastian Köhler 27 , Mary Ganguli 28,29,30 , Erin P. Jacobsen 28 , Beth E. Snitz 29 , Kaarin J. Anstey 31,32,33 , Nicolas Cherbuin 33 , Shuzo Kumagai 34 , Sanmei Chen 35 , Kenji Narazaki 36 , Tze Pin Ng 37 , Qi Gao 37 , Xinyi Gwee 37 , Henry Brodaty 38,39 , Nicole A. Kochan 38 , Julian Trollor 38,40 , Antonio Lobo 41,42 , Raúl López-Antón 41,43 , Javier Santabárbara 41,44 , John D. Crawford 38 , Darren M. Lipnicki 38 , Perminder S. Sachdev 38,39 and for Cohort Studies of Memory in an International Consortium (COSMIC) Abstract Background: Subjective cognitive decline (SCD) is recognized as a risk stage for Alzheimer’s disease (AD) and other dementias, but its prevalence is not well known. We aimed to use uniform criteria to better estimate SCD prevalence across international cohorts. Methods: We combined individual participant data for 16 cohorts from 15 countries (members of the COSMIC consortium) and used qualitative and quantitative (Item Response Theory/IRT) harmonization techniques to estimate SCD prevalence. (Continued on next page) © The Author(s). 2020 Open Access This article is licensed under a Creative Commons Attribution 4.0 International License, which permits use, sharing, adaptation, distribution and reproduction in any medium or format, as long as you give appropriate credit to the original author(s) and the source, provide a link to the Creative Commons licence, and indicate if changes were made. The images or other third party material in this article are included in the article's Creative Commons licence, unless indicated otherwise in a credit line to the material. If material is not included in the article's Creative Commons licence and your intended use is not permitted by statutory regulation or exceeds the permitted use, you will need to obtain permission directly from the copyright holder. To view a copy of this licence, visit http://creativecommons.org/licenses/by/4.0/. The Creative Commons Public Domain Dedication waiver (http://creativecommons.org/publicdomain/zero/1.0/) applies to the data made available in this article, unless otherwise stated in a credit line to the data. * Correspondence: [email protected] 1 Institute of Social Medicine, Occupational Health and Public Health (ISAP), Medical Faculty, University of Leipzig, Philipp-Rosenthal-Straße 55, 04103 Leipzig, Germany 2 Global Brain Health Institute (GBHI), Trinity College Dublin, Dublin, Ireland Full list of author information is available at the end of the article Röhr et al. Alzheimer's Research & Therapy (2020) 12:167 https://doi.org/10.1186/s13195-020-00734-y
Transcript of Estimating prevalence of subjective cognitive decline in ...

RESEARCH Open Access
Estimating prevalence of subjectivecognitive decline in and acrossinternational cohort studies of aging: aCOSMIC studySusanne Röhr1,2* , Alexander Pabst1, Steffi G. Riedel-Heller1, Frank Jessen3,4, Yuda Turana5, Yvonne S. Handajani6,Carol Brayne7, Fiona E. Matthews8,9, Blossom C. M. Stephan9, Richard B. Lipton10,11,12, Mindy J. Katz10,Cuiling Wang11, Maëlenn Guerchet13,14,15, Pierre-Marie Preux13,14,16, Pascal Mbelesso13,14,17, Karen Ritchie18,19,Marie-Laure Ancelin18, Isabelle Carrière18, Antonio Guaita20, Annalisa Davin20, Roberta Vaccaro20,Ki Woong Kim21,22,23, Ji Won Han21, Seung Wan Suh22, Suzana Shahar24, Normah C. Din25, Divya Vanoh26,Martin van Boxtel 27, Sebastian Köhler27, Mary Ganguli28,29,30, Erin P. Jacobsen28, Beth E. Snitz 29,Kaarin J. Anstey 31,32,33, Nicolas Cherbuin33, Shuzo Kumagai34, Sanmei Chen35, Kenji Narazaki36, Tze Pin Ng37,Qi Gao37, Xinyi Gwee 37, Henry Brodaty38,39, Nicole A. Kochan 38, Julian Trollor38,40, Antonio Lobo41,42,Raúl López-Antón41,43, Javier Santabárbara41,44, John D. Crawford 38, Darren M. Lipnicki 38,Perminder S. Sachdev 38,39 and for Cohort Studies of Memory in an International Consortium (COSMIC)
Abstract
Background: Subjective cognitive decline (SCD) is recognized as a risk stage for Alzheimer’s disease (AD) and otherdementias, but its prevalence is not well known. We aimed to use uniform criteria to better estimate SCD prevalenceacross international cohorts.
Methods: We combined individual participant data for 16 cohorts from 15 countries (members of the COSMICconsortium) and used qualitative and quantitative (Item Response Theory/IRT) harmonization techniques toestimate SCD prevalence.
(Continued on next page)
© The Author(s). 2020 Open Access This article is licensed under a Creative Commons Attribution 4.0 International License,which permits use, sharing, adaptation, distribution and reproduction in any medium or format, as long as you giveappropriate credit to the original author(s) and the source, provide a link to the Creative Commons licence, and indicate ifchanges were made. The images or other third party material in this article are included in the article's Creative Commonslicence, unless indicated otherwise in a credit line to the material. If material is not included in the article's Creative Commonslicence and your intended use is not permitted by statutory regulation or exceeds the permitted use, you will need to obtainpermission directly from the copyright holder. To view a copy of this licence, visit http://creativecommons.org/licenses/by/4.0/.The Creative Commons Public Domain Dedication waiver (http://creativecommons.org/publicdomain/zero/1.0/) applies to thedata made available in this article, unless otherwise stated in a credit line to the data.
* Correspondence: [email protected] of Social Medicine, Occupational Health and Public Health (ISAP),Medical Faculty, University of Leipzig, Philipp-Rosenthal-Straße 55, 04103Leipzig, Germany2Global Brain Health Institute (GBHI), Trinity College Dublin, Dublin, IrelandFull list of author information is available at the end of the article
Röhr et al. Alzheimer's Research & Therapy (2020) 12:167 https://doi.org/10.1186/s13195-020-00734-y

(Continued from previous page)
Results: The sample comprised 39,387 cognitively unimpaired individuals above age 60. The prevalence ofSCD across studies was around one quarter with both qualitative harmonization/QH (23.8%, 95%CI = 23.3–24.4%) and IRT (25.6%, 95%CI = 25.1–26.1%); however, prevalence estimates varied largely between studies (QH6.1%, 95%CI = 5.1–7.0%, to 52.7%, 95%CI = 47.4–58.0%; IRT: 7.8%, 95%CI = 6.8–8.9%, to 52.7%, 95%CI = 47.4–58.0%). Across studies, SCD prevalence was higher in men than women, in lower levels of education, in Asianand Black African people compared to White people, in lower- and middle-income countries compared tohigh-income countries, and in studies conducted in later decades.
Conclusions: SCD is frequent in old age. Having a quarter of older individuals with SCD warrants further investigationof its significance, as a risk stage for AD and other dementias, and of ways to help individuals with SCD who seekmedical advice. Moreover, a standardized instrument to measure SCD is needed to overcome the measurementvariability currently dominant in the field.
Keywords: Subjective cognitive decline, Prevalence, Epidemiology, Individual participant data, Data harmonization,Cohort study
BackgroundIn light of the projected increase of people living with de-mentia all around the world, there is a strong interest inearly risk stages that may allow for early intervention orthe prevention of dementia [1]. Subjective cognitive de-cline (SCD) has recently attracted renewed attention onthe assumption that it could be the first notable manifest-ation in the preclinical stage of Alzheimer’s disease (AD)and other dementias [2]. SCD refers to a self-experienceddecline in cognitive ability in comparison with a previouslynormal status and without objective cognitive impairment[3]. The updated AD research framework of the NationalInstitute on Aging and Alzheimer’s Association (NIA-AA)now recognizes SCD within the cognitively unimpairedstage on the cognitive continuum [4]. Thus, SCD is con-sidered a risk stage for dementia. This is supported by evi-dence from longitudinal epidemiological data that showan increased risk for mild cognitive impairment (MCI)and dementia in individuals with SCD [2].Importantly, the subjective perception of declining
cognitive capacity can also emerge due to conditionsother than AD, for example as part of normal aging,MCI, and in association with depression and anxiety [3].Primarily, SCD is considered a symptom of preclinicalAD only in association with AD biomarkers; however,another view is to consider SCD as a broader behavioralphenotype [5] above and beyond preclinical AD that de-fines a group of people being concerned about theirbrain health. This is reflected in an increasing number ofindividuals who seek medical advice because of SCD [6].Despite the growing research interest in SCD, the con-
cept still faces methodological challenges regarding itsoperationalization [7]. Historically, the field has lacked acommon terminology and definition since the initial de-scription of a “forgetfulness phase” by Reisberg et al. in1982 [8]. This resulted in the dissemination of a varietyof terms, e.g., subjective memory complaints, subjective
memory impairment, forgetfulness, subjective cognitiveimpairment, or cognitive concerns—to name a few. Thishurdle has recently been cleared through the introduc-tion of a consensus definition of SCD in preclinical ADby the working group of the Subjective Cognitive De-cline Initiative (SCD-I) [3]. A standard approach tomeasure SCD, however, is still lacking [9]. In light of theevolution of the concept, it is unsurprising that previousfindings on SCD epidemiology varied, including preva-lence estimates. Early studies investigating more generalmemory complaints reported prevalences between 22and 56% in community-based samples [10]. Studies esti-mating SCD prevalence based on the SCD-I criteria arescarce, but there are some examples: In a sample repre-senting the Greek population aged ≥ 65 years withoutpsychiatric conditions, 28% of the cognitively unim-paired participants reported SCD [11]. In a Germansample of cognitively unimpaired individuals aged ≥ 75years, SCD prevalence was 54% [12]. In Chinese resi-dents aged 60 to 80 years, SCD prevalence ranged be-tween 14 and 19% [13]. This, together with a lack ofstandardized SCD assessment and variations in case defi-nitions, explains variance in reported outcomes. Notably,the occurrence of SCD has almost exclusively been stud-ied in high-income countries (HIC), while evidence fromlow- and middle-income countries (LMIC) is lacking.The SCD-I emphasized the need for harmonized obser-vational studies that can attenuate some of the limita-tions associated with SCD operationalization [7].
Study aimsWe aimed to estimate SCD prevalence in cognitively un-impaired older individuals by applying uniform SCD cri-teria to harmonized data from 16 diverse cohort studiesof aging. By doing so, we aimed to minimize the influ-ence of both study level and individual level factors,thereby enhancing the generalizability of findings [14].
Röhr et al. Alzheimer's Research & Therapy (2020) 12:167 Page 2 of 14

Moreover, as SCD prevalence may vary across sub-groups, we aimed to examine differences in SCD preva-lence according to sociodemographic (age, gender,education, and ethnicity) and regional (country income)factors as well as time (decade of study baseline) acrossstudies.
MethodsContributing studies and participantsCross-sectional population-based individual participantdata (IPD) were contributed by 16 member studies ofthe Cohort Studies of Memory in an International Con-sortium (COSMIC; https://cheba.unsw.edu.au/consortia/cosmic/studies) [15] (Table 1; see Supplemental materialTable e-1 for key references). COSMIC brings togetherinternational cohort studies of aging to foster cross-cohort analyses on common factors for cognitive declineand dementia. Study-based data were harmonized andpooled. Baseline data were used for all studies except fortwo that did not assess all variables needed for SCD clas-sification until later waves, i.e., the Monongahela ValleyIndependent Elders Survey (MoVIES) provided data forwave 2 (2 years after baseline) and the Personality andTotal Health Through Life Project (PATH) for wave 3(8 years after baseline). The initial sample included indi-viduals aged at least 60 years and without a dementiadiagnosis (Table e-2). Drawing on a dementia-free sam-ple was the default option as some studies excludedprevalent dementia cases as per their study design. For
the current study, data represented 15 countries fromAfrica, Asia, Australia, Europe, and North America.
EthicsThe Human Research Ethics Committee of the Univer-sity of New South Wales approved this study (Ref:HC17292). All contributing studies had previously ob-tained approval from their respective ethics committees,and it was standard that participants provided writteninformed consent.
DemographicsInformation included age, gender, education, ethnicity,country income, and decade in which a study was con-ducted. Education was provided as years for most studies.For four cohorts (ActiveAging, Epidemiology of dementiain Central Africa/EPIDEMCA, Etude Santé Psychologiqueet Traitement/ESPRIT, Maastricht Aging Study/MAAS),education data were provided as categories. Forharmonization purposes, categories were assigned discreteyear values based on the local education system as in-formed by the study leaders. A fifth cohort (MoVIES) pro-vided category data for educational levels for allparticipants and values for years of education for 73.4% ofall participants. These data were used to calculate a meanyear value for each category that was assigned to individ-uals missing education year data. For subgroup analysisonly, years of education were re-categorized according tothe UNESCO International Standard Classification of
Table 1 Contributing studies (n = 16)
Study Abbreviation Country Country incomegroup*
Baseline(years)
Samplesize
Atma Jaya Cognitive & Aging Research ActiveAging Indonesia LMIC 2009 278
Cognitive Function & Ageing Studies CFAS UK HIC 1989–1991 12,457
Einstein Aging Study EAS USA HIC 1993 2154
Epidemiology of Dementia in Central Africa EPIDEMCA Republic of Congo,Central African Republic
LIC/LMIC 2011–2012 1867
Etude Santé Psychologique et Traitement ESPRIT France HIC 1999–2001 2190
Invecchiamento Cerebrale in Abbiategrasso Invece.Ab Italy HIC 2010 1280
Korean Longitudinal Study on Cognitive Aging and Dementia KLOSCAD Korea HIC 2009–2012 6430
Leipzig Longitudinal Study of the Aged LEILA75+ Germany HIC 1997 1045
Long-term Research Grant Scheme - Towards Useful Aging LRGS-TUA Malaysia UMIC 2012–2013 2131
Maastricht Aging Study MAAS Netherlands HIC 1993 500
Monongahela Valley Independent Elders Survey MoVIES USA HIC 1987–1989 1276
Personality and Total Health Through Life Project PATH Australia HIC 2001 1965
Sasaguri Genkimon Study SGS Japan HIC 2011 2618
Singapore Longitudinal Ageing Studies II SLASII Singapore HIC 2003 2585
Sydney Memory and Ageing Study SydneyMAS Australia HIC 2005–2007 1037
Zaragoza Dementia Depression Project ZARADEMP Spain HIC 1994 4415
HIC high-income country, LIC low-income country, LMIC lower-middle income country, UMIC upper-middle income country*According to World Bank classification at year/mean year of baseline assessment
Röhr et al. Alzheimer's Research & Therapy (2020) 12:167 Page 3 of 14

Education (ISCED) 2011 into pre-/primary education (0to 5 years), secondary education (6 to 9 years), upper-/post-secondary education (10 to 14 years), and tertiaryeducation (> 14 years) [16].Ethnicity was recorded according to self-report, i.e., in
an open question format in the Cognitive Function &Ageing Studies (CFAS) and according to pre-specifiedcategories in the Einstein Aging Study (EAS), the Long-term Research Grant Scheme - Towards Useful Aging(LRGS-TUA), MoVIES, and the Sydney Memory andAgeing Study (MAS). All other studies did not assessethnicity. Therefore, participants’ ethnicity was assignedas the majority ethnicity of the study sample as informedby the study leaders. Due to the lack of data granularitywith regard to ethnic groups, analysis was based on threemajor ethnic groups: Asian people, Black African people,and White people.Country income was categorized according to the World
Bank classification corresponding to the year or mean year inwhich baseline assessments took place. It is based on thegross national income per capita, i.e., low-, lower middle-,upper middle-, and high-income country [17].To account for a potential impact of time trends re-
garding dementia awareness, we furthermore consideredthe decade, in which studies were initiated (< 1999,2000–2009, > 2009).
Assessment of self-experienced decline in cognitivecapacityAssessment of a self-experienced decline in cognitive cap-acity varied across studies, though answers to all questionswere self-reported during face-to-face interviews, usingpaper and pencil questionnaires (see Table e-3 for anoverview of instruments). Six studies used a single self-developed question, seven studies used a battery of self-composed questions, and one study used the SubjectiveMemory Complaints Questionnaire (SMCQ) [18]. For twostudies (ActiveAging and Long-term Research GrantScheme - Towards Useful Aging/LRGS-TUA), the item“Do you feel you have more problems with memory thanmost?” from the Geriatric Depression Scale (GDS-15) wasused [19]. In PATH, the Informant Questionnaire on Cog-nitive Decline in the Elderly (IQCODE) was administeredas self-report, including seven items that addressedwhether different facets of memory and recall had chan-ged over time [20]. Data on all identified items were thensynthesized and harmonized.One fundamental challenge of integrative data analysis
is the evaluation and statistical consideration of between-sample heterogeneity. Since the majority of contributingstudies used multiple items to assess a self-experienceddecline in cognitive capacity, we followed two comple-mentary strategies to prepare data.
Qualitative harmonization of items for a self-experienceddecline in cognitive capacityThe first harmonization strategy followed a qualitativeapproach [21]. Authors SR and AP independently com-pared all items assessing self-experienced decline in cog-nitive capacity across studies and then selected andharmonized them by matching semantically similaritems, i.e., if more than one item was available. Inter-rater agreement was high (K = 0.97). The original scalesfor all items were transformed, if necessary, to providebinary responses of presence or absence of a self-experienced decline in cognitive capacity. As a result, weidentified and harmonized one common item that brid-ges the measurement of a self-experienced decline incognitive capacity across studies (we refer to this item as“item 1”). Table e-3 shows the assessment of the selecteditems underlying the harmonization of item 1 acrossstudies. Commonly, these items broadly addressedwhether the study participant had problems or difficul-ties with memory; MAAS provided a single item asses-sing cognitive failures. For six studies, only data on thisbridging item 1 was available. For the remaining tenstudies, information on additional items was availableand considered for harmonization. Overall, we were ableto identify and harmonize a total of 32 different itemsfor IRT analysis (Table e-4).
Quantitative harmonization of items for a self-experienced decline in cognitive capacityThe second harmonization strategy followed a quantita-tive approach in order to develop a measurement modelfor both common and study-unique items. The goal wasto generate scale scores for a generic construct of self-experienced cognitive decline, which is commensurate inmeaning and metric across studies and study subpopula-tions [22]. In particular, we used the 2-Parameter Logistic(2-PL) Item Response Theory (IRT) model as a psycho-metric approach to evaluate measurement equivalence ofitems across the 16 studies. IRT allows the localization ofboth item difficulty and person characteristics on a com-mon latent “trait” that represents self-experienced declinein cognitive capacity, while controlling for between-studyheterogeneity of measurement. Higher difficulty values in-dicate a higher likelihood of a positive response to a cer-tain item [22]. First, we applied an automated bottom-upstepwise item selection procedure to identify a core set ofitems that builds the basis for IRT analysis [23]. The pro-cedure revealed that 18 of the 32 items (see Table e-4)form a unidimensional factor with acceptable scalability(Loevinger’s Hij = 0.43) and good reliability (Cronbach’sAlpha = 0.81). Inspection of parameters of the fitted 2-PLIRT model (i.e., difficulty, discrimination), as well as theevaluation of item characteristics curves, led to the exclu-sion of two additional items with insufficient psychometric
Röhr et al. Alzheimer's Research & Therapy (2020) 12:167 Page 4 of 14

properties (item 2, item 5), resulting in a final IRT modelwith 16 items with partial factorial invariance and the fol-lowing fit indices: root mean square error of approxima-tion = .02; comparative fit index = .87; Tucker LewisIndex = .85; standardized root mean square residuals = .09,indicating an only approximately acceptable model fit.However, inspection of alternative models did not reveal abetter fitting model across the 16 contributing studies,i.e. the presented IRT model represented the best fit. Fi-nally, we dichotomized the predicted latent score obtainedfrom the final IRT model at theta = 0 to differentiate indi-viduals with a higher likelihood of present symptoms fromthose with lower estimated likelihood [24]. The cut oftheta = 0 was pre-specified prior to the analysis as there isno gold standard to draw on and it may best separatecases from non-cases as it represents the mean of the cali-bration sample for the IRT model.
Cognitive impairmentThe Mini-Mental State Examination (MMSE) was used toassess cognitive impairment [25]. This was the default op-tion as the MMSE was assessed in all but two studies, forwhich MMSE scores could be derived from similar tests.For the Einstein Aging Study (EAS), Blessed InformationMemory Concentration scores were converted to MMSEscores using a validated formula [26, 27]. The formula wasbased on correlational analysis of the scores of the twotests in individuals with AD and both tests demonstratedhigh test-retest reliability of r = .75 and above, thus show-ing high consistency [27]. For the EPIDEMCA cohort,Community Screening Interview for Dementia (CSI ‘D’)scores were converted to MMSE scores using a co-calibration table [28, 29]. The co-calibration table was de-veloped for four commonly used tests of global cognitivefunctioning, including the CSI ‘D’ and the MMSE, usingIRT based on cross-sectional data from three large (n >1000) community-based studies of cognitive functioningin old age [29]. Therefore, scores from one test can be dir-ectly compared to scores on the other test.
Functional abilityFunctional ability was based on the assessment of instru-mental activities of daily living (IADL). Nine studiesused the Lawton and Brody IADL Scale [30]. Seven stud-ies each used a different scale, though all had large over-lap in key activities (e.g., food preparation, shopping).All instruments are listed in Table e-5. For all studies,higher scores indicated higher functionality (after reversescoring for EPIDEMCA and SydneyMAS).
Depressive and anxiety symptomatologyAll studies contributed data for depression and 12 stud-ies for anxiety (anxiety data were not collected in Acti-veAging, Leipzig Longitudinal Study of the Aged/
LEILA75+, LRGS-TUA, and MoVIES). Data were har-monized as per previous COSMIC reports, with all avail-able information considered [31, 32]. Depression wasindicated by any of scale scores meeting cut-off, expertdiagnosis, self-report, treatment, or use of antidepressantmedication (Table e-6). Similarly, anxiety disorders wereindicated by any of scale scores meeting cut-off, self-report, or the use of anxiolytics (Table e-7).
Operationalization of SCD casesSCD cases were uniformly defined and operationalizedaccording to current criteria for SCD and followed rec-ommendations on the implementation of SCD in re-search, i.e., endorsement of a self-experienced decline incognitive capacity in the absence of objective cognitiveimpairment (criterion 1), unimpaired functional ability(criterion 2), exclusion of major depression (criterion 3),and exclusion of anxiety disorder (criterion 4) [2, 7].Endorsement of a self-experienced decline in cognitive
capacity and the presence or absence of major depres-sion or anxiety disorder were determined as above.Unimpaired cognitive functioning was operationalized
as a score higher than 1.5 SDs below the mean of thestudy-based age-, gender-, and education-adjusted MMSEscore in order to differentiate individuals with and without(mild) cognitive impairment. Likewise, unimpaired func-tional ability was operationalized as a score higher than1.5 SDs below the mean of the study-based age-, gender-,and education-adjusted IADL scores.
Data analysisPrevalence in our study was defined as the number ofSCD cases divided by the total number of cognitively un-impaired individuals, and estimates for both the qualita-tive harmonization (QH) and quantitative IRTharmonization approach are presented as percentageswith 95% confidence intervals (95%CI). All estimateswere stratified by study and subsequently by demo-graphic subgroups (age, gender, education, ethnicity,country income, decade). Study-specific prevalence esti-mates as well as subgroup-specific prevalence estimatesand corresponding tests regarding differences in educa-tion, ethnicity, country income, and decade were ad-justed for age and gender, using the total sample of all16 studies included in the analysis as the standard popu-lation. Gender differences were adjusted for age and viceversa. This allowed for the direct comparison of preva-lence estimates across studies and subgroups, includingdifferent distributions of core sociodemographic vari-ables [33]. Subgroup comparisons of proportions weretested using Pearson’s chi-square test with Rao/Scottcorrection. Overall prevalence estimates across studiesare reported as unstandardized, since data on standard
Röhr et al. Alzheimer's Research & Therapy (2020) 12:167 Page 5 of 14

populations stratified by age and gender were notavailable.To illustrate the impact of the individual criteria to
quantify SCD cases, we show frequency rates criteria-wise,i.e., cumulatively applying the four criteria for SCD.A range of sensitivity analyses were performed. First,
an additional analysis was conducted with regard to IRTresults by excluding studies with only the bridging item(“item 1”) available. Second, we inspected the contin-gency of the results of the two harmonization strategies(QH and IRT). Lastly, as the MMSE scores may havelimited sensitivity and specificity to differentiate unim-paired cognitive performance from MCI [7], we con-ducted a sensitivity analysis with a subset of studies (n =10) that were able to provide neuropsychological testscores on at least three out of four cognitive domains(memory, language, processing speed and executivefunction; see Table e-9 for an overview of contributingstudies and neuropsychological tests; harmonization pro-cedure as in previous COSMIC studies [31, 32]). To es-tablish unimpaired cognitive performance based on thecognitive domains scores, the first step was to adjust testscores for age, sex, and education, and for all interac-tions between these variables using regression analyseswithin each study. The adjusted test scores were thentransformed to z-scores using the mean and SD of thestudy sample as normative values. Cognitive impairmentfor each cognitive score was defined as performance ofmore than 1.5 SDs below the mean within the relevantstudy’s sample. To be classified cognitively impaired, thishad to be the case in at least one of the considered do-mains. Otherwise, operationalization of SCD and statis-tical analysis was identical to the MMSE-basedprocedure.Analyses were performed in Stata 15 MP (Stata Corp,
College Station, TX) and R version 3.5.0 [34].
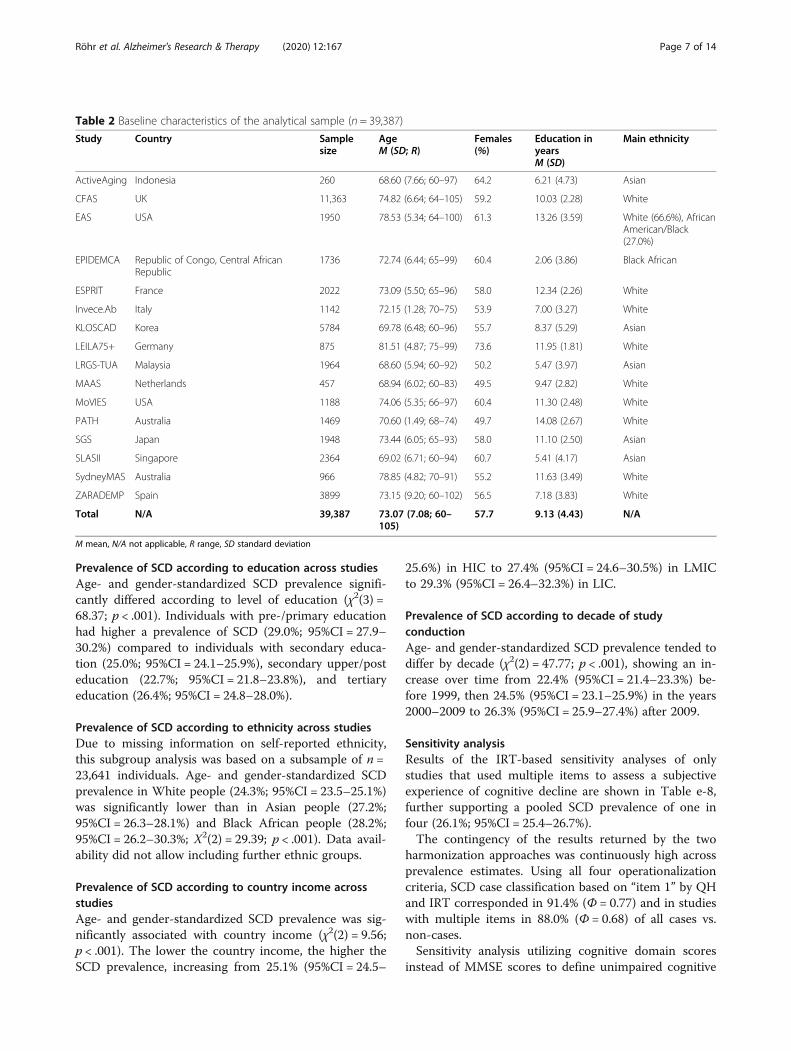
ResultsSampleThe initial sample comprised 44,228 dementia-free indi-viduals aged at least 60 years. Inspection of the initialsample led to the exclusion of 1037 (2.3%) individualsdue to study-based missing information on any of the 32SCD items and 1049 (2.4%) individuals due to missinginformation on demographics and/or MMSE. Inaddition, 2755 (6.2%) individuals classified as cognitivelyimpaired were excluded, resulting in an analytical sam-ple of 39,387 individuals (Table 2). The mean age of par-ticipants in the analytical sample was 73.1 years (SD =7.1; range = 60–105 years). The proportion of womenwas 57.7%. Education was 9.1 years (SD = 4.4) onaverage.
Prevalence of SCD in and across studiesOverall, both the QH and IRT approach robustly sug-gested a SCD prevalence of roughly one in four in theolder population without cognitive impairment acrossstudies (QH 23.8% [95%CI = 23.3–24.4%]; IRT 25.6%[95%CI = 25.1–26.1%]). Study-based age- and gender-standardized SCD prevalence estimates varied largely,ranging from 6.1% (95%CI = 5.1–7.0%) to 52.7%(95%CI = 47.4–58.0%) for QH and 7.8% (95%CI = 6.8–8.9%) to 52.7% (95%CI = 47.4–58.0%) for IRT. All study-based SCD prevalence estimates according to QH andIRT are shown in the last column in Tables 3 and 4,respectively.
Proportions according to cumulative criteria applicationThe columns of Tables 3 and 4 show the proportions ofthe incremental application of the four operationalizationcriteria for SCD. There was a particular difference in pro-portions between functional criteria (endorsement of aself-experienced decline in cognitive capacity without ob-jective cognitive impairment and functional ability) andmood criteria (depressive and anxiety symptomatology).When in addition to functional criteria depressive andanxiety symptomatology were addressed, overall propor-tions decreased from 30.5 to 23.8% (95%CI = 30.0–30.9%;95%CI = 23.3–24.4%, respectively) in QH and from 34.5 to25.6% (95%CI = 34.0–35.0%; 95%CI = 25.1–26.1%, respect-ively) in IRT.
Prevalence of SCD according to age group and genderacross studiesThe following subgroup results are based on IRT ana-lysis, applying all four SCD criteria. Gender differenceswere adjusted for age and vice versa. The subgroup re-sults of the qualitative approach are detailed in Table e-10. Overall, SCD prevalence was somewhat higher inmen compared to women (26.6% [95%CI = 25.7–27.4%]vs. 24.9% [95%CI = 24.2–25.6%]; χ2(1) = 8.54; p = .003).SCD prevalence significantly differed according to agegroup (χ2(5) = 51.31; p < .001), which also applied whenstratified for gender (men: χ2(5) = 32.42; p < .001;women: χ2(5) = 29.81; p < .001). SCD prevalence was27.4% (95%CI = 25.8–28.9%) in ages 60–64 years, thendecreased to 23.2% (95%CI = 22.1–24.2%) in ages 65–69years, thereafter increased to 24.5% (95%CI = 23.6–25.5%) in ages 70–74 years, 27.9 (95%CI = 26.5–29.3%)in ages 75–79 years, and 28.1% (95%CI = 26.2–30.0%) inages 80–84 years and 28.1% (95%CI = 25.7–30.9%) inages 85+ years. Overall, there was no clear pattern asso-ciated with age, except for those aged 65–74 years gener-ally having a lower prevalence than all other age groups.Figure 1 additionally shows SCD prevalence accordingto age groups stratified by gender.
Röhr et al. Alzheimer's Research & Therapy (2020) 12:167 Page 6 of 14
Prevalence of SCD according to education across studiesAge- and gender-standardized SCD prevalence signifi-cantly differed according to level of education (χ2(3) =68.37; p < .001). Individuals with pre-/primary educationhad higher a prevalence of SCD (29.0%; 95%CI = 27.9–30.2%) compared to individuals with secondary educa-tion (25.0%; 95%CI = 24.1–25.9%), secondary upper/posteducation (22.7%; 95%CI = 21.8–23.8%), and tertiaryeducation (26.4%; 95%CI = 24.8–28.0%).
Prevalence of SCD according to ethnicity across studiesDue to missing information on self-reported ethnicity,this subgroup analysis was based on a subsample of n =23,641 individuals. Age- and gender-standardized SCDprevalence in White people (24.3%; 95%CI = 23.5–25.1%)was significantly lower than in Asian people (27.2%;95%CI = 26.3–28.1%) and Black African people (28.2%;95%CI = 26.2–30.3%; Χ2(2) = 29.39; p < .001). Data avail-ability did not allow including further ethnic groups.
Prevalence of SCD according to country income acrossstudiesAge- and gender-standardized SCD prevalence was sig-nificantly associated with country income (χ2(2) = 9.56;p < .001). The lower the country income, the higher theSCD prevalence, increasing from 25.1% (95%CI = 24.5–
25.6%) in HIC to 27.4% (95%CI = 24.6–30.5%) in LMICto 29.3% (95%CI = 26.4–32.3%) in LIC.
Prevalence of SCD according to decade of studyconductionAge- and gender-standardized SCD prevalence tended todiffer by decade (χ2(2) = 47.77; p < .001), showing an in-crease over time from 22.4% (95%CI = 21.4–23.3%) be-fore 1999, then 24.5% (95%CI = 23.1–25.9%) in the years2000–2009 to 26.3% (95%CI = 25.9–27.4%) after 2009.
Sensitivity analysisResults of the IRT-based sensitivity analyses of onlystudies that used multiple items to assess a subjectiveexperience of cognitive decline are shown in Table e-8,further supporting a pooled SCD prevalence of one infour (26.1%; 95%CI = 25.4–26.7%).The contingency of the results returned by the two
harmonization approaches was continuously high acrossprevalence estimates. Using all four operationalizationcriteria, SCD case classification based on “item 1” by QHand IRT corresponded in 91.4% (Φ = 0.77) and in studieswith multiple items in 88.0% (Φ = 0.68) of all cases vs.non-cases.Sensitivity analysis utilizing cognitive domain scores
instead of MMSE scores to define unimpaired cognitive
Table 2 Baseline characteristics of the analytical sample (n = 39,387)
Study Country Samplesize
AgeM (SD; R)
Females(%)
Education inyearsM (SD)
Main ethnicity
ActiveAging Indonesia 260 68.60 (7.66; 60–97) 64.2 6.21 (4.73) Asian
CFAS UK 11,363 74.82 (6.64; 64–105) 59.2 10.03 (2.28) White
EAS USA 1950 78.53 (5.34; 64–100) 61.3 13.26 (3.59) White (66.6%), AfricanAmerican/Black(27.0%)
EPIDEMCA Republic of Congo, Central AfricanRepublic
1736 72.74 (6.44; 65–99) 60.4 2.06 (3.86) Black African
ESPRIT France 2022 73.09 (5.50; 65–96) 58.0 12.34 (2.26) White
Invece.Ab Italy 1142 72.15 (1.28; 70–75) 53.9 7.00 (3.27) White
KLOSCAD Korea 5784 69.78 (6.48; 60–96) 55.7 8.37 (5.29) Asian
LEILA75+ Germany 875 81.51 (4.87; 75–99) 73.6 11.95 (1.81) White
LRGS-TUA Malaysia 1964 68.60 (5.94; 60–92) 50.2 5.47 (3.97) Asian
MAAS Netherlands 457 68.94 (6.02; 60–83) 49.5 9.47 (2.82) White
MoVIES USA 1188 74.06 (5.35; 66–97) 60.4 11.30 (2.48) White
PATH Australia 1469 70.60 (1.49; 68–74) 49.7 14.08 (2.67) White
SGS Japan 1948 73.44 (6.05; 65–93) 58.0 11.10 (2.50) Asian
SLASII Singapore 2364 69.02 (6.71; 60–94) 60.7 5.41 (4.17) Asian
SydneyMAS Australia 966 78.85 (4.82; 70–91) 55.2 11.63 (3.49) White
ZARADEMP Spain 3899 73.15 (9.20; 60–102) 56.5 7.18 (3.83) White
Total N/A 39,387 73.07 (7.08; 60–105)
57.7 9.13 (4.43) N/A
M mean, N/A not applicable, R range, SD standard deviation
Röhr et al. Alzheimer's Research & Therapy (2020) 12:167 Page 7 of 14

function was based on a subset of ten studies. Results ofthe qualitative approach are presented in Table e-11 andof the quantitative/IRT approach in Table e-12. Table e-13 juxtaposes SCD prevalence estimates across studiesfor both the MMSE-based and cognitive domain scores-based operationalization of unimpaired cognitive per-formance (quantitative approach: 1.48% diff; qualitativeapproach: 0.80% diff.)
DiscussionWe estimated the prevalence of subjective cognitive de-cline (SCD) by applying uniform criteria to harmonizedindividual participant data (IPD). Data represented 16international population-based cohort studies from 15countries with over 39,000 individuals at least 60 yearsold. Across studies, qualitative harmonization (QH) andquantitative harmonization using Item Response Theory(IRT) both robustly suggested a SCD prevalence ofroughly one quarter (23.8% and 25.6%) in cognitively un-impaired older individuals. Still, prevalence estimatesvaried largely between studies (QH 6.1–52.7%; IRT 7.8–52.7%). However, applying uniform criteria for SCDoperationalization to harmonized data helps to increasecomparability of estimates across studies. This is a
strength of our study as SCD assessment greatly differedbetween cohorts and different measurements are knownto be associated with outcome variance [35]. Indeed, dif-ferences in prevalence estimates are directly associatedwith test accuracy, and the majority of the items the co-horts used to measure self-experienced decline in cogni-tive capacity were not psychometrically evaluated. Usedin isolation, these potentially imperfect items may givefalse-positive or false-negative results, resulting in biasedprevalence estimates. As the original studies contributingto this work did not previously inspect SCD prevalencein their samples, we cannot, however, determine whetherthe application of uniform criteria to harmonized datawould have reduced SCD prevalence variation betweencohorts. A previous COSMIC study on MCI prevalenceusing such methods suggested this is the case [36]. Add-itionally, IRT analysis allowed heterogeneity betweenstudies to be addressed statistically, by selecting a set ofitems that form a unidimensional scale, thus giving con-fidence that all items measured one construct. Hence,our study suggests that the prevalence of SCD in cogni-tively unimpaired older individuals is banded around25%, which may give a more accurate idea of SCDprevalence than estimates of single studies, which are
Table 3 Study-based age- and gender-standardized prevalence estimates for subjective cognitive decline (SCD; last column) andcumulative frequency estimates for the stepwise application of SCD operationalization criteria according to qualitative harmonization
Study SCD operationalization criteria
Criterion 1Endorsement of a self-experienced declinein cognitive capacity without objective cognitiveimpairment
+ Criterion 2Intact functional ability
+ Criterion 3No major depression
+ Criterion 4No anxiety disorder
% (95%CI)
ActiveAging 27.98 (21.44–34.52) 25.81 (19.41–32.20) 25.73 (19.36–32.10) N/A
CFAS 17.04 (15.45–18.64) 15.59 (14.00–17.18) 12.73 (11.41–14.05) 6.34 (5.57–7.20)
EAS 15.84 (12.57–19.10) 13.82 (10.90–16.73) 15.23 (10.95–19.51) 12.05 (5.80–18.30)
EPIDEMCA 50.52 (48.36–52.69) 47.74 (45.51–49.98) 25.83 (23.80–27.86) 23.86 (21.93–25.79)
ESPRIT 18.17 (16.52–19.82) 16.60 (15.02–18.18) 13.36 (11.92–14.80) 10.35 (9.11–11.60)
Invece.Ab 14.60 (11.63–17.56) 14.02 (10.89–17.16) 12.31 (9.43–15.18) 10.76 (8.28–13.23)
KLOSCAD 63.65 (62.28–65.02) 58.02 (57.88–59.46) 42.25 (40.82–43.68) 42.27 (40.90–43.66)
LEILA75+ 12.88 (11.65–14.12) 11.70 (10.48–12.92) 9.80 (8.64–10.96) N/A
LRGS-TUA 51.23 (48.15–54.31) 47.39 (44.32–50.47) 46.84 (43.80–49.87) N/A
MAAS 65.26 (60.33–70.20) 60.52 (55.35–65.69) 54.97 (49.43–60.50) 52.70 (47.43–57.96)
MoVIES 32.82 (30.35–35.32) 30.45 (28.01–32.90) 27.27 (24.89–29.65) N/A
PATH 8.95 (7.89–10.01) 8.23 (7.21–9.26) 7.34 (6.36–8.33) 6.06 (5.13–6.99)
SGS 18.47 (16.82–20.13) 16.52 (14.93–18.10) 10.24 (8.94–11.55) 9.91 (8.64 (11.18)
SLASII 12.16 (10.53–13.79) 10.82 (9.27–12.36) 10.28 (8.78–11.78) 9.89 (8.50–11.28)
SydneyMAS 42.77 (40.49–45.04) 39.10 (36.70–41.51) 32.58 (30.14–35.01) 26.98 (24.55–29.40)
ZARADEMP 44.68 (42.98–46.38) 42.04 (40.31–43.77) 29.42 (27.77–31.06) 28.12 (26.50–29.74)
Total* 33.03 (32.56–33.49) 30.46 (30.01–30.92) 24.08 (23.65–24.51) 23.83 (23.29–24.36)
95%CI 95% confidence interval, N/A not available*Unstandardized
Röhr et al. Alzheimer's Research & Therapy (2020) 12:167 Page 8 of 14

potentially more heavily influenced by measurementissues.Our results support the notion that SCD is frequent in
old age. It is most likely that only a proportion of thesecases reflect pathological change due to AD or other de-mentias. The list of non-neurodegenerative conditionsthat can lead to subjective decline in cognition is long,including, apart from major depression and anxiety, nor-mal aging, various psychiatric, neurologic and medicaldisorders, substance abuse and medication, as well aspersonality and cultural factors [3]. The current SCD re-search definition cannot rule out all other causes, andthis is likely reflected in the range of prevalence esti-mates we found. In this regard, it is interesting to notethe difference it made when major depression and anx-iety disorders were considered as exclusion criteria inaddition to cognitive impairment and functional inability(which some studies have only used), reducing estimatesfrom roughly one third to one quarter. While the exclu-sion of depression and anxiety disorder is accepted inthe criteria, it does highlight the impact criteria can haveon prevalence estimates. In addition, many of the above
named conditions are associated with an increased riskfor cognitive decline and dementia themselves. Viceversa, specific symptoms, especially depressive and anx-iety symptoms, can also be a consequence of neuro-pathological change or co-occur, so that the relationshipbetween SCD, these conditions, and neurodegenerationis more complex [3]. In this regard, it seems useful toexplore SCD in conjunction with other behavioral symp-toms [37]. Like SCD, problems with mood, anxiety,drive, perception, sleep, appetite, agitation, and aggres-sion can be precursors to cognitive decline and demen-tia, as summarized in the construct mild behavioralimpairment (MBI) [38]. Future investigations could linkthe two behavioral concepts rather than studying themindependently.Age- and gender-standardized SCD prevalence differed
regarding sociodemographic factors. We found slightlyhigher SCD prevalence in men compared to women.The literature on gender differences in SCD prevalenceis inconsistent, some reporting higher prevalence inwomen [39, 40], others in men [41], or no difference[42]. For both men and women, SCD prevalence differed
Table 4 Study-based age- and gender-standardized prevalence estimates for subjective cognitive decline (SCD; last column) andcumulative frequency estimates for the stepwise application of SCD operationalization criteria according to quantitativeharmonization/Item Response Theory (IRT) modeling
Study SCD operationalization criteria
Criterion 1Endorsement of a self-experienced declinein cognitive capacity without objectivecognitive impairment
+ Criterion 2Intact functional ability
+ Criterion 3No major depression
+ Criterion 4No anxiety disorder
Prevalence estimates in % (95%CI)
ActiveAging 27.97 (21.43–34.51) 25.80 (19.40–32.20) 25.73 (19.36–32.10) N/A
CFAS 23.44 (21.77–25.12) 21.59 (19.91–23.26) 17.78 (16.36–19.20) 9.60 (8.63–10.58)
EAS 50.41 (45.20–55.62) 46.06 (41.06–51.06) 38.71 (34.07–43.34) 25.91 (19.33–32.48)
EPIDEMCA 56.28 (54.18–58.38) 53.02 (50.83–55.21) 30.64 (28.51–32.77) 28.41 (26.38–30.44)
ESPRIT 31.26 (29.34–33.18) 28.76 (26.89–30.63) 23.97 (22.20–25.74) 18.94 (17.36–20.51)
Invece.Ab 14.61 (11.64–17.58) 14.03 (10.90–17.17) 12.32 (9.44–15.20) 10.77 (8.28–13.26)
KLOSCAD 55.51 (54.09–56.92) 50.55 (49.10–52.00) 36.01 (34.62–37.40) 35.97 (34.62–37.31)
LEILA75+ 12.89 (11.66–14.13) 11.71 (10.49–12.94) 9.81 (8.65–10.97) N/A
LRGS-TUA 51.23 (48.15–54.31) 47.40 (44.32–50.47) 46.84 (43.80–49.87) N/A
MAAS 65.26 (60.32–70.20) 60.52 (55.34–65.69) 54.97 (49.43–60.51) 52.70 (47.43–57.98)
MoVIES 29.39 (26.97–31.81) 27.20 (24.83–29.57) 23.87 (21.59–26.15) N/A
PATH 11.68 (10.50–12.86) 10.76 (9.62–11.90) 9.63 (8.54–10.73) 7.83 (6.80–8.87)
SGS 18.47 (16.81–20.12) 16.51 (14.93–18.09) 10.24 (8.93–11.54) 9.91 (8.64–11.18)
SLASII 25.48 (23.37–27.59) 22.87 (20.83–24.91) 22.17 (20.16–24.18) 21.18 (19.31–23.05)
SydneyMAS 45.81 (43.41–46.39) 42.72 (40.48–44.95) 35.87 (33.55–38.19) 29.88 (27.54–32.22)
ZARADEMP 44.69 (42.99–46.39) 42.04 (40.32–43.77) 30.64 (28.51–32.77) 28.12 (26.50–29.74)
Total* 37.32 (36.85–37.79) 34.49 (34.02–34.97) 27.75 (27.31–28.20) 25.60 (25.06–26.14)
95%CI 95% confidence interval, N/A not available*Unstandardized
Röhr et al. Alzheimer's Research & Therapy (2020) 12:167 Page 9 of 14

by age; however, without a clear pattern. This is similarto MCI prevalence, but different to dementia prevalencethat shows an increase with aging [36].SCD prevalence was highest in individuals with less
education, which is in line with a previous study [43].Hao et al. suggested that low education may be a riskfactor for SCD, being associated with a higher likelihoodof progression to MCI [13]. While the prevalence de-creased with increasing levels of education, there was atendency to increase again among those with the highesteducation levels. In general, higher educational attain-ment is thought to provide resilience against neuropath-ology [44]. This could be expected to lead to a delay insymptom onset and therefore, potentially, a lower SCDprevalence associated with higher levels of education.However, our finding of higher SCD prevalence in thosewith the highest education suggests otherwise and pos-sibly points to increased awareness of or alertness tosubtle cognitive changes in this group.Regarding ethnicity, we found higher SCD prevalence
in Asian and Black African people compared to Whitepeople, which is supposedly associated with country in-come as ethnic group definition was very broad due to alack of ethnic data granularity across studies. With re-gard to results from other studies, a US study reportedsimilar levels of SCD for African American people andWhite people [45], whereas in another US study SCDwas lower in Asian people compared to White peopleand highest in Black American people and American In-dian people [43]. The results of our study, however,should be interpreted with caution as data on ethnicity
were limited and may not be representative. SCD preva-lence and ethnicity is otherwise a largely unexploredtopic.SCD prevalence was lower in HIC compared to LMIC.
From an ecobiopsychosocial perspective, this supportsthe notion that environments with higher socioeconomicresources (e.g., better health care, better educational op-portunities, better lifestyle infrastructure) may be benefi-cial for population health [46]. Indeed, dementiaincidence has been observed to have slightly declined inrecent decades in Western high-income countries, sup-porting such an assumption [47]. Opposed to that, wefound a trend of increasing SCD prevalence over de-cades from before 1999 to after 2009. On the one hand,this could be attributed to increasing public healthawareness regarding dementia, or, on the other hand, tothe fact, that latter data included more studies fromLMIC whereas early studies were exclusively from HIC.However, as much of the increase in numbers of peopleliving with dementia takes place in LMIC [48], theremay be indeed a trend towards increasing SCD.Regardless of causes or consequences, SCD is a serious
issue for individuals who experience it. SCD has been as-sociated with concerns [49], lower health-related qualityof life [50], increased help-seeking behavior and healthcare utilization [51]. Thus, SCD has a negative impacton the individual, but also on society through creatingadditional costs [52]. Having roughly one quarter of thecognitively unimpaired older population experiencingSCD poses the question “what to do about it?.” A sys-tematic review and meta-analysis of interventions for
Fig. 1 SCD prevalence according to age groups and gender in older individuals (≥ 60 years) without cognitive impairment across internationalcohort studies (percentages). Estimates are based on Item Response Theory (IRT) analysis
Röhr et al. Alzheimer's Research & Therapy (2020) 12:167 Page 10 of 14

SCD targeting well-being, meta-cognition, and/or object-ive cognitive performance reported a lack of high-qualityresearch, but nevertheless found that psychological inter-ventions may be beneficial for well-being and meta-cognition in SCD, though not for cognitive performance[52]. Furthermore, the same study reported a lack of evi-dence regarding lifestyle and pharmacological interven-tions. The SCD-I recently argued in support of tailoreddiagnostic processes that identify underlying medical con-ditions in individuals with SCD who present to physicians[6]. If no cause can be identified, they suggest to informabout SCD and dementia risk. From there, a watch andwait strategy could be adopted. A comprehensive ap-proach to deal with SCD, if no treatable underlying condi-tion can be identified, is perhaps education aboutmodifiable health and lifestyle factors for brain health. In-creasing evidence highlights that, among other factors, im-proved management of diabetes, hypertension, andobesity, as well as proactive lifestyle behaviors regardingphysical, cognitive, and social activity, can promote brainhealth and may mitigate dementia risk [53].
LimitationsWe were able to uniformly operationalize SCD acrossstudies according to current guidelines on SCD defin-ition criteria [3, 7]; however, there may be factors notconsidered in these criteria that influence prevalence es-timates of SCD. From this perspective, our reportedSCD prevalence may be an overestimate. The MMSEhas been criticized for having limited sensitivity and spe-cificity in differentiating between unimpaired and mildlycognitively impaired performance [7]. Thus, SCD preva-lence estimates based on cognitive performance derivedfrom MMSE scores could lead to an underestimation ofprevalence. Therefore, we performed a sensitivity ana-lysis based on a subset of studies that were able to pro-vide more comprehensive neuropsychological testscores. In comparison, SCD prevalence estimates acrossstudies hardly differed, which strengthened the confi-dence in the prevalence estimates utilizing MMSEscores. However, where possible, preference should begiven to sensitive and specific tests.Regarding IRT-based estimation of prevalence, we were
not able to pre-specify a cutoff other than theta = 0 to dif-ferentiate between SCD cases and non-cases, as a goldstandard was not available. Moreover, fit indices of ourIRT model indicated room for improvement, whichshould be considered when possibly developing a stan-dardized measurement of SCD. Though we were able tomethodologically tackle heterogeneity in SCD measure-ment across studies, estimates for individual studies arelikely influenced by the type of questions asked. Thiscould be one of the reasons for the large differences inprevalence across the studies, and calls for a standardized
and psychometrically sound instrument for SCD. Also,many items to assess a self-experience in cognitive cap-acity did not cover perceptions of change over time; themajority instead asked about current problems with mem-ory—an acknowledged limitation in SCD research. Futurestudies may also explore how study-based characteristicsbeyond age and gender contribute to SCD prevalence vari-ation across studies. Ultimately, only standardized andvalid SCD measurement will overcome these limitations,and the SCD field should focus on the development ofsuch an instrument. Our IRT-based item analysis can pro-vide useful information for this. For now, the comparableresults from two complimentary approaches to estimateSCD prevalence across a set of diverse studies, furthersupported by similar results from sensitivity analyses, pro-vide a more accurate picture of SCD occurrence.
ConclusionsOne in four cognitively unimpaired individuals above 60years of age is estimated to experience and report SCD.However, SCD is likely to indicate a pre-stage of AD orother dementing disorders in only the minority of cases.Nevertheless, the frequent occurrence of SCD warrantsfurther research of its significance for dementia, and, im-portantly, on ways to manage SCD in clinical practice.The development and application of a standardizedmeasure to assess SCD is imperative to further our un-derstanding of SCD.
Supplementary informationThe online version contains supplementary material available at https://doi.org/10.1186/s13195-020-00734-y .
Additional file 1.
Abbreviations2-PL: 2 Parameter Logistic Model; 95%CI: 95% confidence interval;AD: Alzheimer’s disease; COSMIC: Cohort Studies of Memory in anInternational Consortium; EAS: Einstein Aging Study; EPIDEMCA: Epidemiology of Dementia in Central AfricaESPRITEtude SantéPsychologique et Traitement; GDS: Geriatric Depression Scale; HIC: High-income country; IADL: Instrumental activities of daily functioning; ISCED: International Standard Classification of Education; IPD: Individualparticipant data; IQCODE: Informant Questionnaire on Cognitive Decline inthe Elderly; IRT: Item Response Theory; LEILA75+: Leipzig Longitudinal Studyof the Aged; LMIC: Low- and middle-income countries; LRGS-TUA: Long-termResearch Grant Scheme - Towards Useful Aging; MAAS: Maastricht AgingStudy; MBI: Mild Behavioral Impairment; MCI: Mild Cognitive Impairment;MMSE: Mini-Mental State Examination; MoVIES: Monongahela ValleyIndependent Elders Survey; NIA-AA: National Institute on Aging andAlzheimer’s Association; PATH: Personality and Total Health Through LifeProject; QH: Qualitative Harmonization; SCD: Subjective Cognitive Decline;SCD-I: Subjective Cognitive Decline-Initiative; SD: Standard Deviation;SMCQ: Subjective Memory Complaints-Questionnaire; SydneyMAS: SydneyMemory and Ageing Study; UNESCO: United Nations Educational, Scientificand Cultural Organization
AcknowledgementsNot applicable.
Röhr et al. Alzheimer's Research & Therapy (2020) 12:167 Page 11 of 14

Code availabilityNot applicable.
Authors’ contributionsSR and AP concepted the work, analyzed the data, and drafted the work.SRH, YT, CB, FEM, RBL, MJK, MG, PMP, PM, KR, AG, KWK, SS, MvB, SK, MGa,KJA, NC, SK, TPN, HB, RLA, and PS design the individual cohort studies andcollected the data. All authors interpreted data for the work, revised it forimportant intellectual content, approved the final version of the manuscriptto be published, and agreed to be accountable for all aspects of the work inensuring that questions related to the accuracy or integrity of any part ofthe work are appropriately investigated and resolved.
FundingSusanne Röhr was supported by the LIFE—Leipzig Research Center forCivilization Diseases, University of Leipzig, funded by the European SocialFund and the Free State of Saxony (grant number LIFE-103 P1). Thiswork was further supported by a grant from the Hans and Ilse BreuerFoundation. Funding for COSMIC comes from a National Health andMedical Research Council of Australia Program Grant (ID 1093083) (PSS,HB), the National Institute On Aging of the National Institutes of Healthunder Award Number RF1AG057531 (PSS, MG, RBL, KR, KWK, HB), andphilanthropic contributions to The Dementia Momentum Fund (UNSWProject ID PS38235). The funders had no role in study design, data col-lection and analysis, decision to publish, or preparation of the manu-script. The content is solely the responsibility of the authors and doesnot necessarily represent the official views of the National Institutes ofHealth or other funders. Funding for each of the contributing studies isas follows: ActiveAging: no funding; CFAS: major awards from the Med-ical Research Council and the Department of Health, UK; EAS: Supportedin part by National Institutes of Health grants NIA 2 P01 AG03949, theLeonard and Sylvia Marx Foundation, and the Czap Foundation; EPIDEMCA: French National Research Agency (ANR-09-MNPS-009-01); ESPRIT:Novartis; Invece.Ab: Financed with own funds and supported in part by“Federazione Alzheimer Italia”, Milan, Italy (AG); KLOSCAD: the KoreanHealth Technology R&D Project, Ministry of Health and Welfare, Republicof Korea [Grant No. HI09C1379 (A092077)]; LEILA75+: the InterdisciplinaryCentre for Clinical Research at the University of Leipzig (InterdisziplinäresZentrum für Klinische Forschung/IZKF; grant 01KS9504); LRGS-TUA: Minis-try of Education Longterm Research Grant Scheme (LRGS/BU/2012/UKM–UKM/K/01); MAAS: The Netherlands Organization for Scientific Research(NOW). Grant Number: 002.005.019; MoVIES: Grant # R01AG07562 from theNational Institute on Aging, National Institutes of Health, United StatesDepartment of Health and Human Services; PATH: National Health andMedical Research Council of Australia grants 973302, 179805, 157125,and 1002160; SGS: JSPS KAKENHI Grant Number JP17K09146;SLASII: The SLASII study was supported by research grants from theAgency for Science Technology and Research (A*STAR) BiomedicalResearch Council (BMRC) https://www.a-star.edu.sg/ [Grants 03/1/21/17/214and 08/1/21/19/567] and the National Medical Research Councilhttp://www.nmrc.gov.sg/ [Grant: NMRC/1108/2007]; ZARADEMP: Supported bygrants from the Fondo de Investigación Sanitaria, Instituto de Salud Carlos III,Spanish Ministry of Economy and Competitiveness, Madrid, Spain (grants94/1562, 97/1321E, 98/0103, 01/0255, 03/0815, 06/0617, G03/128), andthe Fondo Europeo de Desarrollo Regional (FEDER) of the European Union andGobierno de Aragón, Group #19. Open Access funding enabled and organizedby Projekt DEAL.
Availability of data and materialsData and material in relation to this study are available for researchers fromthe corresponding author upon reasonable request.
Ethics approval and consent to participateThis study was performed in line with the principles of the Declaration ofHelsinki. The Human Research Ethics Committee of the University of NewSouth Wales (COSMIC coordinator) approved this study (Ref: HC17292). Allcontributing studies had previously obtained approval from their respectiveethics committees (see below).
Study Institutional Review Board
ActiveAging School of Medicine and Health Sciences Atma Jaya CatholicUniversity of Indonesia Ethics Committee (approval 03/04/3014&01/05/2015)
CFAS Anglia and Oxford Multi-centre Research Ethics Committee(MREC) - 99/5/22; Eastern MREC – 99/5/22; Eastern MREC – 05/MREO5/37; NRES Committee East of England – 05/MRE05/37
EAS Albert Einstein College of Medicine Institutional Review Board(Approval#1996-175)
EPIDEMCA Ethical committees, supervised by Ministry of Public Health inCAR (8/UB/FACSS/CSCVPER/11) and the Comité d’Ethique de laRecherche en Sciences de Santé in ROC (00000204/DGRST/CERSSA), approved the study protocol, as well as the “Comitéde la Protection des Personnes Sud-Ouest Outre-Mer” in France(SOOM4/CE/3).
ESPRIT Ethics committee (CCPPRB) of the Kremlin Bicetre hospital (n°registered 99-28)
Invece.Ab Ethics Committee of the University of Pavia (#3/2009)
KLOSCAD Institutional Review Board of Seoul National UniversityBundang Hospital, Korea (IRB No. B-0912/089-010)
LEILA75+ Ethics committee of the University of Leipzig (C7 79,934,700)
LRGS-TUA Medical Research and Ethics Committee of UniversitiKebangsaan Malaysia (NN-060-2013).Ministry of Education Longterm Research Grant Scheme (LRGS/BU/2012/UKM–UKM/K/01).
MAAS Ethics committee of Maastricht University Medical Centre(MEC05-107)
MoVIES University of Pittsburgh Institutional Review Board (IRB#961263-0110)
PATH Australian National University Human Research EthicsCommittee (#M9807, #2002/189, #2006/314, # 2010/542,#2001/2, #2009/039)
SGS Institutional Review Board of the Institute of Health Science,Kyushu University (IHS-2010-22)
SLASII National University of Singapore Institutional Review Board(NUS IRB 04-140, 17 June 2004)
SydneyMAS
University of New South Wales Human Research EthicsCommittee (approval #14327)
ZARADEMP Ethics committee of the Zaragoza University Hospital (CEICA #CP16/2012)
Informed consent was obtained from all individual participants included inthe study.
Consent for publicationNot applicable.
Competing interestsNone.
Author details1Institute of Social Medicine, Occupational Health and Public Health (ISAP),Medical Faculty, University of Leipzig, Philipp-Rosenthal-Straße 55, 04103Leipzig, Germany. 2Global Brain Health Institute (GBHI), Trinity College Dublin,Dublin, Ireland. 3Department of Psychiatry, University of Cologne, MedicalFaculty, Cologne, Germany. 4German Center for Neurodegenerative Diseases(DZNE), Bonn, Germany. 5Department of Neurology, School of Medicine,Atma Jaya Catholic University of Indonesia, Jakarta, Indonesia. 6Center forHealth Research, School of Medicine, Atma Jaya Catholic University of
Röhr et al. Alzheimer's Research & Therapy (2020) 12:167 Page 12 of 14

Indonesia, Jakarta, Indonesia. 7Cambridge Public Health, CambridgeUniversity, Cambridge, UK. 8MRC Biostatistics Unit, Institute of Public Health,Cambridge University, Cambridge, UK. 9Institute of Health and Society,Newcastle University, Newcastle upon Tyne, UK. 10Saul R. Korey Departmentof Neurology, Albert Einstein College of Medicine, Yeshiva University, NewYork, NY, USA. 11Department of Epidemiology and Population Health, AlbertEinstein College of Medicine, Yeshiva University, New York, NY, USA.12Department of Psychiatry and Behavioral Medicine, Albert Einstein Collegeof Medicine, Yeshiva University, New York, NY, USA. 13INSERM, U1094,Tropical Neuroepidemiology, Limoges, France. 14Univ. Limoges, U1094,Tropical Neuroepidemiology, Institute of Epidemiology and TropicalNeurology, GEIST, Limoges, France. 15IRD, Associated Unit, TropicalNeuroepidemiology, Limoges, France. 16CHU, Department of MedicalInformation & Evaluation, Clinical Research and Biostatistic Unit, Limoges,France. 17Department of Neurology, Amitié Hospital, Bangui, Central AfricanRepublic. 18INSERM U1061 Neuropsychiatry: Epidemiological and ClinicalResearch, La Colombière Hospital, Montpellier Cedex 5, Université deMontpellier, Montpellier, France. 19Centre for Clinical Brain Sciences,University of Edinburgh, Edinburgh, UK. 20Golgi Cenci Foundation, Corso SanMartino 10, 20081 Abbiategrasso, Italy. 21Department of Neuropsychiatry,Seoul National University Bundang Hospital, Seongnam, Republic of Korea.22Department of Psychiatry, Seoul National University College of Medicine,Seoul, Republic of Korea. 23Department of Brain and Cognitive Science, SeoulNational University College of Natural Sciences, Seoul, Republic of Korea.24Centre of Healthy Aging and Wellness, Faculty of Health Sciences, UniversitiKebangsaan Malaysia, Kuala Lumpur, Malaysia. 25Centre for RehabilitationScience and Special Needs, Faculty of Health Science, Universiti KebangsaanMalaysia, Kuala Lumpur, Malaysia. 26School of Health Science, Universiti SainsMalaysia, Kota Bharu, Kelantan, Malaysia. 27Department of Psychiatry andNeuropsychology, School for Mental Health and Neuroscience (MHeNs),Maastricht University Medical Center (MUMC), Maastricht, The Netherlands.28Department of Psychiatry, University of Pittsburgh School of Medicine,Pittsburgh, PA, USA. 29Department of Neurology, University of PittsburghSchool of Medicine, Pittsburgh, PA, USA. 30Department of Epidemiology,University of Pittsburgh Graduate School of Public Health, Pittsburgh, PA,USA. 31Ageing Futures Institute, University of New South Wales, Sydney,NSW, Australia. 32Neuroscience Research Australia, Sydney, NSW, Australia.33Centre for Research on Ageing, Health and Wellbeing, College of Healthand Medicine, Australian National University, Canberra, ACT, Australia.34Center for Health Science and Counseling, Kyushu University, 744 Motooka,Nishi-ku, Fukuoka 819-0395, Japan. 35Department of Epidemiology and PublicHealth, Graduate School of Medical Sciences, Kyushu University, 3-1-1Maidashi, Higashi-ku, Fukuoka 812-8582, Japan. 36Faculty ofSocio-Environmental Studies, Department of Socio-Environmental Studies,Fukuoka Institute of Technology, 3-30-1 Wajiro-higashi, Higashi-ku, Fukuoka811-0295, Japan. 37Department of Psychological Medicine, Yong Loo LinSchool of Medicine, National University of Singapore, Singapore, Singapore.38Centre for Healthy Brain Ageing, School of Psychiatry, University of NewSouth Wales Sydney, Sydney, Australia. 39Dementia Collaborative ResearchCentre, School of Psychiatry, University of New South Wales Sydney, Sydney,Australia. 40Department of Developmental Disability Neuropsychiatry,University of New South Wales Sydney, Sydney, Australia. 41Centro deInvestigación Biomédica en Red de Salud Mental (CIBERSAM), Ministry ofScience and Innovation, Madrid, Spain. 42Department of Medicine andPsychiatry, Universidad de Zaragoza and Instituto de Investigación SanitariaAragón, Zaragoza, Spain. 43Department of Psychology and Sociology,Universidad de Zaragoza, Zaragoza, Spain. 44Department of Microbiology,Preventive Medicine and Public Health, University of Zaragoza, Zaragoza,Spain.
Received: 3 July 2020 Accepted: 26 November 2020
References1. Alzheimer’s Disease International: World Alzheimer Report 2016 - Improving
healthcare for people living with dementia: Coverage, quality and costsnow and in the future. https://www.alzint.org/u/WorldAlzheimerReport2016.pdf.Accessed 5 Nov 2020.
2. Slot RER, Sikkes SAM, Berkhof J, et al. Subjective cognitive decline and ratesof incident Alzheimer’s disease and non-Alzheimer’s disease dementia.Alzheimers Dement. 2019;15:465–76.
3. Jessen F, Amariglio RE, van Boxtel M, et al. A conceptual framework forresearch on subjective cognitive decline in preclinical Alzheimer’s disease.Alzheimers Dement. 2014;10:844–52.
4. Jack CR Jr, Bennett DA, Blennow K, et al. NIA-AA Research Framework:toward a biological definition of Alzheimer’s disease. Alzheimers Dement.2018;14:535–62.
5. Rabin LA, Smart CM, Amariglio RE. Subjective cognitive decline in preclinicalAlzheimer’s disease. Annu Rev Clin Psychol. 2017;13:369–96.
6. Jessen F, Amariglio RE, Buckley RF, et al. The characterisation of subjectivecognitive decline. Lancet Neurol. 2020;19:195–278.
7. Molinuevo JL, Rabin LA, Amariglio R, et al. Implementation of subjectivecognitive decline criteria in research studies. Alzheimers Dement. 2017;13:296–311.
8. Reisberg B, Ferris SH, de Leon MJ, Crook T. The Global Deterioration Scalefor assessment of primary degenerative dementia. Am J Psychiatry. 1982;139:1136–9.
9. Rabin LA, Smart CM, Crane PK, et al. Subjective cognitive decline in olderadults: an overview of self-report measures used across 19 internationalresearch studies. J Alzheimers Dis. 2015;48(Suppl1):S63–86.
10. Jonker C, Geerlings MI, Schmand B. Are memory complaints predictive fordementia? A review of clinical and population-based studies. Int J GeriatrPsychiatry. 2000;15:983–91.
11. Vlachos GS, Cosentino S, Kosmidis MH, et al. Prevalence and determinantsof subjective cognitive decline in a representative Greek elderly population.Int J Geriatr Psychiatry. 2019;34(6):846–54.
12. Roehr S, Riedel-Heller SG, Kaduszkiewicz H, et al. Is function in instrumentalactivities of daily living a useful feature in predicting Alzheimer’s diseasedementia in subjective cognitive decline? Int J Geriatr Psychiatry. 2019;34:193–203.
13. Hao L, Wang X, Zhang L, et al. Prevalence, risk factors, and complaintsscreening tool exploration of subjective cognitive decline in a large cohortof the Chinese population. J Alzheimers Dis. 2017;60:371–88.
14. Thompson A. Thinking big: large-scale collaborative research inobservational epidemiology. Eur J Epidemiol. 2009;24:727–31.
15. Sachdev PS, Lipnicki DM, Kochan NA, et al. COSMIC (Cohort Studies ofMemory in an International Consortium): an international consortium toidentify risk and protective factors and biomarkers of cognitive ageing anddementia in diverse ethnic and sociocultural groups. 2013;13:165–BMCNeurol.
16. Schneider SL. The International Standard Classification of Education 2011. In:Class and Stratification Analysis. p. 365–79.
17. Fantom N. Serajuddin U. The World Bank: The World Bank’s classification ofcountries by income; 2016.
18. Youn JC, Kim KW, Lee DY, et al. Development of the subjective memorycomplaints questionnaire. Dement Geriatr Cogn Disord. 2009;27(4):310–7.
19. Sheikh JI, Yesavage JA. Geriatric Depression Scale (GDS): recent evidenceand development of a shorter version. Clin Gerontol. 1986;5:165–73.
20. Jorm AF, Jacomb PA. The Informant Questionnaire on Cognitive Decline inthe Elderly (ICODE): socio-demographic correlates, reliability, validity andsome norms. Psychol Med. 1989;19:1015–22.
21. Gatz M, Reynolds CA, Finkel D, Hahn CJ, Zhou Y, Zavala C. Dataharmonization in aging research: not so fast. Exp Aging Res. 2015;41:475–95.
22. Bauer DJ, Hussong AM. Psychometric approaches for developingcommensurate measures across independent studies: traditional and newmodels. Psychol Methods. 2009;14:101–25.
23. Straat JH, van der Ark LA, Sijtsma K. Comparing optimization algorithms foritem selection in Mokken scale analysis. J Classif. 2013;30:75–99.
24. Raykov T, Marcoulides GA. A course in item response theory and modelingwith Stata. College Station: Stata Press; 2018. A Stata Press publication.
25. Folstein MF, Folstein SE, McHugh PR. “Mini-mental state”. A practicalmethod for grading the cognitive state of patients for the clinician.J Psychiatr Res. 1975;12:189–98.
26. Blessed G, Tomlinson BE, Roth M. The association between quantitativemeasures of dementia and of senile change in the cerebral gray matter ofelderly subjects. Br J Psychiatry. 1968;114:797–811.
27. Thal LJ, Grundman M, Golden R. Alzheimer’s disease: a correlational analysisof the Blessed Information-Memory-Concentration Test and the Mini-MentalState Exam. Neurology. 1986;36:262–4.
28. Hall KS, Gao S, Emsley CL, Ogunniyi AO, Morgan O, Hendrie HC. Communityscreening interview for dementia (CSI ‘D’); performance in five disparatestudy sites. Int J Geriatr Psychiatry. 2000;15:521–31.
Röhr et al. Alzheimer's Research & Therapy (2020) 12:167 Page 13 of 14
29. Crane PK, Narasimhalu K, Gibbons LE, et al. Item response theory facilitatedcocalibrating cognitive tests and reduced bias in estimated rates of decline.J Clin Epidemiol. 2008;61:1018–27.
30. Lawton MP, Brody EM. Assessment of older people: self-maintaining andinstrumental activities of daily Living1. The Gerontologist. 1969;9:179–86.
31. Lipnicki DM, Crawford JD, Dutta R, et al. Age-related cognitive decline andassociations with sex, education and apolipoprotein E genotype acrossethnocultural groups and geographic regions: a collaborative cohort study.PLoS Med. 2017;14:e1002261.
32. Lipnicki DM, Makkar SR, Crawford JD, et al. Determinants of cognitiveperformance and decline in 20 diverse ethno-regional groups: a COSMICcollaboration cohort study. PLoS Med. 2019;16:e1002853.
33. van Belle G, Fisher L. Biostatistics: a methodology for the health sciences.2nd ed. Hoboken: Wiley; 2004. Wiley series in probability and statistics.
34. Team RC. R: a language and environment for statistical computing. Vienna:R Foundation for Statistical Computing; 2007.
35. Grabe M. Measurement uncertainties in science and technology. Berlin,Heidelberg: Springer-Verlag Berlin Heidelberg, 2005.
36. Sachdev PS, Lipnicki DM, Kochan NA, et al. The prevalence of mild cognitiveimpairment in diverse geographical and Ethnocultural regions: the COSMICcollaboration. PLoS One. 2015;10:e0142388.
37. Donovan NJ, Amariglio RE, Zoller AS, et al. Subjective cognitive concernsand neuropsychiatric predictors of progression to the early clinical stages ofAlzheimer disease. Am J Geriatr Psychiatry. 2014;22:1642–51.
38. Ismail Z, Smith EE, Geda Y, Sultzer D, Brodaty H, Smith G, et al.Neuropsychiatric symptoms as early manifestations of emergent dementia:provisional diagnostic criteria for mild behavioral impairment. AlzheimersDement. 2016;12:195–202.
39. Kim J-M, Stewart R, Shin I-S, Choi S-K, Yoon J-S. Subjective memoryimpairment, cognitive function and depression—a community study inolder Koreans. Dement Geriatr Cogn Disord. 2003;15:218–25.
40. Müller-Gerards D, Weimar C, Abramowski J, et al. Subjective cognitivedecline, APOE ε4, and incident mild cognitive impairment in men andwomen. Alzheimers Dement: DADM. 2019;11:221–30.
41. Wang L, van Belle G, Crane PK, et al. Subjective memory deterioration and futuredementia in people aged 65 and older. J Am Geriatr Soc. 2004;52:2045–51.
42. Buckley R, Saling MM, Ames D, et al. Factors affecting subjective memorycomplaints in the AIBL aging study: biomarkers, memory, affect, and age. IntPsychogeriatr. 2013;25:1307–15.
43. Taylor CA, Bouldin ED, McGuire LC. Subjective cognitive decline amongadults aged ≥45 years - United States, 2015-2016. MMWR Morb Mortal WklyRep. 2018;67:753–7.
44. Stern Y, Arenaza-Urquijo EM, Bartrés-Faz D, et al. Whitepaper: defining andinvestigating cognitive reserve, brain reserve, and brain maintenance.Alzheimers Dement. 2018. https://doi.org/10.1016/j.jalz.2018.07.219 [Epubahead of print].
45. Jackson JD, Rentz DM, Aghjayan SL, et al. Subjective cognitive concerns areassociated with objective memory performance in Caucasian but notAfrican-American persons. Age Ageing. 2017;46:988–93.
46. Braveman P, Gottlieb L. The social determinants of health: it’s time to considerthe causes of the causes. Public Health Rep. 2014;129(Suppl2):19–31.
47. Roehr S, Pabst A, Luck T, Riedel-Heller SG. Is dementia incidence decliningin high-income countries? A systematic review and meta-analysis. ClinEpidemiol. 2018;10:1233–47.
48. Prince M, Wimo AGM, Ali GC, Wu YT, Prina M. World Alzheimer Report 2015:the global impact of dementia: an analysis of prevalence, incidence, costand trends. London: Alzheimer’s Disease International; 2015.
49. Mendonca MD, Alves L, Bugalho P. From subjective cognitive complaints todementia: who is at risk?: a systematic review. Am J Alzheimers Dis OtherDement. 2016;31:105–14.
50. Roehr S, Luck T, Pabst A, et al. Subjective cognitive decline is longitudinallyassociated with lower health-related quality of life. Int Psychogeriatr. 2017;29:1939–50.
51. Waldorff FB, Siersma V, Waldemar G. Association between subjectivememory complaints and health care utilisation: a three-year follow up. BMCGeriatr. 2009;9:43.
52. Bhome R, Berry AJ, Huntley JD, Howard RJ. Interventions for subjectivecognitive decline: systematic review and meta-analysis. BMJ Open. 2018;8:e021610.
53. Livingston G, Sommerlad A, Orgeta V, et al. Dementia prevention,intervention, and care. Lancet. 2017;390:2673–734.
Publisher’s NoteSpringer Nature remains neutral with regard to jurisdictional claims inpublished maps and institutional affiliations.
Röhr et al. Alzheimer's Research & Therapy (2020) 12:167 Page 14 of 14