Study Plan 1 - · PDF fileDraft Report Dissolved Oxygen, Water ... the 3 MW Mason Dam...
57
Transcript of Study Plan 1 - · PDF fileDraft Report Dissolved Oxygen, Water ... the 3 MW Mason Dam...

Study Plan 1
Draft Report
Dissolved Oxygen, WaterQuality, and TemperatureAssessment
Mason Dam ProjectP-12686-001
Baker County, Oregon
March 2008

1.0 April 2007 Study Plan 2
2.0 Mason Dam Water Quality Technical Memorandum 322.1 Appendix A 452.2 Appendix B 46
3.0 Appendix 553.1 Water Quality Field Data 3.2 Bureau of Reclamation Stream Flow, Forebay Elevation, Reservoir Storage,
Air Temperature, Water Temperature3.3 Sunrise/Sunset times3.4 Calibration Logs
Table of Contents
1

1.0 April 2007 Study Plan
2
STUDY PLAN 1: DISSOLVED OXYGEN, WATER QUALITY ANDTEMPERATURE ASSESSMENT
1.0 Introduction
Baker County filled for their preliminary license and received it on October 8, 2003 forthe 3 MW Mason Dam Hydroelectric Project (Project No. P-12058-002). The project isrun of release meaning Baker County does not and will not have any control over therelease of the water at Mason Dam. The Bureau Of Reclamation and Baker ValleyIrrigation District have control of the release of water and will not change water flows atBaker County’s request.
The project consists of two small turbines that will be housed in a power plant at the baseof Mason Dam. The power generated will be sent approximately 1 mile to an existingIdaho Power Company 138kv transmission line. The 34.5kv power line connecting thepower plant to the substation and then to the 138kv transmission line will be buried in theBlack Mountain Road right of way.
The project boundary consists of 100 feet beyond the area that contains the powerhouseand tailrace facilities, and the substation to the interconnect with IPC transmission line. Italso includes 50 feet on each side of the underground power line that will be placed in theBlack Mountain Road right of way.
1. 1 Goals and Objectives
These studies were requested by the Oregon Department of Environmental Quality(ODEQ) and FERC. They contain requests for much of the same information and havebeen combined.
The goal of this study is to evaluate the dissolved oxygen (DO) concentration of waterentering the Mason Dam intake within Phillips Reservoir, and then dischargedimmediately downstream of the Dam into the Powder River, during summer conditions.The objective of this proposed study is to define a baseline condition that will provide fora better understanding of the potential for project-related effects, and possible mitigationstrategies. Specifically, the objectives of the study are to:
1. Identify the dissolved oxygen and temperature profile within PhillipsReservoir, in the vicinity of the Mason Dam intake.
2. Identify the DO concentration of water entering the Mason Dam intake at itsapproximate depth and vicinity.
3. Describe any temporal variations of DO concentration and temperature.
4. Identify and describe reservoir stratification.
3

5. Describe the DO concentration of water in the stilling basin immediatelybelow Mason Dam.
6. Describe the attenuation of DO in the Powder River downstream of MasonDam.
Work with ODEQ on developing a Section 401 application. We will consider Section 303(water quality standards and implementation plans) in applying for a 401-certificationevaluation for the FERC license.As the parameters and specifics of the project are finalized, Baker County will work withODEQ staff on the necessary studies to achieve 401 Certification.
Construction activities associated with the building of the Project will be ‘bestmanagement practices’ as identified by consensus of all resource agencies.
1.2 Relevant Resource Management Goals
Adequate concentrations of dissolved oxygen are required by aquatic organisms forsubsistence, and are therefore essential to the integrity and sustainability of a healthyecosystem.Ensuring that the effect of the project construction and operation pertaining to thisresource is considered in a reasoned way is relevant to the Commissions public interestdetermination.
401 Certification with the State of Oregon is mandated by federal and state laws andguidelines. Baker County is a public entity and as such is bound by best managementpractices and the preservation of all natural resources.
1.3 Background and Existing Information
The project does not propose changing the intake point for water from Mason Dam. Theeffect on water quality should be minimal but baseline data is lacking for possible effectsto the project. This data will be needed in order to receive 401 certification from ODEQ.
1.4 Project Nexus
Water quality issues do fall within the Project boundary. Currently, water releases madefrom Mason Dam are drawn from the hypolimnetic region of Phillips Reservoir. Thewater released from Mason Dam demonstrates high levels of kinetic energy asdemonstrated by its extremely turbulent nature. Turbulence increases the surface area ofwater, allowing for greater assimilation of atmospheric gases (including oxygen) into thewater. Project-related actions, such as the installation of a turbine, will harness the kineticenergy of the water, thereby reducing the turbulence of water entering the stilling basin.This will result in a reduction in the amount of surface area, limiting the water’s ability todissolve oxygen into solution. If water in the vicinity of the intake structure withinPhillips Reservoir has a low dissolved oxygen content, operation of the project could
4

result in the perpetuation of low DO waters downstream of Mason Dam; Potentiallyresulting in biological consequences. Since the project’s intake system will remain thesame, little impact to temperature and thermal stratification are anticipated.
The dissolved oxygen study will help establish a baseline condition for the system inquestion, and form the basis for inclusion of potential license articles to protect the waterquality of the Powder River downstream of Mason Dam. All other water quality studiesas identified by ODEQ to achieve 401 Certification will result in sound water qualitybaselines and results.
1.5 Proposed Methodology
The proposed methodology for this study is contained in the following Quality AssuranceProject Plan.
1.6 Level of Effort and Cost
Baker County will work with all agencies to tie together, when possible, all studieseffecting water and fish issues.
The estimated cost of dissolved oxygen and temperature assessment work isapproximately $6400. The study should be completed within one year. When this studywill be performed will be determined after consultation with all involved agencies. It isexpected to take one or two technicians four or five hours per week, for approximately 12weeks to conduct the fieldwork. Report preparation should take a biologist half aworkday.
The cost of 401 Certification and level of studies are to be determined.
5
QUALITY ASSURANCE PROJECTPLANWater Quality Monitoring Project on thePowder River prior to construction of Hydro-Electric Power Plant at Mason Dam
Version 2.0a – May 21, 2007
6
II
Project Management
A1. Title and Approval Sheet
Baker County1995 Third StreetBaker City, OR97814Phone: (541) 523-6416([email protected])
Jason YencopalProject Coordinator Date
Jason YencopalLaboratory Manager Date
Jason YencopalField Sampling Leader Date
Jason YencopalQuality Assurance Officer (QAO) Date
7

Powder River WQ Study: Baker CountyMay 21, 2007
Version 2.0a III
This page intentionally left blank
8

Powder River WQ Study Baker CountyMay 21, 2007
Version 2.0a IV
A2. Table of ContentsGroup A Project Management ................................................................................................. II
A1. Title and Approval Sheet ............................................................................................... IIA2. Table of Contents ........................................................................................................ IVA3. Distribution List..............................................................................................................1A4. Project/Task Organization.............................................................................................2A5. Problem Definition/Background.....................................................................................2A6. Project Task/Description ...............................................................................................2A7. Quality Objectives and Criteria......................................................................................4A8. Special Training and Certification..................................................................................8A9. Documentation and Records.........................................................................................8
Group B Data Generation and Acquisition...............................................................................9B1. Sampling Process Design .............................................................................................9B2. Sampling Methods.......................................................................................................10B3. Sample Handling and Custody Procedures ................................................................10B4. Analytical Methods ......................................................................................................10B5. Quality Control.............................................................................................................10B6. Instrument/Equipment Testing, Inspection, and Maintenance ....................................10B7. Instrument Calibration and Frequency ........................................................................10B8. Inspection/Acceptance of Supplies and Consumables ...............................................10B9. Non-direct Measurements ...........................................................................................11B10. Data Management.......................................................................................................11
Group C Assessment and Oversight .....................................................................................12C1. Assessment and Response Actions............................................................................12C2. Reports to Management..............................................................................................12
Group D Data Validation and Usability ..................................................................................13D1. Data Review, Verification and Validation ....................................................................13D2. Verification and Validation Methods ............................................................................13D3. Reconciliation with User Requirements.......................................................................13
List of Tables & FiguresTable 1 Distribution List ................................................................................................................1Table 2 Project /Task Responsibilities ..........................................................................................2Table 3 Sample Locations ............................................................................................................3Table 4 Data Quality Criteria.........................................................................................................7Table 5 Revision History .............................................................................................................16
AppendicesAppendix A..................................................................................................................................14Appendix B - Field Data Forms...............................................................................................15Appendix C - Revision History ................................................................................................16
9
Powder River Study Baker CountyMay 21, 2007
Version 2.0a Page 1 of 17
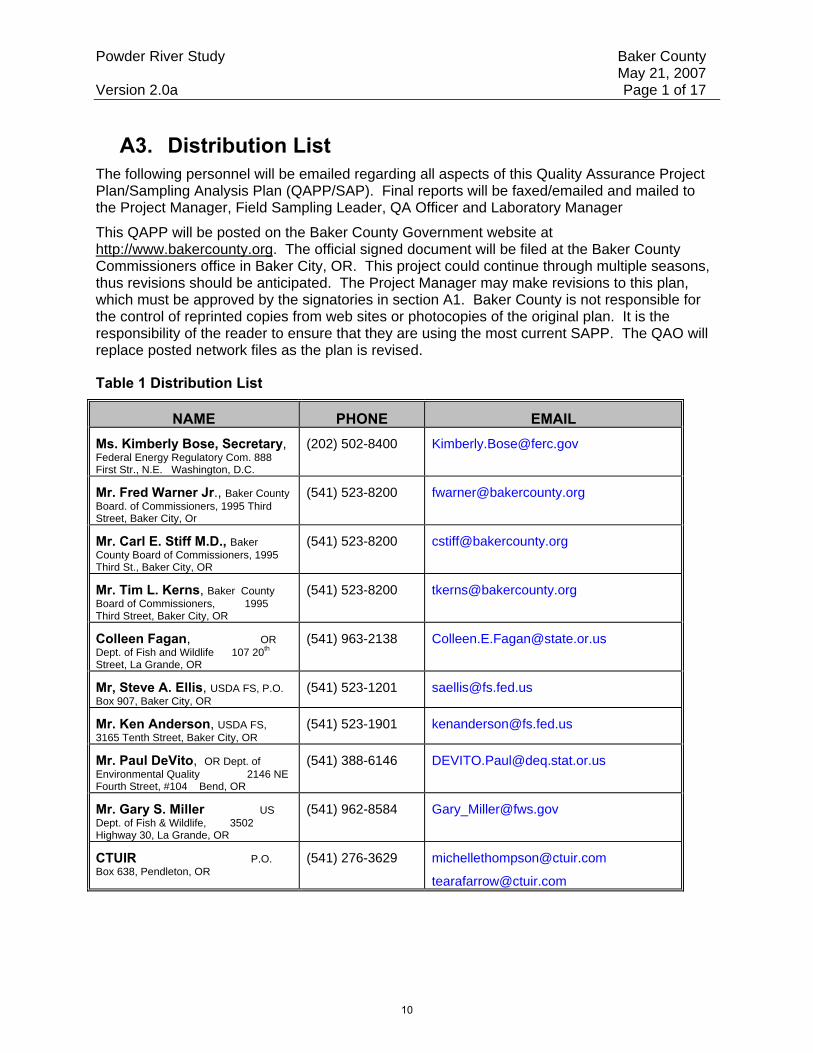
A3. Distribution ListThe following personnel will be emailed regarding all aspects of this Quality Assurance ProjectPlan/Sampling Analysis Plan (QAPP/SAP). Final reports will be faxed/emailed and mailed tothe Project Manager, Field Sampling Leader, QA Officer and Laboratory Manager
This QAPP will be posted on the Baker County Government website athttp://www.bakercounty.org. The official signed document will be filed at the Baker CountyCommissioners office in Baker City, OR. This project could continue through multiple seasons,thus revisions should be anticipated. The Project Manager may make revisions to this plan,which must be approved by the signatories in section A1. Baker County is not responsible forthe control of reprinted copies from web sites or photocopies of the original plan. It is theresponsibility of the reader to ensure that they are using the most current SAPP. The QAO willreplace posted network files as the plan is revised.
Table 1 Distribution List
NAME PHONE EMAILMs. Kimberly Bose, Secretary,Federal Energy Regulatory Com. 888First Str., N.E. Washington, D.C.
(202) 502-8400 [email protected]
Mr. Fred Warner Jr., Baker CountyBoard. of Commissioners, 1995 ThirdStreet, Baker City, Or
(541) 523-8200 [email protected]
Mr. Carl E. Stiff M.D., BakerCounty Board of Commissioners, 1995Third St., Baker City, OR
(541) 523-8200 [email protected]
Mr. Tim L. Kerns, Baker CountyBoard of Commissioners, 1995Third Street, Baker City, OR
(541) 523-8200 [email protected]
Colleen Fagan, ORDept. of Fish and Wildlife 107 20th
Street, La Grande, OR
(541) 963-2138 [email protected]
Mr, Steve A. Ellis, USDA FS, P.O.Box 907, Baker City, OR
(541) 523-1201 [email protected]
Mr. Ken Anderson, USDA FS,3165 Tenth Street, Baker City, OR
(541) 523-1901 [email protected]
Mr. Paul DeVito, OR Dept. ofEnvironmental Quality 2146 NEFourth Street, #104 Bend, OR
(541) 388-6146 [email protected]
Mr. Gary S. Miller USDept. of Fish & Wildlife, 3502Highway 30, La Grande, OR
(541) 962-8584 [email protected]
CTUIR P.O.Box 638, Pendleton, OR
(541) 276-3629 [email protected]
10
Powder River Study Baker CountyMay 21, 2007
Version 2.0a Page 2 of 17
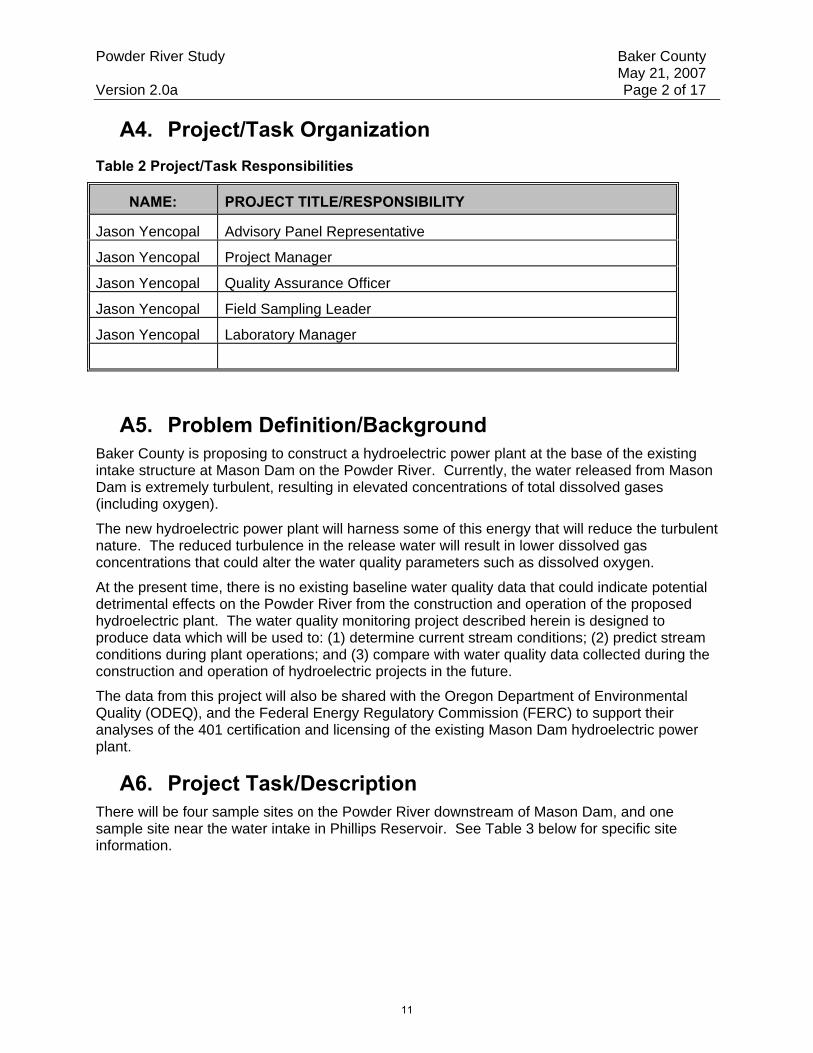
A4. Project/Task OrganizationTable 2 Project/Task Responsibilities
NAME: PROJECT TITLE/RESPONSIBILITY
Jason Yencopal Advisory Panel Representative
Jason Yencopal Project Manager
Jason Yencopal Quality Assurance Officer
Jason Yencopal Field Sampling Leader
Jason Yencopal Laboratory Manager
A5. Problem Definition/BackgroundBaker County is proposing to construct a hydroelectric power plant at the base of the existingintake structure at Mason Dam on the Powder River. Currently, the water released from MasonDam is extremely turbulent, resulting in elevated concentrations of total dissolved gases(including oxygen).
The new hydroelectric power plant will harness some of this energy that will reduce the turbulentnature. The reduced turbulence in the release water will result in lower dissolved gasconcentrations that could alter the water quality parameters such as dissolved oxygen.
At the present time, there is no existing baseline water quality data that could indicate potentialdetrimental effects on the Powder River from the construction and operation of the proposedhydroelectric plant. The water quality monitoring project described herein is designed toproduce data which will be used to: (1) determine current stream conditions; (2) predict streamconditions during plant operations; and (3) compare with water quality data collected during theconstruction and operation of hydroelectric projects in the future.
The data from this project will also be shared with the Oregon Department of EnvironmentalQuality (ODEQ), and the Federal Energy Regulatory Commission (FERC) to support theiranalyses of the 401 certification and licensing of the existing Mason Dam hydroelectric powerplant.
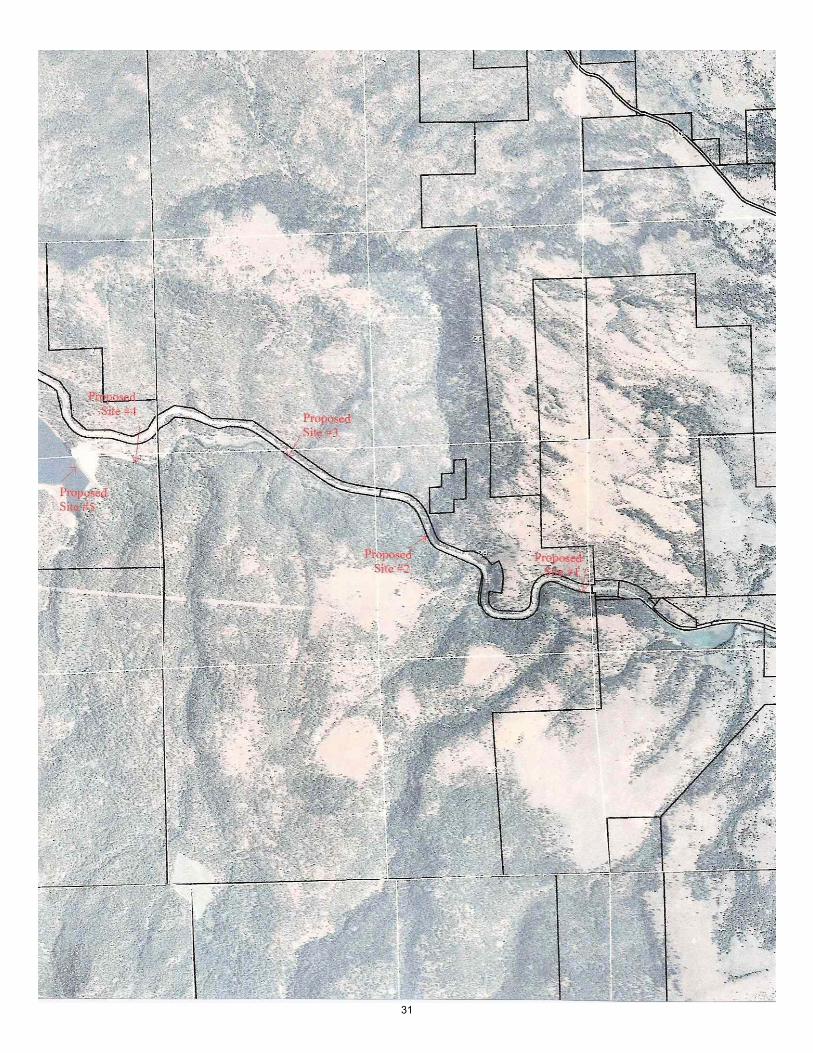
A6. Project Task/DescriptionThere will be four sample sites on the Powder River downstream of Mason Dam, and onesample site near the water intake in Phillips Reservoir. See Table 3 below for specific siteinformation.
11
Powder River Study Baker CountyMay 21, 2007
Version 2.0a Page 3 of 17
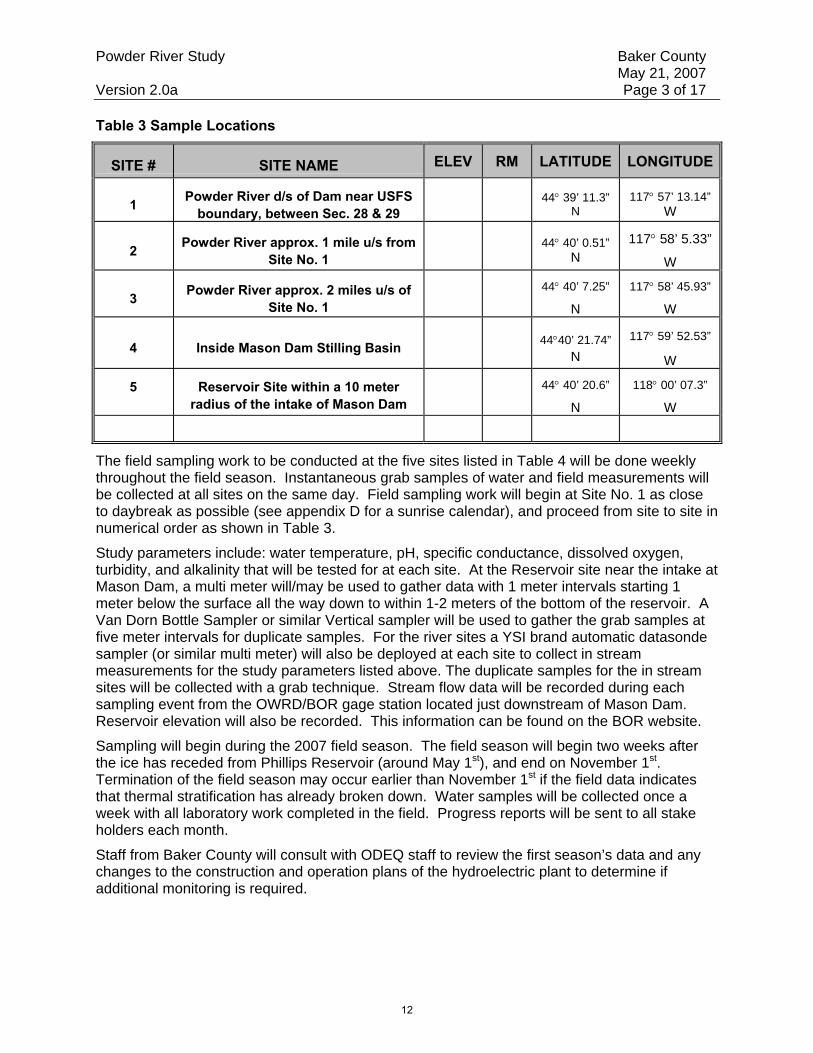
Table 3 Sample Locations
SITE # SITE NAME ELEV RM LATITUDE LONGITUDE
1 Powder River d/s of Dam near USFSboundary, between Sec. 28 & 29
44° 39’ 11.3”N
117° 57’ 13.14”W
2 Powder River approx. 1 mile u/s fromSite No. 1
44° 40’ 0.51”N
117° 58’ 5.33”
W
3 Powder River approx. 2 miles u/s ofSite No. 1
44° 40’ 7.25”
N
117° 58’ 45.93”
W
4 Inside Mason Dam Stilling Basin 44°40’ 21.74”N
117° 59’ 52.53”
W
5 Reservoir Site within a 10 meterradius of the intake of Mason Dam
44° 40’ 20.6”
N
118° 00’ 07.3”
W
The field sampling work to be conducted at the five sites listed in Table 4 will be done weeklythroughout the field season. Instantaneous grab samples of water and field measurements willbe collected at all sites on the same day. Field sampling work will begin at Site No. 1 as closeto daybreak as possible (see appendix D for a sunrise calendar), and proceed from site to site innumerical order as shown in Table 3.
Study parameters include: water temperature, pH, specific conductance, dissolved oxygen,turbidity, and alkalinity that will be tested for at each site. At the Reservoir site near the intake atMason Dam, a multi meter will/may be used to gather data with 1 meter intervals starting 1meter below the surface all the way down to within 1-2 meters of the bottom of the reservoir. AVan Dorn Bottle Sampler or similar Vertical sampler will be used to gather the grab samples atfive meter intervals for duplicate samples. For the river sites a YSI brand automatic datasondesampler (or similar multi meter) will also be deployed at each site to collect in streammeasurements for the study parameters listed above. The duplicate samples for the in streamsites will be collected with a grab technique. Stream flow data will be recorded during eachsampling event from the OWRD/BOR gage station located just downstream of Mason Dam.Reservoir elevation will also be recorded. This information can be found on the BOR website.
Sampling will begin during the 2007 field season. The field season will begin two weeks afterthe ice has receded from Phillips Reservoir (around May 1st), and end on November 1st.Termination of the field season may occur earlier than November 1st if the field data indicatesthat thermal stratification has already broken down. Water samples will be collected once aweek with all laboratory work completed in the field. Progress reports will be sent to all stakeholders each month.
Staff from Baker County will consult with ODEQ staff to review the first season’s data and anychanges to the construction and operation plans of the hydroelectric plant to determine ifadditional monitoring is required.
12
Powder River Study Baker CountyMay 21, 2007
Version 2.0a Page 4 of 17
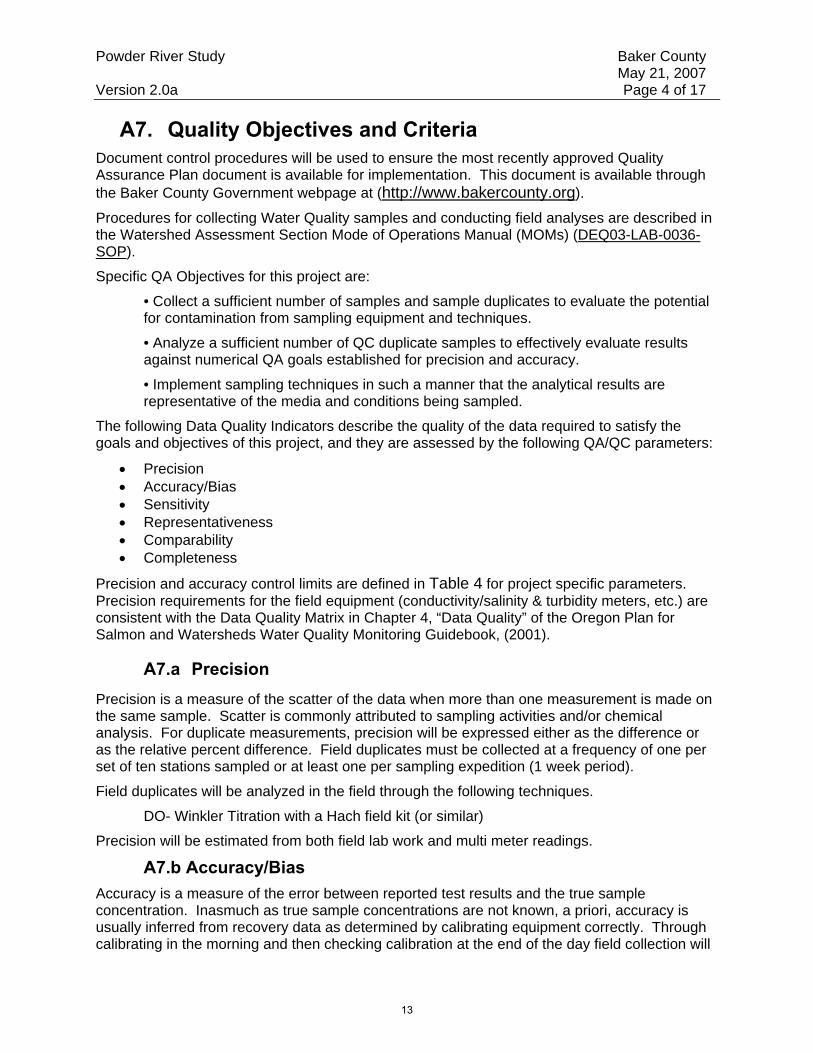
A7. Quality Objectives and CriteriaDocument control procedures will be used to ensure the most recently approved QualityAssurance Plan document is available for implementation. This document is available throughthe Baker County Government webpage at (http://www.bakercounty.org).
Procedures for collecting Water Quality samples and conducting field analyses are described inthe Watershed Assessment Section Mode of Operations Manual (MOMs) (DEQ03-LAB-0036-SOP).
Specific QA Objectives for this project are:
• Collect a sufficient number of samples and sample duplicates to evaluate the potentialfor contamination from sampling equipment and techniques.
• Analyze a sufficient number of QC duplicate samples to effectively evaluate resultsagainst numerical QA goals established for precision and accuracy.
• Implement sampling techniques in such a manner that the analytical results arerepresentative of the media and conditions being sampled.
The following Data Quality Indicators describe the quality of the data required to satisfy thegoals and objectives of this project, and they are assessed by the following QA/QC parameters:
• Precision• Accuracy/Bias• Sensitivity• Representativeness• Comparability• Completeness
Precision and accuracy control limits are defined in Table 4 for project specific parameters.Precision requirements for the field equipment (conductivity/salinity & turbidity meters, etc.) areconsistent with the Data Quality Matrix in Chapter 4, “Data Quality” of the Oregon Plan forSalmon and Watersheds Water Quality Monitoring Guidebook, (2001).
A7.a PrecisionPrecision is a measure of the scatter of the data when more than one measurement is made onthe same sample. Scatter is commonly attributed to sampling activities and/or chemicalanalysis. For duplicate measurements, precision will be expressed either as the difference oras the relative percent difference. Field duplicates must be collected at a frequency of one perset of ten stations sampled or at least one per sampling expedition (1 week period).
Field duplicates will be analyzed in the field through the following techniques.
DO- Winkler Titration with a Hach field kit (or similar)
Precision will be estimated from both field lab work and multi meter readings.
A7.b Accuracy/BiasAccuracy is a measure of the error between reported test results and the true sampleconcentration. Inasmuch as true sample concentrations are not known, a priori, accuracy isusually inferred from recovery data as determined by calibrating equipment correctly. Throughcalibrating in the morning and then checking calibration at the end of the day field collection will
13
Powder River Study Baker CountyMay 21, 2007
Version 2.0a Page 5 of 17
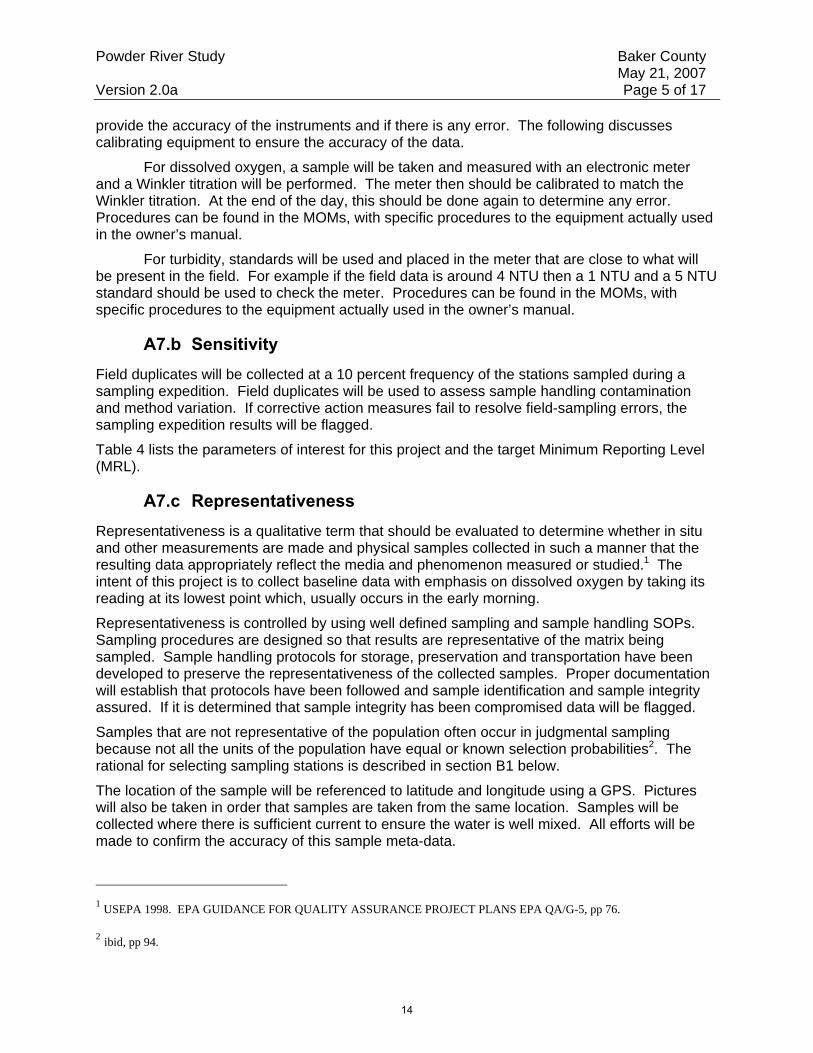
provide the accuracy of the instruments and if there is any error. The following discussescalibrating equipment to ensure the accuracy of the data.
For dissolved oxygen, a sample will be taken and measured with an electronic meterand a Winkler titration will be performed. The meter then should be calibrated to match theWinkler titration. At the end of the day, this should be done again to determine any error.Procedures can be found in the MOMs, with specific procedures to the equipment actually usedin the owner’s manual.
For turbidity, standards will be used and placed in the meter that are close to what willbe present in the field. For example if the field data is around 4 NTU then a 1 NTU and a 5 NTUstandard should be used to check the meter. Procedures can be found in the MOMs, withspecific procedures to the equipment actually used in the owner’s manual.
A7.b SensitivityField duplicates will be collected at a 10 percent frequency of the stations sampled during asampling expedition. Field duplicates will be used to assess sample handling contaminationand method variation. If corrective action measures fail to resolve field-sampling errors, thesampling expedition results will be flagged.
Table 4 lists the parameters of interest for this project and the target Minimum Reporting Level(MRL).
A7.c RepresentativenessRepresentativeness is a qualitative term that should be evaluated to determine whether in situand other measurements are made and physical samples collected in such a manner that theresulting data appropriately reflect the media and phenomenon measured or studied.1 Theintent of this project is to collect baseline data with emphasis on dissolved oxygen by taking itsreading at its lowest point which, usually occurs in the early morning.
Representativeness is controlled by using well defined sampling and sample handling SOPs.Sampling procedures are designed so that results are representative of the matrix beingsampled. Sample handling protocols for storage, preservation and transportation have beendeveloped to preserve the representativeness of the collected samples. Proper documentationwill establish that protocols have been followed and sample identification and sample integrityassured. If it is determined that sample integrity has been compromised data will be flagged.
Samples that are not representative of the population often occur in judgmental samplingbecause not all the units of the population have equal or known selection probabilities2. Therational for selecting sampling stations is described in section B1 below.
The location of the sample will be referenced to latitude and longitude using a GPS. Pictureswill also be taken in order that samples are taken from the same location. Samples will becollected where there is sufficient current to ensure the water is well mixed. All efforts will bemade to confirm the accuracy of this sample meta-data.
TP
1PT USEPA 1998. EPA GUIDANCE FOR QUALITY ASSURANCE PROJECT PLANS EPA QA/G-5, pp 76.
TP
2PT ibid, pp 94.
14

Powder River Study Baker CountyMay 21, 2007
Version 2.0a Page 6 of 17
Quality analytical measurements with poor field duplicate precision may point to samplingproblems or heterogeneous samples and thus not representative of ambient conditions. Toensure the representative data quality indicator is correct, field duplicates must be collectedwithin 15 minutes and 15 meters of each other, where the sample matrix is assumed to behomogeneous. Evaluation of field duplicate and accuracy data will provide information if thereis error in the hypothesis that the sample is homogeneous. If field duplicate data exceedsprecision limits and accuracy data is acceptable, the sampling design may be in error and thedata may not represent the environmental conditions for which it was collected. If field duplicatedata indicates Representativeness is acceptable, data users may assume other project data isaccurate.
If it is determined the field duplicate data is heterogeneous within a 15 minute period or 15 footradius, the subproject/project station data will be flagged data and the data user should use theirprofessional judgment to determine if other project data meets their data quality needs.
If station data is not indicative of the streams normal ambient conditions and the variances areattributable to anomalous environmental conditions, the project station data will be flagged as“Failed” data.
A7.d ComparabilityTo ensure data will be comparable to similar environmental data, the field and analytical staffwill use documented procedures for sampling, sample handling, and sample analysis, which arewritten to comply with nationally accepted methods. Coordination with other agencies isemphasized to ensure that data is comparable. Either use documented procedures as found inthe MOMs or document the procedures used.
A7.e CompletenessIt is expected that samples will be collected from all sites described in this Sampling andAnalysis Plan (SAP) unless seasonal-related events or safety issues prevent sampling. TheProject Manager may authorize re-sampling to obtain more information of qualified data.
15
Powder River WQ Study Baker CountyMay 21, 2007
Version 2.0a Page 7 of 17
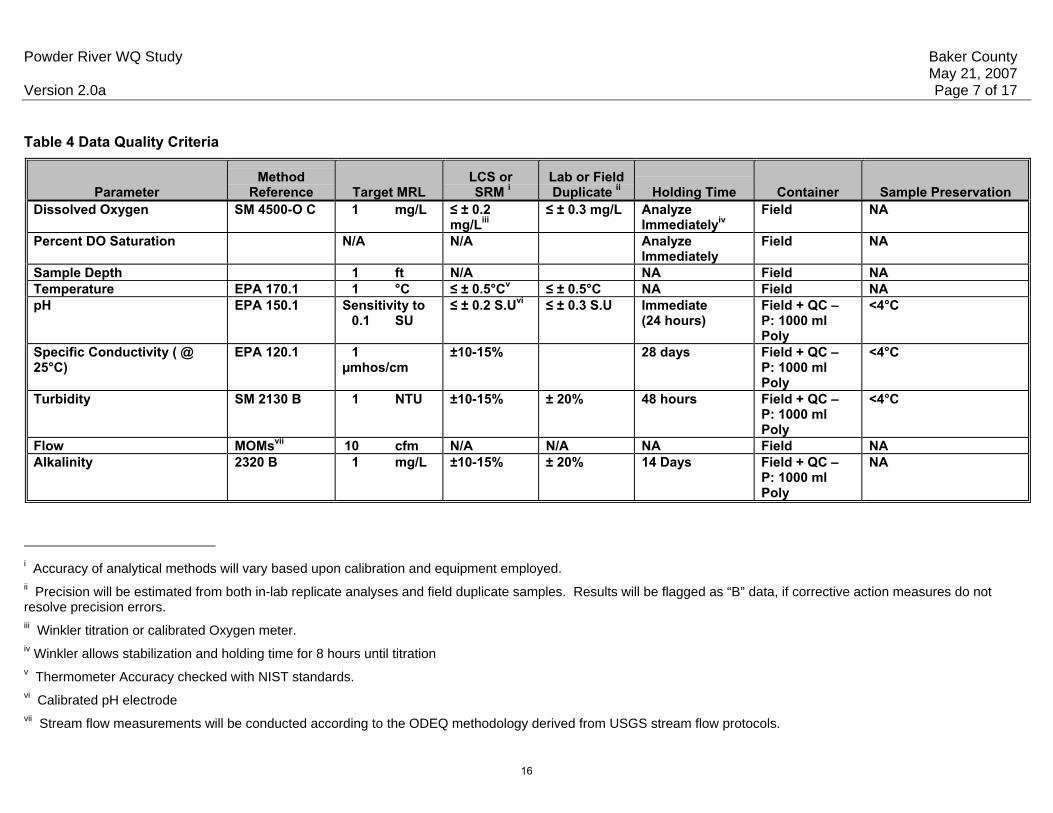
Table 4 Data Quality Criteria
ParameterMethod
Reference Target MRLLCS or SRM i
Lab or FieldDuplicate ii Holding Time Container Sample Preservation
Dissolved Oxygen SM 4500-O C 1 mg/L ≤ ± 0.2mg/Liii
≤ ± 0.3 mg/L AnalyzeImmediatelyiv
Field NA
Percent DO Saturation N/A N/A AnalyzeImmediately
Field NA
Sample Depth 1 ft N/A NA Field NATemperature EPA 170.1 1 °C ≤ ± 0.5°Cv ≤ ± 0.5°C NA Field NApH EPA 150.1 Sensitivity to
0.1 SU≤ ± 0.2 S.Uvi ≤ ± 0.3 S.U Immediate
(24 hours)Field + QC –P: 1000 mlPoly
<4°C
Specific Conductivity ( @25°C)
EPA 120.1 1µmhos/cm
±10-15% 28 days Field + QC –P: 1000 mlPoly
<4°C
Turbidity SM 2130 B 1 NTU ±10-15% ± 20% 48 hours Field + QC –P: 1000 mlPoly
<4°C
Flow MOMsvii 10 cfm N/A N/A NA Field NAAlkalinity 2320 B 1 mg/L ±10-15% ± 20% 14 Days Field + QC –
P: 1000 mlPoly
NA
i Accuracy of analytical methods will vary based upon calibration and equipment employed.ii Precision will be estimated from both in-lab replicate analyses and field duplicate samples. Results will be flagged as “B” data, if corrective action measures do notresolve precision errors.iii Winkler titration or calibrated Oxygen meter.iv Winkler allows stabilization and holding time for 8 hours until titrationv Thermometer Accuracy checked with NIST standards.vi Calibrated pH electrodevii Stream flow measurements will be conducted according to the ODEQ methodology derived from USGS stream flow protocols.
16

Powder River WQ Study Baker CountyMay 21, 2007
Version 2.0a Page 8 of 17
A8. Special Training and CertificationTraining in proper field sampling procedures is available upon request from the staff in theWatershed Assessment Section of the Oregon Department of Environmental Quality Laboratoryin Portland, OR. Contact: Larry Marxer, 503-229-6859, or email: [email protected].
A9. Documentation and RecordsFor the purposes and requirements of this project, the field sampling staff will prepare field datasheets prior to each weekly sampling event in order that all preparatory work is completed priorto conducting field sampling. The information to be recorded on the field data sheets willinclude the following: Project name, date & time of sampling events, water body name, majorbasin name, general weather conditions, names of field staff, time of each sample or fieldmeasurement, site ID numbers, equipment ID numbers, and field data results
It is recommended that the field staff maintain a bound field notebook to provide a daily recordof significant events, observations, and measurements during field investigations. Thisnotebook will be a permanent record of the project and should include water level data, fieldmeasurements, personnel, weather observations and general physical habitat conditions.
.
17
Powder River Study Baker CountyMay 21, 2007
Version 2.0a Page 9 of 17
Group B Data Generation and Acquisition
B1. Sampling Process DesignThis Sampling and Analysis Plan (SAP) was written for the specific field HUC for the section ofthe Powder River that includes Phillips Reservoir. This section of the SAP describes the logicbehind selecting the sampling locations. The general rule for selecting the sampling sites forthis project was to select sites most indicative of water quality conditions in the immediatevicinity of the Mason Dam hydroelectric project. The purpose of this sampling process is to geta full profile of the reservoir with in the vicinity of the intake and down stream of Mason Dam asrequested by DEQ with an emphasis on DO and water temp. Sampling will occur weekly. Theuse of a datasoned may be used to collect all data except for duplicate samples. The site thatwill be chosen for duplicate samples will be selected by rolling a die. If the dice lands on a six itwill be re-rolled until a number that corresponds to a sampling site is displayed. Duplicatesampling will be done through water grabs. For sites 1-4, one grab will be taken along with theother samples. The grab should take place as soon as possible not to exceed 15 minutes. Forsite 5 water grabs samples will be taken every five meters starting at one meter under thesurface and all the way down to within 1-2 meters of the bottom. The purpose of sites 1-4 is toget a longitudinal profile of how the gases re-equilibrate after discharge from the reservoir.
Site No. 1: This site occurs in an area of the river that is likely to re-aerate due to theamount of turbulence during release and is the furthest site from Mason dam.
Site No. 2: This site was selected because it is less than a five minute drive from SiteNo. 1. There is safe access to this site and easy vehicle parking off the road.
Site No. 3: This site was selected because it is less that a five minute drive from Site 2.Access to this site is also safe, and there is easy parking off the road. Sites 2 & 3 divide thedistance between Site No, 1 and Site No. 4 equally.
Site No. 4: This site is in the stilling basin of Mason Dam, and was selected so thatreservoir water could be compared to the water discharged through Mason Dam.
Site No. 5: This site is in Phillips Reservoir within a 10 meter radius of Mason Damintake structure. A GPS unit will be used to gather water samples in approximately the samelocation every time due to the fact the intake is not visible. It was selected so that currentambient water quality conditions could be monitored before the water passes through the Dam.Sampling will be conducted vertically starting 1 meter under the surface with 1 meter intervals towithin 1-2 meters of the bottom.
Sampling frequency is based upon resources, priorities; and statistical needs for trending.Table 3 lists sample stations.
Where site locations safely allow, samples should be collected from the center of the mainchannel, at a depth of one meter or half the total depth, whichever is greater. This ensures asample representative of environmental conditions.
18

Powder River Study Baker CountyMay 21, 2007
Version 2.0a Page 10 of 17
B2. Sampling MethodsWater sample collection and field measurements will be accomplished using the standardprotocols, as recommended and described in the ODEQ Laboratory MOMs Manual. Specificsample preservation methods and holding times are summarized in Table 4 above.
B3. Sample Handling and Custody ProceduresOnce a sample is collected, it will be handled in a way that will provide data that is accurate tothe environment in which it was taken. Since lab work will be performed in the field, samples forlaboratory analysis as identified in Table 4 will not be need to be executed unless a sample istransported to a lab. If a sample is transported to a lab field staff will follow the chain of custodyprocedures as outline in the MOM.
B4. Analytical MethodsAll parameters will be measured using the protocols previously mentioned above. Thesuggested reference for field analytical methods can be found in the ODEQ LaboratoryWatershed Assessment Mode of Operations Manual (MOMs) which is available on the DEQLaboratory website at http://www.deqlab3\SOP\Watershed Assessment\DEQ03-LAB-0036-SOP.pdf. Manuals provided with the equipment and kits can also provide some information.
B5. Quality ControlDuplicate field quality control samples will be collected at a minimum of 10% of the total numberof monitoring sites, or at least one duplicate per sampling expedition. Accuracy will bedetermined by calibrating equipment before the first sample and after the last sample.
B6. Instrument/Equipment Testing, Inspection, andMaintenance
All field monitoring equipment will be tested for accuracy and /or calibrated in accordance withMOMs or the owners manual. Equipment must be maintained and inspected according torequired laboratory field protocols.
B7. Instrument Calibration and FrequencyAll field monitoring equipment will be tested for accuracy and/or calibrated in accordance withthe required procedures from the MOMs and manufacturers manuals.
If instruments can not be calibrated as required, data will be qualified or voided.Inspection/Acceptance of Supplies and Consumables will be done prior to each field day.
Field kits used to conduct lab analysis must be checked to ensure reagents have not reachedtheir expiration dates.
19
Powder River Study Baker CountyMay 21, 2007
Version 2.0a Page 11 of 17
B8. Non-direct MeasurementsHistorical flow information will be collected and compiled as availability allows. No additionalacceptance criteria will be required for this data.
B9. Data ManagementSeparate field data sheets will be maintained for each sampling event. Information recorded ondata sheets is to include Project name, data and time of sampling events, water body name,basin name, site ID numbers, general weather conditions, and names of field staff, time of eachsample or measurement, results and equipment ID numbers. Quality assurance staff reviewsdata sheets for all continuous, field and laboratory data.
Data management will be provided through the Data manager. He/she will receive all fieldforms and laboratory analysis data is a laboratory is used. The manager will check forms forcompleteness before entering the data in the computerized forms. The original forms will bescanned and then filed. All information will be stored on the c: drive of the computer, aremovable thumb drive, and the server.
20

Powder River Study Baker CountyMay 21, 2007
Version 2.0a Page 12 of 17
Group C Assessment and Oversight
C1. Assessment and Response ActionsSurveillance and data management will be performed once a month to ensure data beingcollected will meet the needs of the project. Information collected during this project is intendedto meet the needs of section A7. All results of the individual assessments will be compiled andmanaged by the Data Manager, contract firm, or professional.
Response actions will be developed as data becomes available. Any stop work orders orchange in project scope will come from the Project Manager. Corrective actions will bedocumented as addendums to this QAPP/SAP.
C2. Reports to ManagementReports will be sent to the personnel listed in Table 1 for approval and/or review.
21

Powder River Study Baker CountyMay 21, 2007
Version 2.0a Page 13 of 17
Group D Data Validation and Usability
D1. Data Review, Verification and ValidationThe Project Manager, the QA Officer and the Data Manager will review all data resulting fromthis project as data becomes available and determine if the data collected meets the QA Planobjectives. Decisions to accept, qualify or reject data will be made by the ProjectManager/Basin Coordinator, QA Officer and Data Manager.
D2. Verification and Validation MethodsAs required by the project QA Program, field duplicate samples will be collected at a rate of 1duplicate per 10 samples collected, or at a minimum of 1 duplicate per sample event. Any dataor sample values outside of the expected range for the parameter being measured will berechecked for validity in the field by the field team, and if necessary, the field team will re-sample. Data that continues to be outside expected values will be further investigated todetermine the cause, using alternate methodology, if available. Additional sampling may beused to verify or refute outliers collected during the prescribed sample events.
Once the data has been entered in the project database the Data Manager will print a papercopy of the data and proofread it against the original field data sheets. Errors in data entry willbe corrected at that time. Outliers and inconsistencies will be flagged for further review or bediscarded. Data quality problems will be discussed as they occur and in the final report to datausers.
D3. Reconciliation with User RequirementsAs soon as possible after each sampling event, calculations and determinations for precision,completeness, and accuracy will be made and corrective action implemented if needed. If dataquality indicators do not meet the project's specifications, data may be discarded and re-sampling may occur. The cause of the failure will be evaluated. If the cause is found to beequipment failure, calibration and/or maintenance, techniques will be reassessed and improved.If the problem is found to be sampling team error, team members will be retrained. Anylimitations on data use will be detailed in both interim and final reports, and other documentationas needed. If failure to meet project specifications is found to be unrelated to equipment,methods, or sample error, specifications may be revised for the next sampling session.Revisions will be submitted to the QA Officer and Laboratory Manager for review and/orapproval.
22

Powder River Study Baker CountyMay 21, 2007
Version 2.0a Page 14 of 17
Appendix A
See map of sampling sites (Attachment A). Site five will be located when an agreement with aboat has been secured.
23

Powder River Study Baker CountyMay 21, 2007
Version 2.0a Page 15 of 17
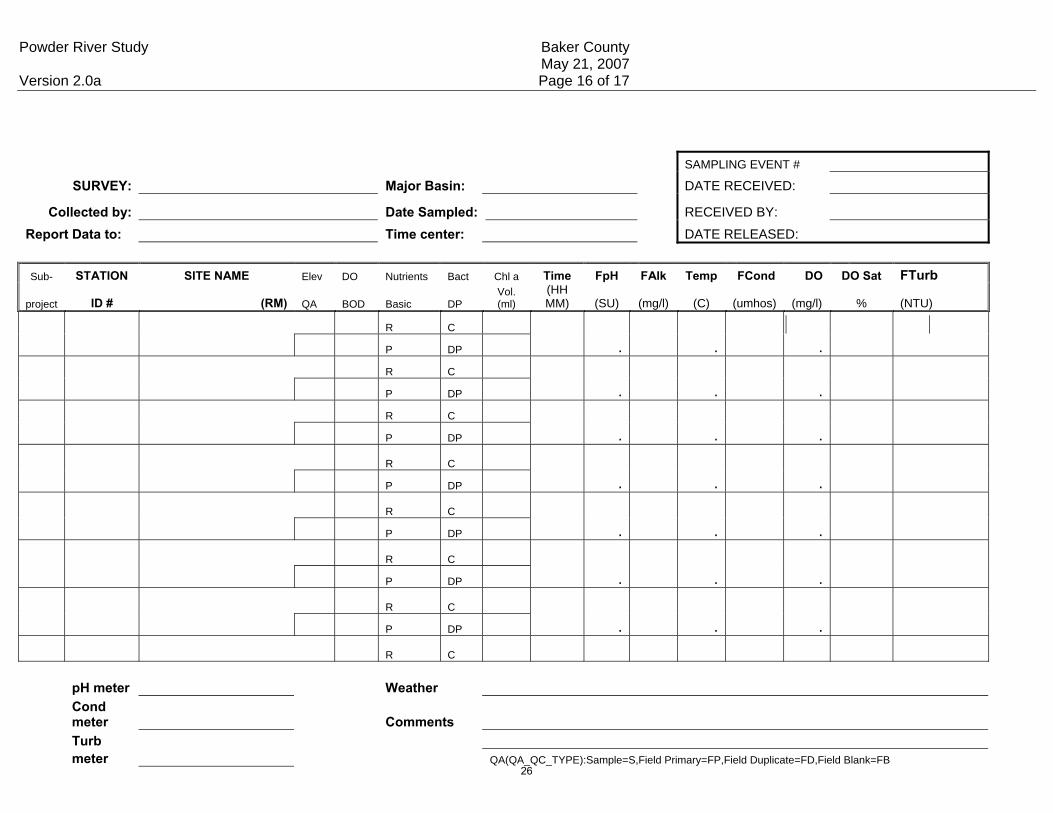
Appendix B - Field Data Forms
The Filed Data Sheet associated with this Sampling and Analysis Plan is located on page 17and 18. Additional forms that will be used are attached (Form 1,2,and 3)
24
Powder River Study Baker CountyMay 21, 2007
Version 2.0a Page 16 of 17
Appendix C - Revision History
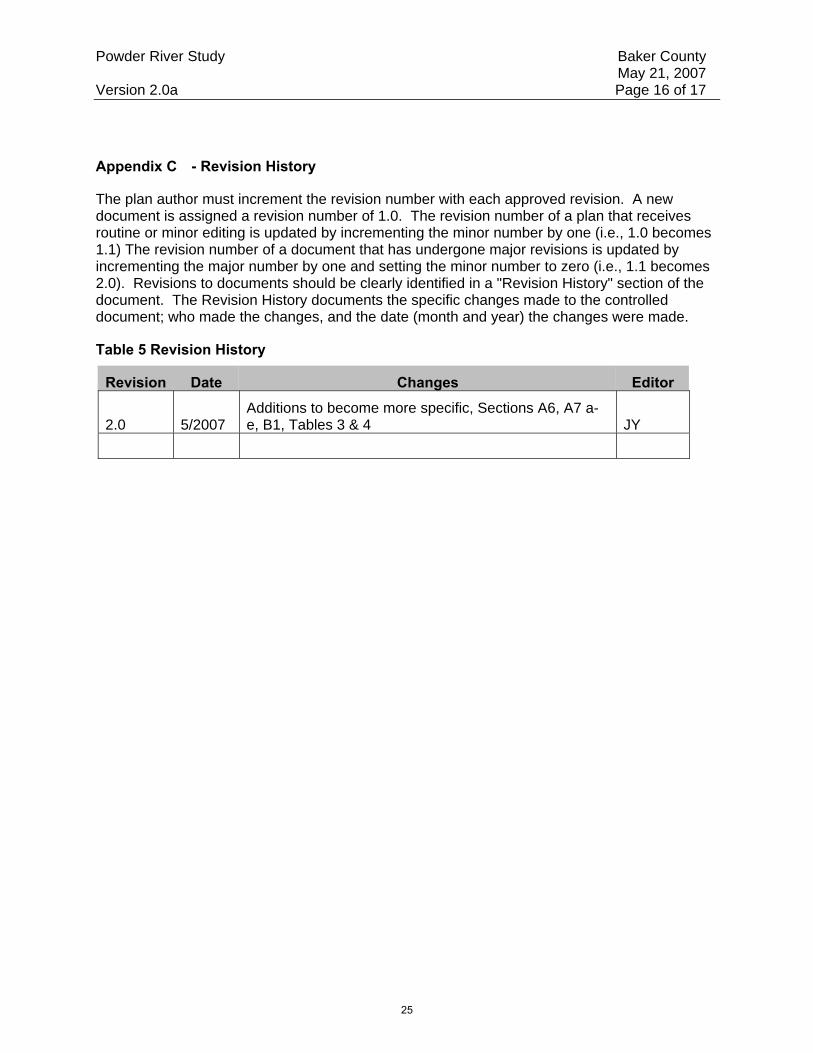
The plan author must increment the revision number with each approved revision. A newdocument is assigned a revision number of 1.0. The revision number of a plan that receivesroutine or minor editing is updated by incrementing the minor number by one (i.e., 1.0 becomes1.1) The revision number of a document that has undergone major revisions is updated byincrementing the major number by one and setting the minor number to zero (i.e., 1.1 becomes2.0). Revisions to documents should be clearly identified in a "Revision History" section of thedocument. The Revision History documents the specific changes made to the controlleddocument; who made the changes, and the date (month and year) the changes were made.
Table 5 Revision History
Revision Date Changes Editor
2.0 5/2007Additions to become more specific, Sections A6, A7 a-e, B1, Tables 3 & 4 JY
25
Powder River Study Baker CountyMay 21, 2007
Version 2.0a Page 16 of 17
SAMPLING EVENT # SURVEY: Major Basin: DATE RECEIVED:
Collected by: Date Sampled: RECEIVED BY:
Report Data to: Time center: DATE RELEASED:
Sub- STATION SITE NAME Elev DO Nutrients Bact Chl a Time FpH FAlk Temp FCond DO DO Sat FTurb
project ID # (RM) QA BOD Basic DPVol.(ml)
(HHMM) (SU) (mg/l) (C) (umhos) (mg/l) % (NTU)
R C P DP . . .
R C P DP . . .
R C P DP . . .
R C P DP . . .
R C P DP . . .
R C P DP . . .
R C P DP . . .
R C
pH meter Weather Condmeter Comments Turbmeter QA(QA_QC_TYPE):Sample=S,Field Primary=FP,Field Duplicate=FD,Field Blank=FB
26
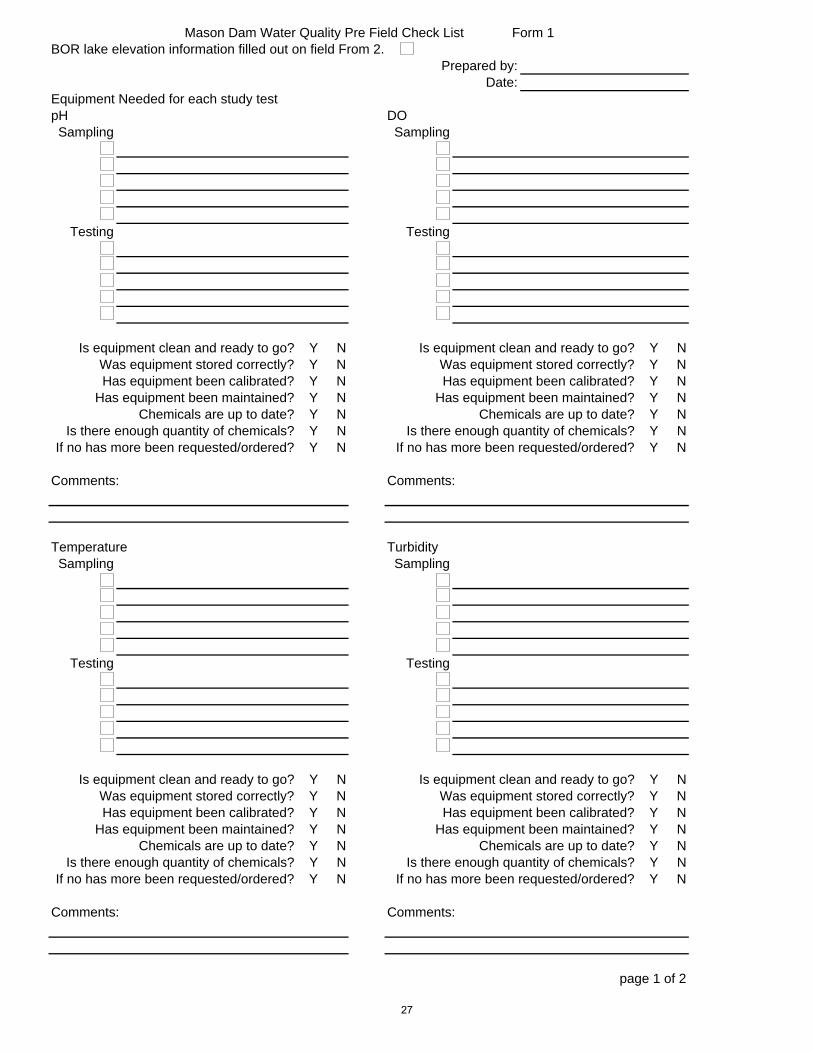
BOR lake elevation information filled out on field From 2.Prepared by:
Date:Equipment Needed for each study testpH DOSampling Sampling
Testing Testing
Is equipment clean and ready to go? Y N Is equipment clean and ready to go? Y NWas equipment stored correctly? Y N Was equipment stored correctly? Y NHas equipment been calibrated? Y N Has equipment been calibrated? Y N
Has equipment been maintained? Y N Has equipment been maintained? Y NChemicals are up to date? Y N Chemicals are up to date? Y N
Is there enough quantity of chemicals? Y N Is there enough quantity of chemicals? Y NIf no has more been requested/ordered? Y N If no has more been requested/ordered? Y N
Comments: Comments:
Temperature TurbiditySampling Sampling
Testing Testing
Is equipment clean and ready to go? Y N Is equipment clean and ready to go? Y NWas equipment stored correctly? Y N Was equipment stored correctly? Y NHas equipment been calibrated? Y N Has equipment been calibrated? Y N
Has equipment been maintained? Y N Has equipment been maintained? Y NChemicals are up to date? Y N Chemicals are up to date? Y N
Is there enough quantity of chemicals? Y N Is there enough quantity of chemicals? Y NIf no has more been requested/ordered? Y N If no has more been requested/ordered? Y N
Comments: Comments:
page 1 of 2
Mason Dam Water Quality Pre Field Check List Form 1
27

Pre field check listPrepared by:
Date:Alkalinity Hydro Lab/DatasondeSampling Sampling
Testing Testing
Is equipment clean and ready to go? Y N Is equipment clean and ready to go? Y NWas equipment stored correctly? Y N Was equipment stored correctly? Y NHas equipment been calibrated? Y N Has equipment been calibrated? Y N
Has equipment been maintained? Y N Has equipment been maintained? Y NChemicals are up to date? Y N Chemicals are up to date? Y N
Is there enough quantity of chemicals? Y N Is there enough quantity of chemicals? Y NIf no has more been requested/ordered? Y N If no has more been requested/ordered? Y N
Comments: Comments:
page 2 of 2
Mason Dam Water Quality Form 1
28
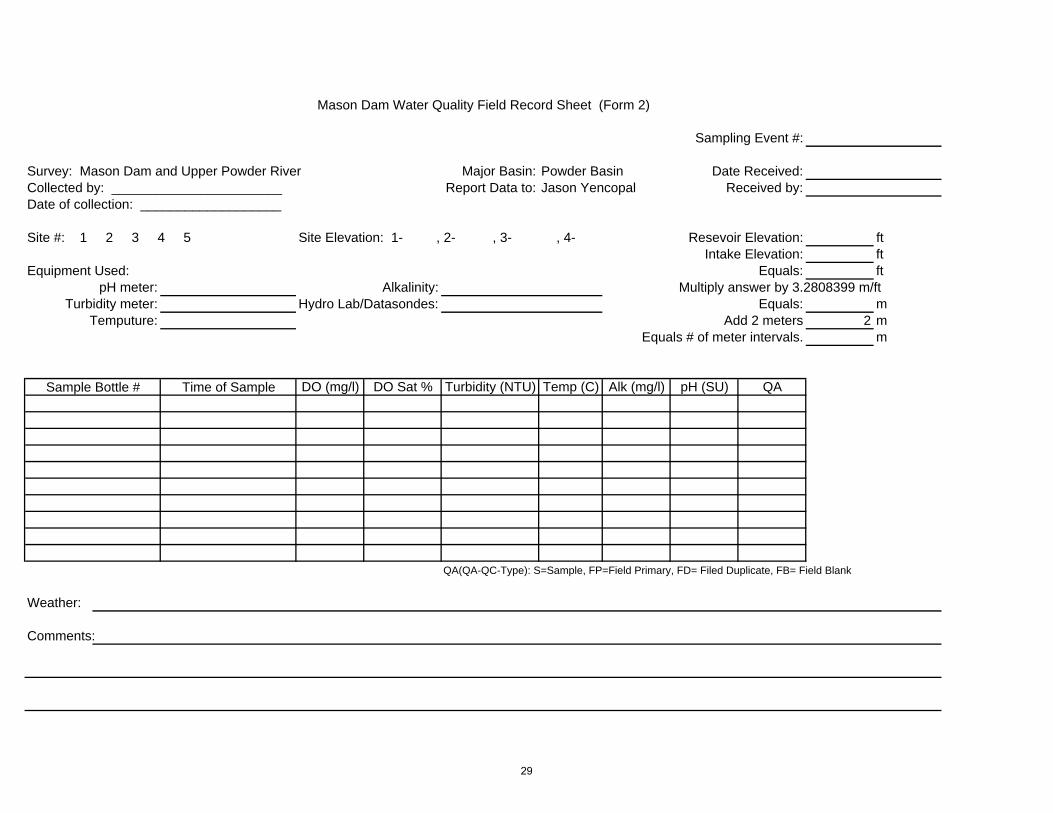
Sampling Event #:
Survey: Mason Dam and Upper Powder River Major Basin: Powder Basin Date Received:Collected by: _______________________ Report Data to: Jason Yencopal Received by:Date of collection: ___________________
Site #: 1 2 3 4 5 Site Elevation: 1- , 2- , 3- , 4- Resevoir Elevation: ftIntake Elevation: ft
Equipment Used: Equals: ftpH meter: Alkalinity: Multiply answer by 3.2808399 m/ft
Turbidity meter: Hydro Lab/Datasondes: Equals: mTemputure: Add 2 meters 2 m
Equals # of meter intervals. m
DO (mg/l) DO Sat % Turbidity (NTU) Temp (C) Alk (mg/l) pH (SU) QA
QA(QA-QC-Type): S=Sample, FP=Field Primary, FD= Filed Duplicate, FB= Field Blank
Weather:
Comments:
Mason Dam Water Quality Field Record Sheet (Form 2)
Sample Bottle # Time of Sample
29
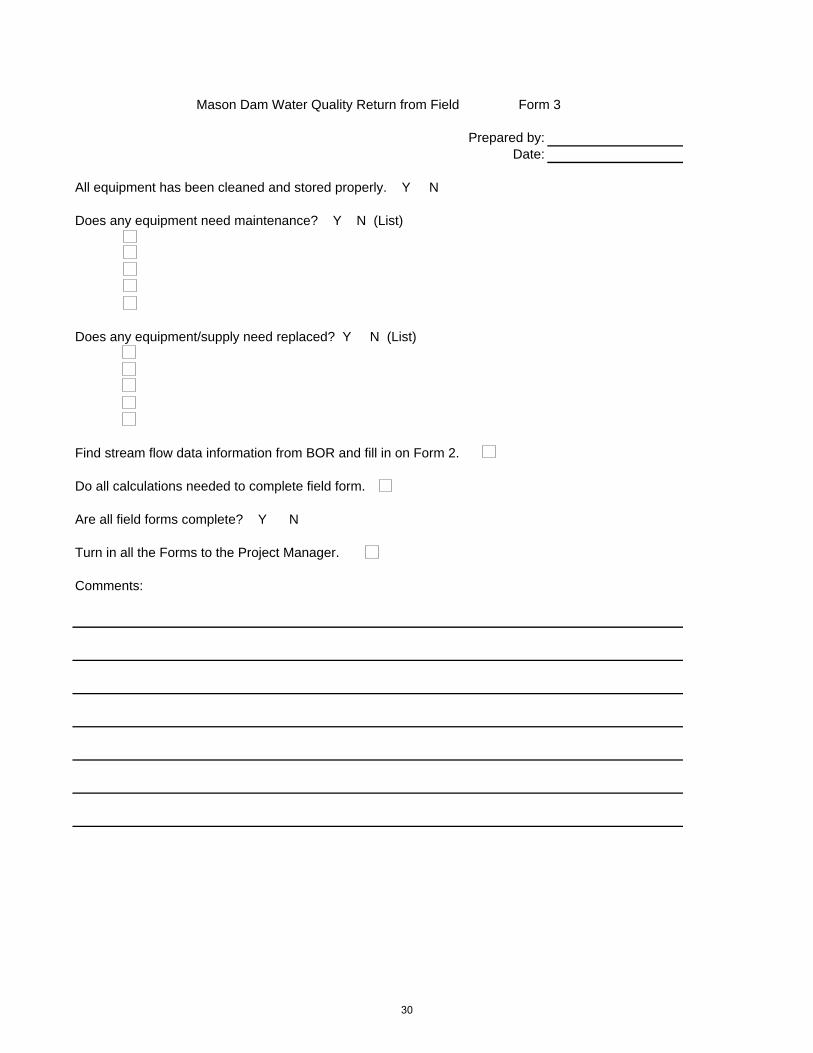
Prepared by:Date:
All equipment has been cleaned and stored properly. Y N
Does any equipment need maintenance? Y N (List)
Does any equipment/supply need replaced? Y N (List)
Find stream flow data information from BOR and fill in on Form 2.
Do all calculations needed to complete field form.
Are all field forms complete? Y N
Turn in all the Forms to the Project Manager.
Comments:
Mason Dam Water Quality Return from Field Form 3
30
31

2.0 Mason Dam Water Quality Technical Memorandum
32
MASON DAM WATER QUALITY TECHNICAL MEMORANDUMBAKER COUNTY, OREGON
Prepared for
Baker County 1995 Third Street
Baker City, Oregon 97814
Prepared by
EcoWest Consulting, Inc.13740 Red Fox
Baker, OR 97814541-523-5572
March 2008
33
1
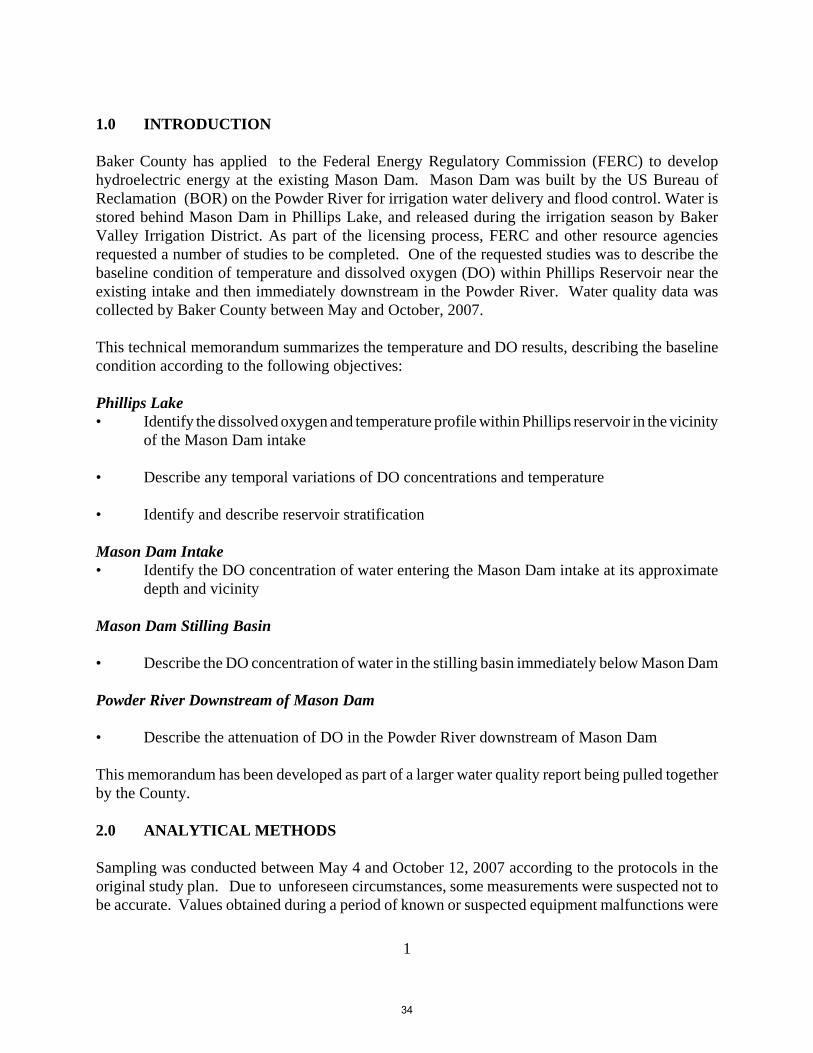
1.0 INTRODUCTION
Baker County has applied to the Federal Energy Regulatory Commission (FERC) to develophydroelectric energy at the existing Mason Dam. Mason Dam was built by the US Bureau ofReclamation (BOR) on the Powder River for irrigation water delivery and flood control. Water isstored behind Mason Dam in Phillips Lake, and released during the irrigation season by BakerValley Irrigation District. As part of the licensing process, FERC and other resource agenciesrequested a number of studies to be completed. One of the requested studies was to describe thebaseline condition of temperature and dissolved oxygen (DO) within Phillips Reservoir near theexisting intake and then immediately downstream in the Powder River. Water quality data wascollected by Baker County between May and October, 2007.
This technical memorandum summarizes the temperature and DO results, describing the baselinecondition according to the following objectives:
Phillips Lake• Identify the dissolved oxygen and temperature profile within Phillips reservoir in the vicinity
of the Mason Dam intake
• Describe any temporal variations of DO concentrations and temperature
• Identify and describe reservoir stratification
Mason Dam Intake• Identify the DO concentration of water entering the Mason Dam intake at its approximate
depth and vicinity
Mason Dam Stilling Basin
• Describe the DO concentration of water in the stilling basin immediately below Mason Dam
Powder River Downstream of Mason Dam
• Describe the attenuation of DO in the Powder River downstream of Mason Dam
This memorandum has been developed as part of a larger water quality report being pulled togetherby the County.
2.0 ANALYTICAL METHODS
Sampling was conducted between May 4 and October 12, 2007 according to the protocols in theoriginal study plan. Due to unforeseen circumstances, some measurements were suspected not tobe accurate. Values obtained during a period of known or suspected equipment malfunctions were
34

2
excluded from subsequent data analysis. However, even with this exclusion of outlier values, thesampling provided a sufficient data set on which the analyses could be conducted
Temperature and DO were generally measured in Phillips Reservoir at 1 meter intervals using a DOmeter. These measurements were subsequently often made at 5 meter-intervals using a grab sampleand titration. Because the grab sample tends to artificially aerate the sample, only the DO metermeasurement was used for those depths with duplicate measurements.
The Mason Dam intake is located between 3975.0 feet (top) and 3972.5 feet (bottom)above MSL.The field measurements were made at set intervals below the water surface, as it occurred at thatdate and time. The location of the intake was calculated by first (1) identifying the reservoir surfaceelevation during the sampling based on the BOR hydromet data (www.usbr.gov/pn-bin/dfcgi.pl/?sta=PHL) and (2) subtracting the intake top elevation from the water surface elevationto identify the intake distance below the surface. During some sampling events, a measurement wasmade at the exact location of the intake. If not, the nearest measurement to the intake was used forsubsequent analysis.
Most of the analysis was conducted using time-series analysis. Correlations between temperatureand DO on the Powder River sites were developed through regression analysis. Confidenceintervals were calculated at a significance level of 0.05. Confidence intervals were only calculatedwhere there were more than 3 degrees of freedom.
3.0 RESULTS
2.1 Phillips Lake
2.1.1 Vertical and Temporal Changes in Temperature and DO
The temperature and DO concentrations within Phillips Lake change both vertically and temporallyduring the growing season, from a fall condition of uniform parameters, regardless of depth, tostrong differences in temperature and DO according to the depth below the water surface. Ingeneral, the relatively uniform temperatures and dissolved oxygen concentrations in Phillips Lake,begin to change in May as the upper surface layers are warmed faster than the lower layers. Duringthe spring (May and June), average temperatures vary by up to 5 B C between the reservoir surfaceand the bottom of the water column. These differences increase to 10 B C by July, as the surfacelayer warms to more than 20 B C, while the temperatures near the bottom of the reservoir remainrelatively constant between 10.4 to 11.2 B C.
DO concentrations change as both the temperature changes and the reservoir starts to stratifyaccording to temperature and water density (see section 2.1.2). During May, average DOconcentrations remain between 9.7 to 9.9 mg/L above 15 meters, and average 7.0 mg/L below 15meters. The DO concentrations decrease throughout the water column during the summer, with themagnitude and timing of decrease varying by depth and the degree of reservoir stratification. Thesechanges are described in detail below in section 2.1.2 Stratification.
35
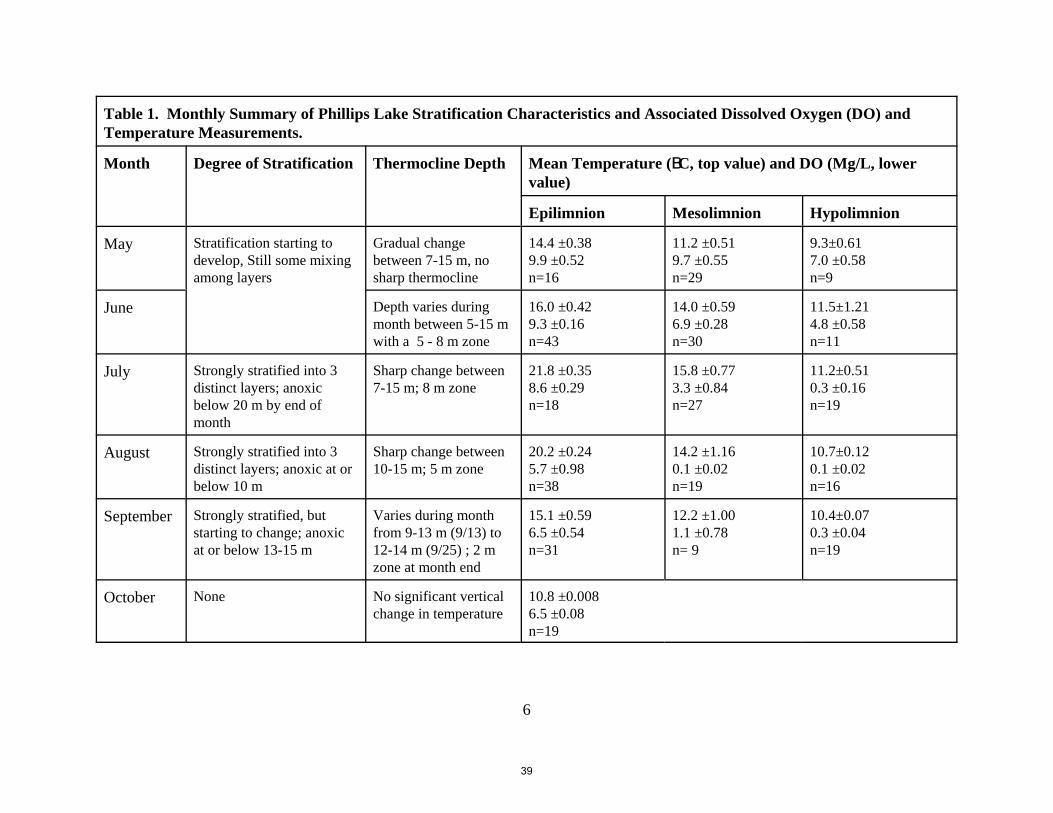
3
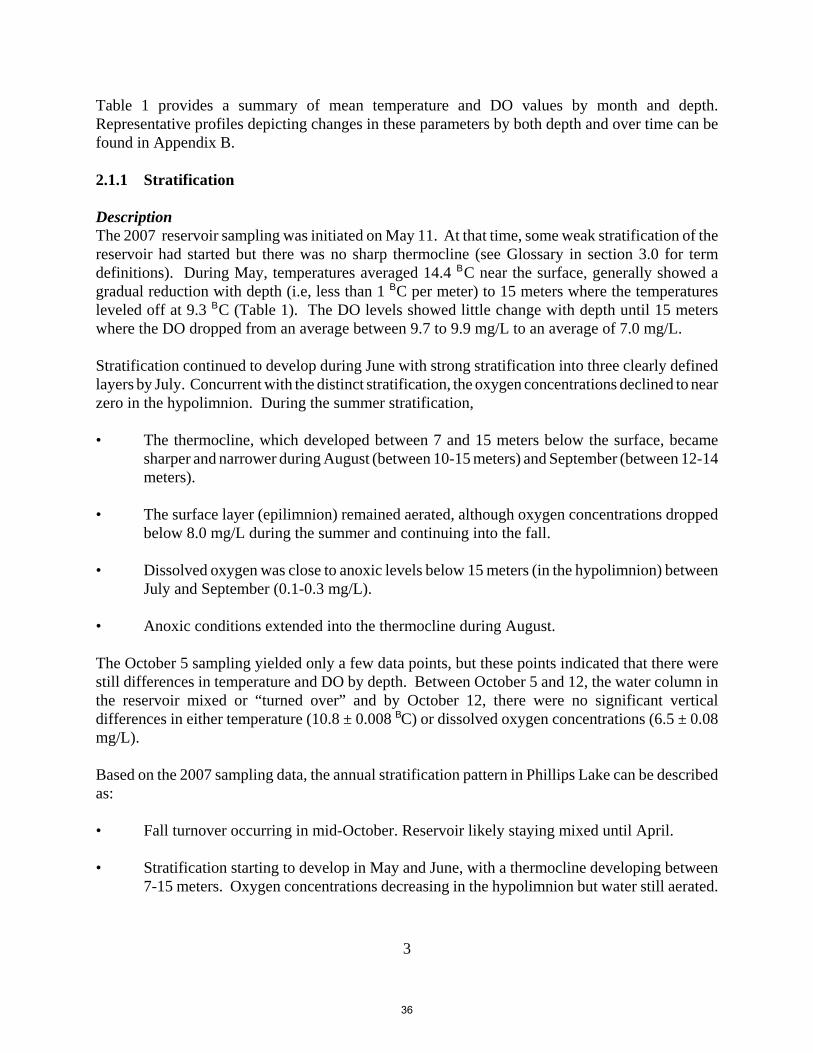
Table 1 provides a summary of mean temperature and DO values by month and depth.Representative profiles depicting changes in these parameters by both depth and over time can befound in Appendix B.
2.1.1 Stratification
DescriptionThe 2007 reservoir sampling was initiated on May 11. At that time, some weak stratification of thereservoir had started but there was no sharp thermocline (see Glossary in section 3.0 for termdefinitions). During May, temperatures averaged 14.4 B C near the surface, generally showed agradual reduction with depth (i.e, less than 1 B C per meter) to 15 meters where the temperaturesleveled off at 9.3 B C (Table 1). The DO levels showed little change with depth until 15 meterswhere the DO dropped from an average between 9.7 to 9.9 mg/L to an average of 7.0 mg/L.
Stratification continued to develop during June with strong stratification into three clearly definedlayers by July. Concurrent with the distinct stratification, the oxygen concentrations declined to nearzero in the hypolimnion. During the summer stratification,
• The thermocline, which developed between 7 and 15 meters below the surface, becamesharper and narrower during August (between 10-15 meters) and September (between 12-14meters).
• The surface layer (epilimnion) remained aerated, although oxygen concentrations droppedbelow 8.0 mg/L during the summer and continuing into the fall.
• Dissolved oxygen was close to anoxic levels below 15 meters (in the hypolimnion) betweenJuly and September (0.1-0.3 mg/L).
• Anoxic conditions extended into the thermocline during August.
The October 5 sampling yielded only a few data points, but these points indicated that there werestill differences in temperature and DO by depth. Between October 5 and 12, the water column inthe reservoir mixed or “turned over” and by October 12, there were no significant verticaldifferences in either temperature (10.8 ± 0.008 B C) or dissolved oxygen concentrations (6.5 ± 0.08mg/L).
Based on the 2007 sampling data, the annual stratification pattern in Phillips Lake can be describedas:
• Fall turnover occurring in mid-October. Reservoir likely staying mixed until April.
• Stratification starting to develop in May and June, with a thermocline developing between7-15 meters. Oxygen concentrations decreasing in the hypolimnion but water still aerated.
36
4
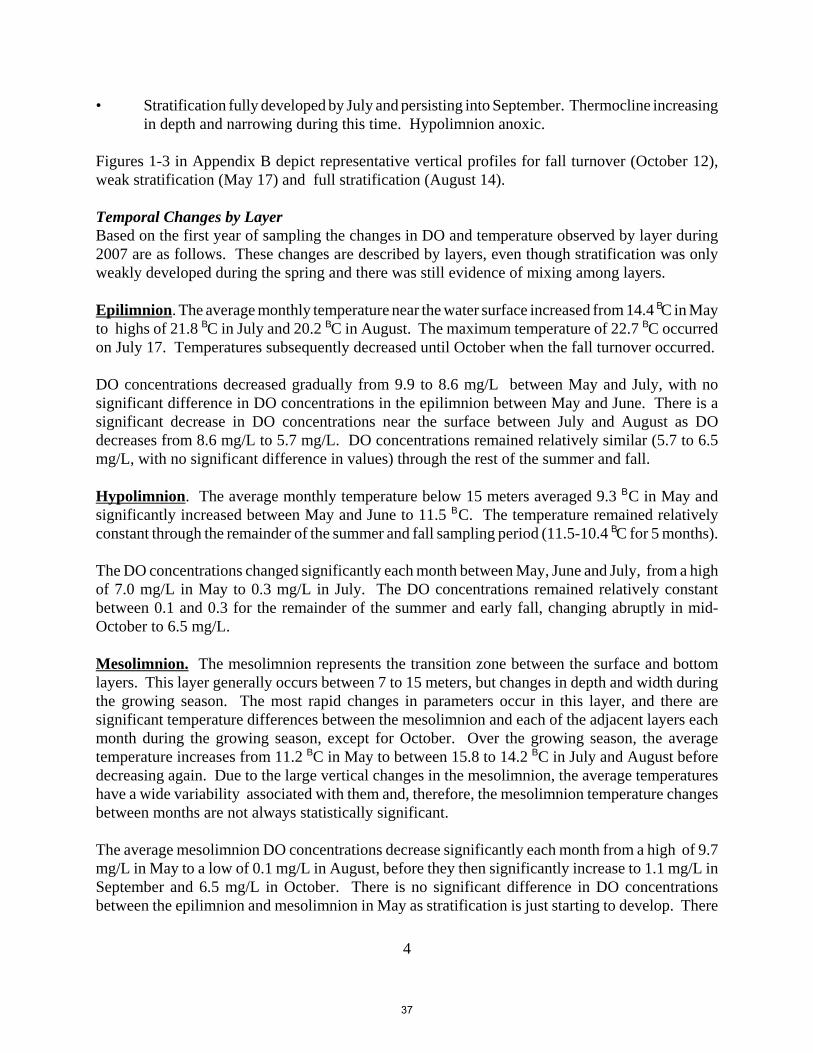
• Stratification fully developed by July and persisting into September. Thermocline increasingin depth and narrowing during this time. Hypolimnion anoxic.
Figures 1-3 in Appendix B depict representative vertical profiles for fall turnover (October 12),weak stratification (May 17) and full stratification (August 14).
Temporal Changes by LayerBased on the first year of sampling the changes in DO and temperature observed by layer during2007 are as follows. These changes are described by layers, even though stratification was onlyweakly developed during the spring and there was still evidence of mixing among layers.
Epilimnion. The average monthly temperature near the water surface increased from 14.4 B C in Mayto highs of 21.8 B C in July and 20.2 B C in August. The maximum temperature of 22.7 B C occurredon July 17. Temperatures subsequently decreased until October when the fall turnover occurred.
DO concentrations decreased gradually from 9.9 to 8.6 mg/L between May and July, with nosignificant difference in DO concentrations in the epilimnion between May and June. There is asignificant decrease in DO concentrations near the surface between July and August as DOdecreases from 8.6 mg/L to 5.7 mg/L. DO concentrations remained relatively similar (5.7 to 6.5mg/L, with no significant difference in values) through the rest of the summer and fall.
Hypolimnion. The average monthly temperature below 15 meters averaged 9.3 B C in May andsignificantly increased between May and June to 11.5 B C. The temperature remained relativelyconstant through the remainder of the summer and fall sampling period (11.5-10.4 B C for 5 months).
The DO concentrations changed significantly each month between May, June and July, from a highof 7.0 mg/L in May to 0.3 mg/L in July. The DO concentrations remained relatively constantbetween 0.1 and 0.3 for the remainder of the summer and early fall, changing abruptly in mid-October to 6.5 mg/L.
Mesolimnion. The mesolimnion represents the transition zone between the surface and bottomlayers. This layer generally occurs between 7 to 15 meters, but changes in depth and width duringthe growing season. The most rapid changes in parameters occur in this layer, and there aresignificant temperature differences between the mesolimnion and each of the adjacent layers eachmonth during the growing season, except for October. Over the growing season, the averagetemperature increases from 11.2 B C in May to between 15.8 to 14.2 B C in July and August beforedecreasing again. Due to the large vertical changes in the mesolimnion, the average temperatureshave a wide variability associated with them and, therefore, the mesolimnion temperature changesbetween months are not always statistically significant.
The average mesolimnion DO concentrations decrease significantly each month from a high of 9.7mg/L in May to a low of 0.1 mg/L in August, before they then significantly increase to 1.1 mg/L inSeptember and 6.5 mg/L in October. There is no significant difference in DO concentrationsbetween the epilimnion and mesolimnion in May as stratification is just starting to develop. There
37

5
is no significant difference in DO concentrations between the mesolimnion and hyplimnion duringAugust. In all other months examined, except for the fall turnover, there is a significant differencein DO concentrations between the mesolimnium and the adajcent layers .
38
6
Table 1. Monthly Summary of Phillips Lake Stratification Characteristics and Associated Dissolved Oxygen (DO) andTemperature Measurements.
Month Degree of Stratification Thermocline Depth Mean Temperature (BC, top value) and DO (Mg/L, lowervalue)
Epilimnion Mesolimnion Hypolimnion
May Stratification starting todevelop, Still some mixingamong layers
Gradual changebetween 7-15 m, nosharp thermocline
14.4 ±0.389.9 ±0.52n=16
11.2 ±0.519.7 ±0.55n=29
9.3±0.617.0 ±0.58n=9
June Depth varies duringmonth between 5-15 mwith a 5 - 8 m zone
16.0 ±0.429.3 ±0.16n=43
14.0 ±0.596.9 ±0.28n=30
11.5±1.214.8 ±0.58n=11
July Strongly stratified into 3distinct layers; anoxicbelow 20 m by end ofmonth
Sharp change between7-15 m; 8 m zone
21.8 ±0.358.6 ±0.29n=18
15.8 ±0.773.3 ±0.84n=27
11.2±0.510.3 ±0.16n=19
August Strongly stratified into 3distinct layers; anoxic at orbelow 10 m
Sharp change between10-15 m; 5 m zone
20.2 ±0.245.7 ±0.98n=38
14.2 ±1.160.1 ±0.02n=19
10.7±0.120.1 ±0.02n=16
September Strongly stratified, butstarting to change; anoxicat or below 13-15 m
Varies during monthfrom 9-13 m (9/13) to12-14 m (9/25) ; 2 mzone at month end
15.1 ±0.596.5 ±0.54n=31
12.2 ±1.001.1 ±0.78n= 9
10.4±0.070.3 ±0.04n=19
October None No significant verticalchange in temperature
10.8 ±0.0086.5 ±0.08n=19
39
7
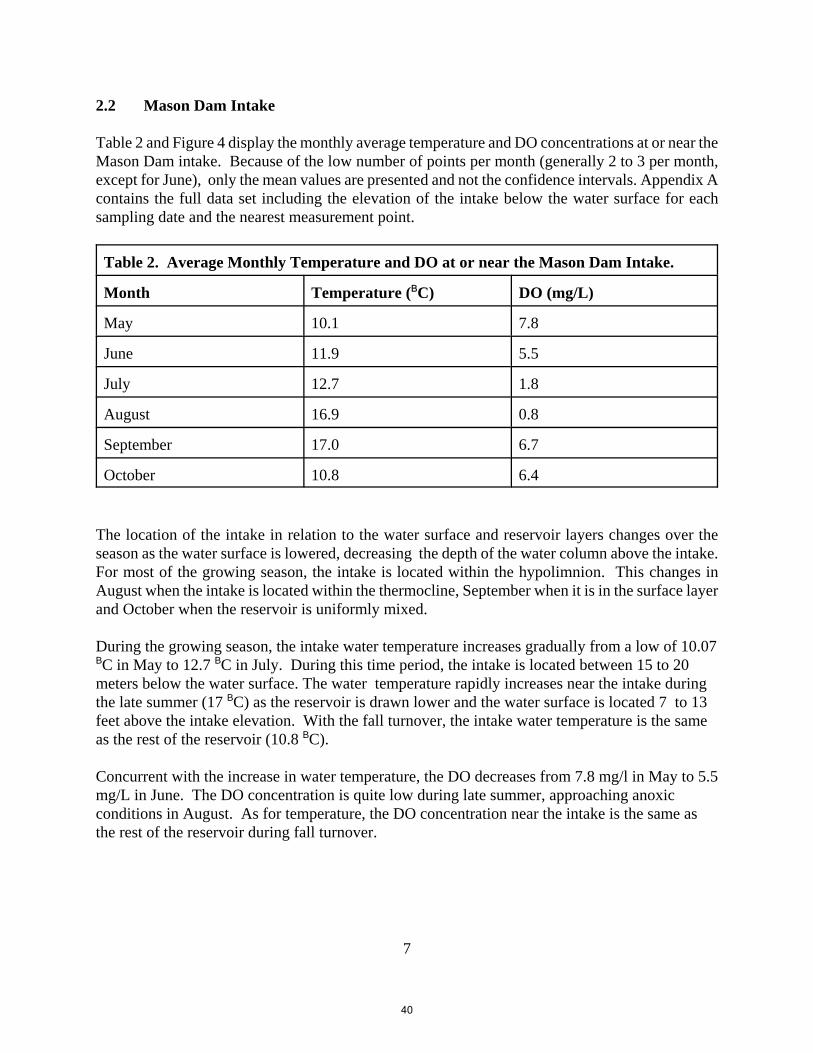
2.2 Mason Dam Intake
Table 2 and Figure 4 display the monthly average temperature and DO concentrations at or near theMason Dam intake. Because of the low number of points per month (generally 2 to 3 per month,except for June), only the mean values are presented and not the confidence intervals. Appendix Acontains the full data set including the elevation of the intake below the water surface for eachsampling date and the nearest measurement point.
Table 2. Average Monthly Temperature and DO at or near the Mason Dam Intake.
Month Temperature (B C) DO (mg/L)
May 10.1 7.8
June 11.9 5.5
July 12.7 1.8
August 16.9 0.8
September 17.0 6.7
October 10.8 6.4
The location of the intake in relation to the water surface and reservoir layers changes over theseason as the water surface is lowered, decreasing the depth of the water column above the intake.For most of the growing season, the intake is located within the hypolimnion. This changes inAugust when the intake is located within the thermocline, September when it is in the surface layerand October when the reservoir is uniformly mixed.
During the growing season, the intake water temperature increases gradually from a low of 10.07B C in May to 12.7 B C in July. During this time period, the intake is located between 15 to 20meters below the water surface. The water temperature rapidly increases near the intake duringthe late summer (17 B C) as the reservoir is drawn lower and the water surface is located 7 to 13feet above the intake elevation. With the fall turnover, the intake water temperature is the sameas the rest of the reservoir (10.8 B C).
Concurrent with the increase in water temperature, the DO decreases from 7.8 mg/l in May to 5.5mg/L in June. The DO concentration is quite low during late summer, approaching anoxicconditions in August. As for temperature, the DO concentration near the intake is the same asthe rest of the reservoir during fall turnover.
40
1As described for the stilling basin results, confidence intervals are not displayed for the meansdue to the low degrees of freedom in an analysis of site by month.
8
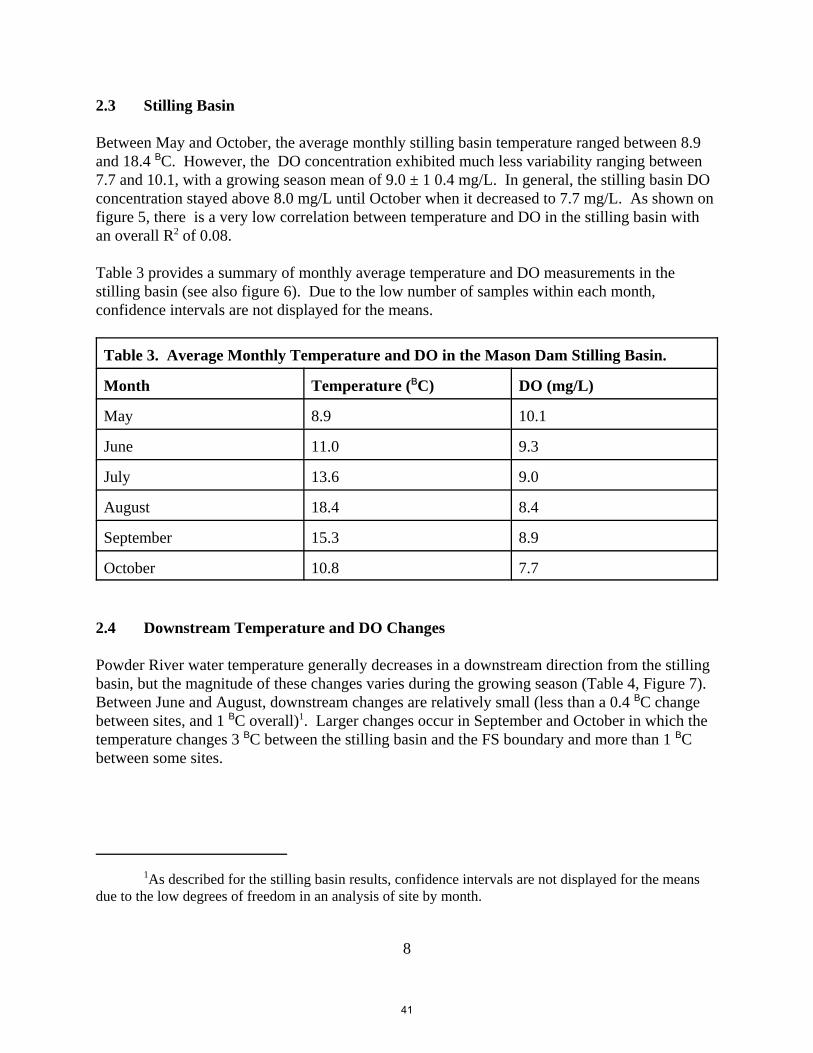
2.3 Stilling Basin
Between May and October, the average monthly stilling basin temperature ranged between 8.9and 18.4 B C. However, the DO concentration exhibited much less variability ranging between7.7 and 10.1, with a growing season mean of 9.0 ± 1 0.4 mg/L. In general, the stilling basin DOconcentration stayed above 8.0 mg/L until October when it decreased to 7.7 mg/L. As shown onfigure 5, there is a very low correlation between temperature and DO in the stilling basin withan overall R2 of 0.08.
Table 3 provides a summary of monthly average temperature and DO measurements in thestilling basin (see also figure 6). Due to the low number of samples within each month,confidence intervals are not displayed for the means.
Table 3. Average Monthly Temperature and DO in the Mason Dam Stilling Basin.
Month Temperature (B C) DO (mg/L)
May 8.9 10.1
June 11.0 9.3
July 13.6 9.0
August 18.4 8.4
September 15.3 8.9
October 10.8 7.7
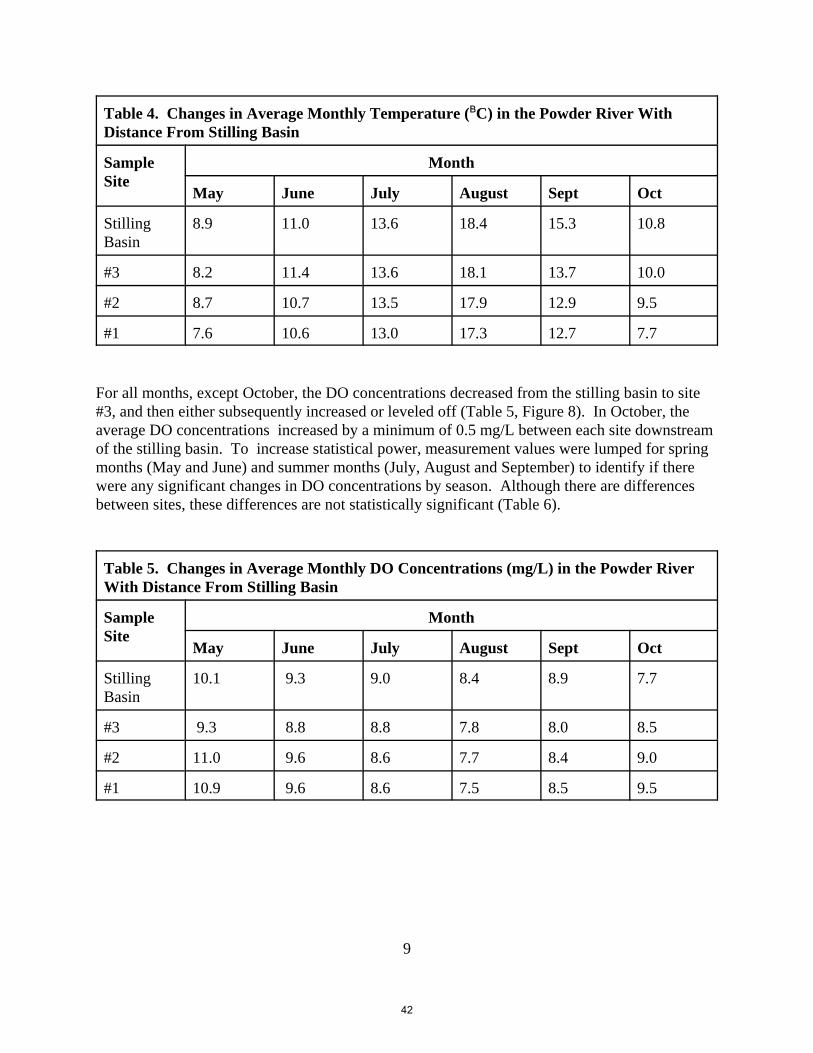
2.4 Downstream Temperature and DO Changes
Powder River water temperature generally decreases in a downstream direction from the stillingbasin, but the magnitude of these changes varies during the growing season (Table 4, Figure 7). Between June and August, downstream changes are relatively small (less than a 0.4 B C changebetween sites, and 1 B C overall)1. Larger changes occur in September and October in which thetemperature changes 3 B C between the stilling basin and the FS boundary and more than 1 B Cbetween some sites.
41
9
Table 4. Changes in Average Monthly Temperature (B C) in the Powder River WithDistance From Stilling Basin
SampleSite
Month
May June July August Sept Oct
StillingBasin
8.9 11.0 13.6 18.4 15.3 10.8
#3 8.2 11.4 13.6 18.1 13.7 10.0
#2 8.7 10.7 13.5 17.9 12.9 9.5
#1 7.6 10.6 13.0 17.3 12.7 7.7
For all months, except October, the DO concentrations decreased from the stilling basin to site#3, and then either subsequently increased or leveled off (Table 5, Figure 8). In October, theaverage DO concentrations increased by a minimum of 0.5 mg/L between each site downstreamof the stilling basin. To increase statistical power, measurement values were lumped for springmonths (May and June) and summer months (July, August and September) to identify if therewere any significant changes in DO concentrations by season. Although there are differencesbetween sites, these differences are not statistically significant (Table 6).
Table 5. Changes in Average Monthly DO Concentrations (mg/L) in the Powder RiverWith Distance From Stilling Basin
SampleSite
Month
May June July August Sept Oct
StillingBasin
10.1 9.3 9.0 8.4 8.9 7.7
#3 9.3 8.8 8.8 7.8 8.0 8.5
#2 11.0 9.6 8.6 7.7 8.4 9.0
#1 10.9 9.6 8.6 7.5 8.5 9.5
42

10
Table 6. Changes in Seasonal DO Concentrations (mg/L) With Distance From StillingBasin. Confidence intervals are calculated only where 3 or more degrees of freedom canbe established.
Sample Site Season
Spring Summer Fall
Stilling Basin 9.7 ± 0.74n=7
8.8 ± 0.32n=10
7.7n=2
#3 9.0 ± 0.52n=6
8.2 ± 0.41n=10
8.5n=1
#2 10.0 ± 0.55n=8
8.2 ± 0.34n=11
9.0n=1
#1 9.8 ± 1.24n=5
8.3 ± 0.32n=11
9.5n=2
The patterns downstream of the stilling basin are not clear cut. There appears to be a trend towardsa decreased temperature with distance from the stilling basin. There is also a trend towards an initialDO concentration decrease followed by a subsequent DO concentration increase. These trends areeither not statistically significant, or can’t be statistically tested. It may be that site differences orthe nature of flow releases overshadow the effects of the stilling basin on the Powder Riverdownstream of the stilling basin.
3.0 GLOSSARY
Stratification: a process in which some reservoirs develop an uneven distribution of propertieswithin the water column during an annual cycle. This is primarily related to uneven heating andresultant differences in water density.
Epilimnion: the upper layer of warm, less dense water of similar temperature in a lake or reservoir.
Hypolimnion: the lower layer of cold, more dense water below the epilimnion which is completelysealed off from the surface - often having very low oxygen concentrations
Mesolimnion: the small zone where the temperature cools dramatically between the epilimnion andhypolimnion. A zone of rapid change in temperature, density, and chemical properties. Generallydefined as a temperature change equal to, or greater than 1.0°C per 1.0 meter change in depth
43

11
Thermocline: the point in the mesolimnion where the temperature change is most drastic. Often,the terms mesolimnion and thermocline are used synonomously.
Fall Turnover: A process in which waters within an entire water body mix so that the reservoirdevelops a relatively uniform distribution of properties, such as temperature and dissolved oxygen.This process can be relatively sudden, with an entire reservoir turning over in less than a weekduring windy conditions
44

APPENDIX A-Mason Dam Intake Data
Mason Dam IntakeDataDate Intake elev Closest
MsmtT DO
11-May 21.9 20 11.1 8.617-May 21.4 20 8.9 7.625-May 21 20 10.2 7.3
1-Jun 20.6 20 10 5.99-Jun 20.1 20 10.8 6
15-Jun 19.5 17.5 13.5 6.622-Jun 19.5 20 11.3 4.228-Jun 18.9 20 14.2 4.8
6-Jul 18.1 15 12.7 3.517-Jul 16.8 17 12 0.924-Jul 15.7 16 13.5 17-Aug 13.2 13 14.8 0.1
14-Aug 11.8 12 17 0.121-Aug 10.2 10 18.9 2.37-Sep 7.7
13-Sep 7.3 7 17 7.721-Sep 7 7 15.4 5.7
5-Oct 6.8 5 6.212-Oct 6.6 7 10.8 6.5
Intake elevation=depth of the intake below the water surface at the date and time of measurementCloset Msmt=measurements were made at set intervals below the water surface and did not alwaysoccur at the exact intake point. The closet measurement identifies the data point collected closestto the intake depth.T=temperature in degrees Centigrade.DO=dissolved oxygen in mg/L
45

APPENDIX B- Figures
46

Figure 1. Changes in Phillips Lake Temperature and DO Concentrations with Depth.17-May-2007
0
2
4
6
8
10
12
14
16
18
20
22
1 2 3 4 5 6 7 8 9 10 11 12 13 14 15 20 30 35
Depth (m)
Tem
pera
ture
(deg
rees
C)
0
1
2
3
4
5
6
7
8
9
10
11
Temperature Dissolved Oxygen
47

Figure 2. Changes in Phillips Lake Temperature and DO Concentrations with Depth 14-August-2007
0
2
4
6
8
10
12
14
16
18
20
22
1 2 3 4 5 6 7 8 9 10 11 12 13 14 15 16 17 18 19 20 21 22 23
depth
Tem
pera
ture
0
1
2
3
4
5
6
7
8
9
10
11
Dis
solv
ed O
xyge
n (m
g/L)
Temperature Dissolved Oxygen
48
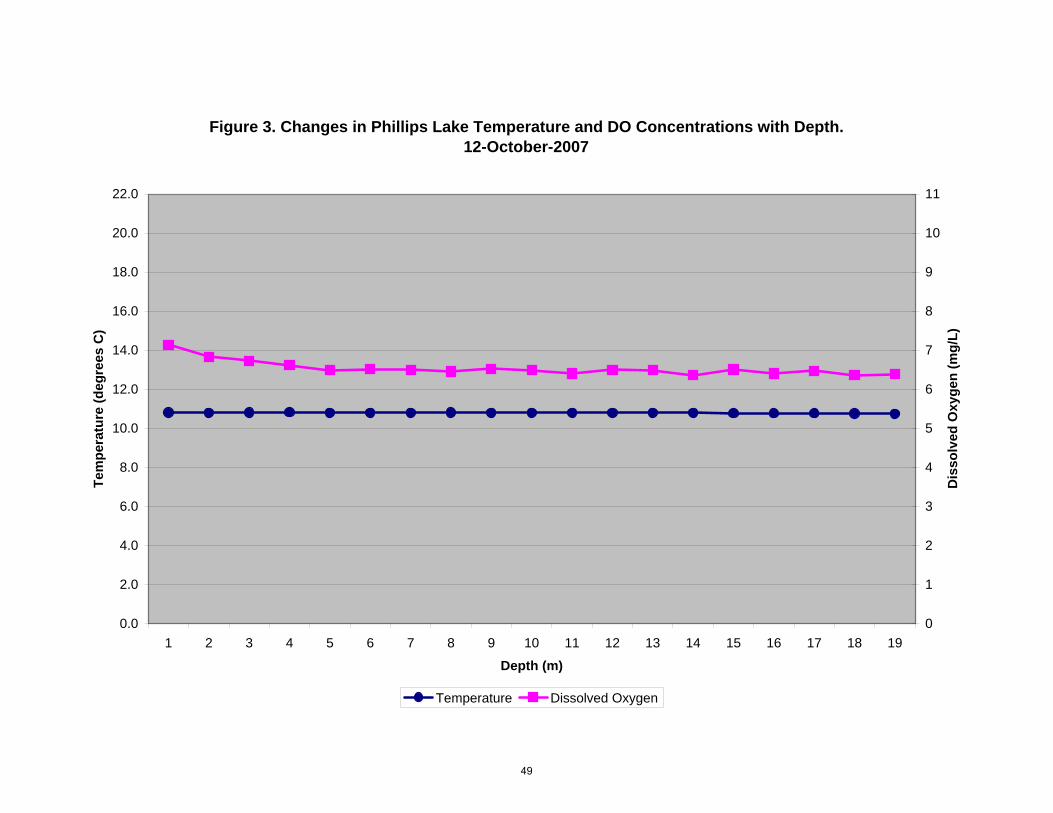
Figure 3. Changes in Phillips Lake Temperature and DO Concentrations with Depth.12-October-2007
0.0
2.0
4.0
6.0
8.0
10.0
12.0
14.0
16.0
18.0
20.0
22.0
1 2 3 4 5 6 7 8 9 10 11 12 13 14 15 16 17 18 19
Depth (m)
Tem
pera
ture
(deg
rees
C)
0
1
2
3
4
5
6
7
8
9
10
11
Dis
solv
ed O
xyge
n (m
g/L)
Temperature Dissolved Oxygen
49
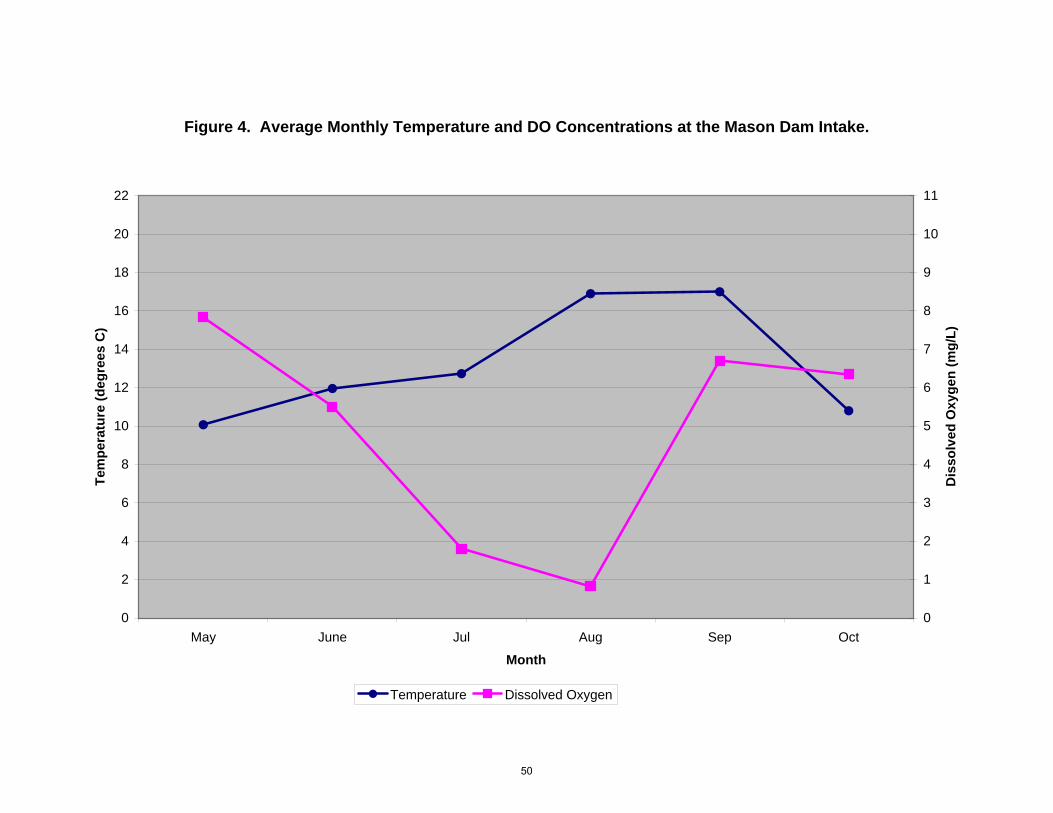
Figure 4. Average Monthly Temperature and DO Concentrations at the Mason Dam Intake.
0
2
4
6
8
10
12
14
16
18
20
22
May June Jul Aug Sep Oct
Month
Tem
pera
ture
(deg
rees
C)
0
1
2
3
4
5
6
7
8
9
10
11
Dis
solv
ed O
xyge
n (m
g/L)
Temperature Dissolved Oxygen
50
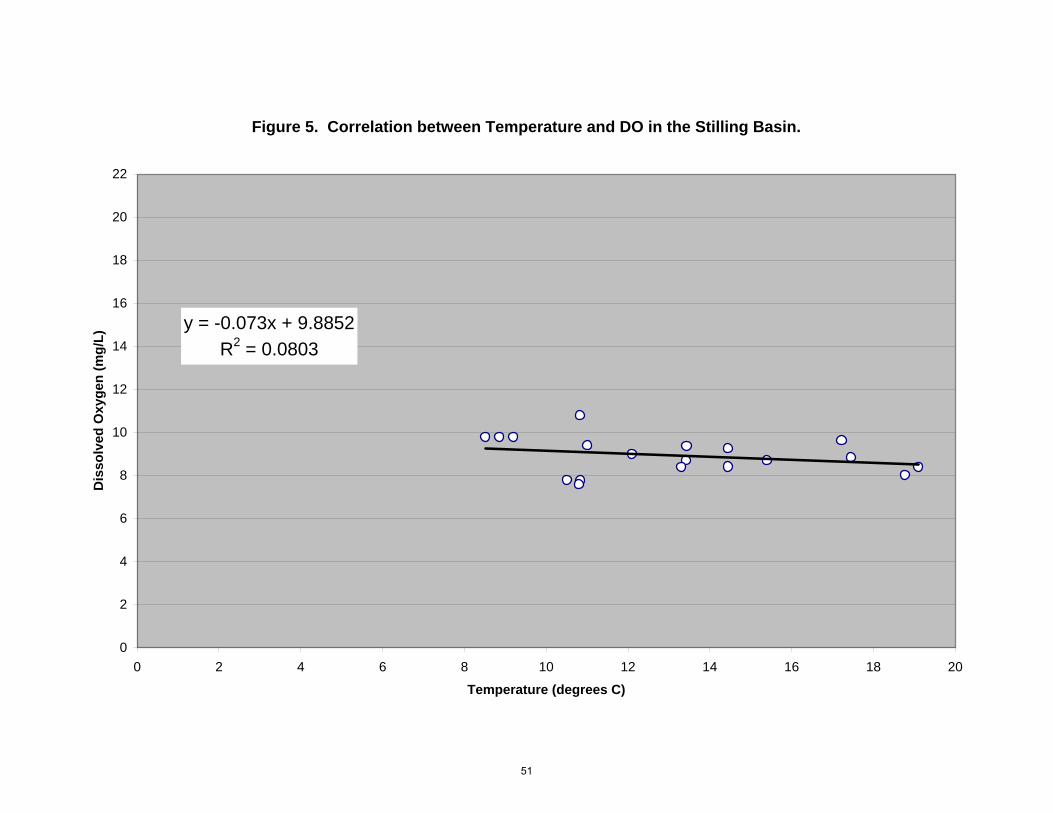
Figure 5. Correlation between Temperature and DO in the Stilling Basin.
y = -0.073x + 9.8852R2 = 0.0803
0
2
4
6
8
10
12
14
16
18
20
22
0 2 4 6 8 10 12 14 16 18 20
Temperature (degrees C)
Dis
solv
ed O
xyge
n (m
g/L)
51

Figure 6. Average Monthly Temperature and DO Concentrations in the Stilling Basin.
0
2
4
6
8
10
12
14
16
18
20
22
May June July Aug Sept Oct
Month
Tem
pera
ture
0
1
2
3
4
5
6
7
8
9
10
11
Dis
solv
ed O
xyge
n (m
g/L)
Temperature Dissolved Oxygen
52
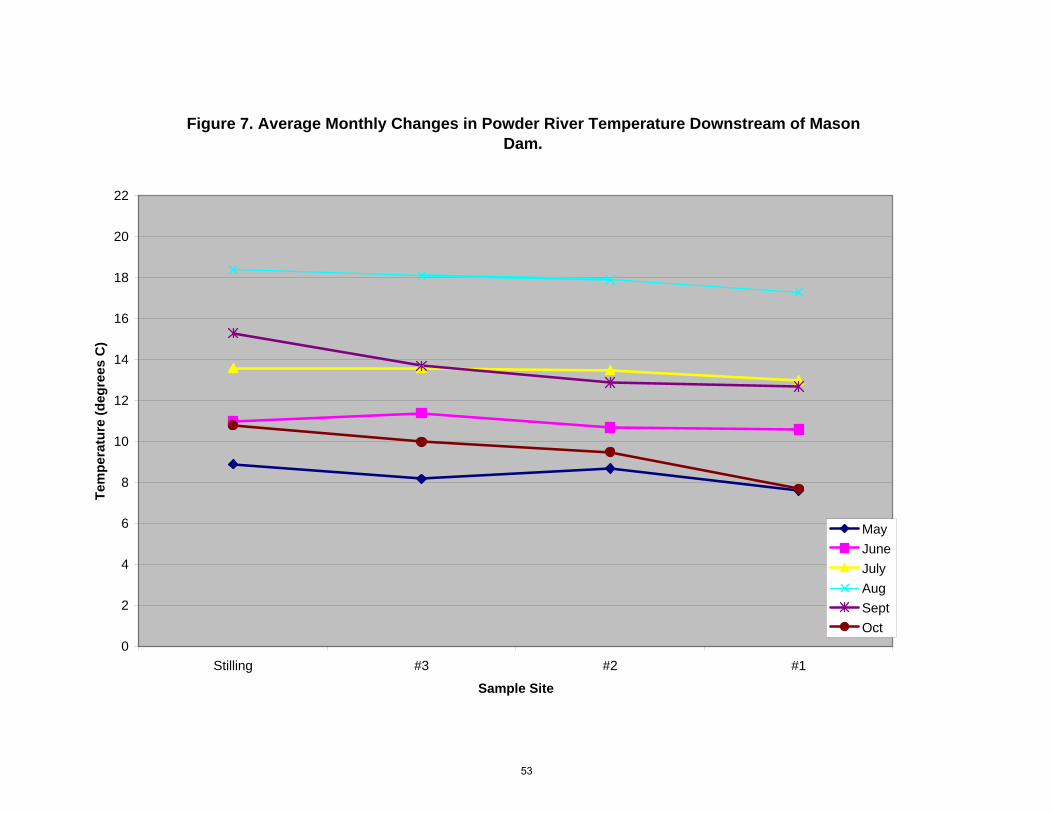
Figure 7. Average Monthly Changes in Powder River Temperature Downstream of Mason Dam.
0
2
4
6
8
10
12
14
16
18
20
22
Stilling #3 #2 #1
Sample Site
Tem
pera
ture
(deg
rees
C)
MayJuneJulyAugSeptOct
53

Figure 8. Average Monthly Changes in Powder River DO Downstream of Mason Dam.
0
1
2
3
4
5
6
7
8
9
10
11
Stilling #3 #2 #1
Sample Site
Dis
solv
e O
xyge
n (m
g/L)
MayJuneJulyAugSeptOct
54

3.0 Appendix
Coming Soon
55