Study on Rheological PropertiesofPartiallyHydrolyzed
57
Study on Rheological Properties of Partially Hydrolyzed Polyacrylamide Solution at Elevated Temperature by Dharveen Kumar Dissertation submitted in partial fulfillment of the requirements for the BACHELOR OF ENGINEERING (Hons) (CHEMICAL ENGINEERING) JANUARY 2012 Universiti Teknologi PETRONAS Bandar Seri Iskandar 31750 Tronoh Perak Darul Ridzuan
Transcript of Study on Rheological PropertiesofPartiallyHydrolyzed
Study on Rheological Properties of Partially Hydrolyzed
Polyacrylamide Solution at Elevated Temperature
by
Dharveen Kumar
Dissertation submitted in partial fulfillment
of the requirements for the
BACHELOR OF ENGINEERING (Hons)
(CHEMICAL ENGINEERING)
JANUARY 2012
Universiti Teknologi PETRONAS
Bandar Seri Iskandar
31750 Tronoh
Perak Darul Ridzuan
CERTIFICATION OF APPROVAL
Stady on Rheological Properties of Partially Hydrolyzed Polyacrylamide Solution atElevated Temperature
Approved by,
by
Dharveen Kumar
A project dissertation submitted to the
Chemical Engineering Programme
Universiti Teknologi PETRONAS
in partial folfillment ofthe requirements for the
BACHELOR OF ENGINEERING (Hons)
(CHEMICAL ENGINEERING)
(MohjJ^amri Abdullah)
UNIVERSITI TEKNOLOGI PETRONAS
TRONOH, PERAK
JANUARY 2012
CERTIFICATION OF ORIGINALITY
This is to certify that I am responsible for the work submitted in this project, that the original
work is my own except as specified in the references and acknowledgements, and that the
original work contained herein have not been undertaken by unspecified sources or persons.
DHARVEEN KUMAR
ABSTRACT
Rheology is the science offlow and deformation ofmatter primarily liquid, but also solid undercertain conditions in which they respond with plastic flow rather than deforming elastically inresponse to an applied force. It applies to substances which have a complex molecular structuresuch as mud, sludge and polymer which are also examples ofnon-Newtonian fluids. The flow ofthese substances cannot be characterized by asingle value ofviscosity (at a fixed temperature orpressure). Although it is proven that viscosity of fluids normally varies with temperature, otherfectors which lead to different viscosity trend are also studied in rheology. Partially hydrolyzedpolyacrylamide is a polymer which is widely being used by drilling fluid companies in oil andgas industry as their primary viscosifier in water based mud system. Plus, its ability toencapsulate the drill cuttings (shale) from the hydration of fluid (water) from the mud or theformation classifies it as the most important inhibitor in water based mud system. While it isbeing widely used, the ability of partially hydrolyzed polyacrylamide to perform under highpressure and high temperature condition is still not clearly known. Thus, this study is aimed atinvestigating the rheological behavior ofpartially hydrolyzed polyacrylamide solution at normalpressure and elevated temperature as a starting point to the rheological study of partiallyhydrolyzed polyacrylamide under high pressure and high temperature condition.
in

ACKNOWLEDGEMENTS
I would like to express my hearties gratitude to Mr. Mohd Zamri Abdullah for his supervision.His guidance and his trust in me in completing this project have given me great strength. Hespent his valuable time discussing the details of rheological study on HPAM. His guidancehelped me to overcome several problems I feced during myproject.
I would also like tothank Mohd Amir Maliki, whom I worked together with in completing therheological study. We both worked closely in completing our projects and helping each othersolving problems.
Last but not least my deepest appreciation to my family and friends for their endless support inhelping me incompleting myproject and giving the courage to do mybest.
IV
TABLE OF CONTENTS
CERTIFICATION i
ABSTRACT »i
ACKNOWLEDGMENT iv
TABLE OF CONTENTS v
LIST OF FIGURES vii
LIST OF TABLES viii
NOMENCLATURE ix
CHAPTER 1: INTRODUCTION 1
1.1 Background of Study 1
1.2 Problem Statement 2
1.3 Objective 21.4 Scope ofStudy 2
1.4.1 The relevancyofthe Project 2
1.4.2 Feasibility of theproject within the scope andtime frame 3CHAPTER 2: LITERATURE REVIEW & THEORY 4
2.1 Literature Review 4
2.2 Theory 52.2.1 Partially Hydrolyzed Polyacrylamide (HPAM) 5
2.2.2 Rheology 62.2.3 Shear rate 7
2.2.4 Shear stress 8
2.2.5 Viscosity 9
2.2.6 Fluid models 10
2.2.7 Flow behavior index, n 15
2.2.8 Consistency index, & 16CHAPTER 3: METHODOLOGY 17
3.1 ResearchMethodology & ProjectActivities -17
3.2 Polymer Solution Preparation - 173.3 Laboratory Testing........ • 183.4 Key Milestones &GanttChart 21
CHAPTER 4: RESULTS & DISCUSSION 22
4.1 Data Gathering, Analysis and Discussion 22
CHAPTER 5: CONCLUSION & RECOMMENDATION 38
5.1 Conclusion 38
5.2 Recommendation.... 39
REFERENCE 40
APPENDICES 41
VI
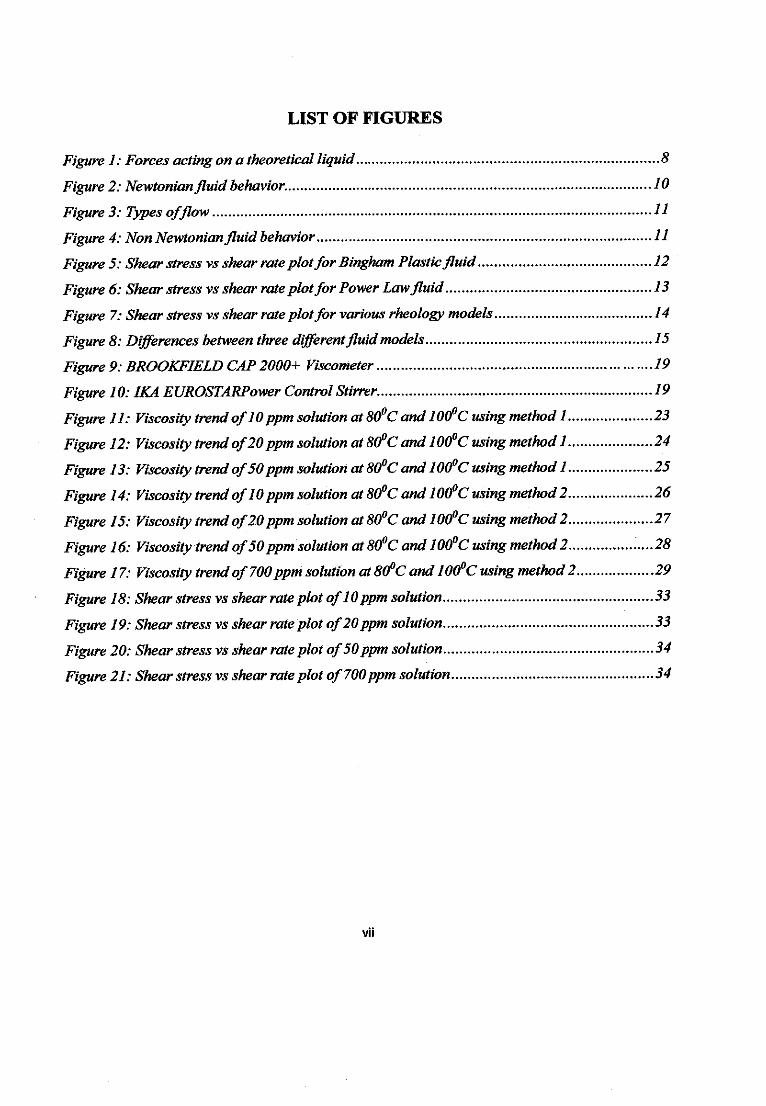
LIST OF FIGURES
Figure 1: Forcesactingon a theoretical liquid 8
Figure 2: Newtonianfluidbehavior. 10
Figure 3: Types offlow H
Figure 4:Non Newtonianfluidbehavior 11
Figure 5: Shear stress vs shear rateplotfor Bingham Plasticfluid 12
Figure 6: Shear stress vsshear rate plotfor Power Lawfluid 13
Figure 7:Shear stress vsshear rate plotfor various rheology models 14
Figure 8: Differences between three differentfluidmodels 15
Figure 9: BROOKFIELD CAP 2000+ Viscometer 19
Figure 10: IKA EUROSTARPower Control Stirrer. 19Figure 11: Viscosity trendof10ppm solution at 80°C and 100°C using method 1 23Figure 12: Viscosity trend of20ppm solution at 8(fC and 100°C using method 1 .24Figure 13: Viscosity trend of50ppm solution at 80°C and 100°C using method 1 25Figure 14: Viscosity trendof10ppm solution at 80°C and 100°C using method2 26Figure 15: Viscosity trend of20ppm solution at 80°C and 10(fC using method 2 27Figure 16: Viscosity trend of50ppm solution at 80°C and 100°C using method 2 28Figure 17: Viscosity trendof700ppm solution at 80°C and 100°C using method2 29Figure 18: Shear stress vsshear rate plotof10ppm solution 33
Figure 19: Shear stress vs shear rate plot of20ppm solution 33
Figure 20:Shear stress vs shear rate plot of50ppm solution 34Figure 21: Shear stress vsshear rate plotof700ppm solution 34
vii
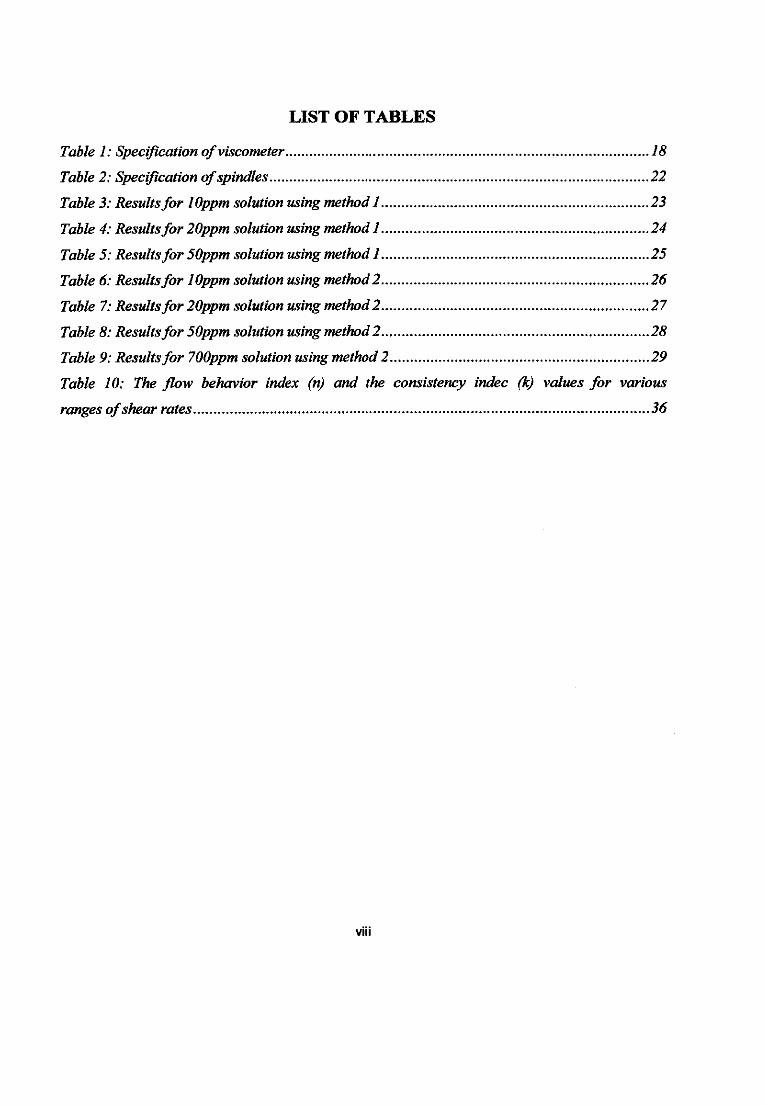
LIST OF TABLES
Table 1: Specification ofviscometer 18
Table 2: Specification ofspindles 22
Table 3: Resultsfor Wppmsolution using method1 23
Table 4: Resultsfor 20ppmsolutionusing method 1 24
Table 5: Resultsfor 50ppmsolutionusing method 1 25
Table 6: Resultsfor lOppmsolution using method2 26
Table 7: Resultsfor 20ppm solution using method2 27
Table 8: Resultsfor 50ppm solution using method2 28
Table 9: Resultsfor 700ppm solution using method2 29
Table 10: The flow behavior index (n) and the consistency indec (k) values for various
ranges ofshear rates 36
VIII
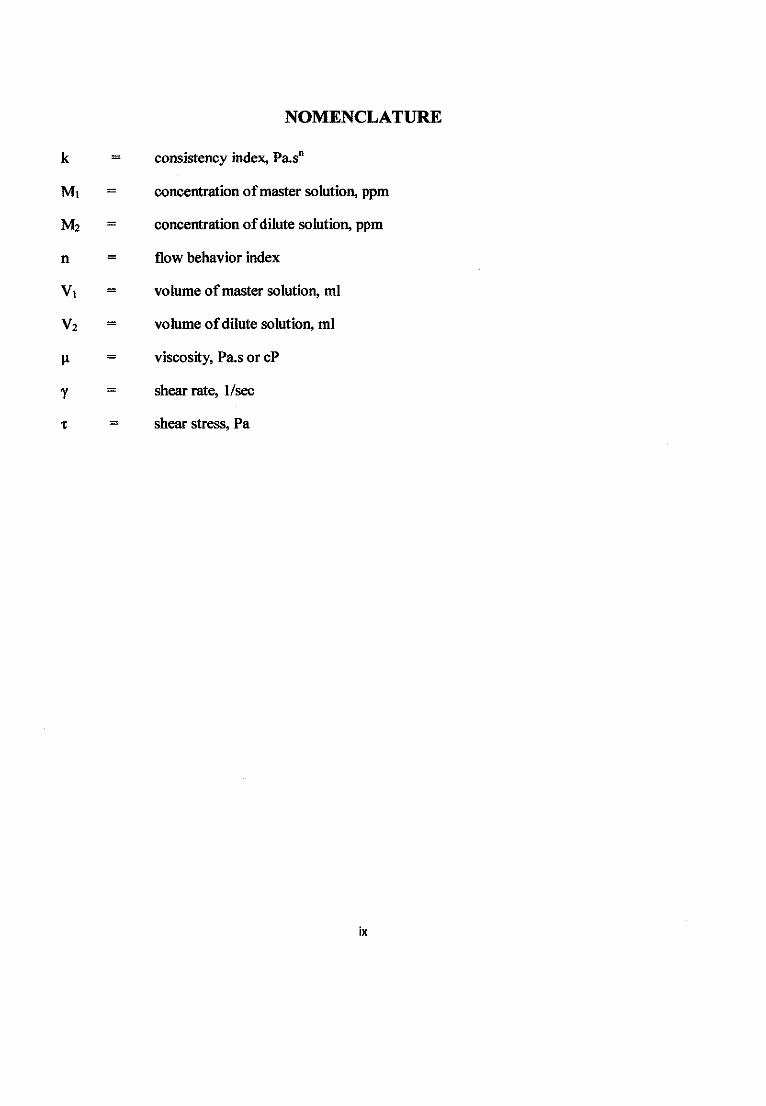
NOMENCLATURE
k — consistency index, Pa.sn
Mi — concentration ofmaster solution, ppm
M2 = concentration ofdilute solution, ppm
n = flow behavior index
Vi = volume ofmaster solution, ml
V2 — volume ofdilute solution, ml
u = viscosity, Pa.s or cP
y = shear rate, 1/sec
x - shear stress, Pa
IX
CHAPTER 1: INTRODUCTION
1.1 Background of Study
Water soluble polymers are rapidly growing practical importance as viscosity-
enhancing agents, flocculating agents, food additives, etc. (Munk et al, 1980).
Polyacrylamide (PAAM) is one of the water-soluble polymers which is a non-toxic
polymer formed from acrylamide subunits which can be synthesized as a simple
linear-chain structure or cross-linked.
Partially hydrolyzed polyacrylamide (HPAM), an enhanced version of PAAM
solution is being widely used currently. It plays an important role in water treatment
as an anionic coagulant, as a viscosifier and shale stabilizer in drilling mud and in
enhanced oil recovery (EOR), where it is used as pushing fluid in the injection wells
to sweep the oil from reservoir into production welI.(Zeynali, 2004)
Due to its wide usage and further enhancement, various studies have been conducted
on the behavior ofHPAM. The effect oftemperature and concentration on rhelogical
properties have been studied in applications such as making clarified juice solution
but only a few reports are available on the effect of various temperature and
concentration. (Yang & Yen, 2001)
Many experimental studies have been carried out by researchers such as Munk et al.
(1980), Kulicke et al.(1982), Ghannam (1998), Yang & Yen (2001) and Zhang et
al.(2008) but none ofthem have tested HPAM under elevated temperature condition.
Thus, the scope ofthis research will be under the stated condition.
1.2 Problem Statement
Partially hydrolyzed polyacrylamide is an important additive used to enhance the
viscosity of water based drilling mud. Although HPAM is widely used in oil
industry, it is unknown whether the properties will change due to elevated
temperature condition, thus this project is being carried out to investigate the
rheological behavior of HPAM under elevated temperature and normal pressure
condition.
1.3 Objective
The main objective of this research is to investigate the effect of elevated
temperature and normalpressure on the viscosity trend, shear rate and shear stress.
1.4 Scope of Study
Six different parameters have been chosen to conduct the study. A constant master
solution concentration, hydration period and pressure will be used throughout the
experiment to compare the results ofeachstudythat will be carried out. Thescopeof
the study will be on the viscosity trend of HPAM at a constant hydration period,
pressure, and master concentration, two different elevated temperatures, five
different dilute concentrations and various shear rates.
1.4.1 The relevancy ofthe Project
In this project we will be focusing on rheological properties at elevated
temperature and normal pressure conditions. It will be highly beneficial for
the drilling fluid companies around the world which are still investigating
until which extend does HPAM can operate as viscosifier in water based mud
system. Furthermore, the result of this project will be a stepping stone for
drilling fluid companies to try operating with water based mud system under
elevated temperature conditions. Plus, water based mud system is
environmental friendly and cheaper compared to oil based mud system.
CHAPTER 2: LITERATURE REVIEW & THEORY
2.1 Literature Review
Nowadays partially hydrolyzed polyacrylamide is gaining more scientific interest
from the researchers around the world due to its wide usage in various industries and
commercialapplication, especially in oil industry. "The viscosityofhydrogel, which
is produced by a dilute or semidilute HPAM solution cross-linked with cross linker,
is higher than that of non-crosslinked HPAM solution of same concentration".
(Zhang et al. 2008) Thus it means that HPAM acts as the most suitable substance to
be used as the sweeping fluid to further recover the oil in the reservoir after the first
stage ofproduction.
It is said that the viscosity varies significantly depending on certain parameters such
as temperature, pressure, concentration and etc. A lot ofstudies have been carried out
to determine the behavior of HPAM under these circumstances. "The effects of
solvent, salt type and concentration, degree ofhydrolysis, and polymerconcentration
on viscosity have been investigated. It was shown that the reduced viscosity of salt-
free solution of partially hydrolyzed polyacrylamide as a result of polymer chain
expansion increases with decreasing polymerconcentration".(Zeynaliet aL 2004)
These particular parametersdoes not only determines the viscosity ofthe solution but
do also play a role in determining whether the polymer solution shows shear thinning
or shear thickening effect with increasing shear rate. 'The shear thickening behavior
ofHPAM is observed at relatively lowpolymer concentration and at very high shear
rate. At very low concentration of polymer, a slight increase in porymer
concentration will cause the critical value of shear rate to be shifted to higher shear
rate". (Lewandowska, 2006). Thus, it concludes that HPAM does not only
experiences shear thinning behavior but it also has the potential to behave as a shear
thickening polymer.
Further models and correlations have been invented to prove the behavior ofHPAM
in order to extend its usage purposes. "By devising the mathematical model for the
rheological behavior of PAAM solution, which relates yield stress at various
temperatures and concentration, it can be proven that, at higher concentrations of
PAAM solution leads to increment in the shear stress. When the concentration is
fixed and the temperature is varied, the shear stress decreases with increasing
temperature. Furthermore it has been concluded that PAAM solution has a non-
Newtonian fluid characteristic and its yield stress decreases with increasing
temperature". (Yang and Yen, 2001) Thus, it proves that rheological studies are very
important in determining the exact behavior ofHPAM under various conditions.
2,2 Theory
2.2.1 Partially Hydrolyzed Polyacrylamide (HPAM)
Partially hydrolyzed polyacrylamide is a very important substance in the oil
and gas industry as it plays different functions in different type of usage. In
the drilling fluid, HPAM is used as viscosifier due to its long chain high
molecularweight polymer plus it has its secondary function as encapsulating
agent which inhibits the drilling cuttings and also the clay from swelling due
to hydration caused by formation fluid and also the fluid in the drilling fluid
itself.
HPAM is formed from a copolymerization process between acrylamide and
sodium acrylate and available in two different categories. One the long chain
high molecular weight porymer and the other is short chain low molecular
weight polymer. These two polymers have their different applications,
advantages and disadvantages. Low molecular weight polymer has a low
viscosity impact on the mud properties plus, absorption of low molecular
weight polymer creates an overall negative charge resulting in deflocculation.
On the other hand, high molecular weight polymer has a high viscosity
impact on the mud properties and it acts as a bridge between the particles to
form larger aggregates which will result in easier and better transportation of
drill cuttings to the surface.
Long chain high molecular weight HPAM naturally appears in a coiled form
when it is unhydrated. It will start to uncoil when being hydrated in a low
salinity environment which will also allow it to form a long chain but if it is
being hydrated in a high salinity environment it will uncoil and shrink due to
the increase in salinity level. From the field experiment that has been carried
out thus far, it has been proven that high temperature can cause HPAM to
stretch which will progressively break down the polymer chain. The long
chain can also break down due to the recirculationprocess while drilling and
also to the rotational motion ofthe drill bit.
HPAM is a negatively charged high molecular weight which adsorbs onto the
positively charged sites on the broken edge of the clay cuttings. This action
results in the formation of a jelly like protective coating which plugs and
seals shale pores retarding the movement of water into the shale. The
protective coating of HPAM plays a significant role in strengthening the
surface of the shale so that it better withstands the effects of mechanical
abrasion or attrition leading to dispersion of clay into the mud which will
disrupt the rheological properties ofthe mud
2.2.2 Rheology
Rheology is derived from the Greek words rheo, meaning flow and logi,
meaning science. It can be defined as the science of the deformation and/or
flow of solids, liquids and gases under applied stress. In essence, the science
deals with the stress-strain-time relationships ofany matter.
The rhological characteristics of material form a continuous spectrum of
behavior ranging from that ofthe perfectly elastic solid at one extreme to that
of the purely viscous Newtonian fluid at the other. Between there extremes
lies the behavior of fluids which possess varying degrees ofcharacter ofboth
extreme materials, such as materials are termed visco-elastic.
The science is still in its infancy in terms of the ability to provide accurate
predictions of the behavior of real systems. This is particularly true with
regard to polymer additive muds being used in drilling operation today, which
have far complex behavior than true fluid.
Despite this, it is still common practice to express flow characteristics in
terms of simple viscosity terms such as the constants used in the Bingham
Plastic and Power Law models. Certain basic concepts ofrheology require to
be understood to make optimum use of collected data. Of these concepts the
relationship between shear stress and shear rate is most important in
predicting polymer behavior
2.2.3 Shear rate
In a moving fluid shear rate can be defined as the rate at which one layer of
fluid is moving by another layer divided by the distance between the layers. It
is the velocity gradient in example, the ration ofvelocity to distance between
layers.
Consider a fluid between two flat plates one centimeter apart. If the bottom
plate is fixed while the top plate slides parallel to it at a constant velocity of 1
cm per sec, a velocity profile will be found within the fluid. The fluid layer in
contact with the bottom plate is static while the layer in contact with the top
plate is moving at 1 cm per sec. Halfway between the plates the fluid velocity
is the average 0.5 per sec.
If a moving layer of fluid has a velocity lcm/sec relative to static layer at
separation distance of 1 cm then the shear rate between these layers will be:
1 cm/sec
lcm= 1 sec 1
The reciprocal second is the standard unit ofshear.
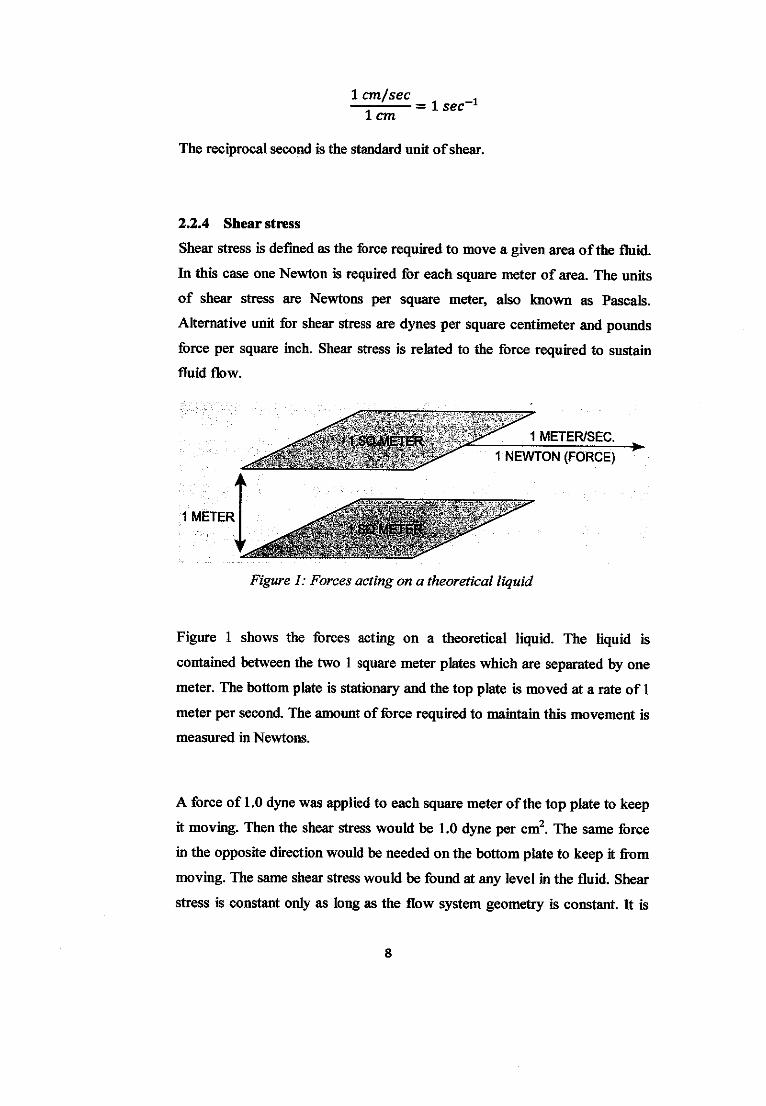
2.2.4 Shear stress
Shear stress is defined as the force required to move a given area ofthe fluid.
In this case one Newton is required for each square meter of area. The units
of shear stress are Newtons per square meter, also known as Pascals.
Alternative unit for shear stress are dynes per square centimeter and pounds
force per square inch. Shear stress is related to the force required to sustain
fluid flow.
^7 -xtSOJWETER 1 METER/SEC.
*: 'i - 1 NEWTON (FORCE)
1 METER1S2MFTER
Figure 1: Forces acting on a theoretical liquid
Figure 1 shows the forces acting on a theoretical liquid. The liquid is
contained between the two 1 squaremeter plates which are separated by one
meter. The bottom plate is stationary and the top plate is moved at a rate of 1
meter per second. The amount offorce required to maintain this movement is
measured in Newtons.
A force of 1.0 dynewas applied to each square meter of the top plate to keep
it moving. Then the shear stress would be 1.0dyne per cm2. The same force
in the opposite direction would be needed on the bottom plate to keep it from
moving. The same shear stress would be found at any level in the fluid. Shear
stress is constant only as long as the flow system geometry is constant. It is

more common to find the shear stress varying from one part ofa flow system
to another.
The units of shear stress are the same as for pressure, but whereas pressure
defines the applied forceper unit area, shear stress is the internal resistance to
an applied stress.
Shear stress can be expressed:
Shear stress = F/A
Where F = Force
A = Area ofsurface subject to stress
The standard unit ofshear stress isdynes/cm2.
2.2.5 Viscosity
Viscosity can be described as the resistance to flow and is defined as the
ration ofshear stress and shear rate
shear stress, (dynes/cm ) n ,Viscosity = r :—; =n = Poise7 shear rate, (sec ^
The units of Poise are too large for rheology studies thus, it is usually
reported in centipoises, cP or milipascaLsecond, mPa.s
Since viscosity is dependent on both shear rate and shear stress, one or the
other must be specified whena viscosity measurement is stated. Shear rate is
the usual variable defined, either as an actual shear rate in reciprocal seconds
or as speed in rpm froma concentric cylinderviscometer.
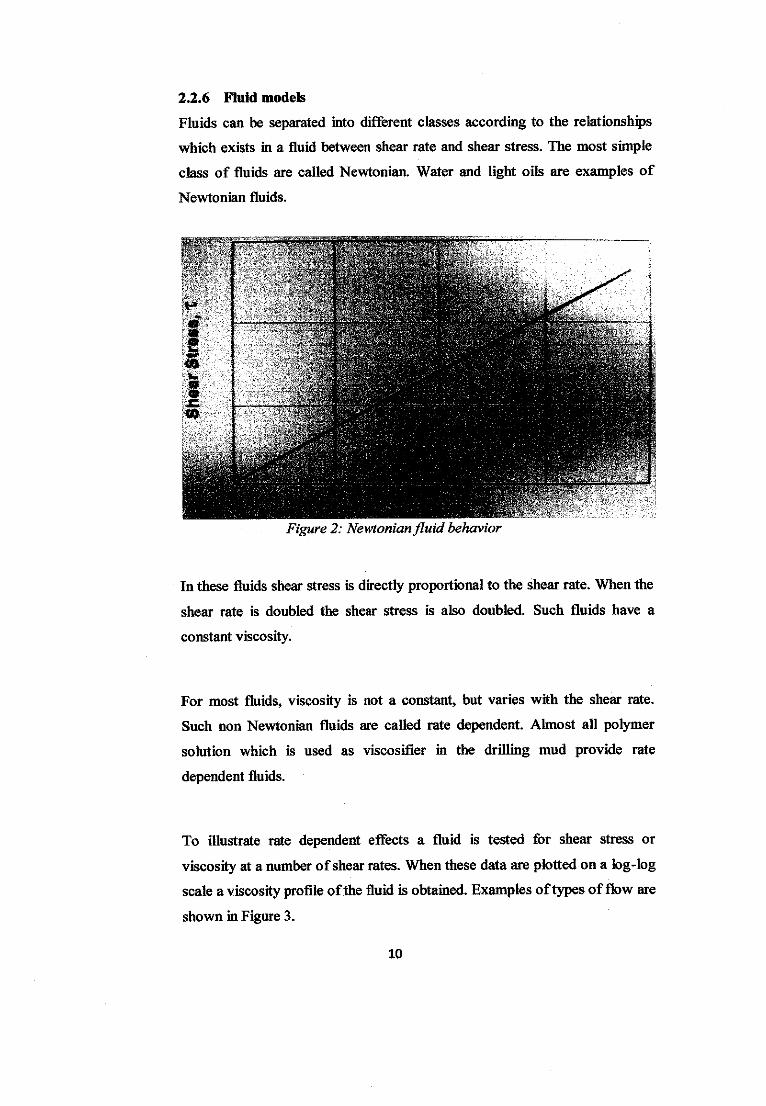
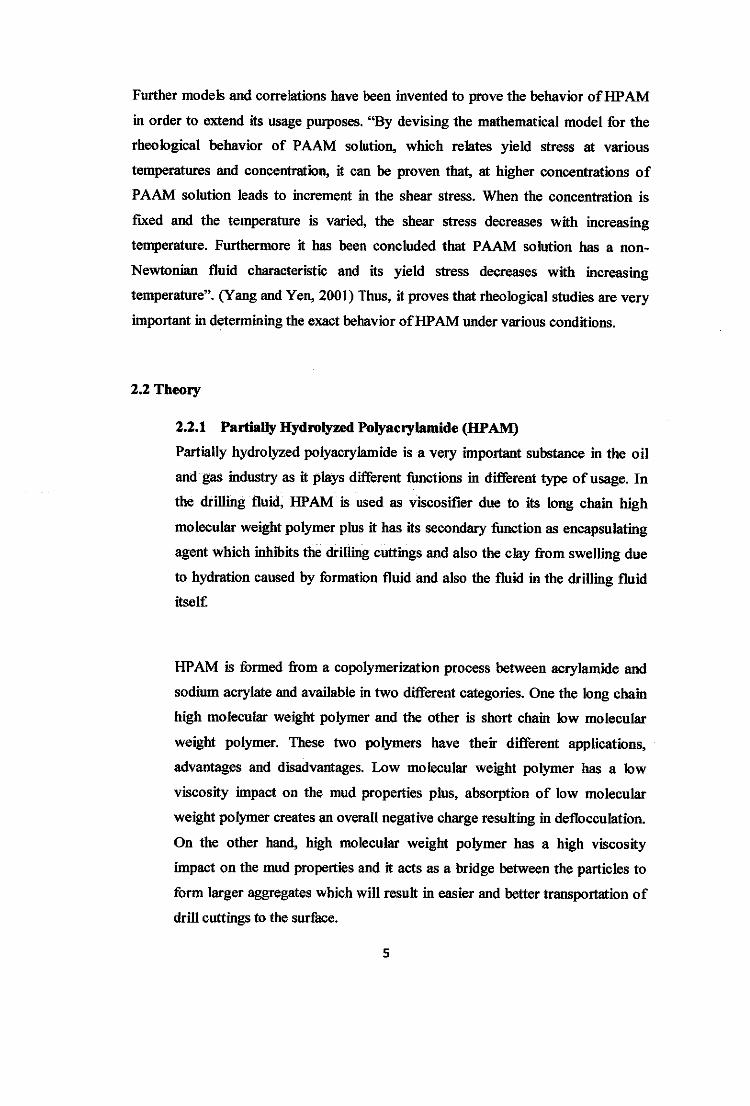
2.2.6 Fluid models
Fluids can be separated into different classes according to the relationships
which exists in a fluid between shear rate and shear stress. The most simple
class of fluids are called Newtoniaa Water and light oils are examples of
Newtonian fluids.
Figure 2: Newtonianfluid behavior
In these fluids shear stress is directly proportional to the shear rate. When the
shear rate is doubled the shear stress is also doubled. Such fluids have a
constant viscosity.
For most fluids, viscosity is not a constant, but varies with the shear rate.
Such non Newtonian fluids are called rate dependent. Almost all polymer
solution which is used as viscosifier in the drilling mud provide rate
dependent fluids.
To illustrate rate dependent effects a fluid is tested for shear stress or
viscosity at a number ofshear rates. When these data are plotted on a log-log
scale a viscosityprofileofthe fluid is obtained. Examplesoftypes of flow are
shown in Figure 3.
10

wCOUl
IOS
XCO
SHEAR RATE
Figure 3: Types offlow
The shear rate / shear stress ratio of non Newtonian fluids are not constant,
which is true of most polymer solutions. Three most popular mathematical
models for describing non Newtonian polymer solution are called the
Bingham Plastic model, Power Law model and modified Power Law or
Herschel-Bulkly model.
Figure 4: Non Newtonianfluid behavior
11

Some fluids have a critical yield stress which must be exceeded before flow is
initiated. Ifthe fluid has essentially Newtonian flow after the yield stress is
exceeded it is termed as Bingham Plastic fluid.
Bingham Plastic model, X= Xy + Up (Y)
Where,
E
v>a>tz>-
o
lip
—shear stress, Pa
= shear rate, sec"1
= yield point, Pa
—plastic viscosity, Pa.sec
400 600
y= shear rate, Ijfeec
1000
Figure 5: Shear stress vs shear rate plotfor Bingham Plasticfluid
Most polymer solutions are Pseudoplastic. Materials that exhibit shear-
thinning can be classified as either Pseudoplastic. In this case, increased shear
rate produces a progressive decrease in viscosity. In polymer solutions, this is
12
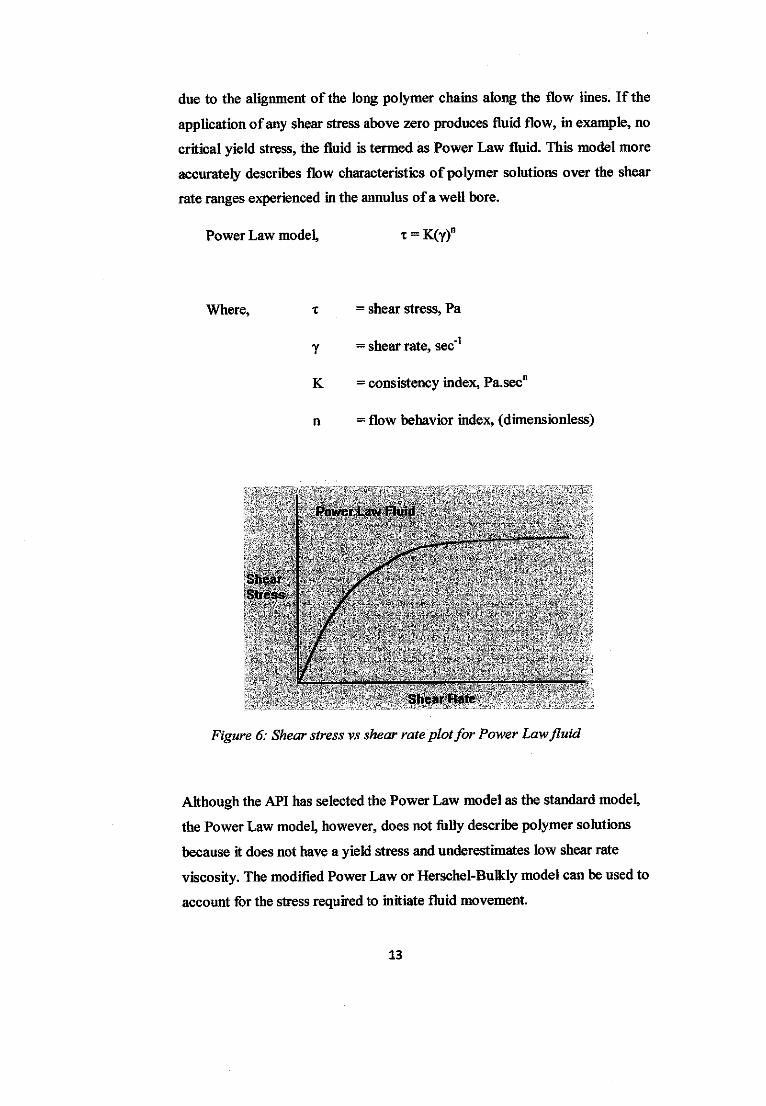
due to the alignment of the long polymer chains along the flow lines. If the
applicationofany shear stressabove zero produces fluid flow, in example,no
critical yield stress, the fluid is termed as Power Law fluid. This model more
accurately describes flow characteristics of polymer solutions over the shear
rate ranges experienced in the annulus ofa well bore.
Power Law model, K(y)n
Where,
Shear
Stress
x = shear stress, Pa
y - shear rate, sec"1
K = consistency index, Pa.secn
n = flow behavior index, (dimensionless)
Power Law Fluid
Shear Rate
Figure 6: Shear stress vs shear rate plotfor Power Lawfluid
Although the API has selected the PowerLaw model as the standard model,
the Power Law model, however, does not fully describe polymer solutions
because it does not have a yield stress and underestimates low shear rate
viscosity. The modified PowerLaw or Herschel-Bulkly model can beusedto
account for the stress required to initiate fluid movement.
13

Modified Power Law, X= Xy + Kf
Where,
Shearstress
i
Shea*stress
T
x = shear stress, Pa
Y = shearrate, sec"1
K = consistency index, Pa.sec"
n = flow behavior index, (dimensionless)
xy = yield point, Pa
Newtonian Model
Shear rale •
Bingham Plastic Model
Shear rate y
Power Law Model
Shea;rate y
Herschel-Bulkley Model
it
Shearstress
T
Shear rate v
Figure 7: Shear stress vs shear rate plotfor various rheology models
Although the modified Power Law is a slightly more complicated model than
either the Bingham Plastic model or the Power Law, it can approximate more
closely the true rheological behavior ofmost polymer solutions.
14
H
©
55re©
CO
B;r•*gham P ias:>c model
t .rf'
*-- Modified Power Law
."* Power Law
Shear Rate J
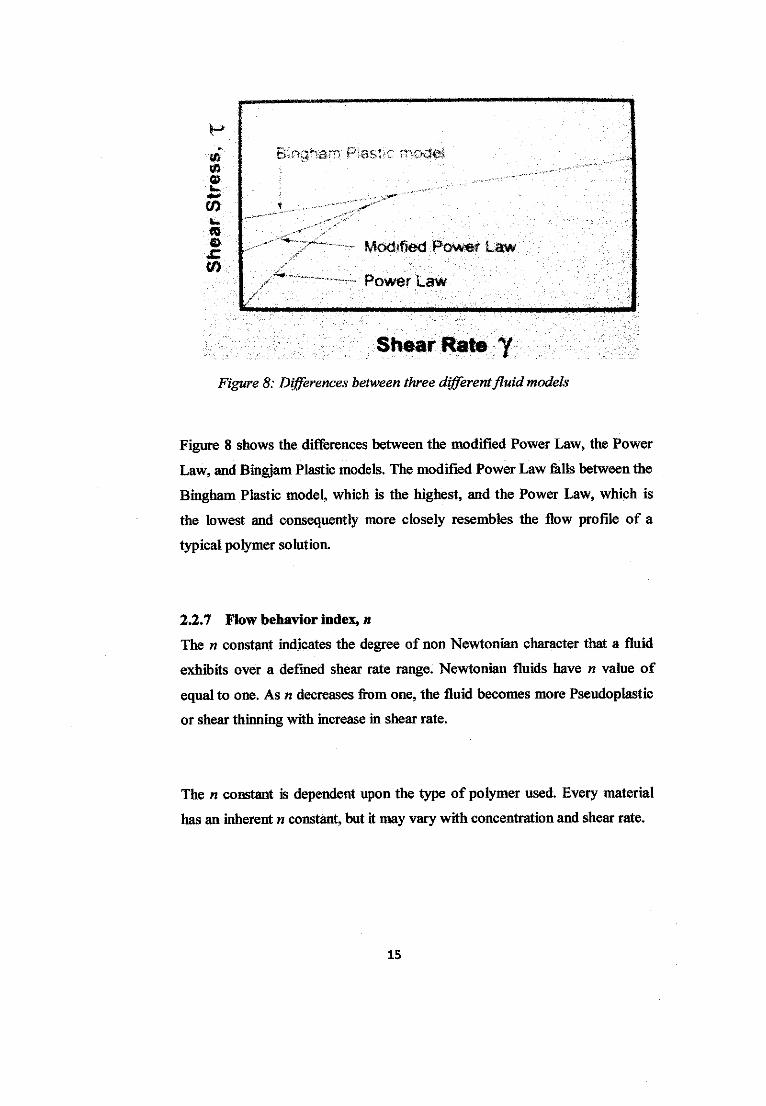
Figure 8: Differences between three differentfluid models
Figure 8 shows the differences between the modified Power Law, the Power
Law, and Bingjam Plastic models. The modified Power Law falls between the
Bingham Plastic model, which is the highest, and the Power Law, which is
the lowest and consequently more closely resembles the flow profile of a
typical polymer solution.
2.2.7 Flow behavior index, n
The n constant indicates the degree of non Newtonian character that a fluid
exhibits over a defined shear rate range. Newtonian fluids have n value of
equal to one. As n decreases from one, the fluid becomes more Pseudoplastic
or shear thinning with increase in shear rate.
The n constant is dependent upon the type of polymer used. Every material
has an inherent wconstant, but it may vary with concentration and shear rate.
15
2.2.8 Consistency index, k
K is the consistency index when the shear stress or viscosity of the fluid at a
shear rate of one sec"1. It relates directly to the system viscosity at low shear
rates. The k constant is controlled by both the type of polymer and the total
solids content of the fluid. It will increase with decrease in n constant or by
increase in solid concentration.K can be reported as Pa.secn.
16

CHAPTER 3: METHODOLOGY
3.1 Research Methodology & Project Activities
Different findings and methodologies are gathered from the research work of other
researchers and to be incorporated in this project. First and foremost, various journals
and technical papers were read through the get the general understanding on the
project. It is also needed to identify the objective ofthis project and to come up with
a proven method to run the experiment. Once the objective has been identified, the
proven method to prepare the solution is obtained with a series ofdiscussion with my
supervisor and also with the reference from the previous works done by other
researchers.
3.2 Polymer Solution Preparation
After series of discussion with my supervisor, we have come to a conclusion that to
use his method of preparation which he has used for his Phd studies to prepare the
polymer solution. In order to prepare 700 ppm of master solution, I will have to mix
7 grams of HPAM powder with 10 liters ofdistilled water. The HPAM powder will
be sprinkled into the tank. Once it has been sprinkled evenly throughout the bottom
ofthe tank, we will have to add 10 liters of distilled water at once to ensure perfect
mixing. This mixture will be agitated using a stirrer (Brand: OCA, Model:
EUROSTAR Power Control-Vise 2600000) at a constant rotating speed of 50 rpm
for 2 hours before storing it at room temperature for 1 day to hydrate the solution.
The analysis of the master solution is performed after 1 day hydration period is
achieved.
Once 1 day of hydration period is achieved, the master solution will be further
diluted to 10 ppm, 20 ppm, 30 ppm, 40 ppm, and 50 ppm solutions using distilled
water, beaker and volumetric flask. This can be done by using the following
equation:
17
Where,
M1.V1-M2.V2
Mi = concentration ofmaster solution(ppm)
Vi - volume ofmaster solution (ml)
M2 = concentration ofdilute solution(ppm)
V2 = volume ofdilute solution (ml)
Once the dilute solution has beenprepared, it mustbe storedfor a day to achieve the
hydrationperiod before beingtestedthe following day.
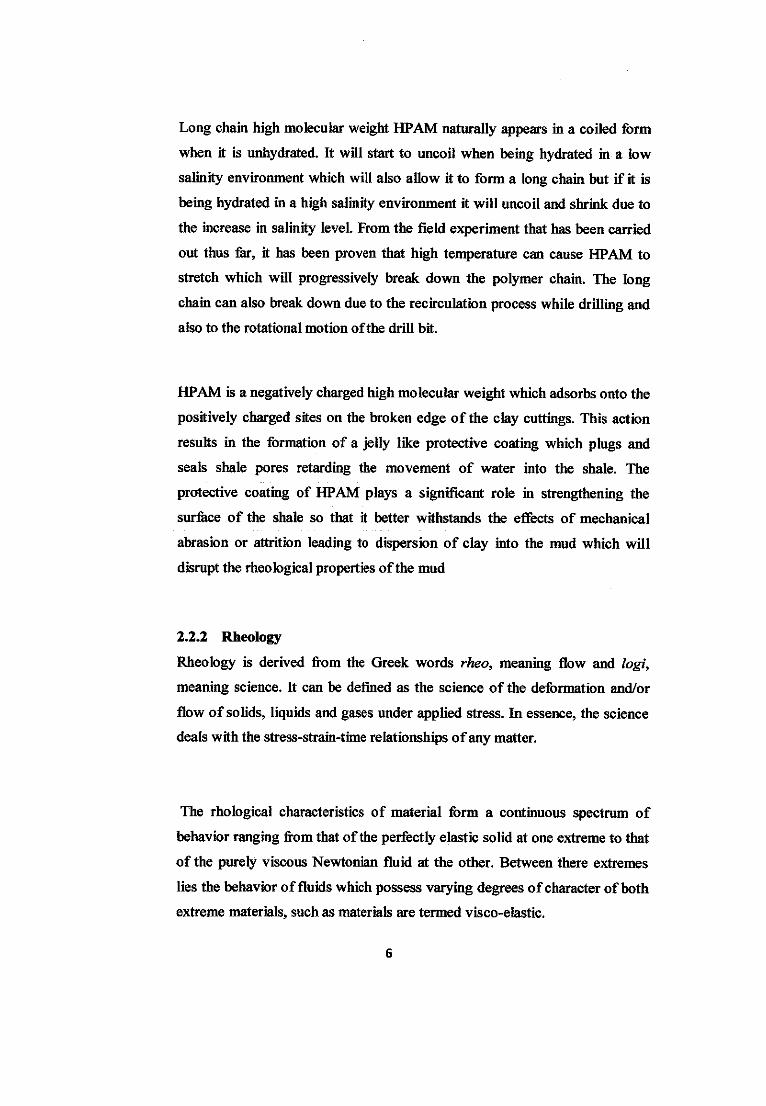
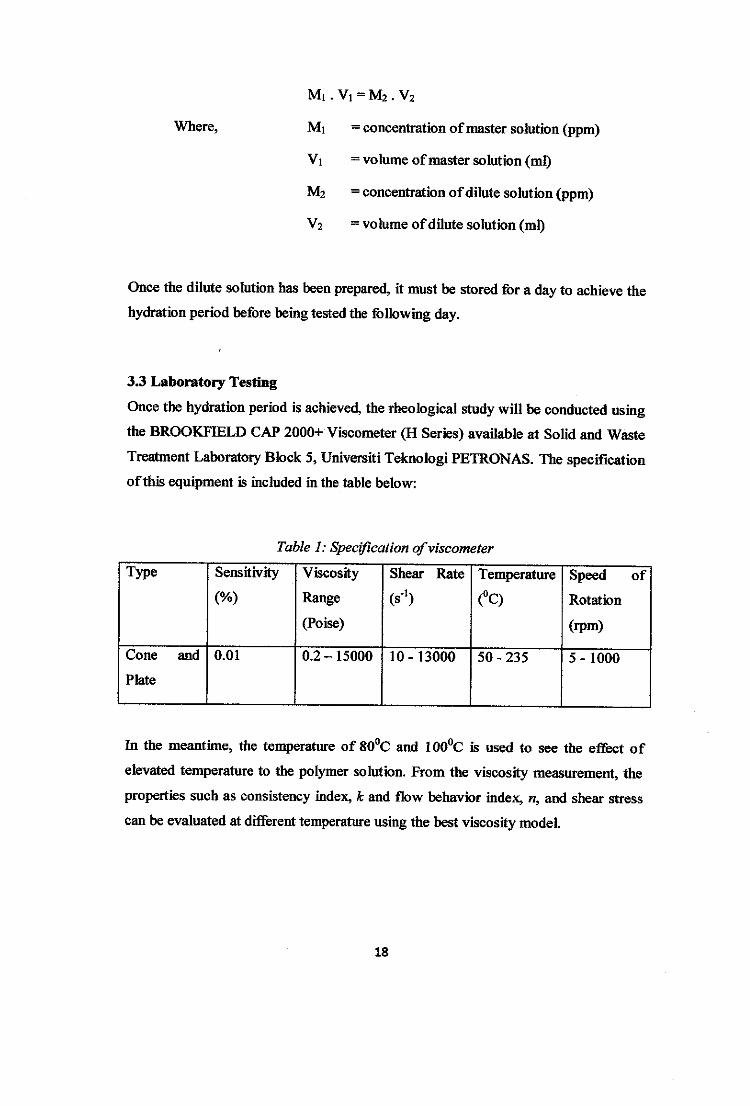
3.3 Laboratory Testing
Once the hydration period isachieved, the rheological study will beconducted using
the BROOKFIELD CAP 2000+ Viscometer (H Series) available at Solid and Waste
Treatment Laboratory Block 5, Universiti Teknologi PETRONAS. The specification
ofthis equipment is included in the table below:
Type
Cone and
Plate
Table 1: Specificationofviscometer
Sensitivity
0.01
Viscosity
Range
(Poise)
0.2-15000
Shear Rate
(a"1)
10-13000
Temperature
(°C)
50 - 235
Speed of
Rotation
(rpm)
5 - 1000
In the meantime, the temperature of 80°C and 100°C is used to see the effect of
elevated temperature to the polymer solution. From the viscosity measurement, the
properties such as consistency index, k and flow behavior index, «, and shear stress
can be evaluated at different temperature using the bestviscosity model.
IS

Figure 9: BROOKFIELD
CAP 2000+ Viscometer
Figure 10: IKA EUROSTAR Power
Control Stirrer
3.3.1 Methods ofconducting the experiment
The experiment has been carried out in two different ways. It is to investigate
which method gives the best reading in terms ofviscosity reading and trend.
Method 1
The main principle of this method is using a new sample from the same
sample bottle for each reading which will be taken at different shear rates
using the viscometer. First the temperature ofthe viscometer will be set to the
expected temperature which is 80°C. Once the temperature is set, the spindle
will be clamped down to ensure that the spindles temperature and the testing
plate temperature are in equilibrium.
The shear rate will be set to the wanted shear rate, for an example 20 s"1 and
few drops of the polymer solution will be placed on the testing plate. Once
the temperature is constant at 80°C the experiment will be started. Once the
data is collected, the sample on the testing plate will be wiped and the shear
rate will be changed to 30 s"1 before placing a new sample from the same
sample bottle on to the testing plate.
19
fsd
These steps will be repeated until 3000 s"1 and the temperature will be
increased to 100°C. The whole steps will be repeated to gain the data for both
temperatures.
Method 2
The second method focuses on using the same sample throughout the whole
experiment at a specific temperature. First the temperature of the viscometer
will be set to the expected temperature which is 80°C. Once the temperatureis set, the spindle will be clamped down to ensure that the spindles
temperature and the testing plate temperature are in equilibrium.
The shear rate will be set to the wanted shear rate, for an example 20 s"1 and
few drops of the polymer solution will be placed on the testing plate. Once
the temperature is constant at 80°C the experiment will be started. After
jotting down the viscosity reading. The shear rate will be increased to 30 s"1and the second run ofdata collection will be started. This particular step will
be repeated until the viscosity reading for 3000 s'1 shear rate istaken.
Once the data for 80°C is collected the temperature will be raised to 100°C
and the stated steps will be repeated to collect the viscosity reading.
20
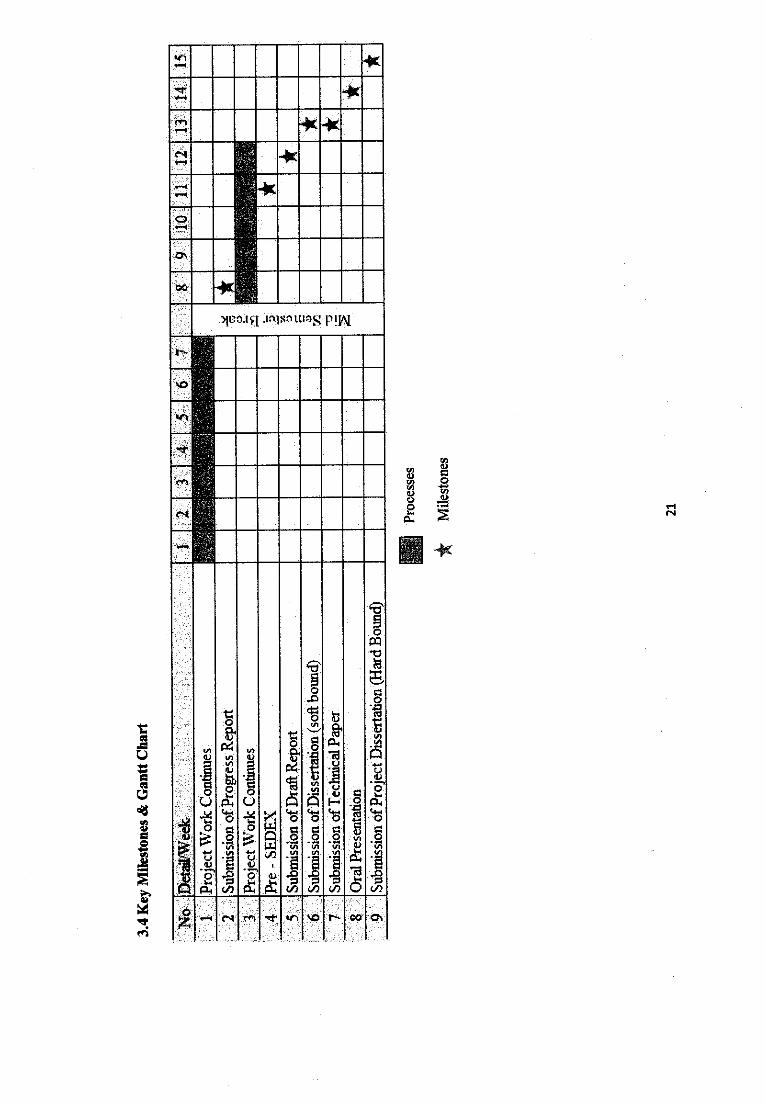
3.4
Key
Mile
ston
es&
Gan
ttC
har
t
*~
m-:
Det
ail/
Wee
k|
12
34
,:.
•#.
;6.-.*•
•;•^8
T-':
93
011
12:
13
14;
15
iPr
ojec
tW
ork
Con
tinue
s
•,.
2"-'
Subm
issi
onof
Prog
ress
Rep
ort
•i;.
:3"-
-""P
roje
ctW
ork
Con
tinue
s
'••--4
','-:
Pre
-S
ED
EX
s s -J i
••'•*
..;
Subm
issi
ono
fDra
ftR
epor
t•
•;••*•
''.•
Subm
issi
ono
fDis
sert
atio
n(s
oftb
ound
)•
;-:
7Su
bmis
sion
ofT
echn
ical
Pap
er•
:;.-*
.-'""
'-O
ral
Pre
sen
tati
on
•9
Subm
issi
onof
Proj
ectD
isse
rtatio
n(H
ard
Bou
nd)
•
Pro
cess
es
Mil
esto
nes
21
CHAPTER 4: RESULTS & DISCUSSION
4.1 Data Gathering, Analysis and Discussion
The viscosity test for both the master solution (700 ppm) and the dilute solutions was
conducted at block 5 using the Brookrleld Cap 2000+ Viscometer. The test is done
using 6 different spindles and the best viscosity reading is taken from the spindle
which gives the lowest percentage oferror.
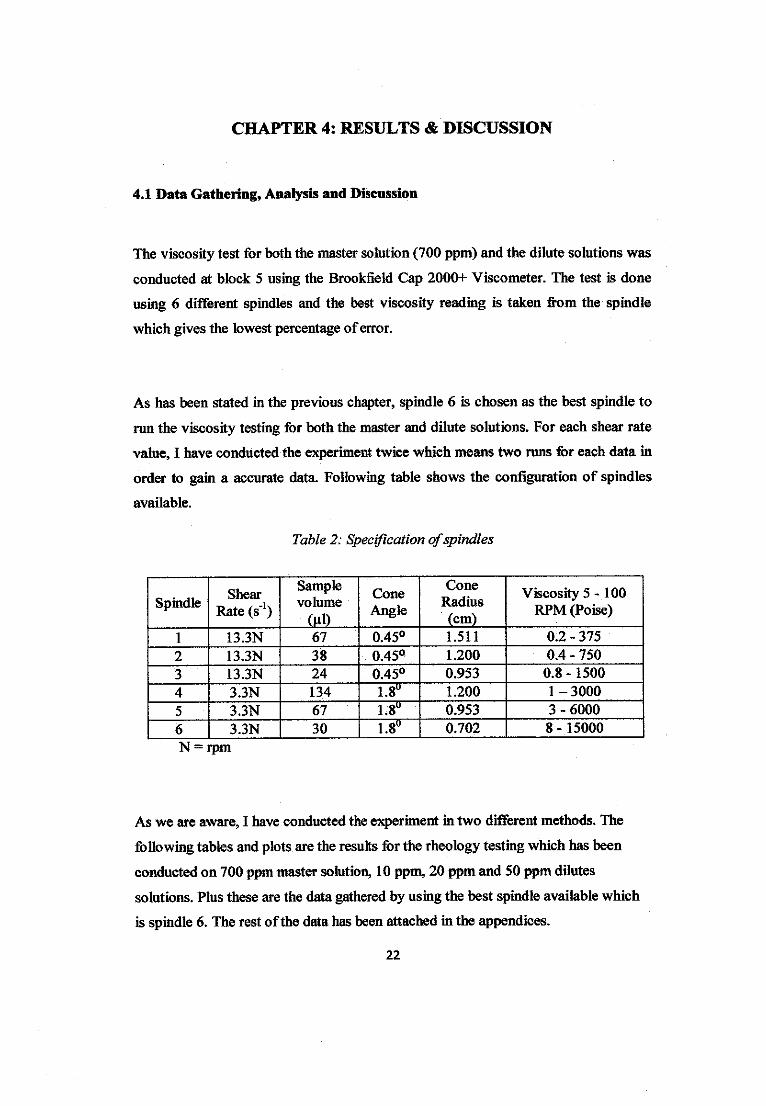
As has been stated in the previous chapter, spindle 6 is chosen as the best spindle to
run the viscosity testing for both the master and dilute solutions. For each shear rate
value, I have conducted the experiment twice which means two runs for each data in
order to gain a accurate data. Following table shows the configuration of spindles
available.
Table 2: Specification ofspindles
SpindleShear
Rate (s"1)
Samplevolume
(Hi)
Cone
Angle
Cone
Radius
(cm)
Viscosity 5- 100RPM (Poise)
1 13.3N 67 0.45° 1.511 0.2 - 375
2 13.3N 38 0.45° 1.200 0.4 - 750
3 13.3N 24 0.45° 0.953 0.8-1500
4 3.3N 134 1.8° 1.200 1-3000
5 3.3N 67 1.8° 0.953 3 - 6000
6 3.3N 30 1.8° 0.702 8-15000
N = rpm
As we are aware, I have conducted the experiment in two different methods. The
following tables and plots are the results for the rheology testing which has been
conducted on 700 ppm master solution, 10 ppm, 20 ppm and 50 ppm dilutes
solutions. Plus these are the data gathered by using the best spindle available which
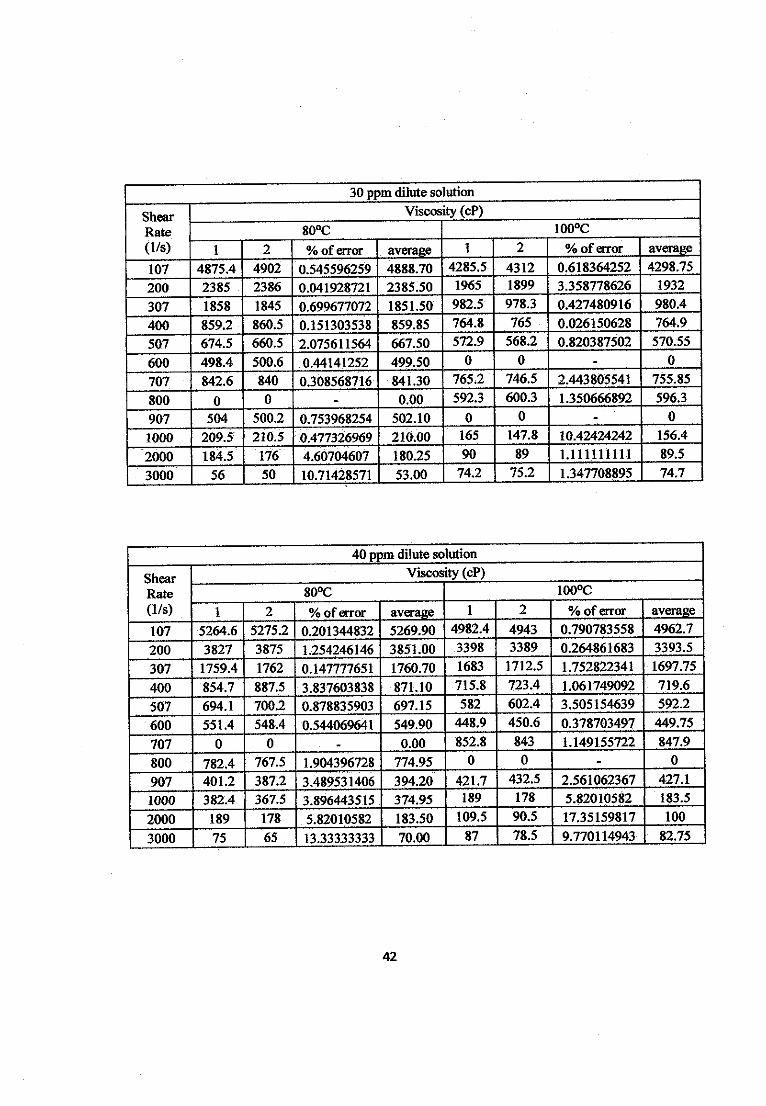
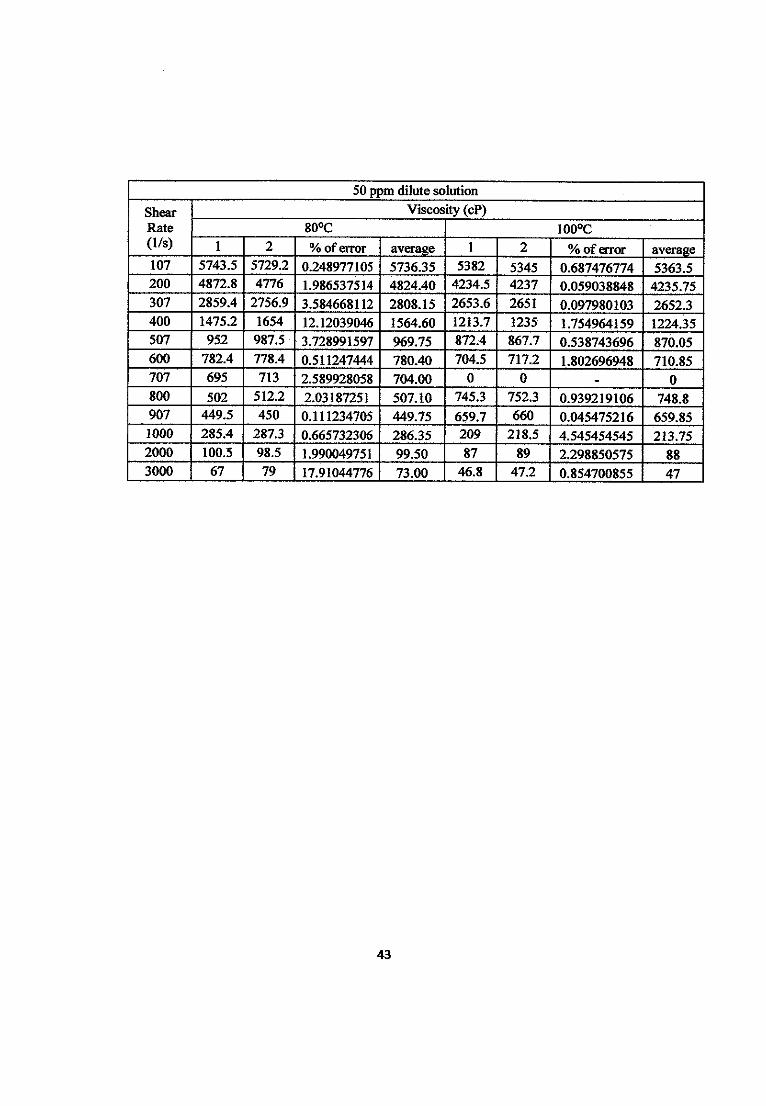
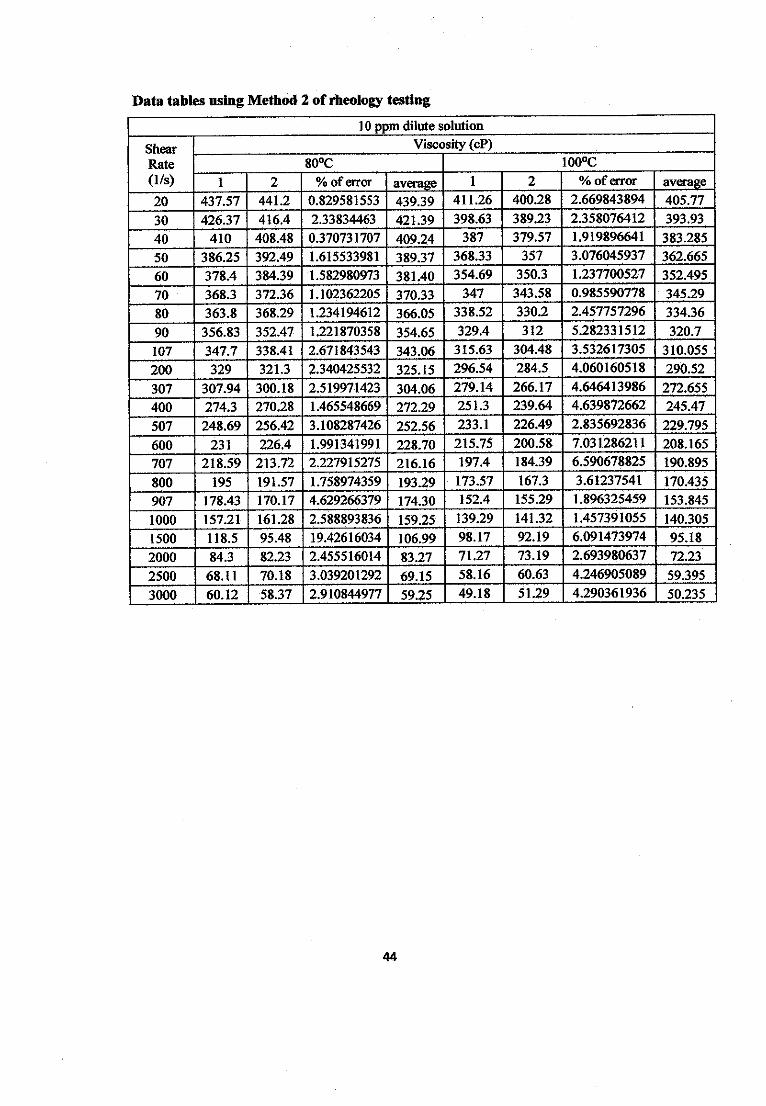
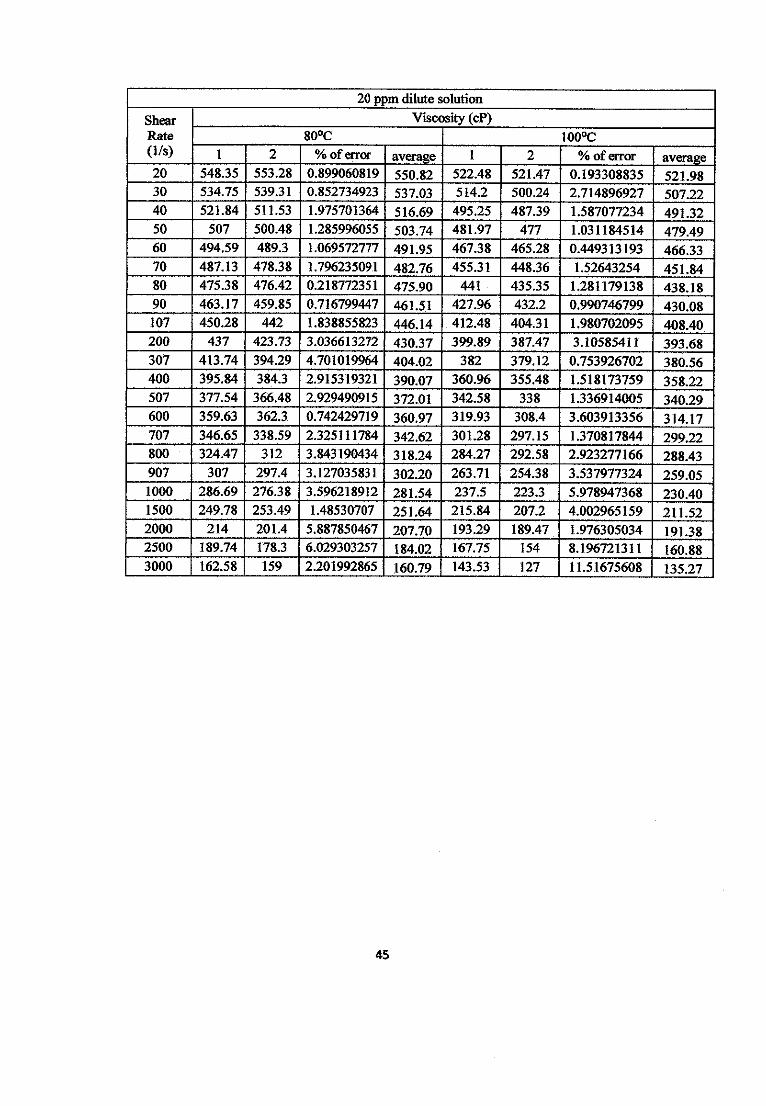
is spindle 6. The rest ofthe data has been attached in the appendices.
22

Table 3: Resultsfor 10 ppm solution using method 1
10ppm dilute solution
Shear Rate
(1/s)
Viscosity (cP)
80°C 100°C
1 2 % of error 1 2 % oferror
107 4921.8 4931 0.186923483 4587.2 4612 0.54063481
200 0 0 - 782.4 804 2.760736196
307 4 7 75 0 0 m
400 44.1 53.2 20.63492063 78.3 82.3 5.108556833
507 0 0 - 425.7 423.5 0.516795866
600 542.6 539.6 0.552893476 257.4 248 3.651903652
707 78 85 8.974358974 459.9 460 0.021743857
800 324.5 320 1.386748844 338.2 344 1.714961561
907 243 248.3 2.181069959 287.3 278.54 3.049077619
1000 87 90 3.448275862 0 0 -
2000 0 0 - 887.5 880.2 0.822535211
3000 54 55 1.851851852 89.4 90 0.67114094
•100°C
3000 4000
Shear Rate (1/s)
Figure 11: Viscosity trend of10ppm solution at80°C and WCPc
using Method 1
23

Table 4: Resultsfor 20 ppm solution using method 1
20 ppm dilute solution
Shear Rate
(1/s)
Viscosity (cP)
80°C 100°C
1 2 % of error 1 2 % of error
107 3672.5 3679.4 0.187882914 3275.4 3308 0.995298284
200 787.6 792 0.558659218 1905 1840 3.412073491
307 492.5 490.2 0.467005076 598.3 602 0.618418853
400 448.4 450.2 0.401427297 476 488 2.521008403
507 256.82 255 0.708667549 372.5 383.2 2.872483221
600 482.7 440.5 8.74249016 886.7 869.2 1.973610015
707 376.2 382.5 1.674641148 0 0 -
800 320 307 4.0625 287 278 3.135888502
907 778 773 0.642673522 398.6 386 3.161063723
1000 649.2 650.4 0.184842884 287.3 288.5 0.417681866
2000 87.2 82.3 5.619266055 189.2 201 6.236786469
3000 43 45 4.651162791 105.2 100.4 4.562737643
1000 2000 3000
Shear Rate (1/s)
4000
™#—80°C
100°C
Figure 12: Viscosity trend of20ppm solution at80°C and 10(fC
using Method 1
24
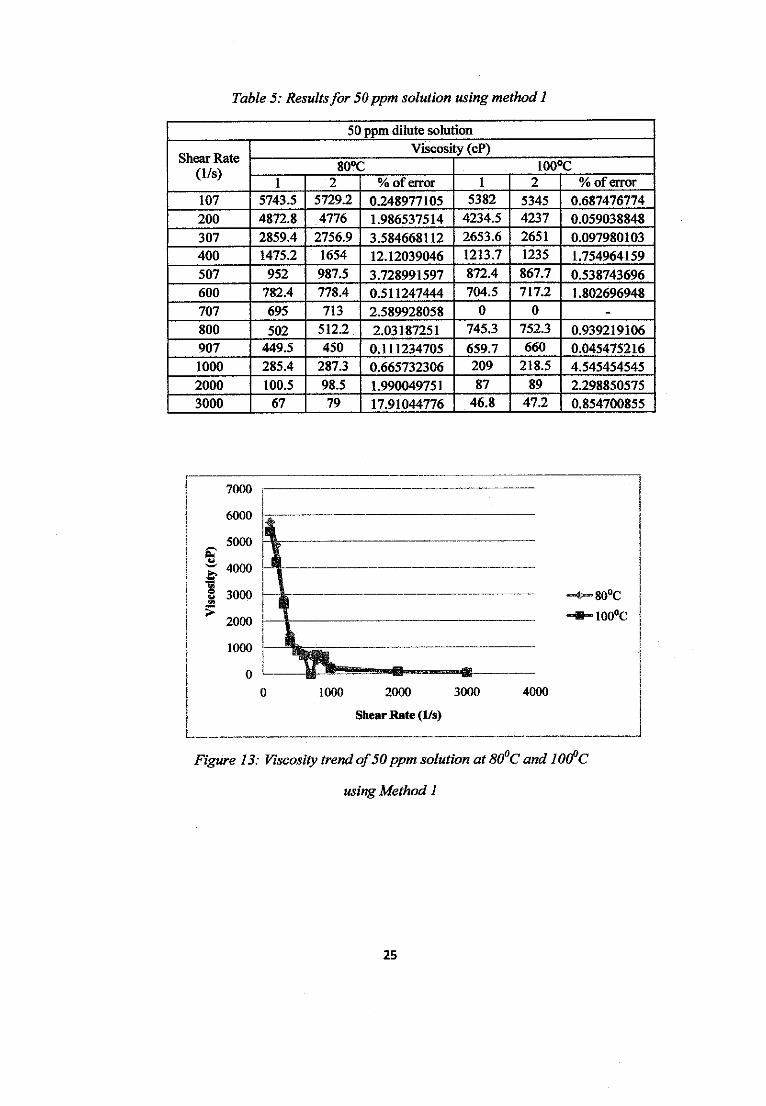
Table5: Resultsfor 50ppm solution using method1
50 ppm dilute solution
Shear Rate
(1/s)
Viscosity (cP)
80°C 100°C
1 2 % of error 1 2 % oferror
107 5743.5 5729.2 0.248977105 5382 5345 0.687476774
200 4872.8 4776 1.986537514 4234.5 4237 0.059038848
307 2859.4 2756.9 3.584668112 2653.6 2651 0.097980103
400 1475.2 1654 12.12039046 1213.7 1235 1.754964159
507 952 987.5 3.728991597 872.4 867.7 0.538743696
600 782.4 778.4 0.511247444 704.5 717.2 1.802696948
707 695 713 2.589928058 0 0 _
800 502 512.2 2.03187251 745.3 752.3 0.939219106
907 449.5 450 0.111234705 659.7 660 0.045475216
1000 285.4 287.3 0.665732306 209 218.5 4.545454545
2000 100.5 98.5 1.990049751 87 89 2.298850575
3000 67 79 17.91044776 46.8 47.2 0.854700855
1000 2000 3000
Shear Rate (1/s)
4000
Figure 13: Viscosity trend of50ppm solution at80°C and 10(Pc
using Method 1
25
80°C
100°C
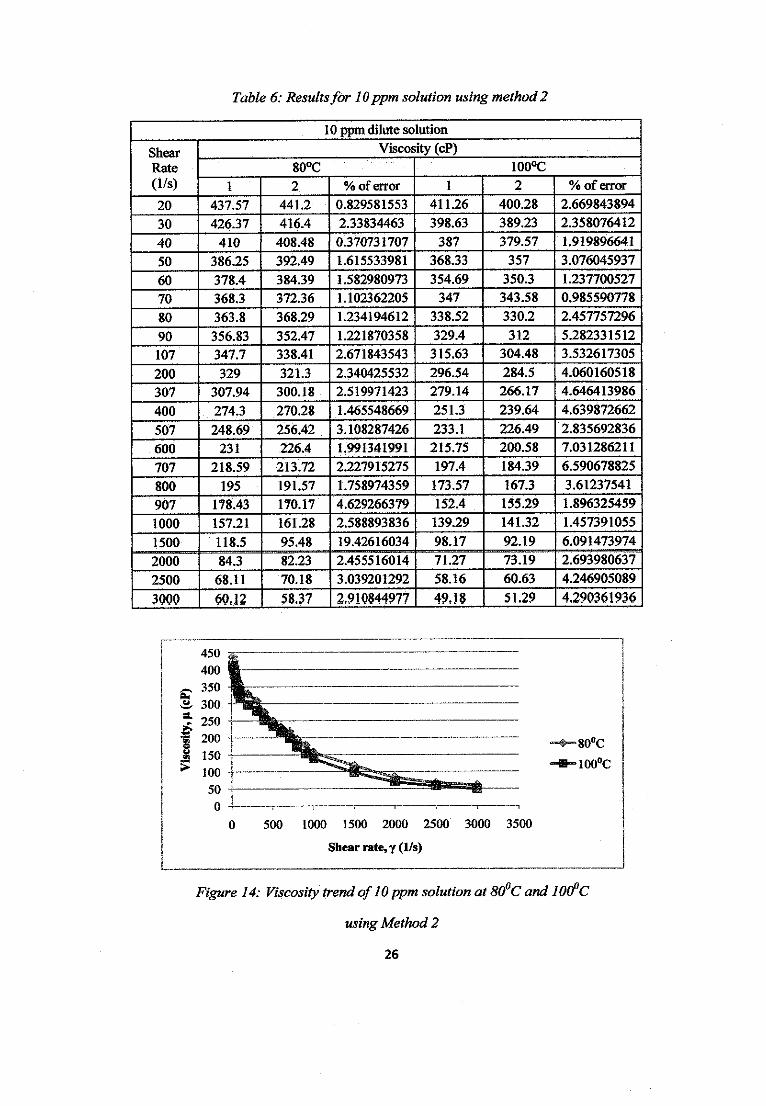
Table 6: Resultsfor 10ppm solution using method2
10 ppm dilute solution
Shear
Rate
(1/s)
Viscosity (cP)
80°C 100°C
1 2 % oferror 1 2 % of error
20 437.57 441.2 0.829581553 411.26 400.28 2.669843894
30 426.37 416.4 2.33834463 398.63 389.23 2.358076412
40 410 408.48 0.370731707 387 379.57 1.919896641
50 386.25 392.49 1.615533981 368.33 357 3.076045937
60 378.4 384.39 1.582980973 354.69 350.3 1.237700527
70 368.3 372.36 1.102362205 347 343.58 0.985590778
80 363.8 368.29 1.234194612 338.52 330.2 2.457757296
90 356.83 352.47 1.221870358 329.4 312 5.282331512
107 347.7 338.41 2.671843543 315.63 304.48 3.532617305
200 329 321.3 2.340425532 296.54 284.5 4.060160518
307 307.94 300.18 2.519971423 279.14 266.17 4.646413986
400 274.3 270.28 1.465548669 251.3 239.64 4.639872662
507 248.69 256.42 3.108287426 233.1 226.49 2.835692836
600 231 226.4 1.991341991 215.75 200.58 7.031286211
707 218.59 213.72 2.227915275 197.4 184.39 6.590678825
800 195 191.57 1.758974359 173.57 167.3 3.61237541
907 178.43 170.17 4.629266379 152.4 155.29 1.896325459
1000 157.21 161.28 2.588893836 139.29 141.32 1.457391055
1500 118.5 95.48 19.42616034 98.17 92.19 6.091473974
2000 84.3 82.23 2.455516014 71.27 73.19 2.693980637
2500 68.11 70.18 3.039201292 58.16 60.63 4.246905089
3000 60,12 58,37 2,910844977 49,18 51,29 4,290361936
J 250 -¥ 200
I 150> 100
500 1000 1500 2000 2500 3000 3500
Shearrate, y (1/s)
^♦— 80°C
100°C
Figure 14: Viscosity trend of10ppm solution at80°C and 10(fC
using Method 2
26

Table 7: Resultsfor 20 ppm solution using method 2
20 ppm dilute solution
Shear
Rate
(1/s)
Viscosity (cP)80°C 100°C
1 2 % oferror 1 2 % of error
20 548.35 553.28 0.899060819 522.48 521.47 0.193308835
30 534.75 539.31 0.852734923 514.2 500.24 2.714896927
40 521.84 511.53 1.975701364 495.25 487.39 1.587077234
50 507 500.48 1.285996055 481.97 477 1.031184514
60 494.59 489.3 1.069572777 467.38 465,28 0.449313193
70 487.13 478.38 1.796235091 455.31 448.36 1.52643254
80 475.38 476.42 0.218772351 441 435.35 1.281179138
90 463.17 459.85 0.716799447 427.96 432.2 0.990746799
107 450.28 442 1.838855823 412.48 404.31 1.980702095
200 437 423.73 3.036613272 399.89 387.47 3.10585411
307 413.74 394.29 4.701019964 382 379.12 0.753926702
400 395.84 384.3 2.915319321 360.96 355.48 1.518173759
507 377.54 366.48 2.929490915 342.58 338 1.336914005
600 359.63 362.3 0.742429719 319.93 308.4 3.603913356
707 346.65 338.59 2.325111784 301.28 297.15 1.370817844
800 324.47 312 3.843190434 284.27 292.58 2.923277166
907 307 297.4 3.127035831 263.71 254.38 3.537977324
1000 286.69 276.38 3.596218912 237.5 223.3 5.978947368
1500 249.78 253.49 1.48530707 215.84 207.2 4.002965159
2000 214 201.4 1" 5.887850467 193.29 189.47 1.976305034
2500 189.74 178.3 6.029303257 167.75 154 8.196721311
3000 162,58 159 2,201992865 143,53 127 11,51675608
500 1000 1500 2000 2500 3000 3500
Shear rate, y (1/s)
•—$— 80°C
100°C
Figure 15: Viscosity trend of20ppm solution at 8(fC and10(fC
using Method 2
27
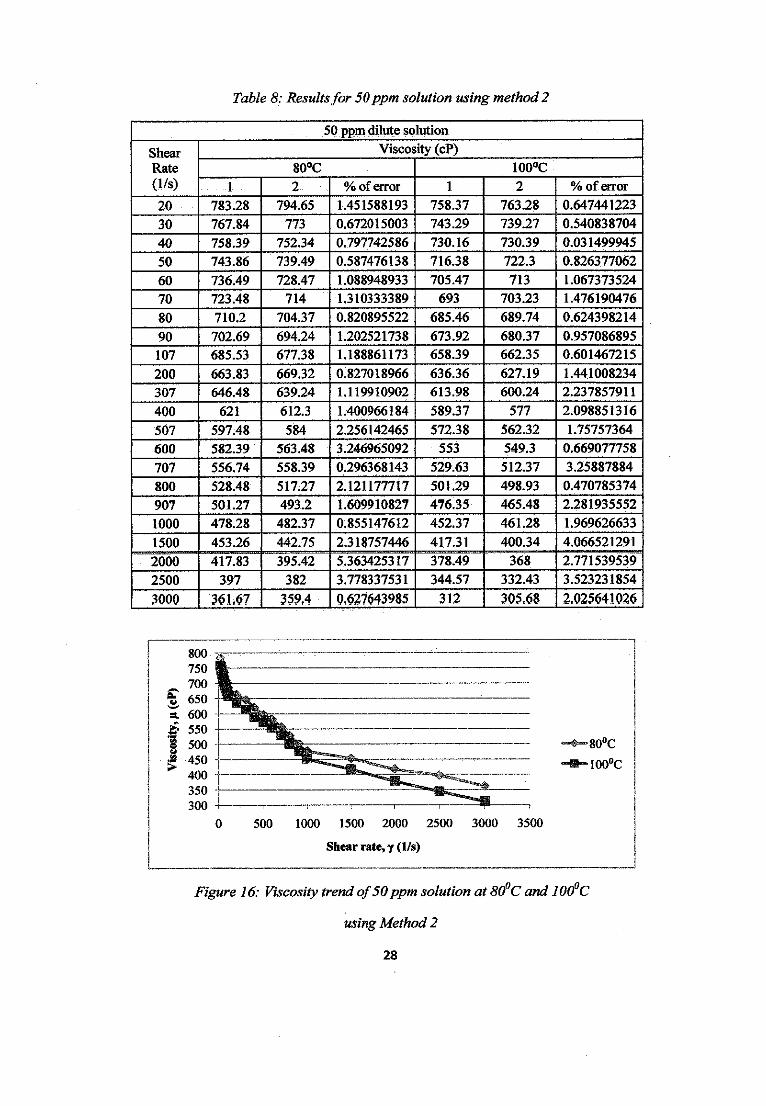
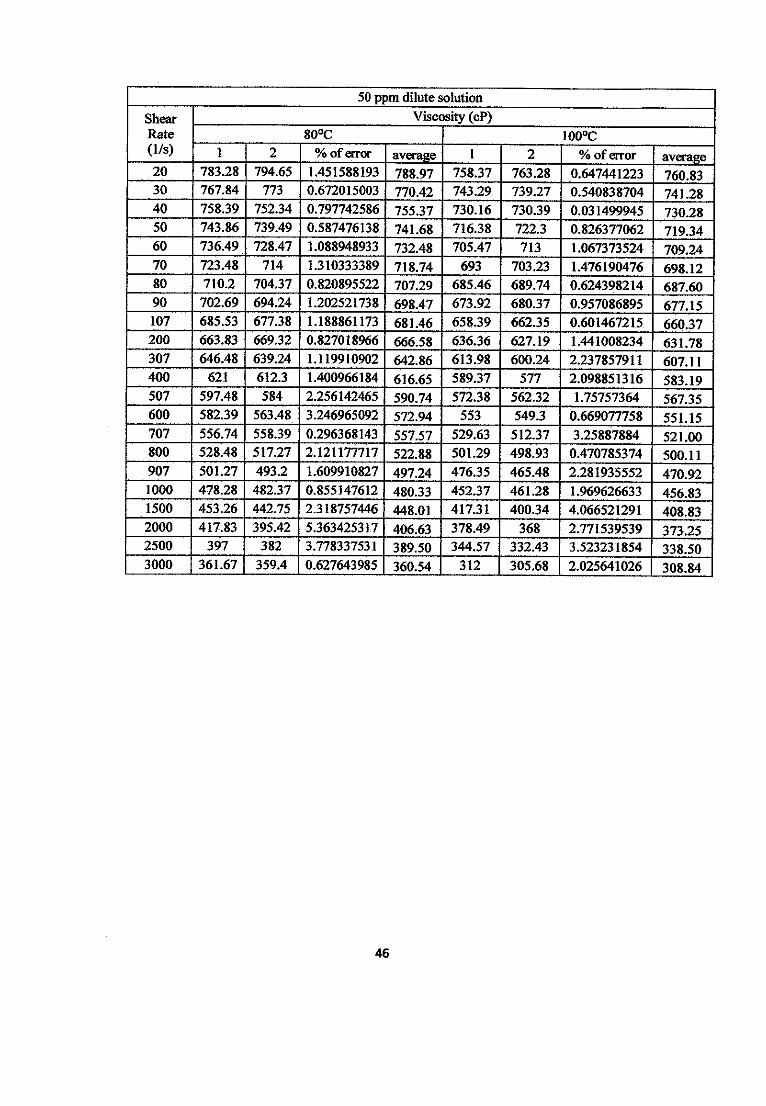
Table 8: Resultsfor 50 ppm solution using method 2
50 ppm dilute solution
Shear
Rate
(1/s)
Viscosity (cP)
80°C 100°C
1 2 % of error 1 2 % oferror
20 783.28 794.65 1.451588193 758.37 763.28 0.647441223
30 767.84 773 0.672015003 743.29 739.27 0.540838704
40 758.39 752.34 0.797742586 730.16 730.39 0.031499945
50 743.86 739.49 0.587476138 716.38 722.3 0.826377062
60 736.49 728.47 1.088948933 705.47 713 1.067373524
70 723.48 714 1.310333389 693 703.23 1.476190476
80 710.2 704.37 0.820895522 685.46 689.74 0.624398214
90 702.69 694.24 1.202521738 673.92 680.37 0.957086895
107 685.53 677.38 1.188861173 658.39 662.35 0.601467215
200 663.83 669.32 0.827018966 636.36 627.19 1.441008234
307 646.48 639.24 1.119910902 613.98 600.24 2.237857911
400 621 612.3 1.400966184 589.37 577 2.098851316
507 597.48 584 2.256142465 572.38 562.32 1.75757364
600 582.39 563.48 3.246965092 553 549.3 0.669077758
707 556.74 558.39 0.296368143 529.63 512.37 3.25887884
800 528.48 517.27 2.121177717 501.29 498.93 0.470785374
907 501.27 493.2 1.609910827 476.35 465.48 2.281935552
1000 478.28 482.37 0.855147612 452.37 461.28 1.969626633
1500 453.26 442.75 2.318757446 417.31 400.34 4.066521291
2000 417.83 395.42 5.363425317 378.49 368 2.771539539
2500 397 382 3.778337531 344.57 332.43 3.523231854
3000 361,67 359,4 0,627643985 312 305,68 2,025641026
500 1000 1500 2000 2500 3000 3500
Shear rate, y (1/s)
=™&=80°C
100°C
Figure 16: Viscosity trend of50ppm solution at80°C and 100 C
using Method 2
28
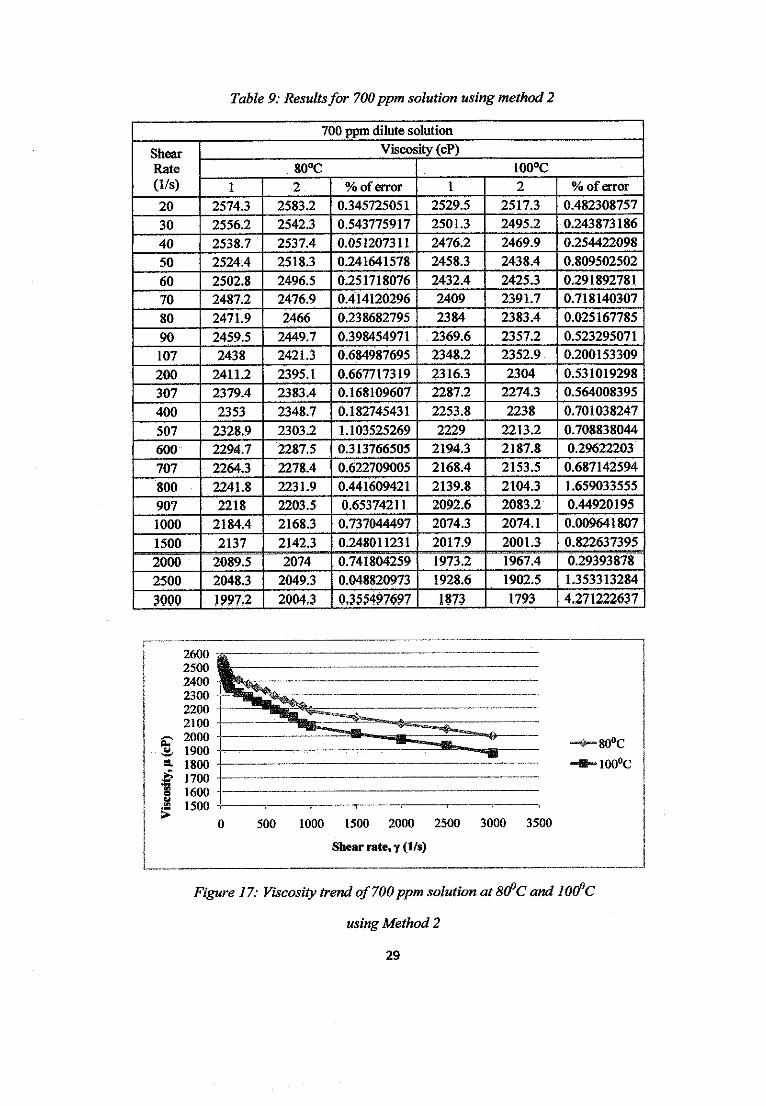
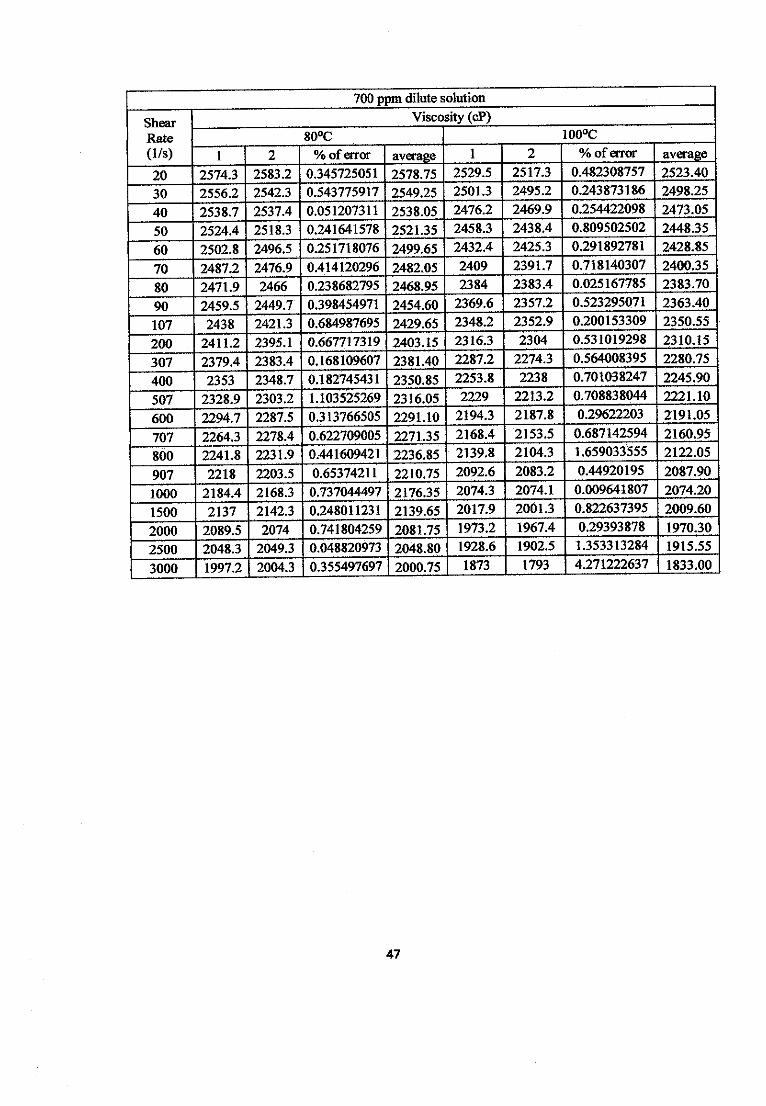
Table 9: Resultsfor 700ppm solution using method 2
700 ppm dilute solution
Shear
Rate
(1/s)
Viscosity (cP)
80°C 100°C
1 2 % of error 1 2 % of error
20 2574.3 2583.2 0.345725051 2529.5 2517.3 0.482308757
30 2556.2 2542.3 0.543775917 2501.3 2495.2 0.243873186
40 2538.7 2537.4 0.051207311 2476.2 2469.9 0.254422098
50 2524.4 2518.3 0.241641578 2458.3 2438.4 0.809502502
60 2502.8 2496.5 0.251718076 2432.4 2425.3 0.291892781
70 2487.2 2476.9 0.414120296 2409 2391.7 0.718140307
80 2471.9 2466 0.238682795 2384 2383.4 0.025167785
90 2459.5 2449.7 0.398454971 2369.6 2357.2 0.523295071
107 2438 2421.3 0.684987695 2348.2 2352.9 0.200153309
200 2411.2 2395.1 0.667717319 2316.3 2304 0.531019298
307 2379.4 2383.4 0.168109607 2287.2 2274.3 0.564008395
400 2353 2348.7 0.182745431 2253.8 2238 0.701038247
507 2328.9 2303.2 1.103525269 2229 2213.2 0.708838044
600 2294.7 2287.5 0.313766505 2194.3 2187.8 0.29622203
707 2264.3 2278.4 0.622709005 2168.4 2153.5 0.687142594
800 2241.8 2231.9 0.441609421 2139.8 2104.3 1.659033555
907 2218 2203.5 0.65374211 2092.6 2083.2 0.44920195
1000 2184.4 2168.3 0.737044497 2074.3 2074.1 0.009641807
1500 2137 2142.3 0.248011231 2017.9 2001.3 0.822637395
2000 2089.5 2074 0.741804259 1973.2 1967.4 0.29393878
2500 2048.3 2049.3 0.048820973 1928.6 1902.5 1.353313284
3000 1997,2 2004,3 0,355497697 1873 1793 4.271222637
2600
2500
2400
2300
2200
2100
2000
1900 11800
1700
1600
1500
0 500 1000 1500 2000 2500 3000 3500
Shear rate, y (1/s)
—^ 80°C
100°C
Figure 17: Viscosity trend of700ppm solution at8CPC and lOCPc
using Method 2
29
Table 3, 4 and 5 are the results obtained from the rheological study conducted using
the first method. On the other hand, Figure 11,12 and 13 are the corresponding plots
of viscosity trend for data in Table 3, 4 and 5. From those data table we can clearly
see that at certain shear rate, the value ofviscosity gained is equal to zero. This is due
to the reason that, the sample placed on the viscometer might be way too dilute or
way too concentrated. This causes the viscosity of that particular sample to be out of
spindle 6 measurable range.
From the plots in Figure 11,12 and 13 we can clearly see that it is not a smooth plot
that we expect to get from the viscosity study. Once it reaches a certain range of
shear rates, in this case 400 (1/s) to 1000 (1/s), the viscosity value tend to fluctuate.
This shows that using a new sample from a same sample bottle for every single shear
rate is not the ideal way ofconducting this experiment.
Although we a using the sample from the same sample bottle, it does not assure us
that the concentration ofpolymer spread throughout the bottle will be the same. Due
to certain parameters it might result in uneven spread ofpolymer concentration in the
sample bottle. For an example, the gravity force. Once we have diluted the master
solution into dilute concentration of 10 ppm to 50 ppm, we will pour it into the
sample bottle and store it for a day to allow hydration to occur. During this particular
period of time, the gravity force plays a role in pulling the polymer down to the
bottom ofthe sample bottle and while conducting the experiment we tend to take the
sample from different location in the sample bottle thus resulting in the fluctuation of
viscosity values.
Another parameter which plays an important role in the fluctuation ofviscosity value
is the gel strength of the long chain polymer. Due to the hydration period of a day,
there is a high possibility for the polymer in the sample bottle to gel up and form a
long chain link with high strength. This particular phenomena has the ability to
suspend the gravitational force and hold its position at any point of location in the
sample bottle, resulting in the polymer to be concentrated at a certain point rather
30
than throughout the sample bottle. That is the reason why I used the second method
to rerun the experiment.
Table 6 to table 9 shows the results of the rheological study conducted using the
second method. Whereas, figure 14 to figure 17 are the corresponding plots of
viscosity trend for data in table 6 to table 9. The second method proves to be a better
way ofconducting the experiment due to the reason that, there are no values spotted
to be out ofthe measurable range by spindle 6. In this particular method we used the
same sample throughout the experiment for a specific temperature.
When we have a look at the viscosity trend of HPAM for the second method of
experiment, it shows a smooth curve rather than a fluctuating curve shown by plots
for the first method. With the increase of shear rate, it shows that the viscosity of
HPAM is reducing. This proves that, at this particular range of shear rates, both
master solution and dilute solutions are exhibiting shear thinning fluid characteristic.
Thus, it proves the statement that HPAM is a Pseudoplatic polymer solution for this
particular range of shear rates. This is due to the reason that the long chain polymer
is being stretched by the rotational speed of the cone. The strength to resist the
stretch is being weakened by the rotating cone which pulls the polymer apart.
The viscosity of the solution decreases as the temperature increases; it is proven
when we compare the value of viscosity between solutions with same concentration
but different temperatures. The reduction in viscosity may be caused by the stretched
polymer chain as the temperature rises. As temperature increases, the polymer chain
will tend to break its stronghold, resulting in less viscous solution.
On the other hand, temperature seems to have a minimal effect on the viscosity ofthe
polymer, as both elevated temperatures show similar reduction trend. This is due to
the strength ofthe long-chain porymerbackbone that resist the polymer stretching to
occur at a given shear rate.
31
Furthermore, the viscosity trend in figure 14 to figure 17 shows that the viscosity of
HPAM does not reduces smoothly but it tend to deviate at certain shear rate. It shows
three different straight lines for three different range of shear rates which are, 20 1/s
to 107 1/s, 107 1/s to 1000 1/s and 1000 1/s to 3000 1/s. Normally, viscosity trend
tend to be a smooth logarithmic line decreasing with increasing shear rate but it is
quite different in this case.
This is due to the impact of both temperature and shear rate. If we see closely, from
20 1/s to 107 1/s the increment ofshear rate is more or less 10 1/s but from 107 1/s to
200 1/s, there is a sudden increase of roughly 100 1/s. The sudden change in the
inertia of the sample and the torque of the rotating cone results in sudden reduction
of viscosity. Plus, with the help of elevated temperature, the polymer solution is
being stretched greatly once there is a sudden change in shear rate increment.
When we compare the viscosity of solutions with different concentrations, it shows
an increment in viscosity as the concentration of the solution increases. Higher
concentration of solution means more solute is in the solution to make the solution
thick. Plus, when we talk about polymer solution it can be stated higher
concentration of polymer solution has a longer chain of polymer or it might have
cross linked chain due to the hydration period and agitation. The strength ofthe long-
chain polymer tends to be higher in solution with higher concentration due to the
more number of solute present in that particular solution. When there is more solute
present in a solution the bond tends to be stronger as the polymer will be linked up
closely to each other.
32
89
1000 2000
shear rate, y
3000 4000
•=«#—800C
•100°C
Log. (80°C)
•Log. (100°C)
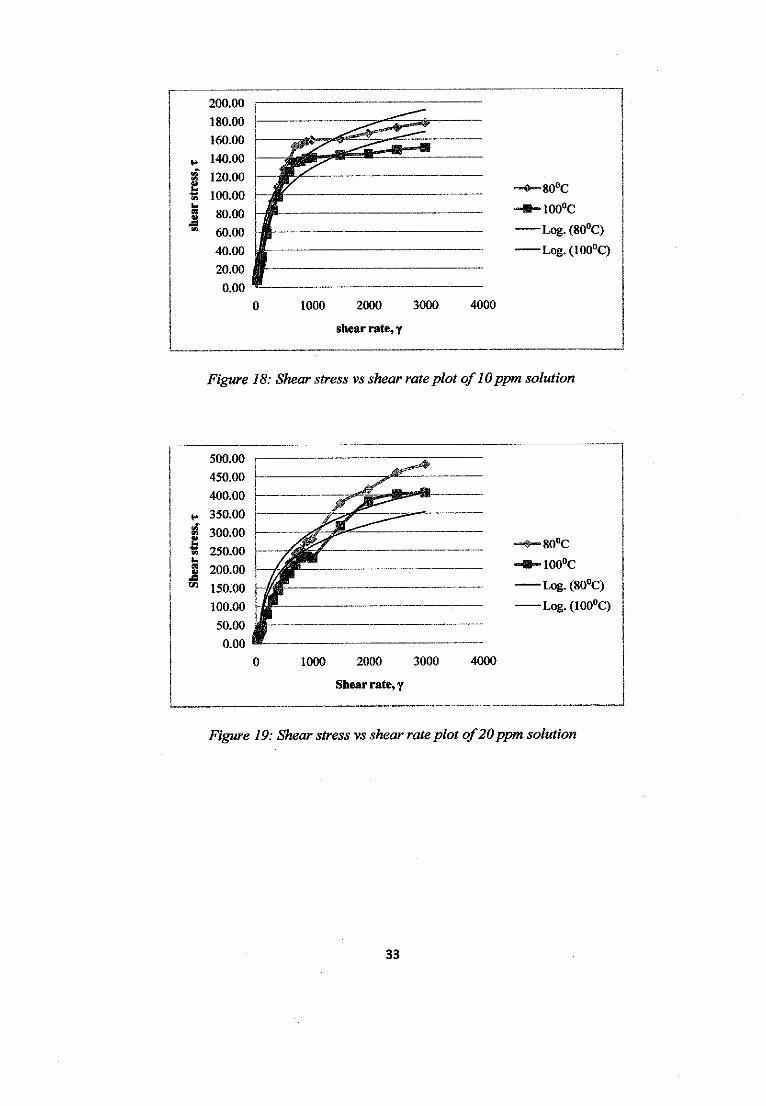
Figure 18: Shearstressvs shearrateplot of10ppmsolution
500.00
450.00
400.00
350.00
300.00
250.00
200.00
150.00
j»—*• —
Shearstres
™~#-~80°C
~B~ 100°C
Log. (80°C)
100.00
50.00 .
0.00 *
f pi Log.(100°C)Mj
() 1000 2000 3000 4000
Shear rate, y
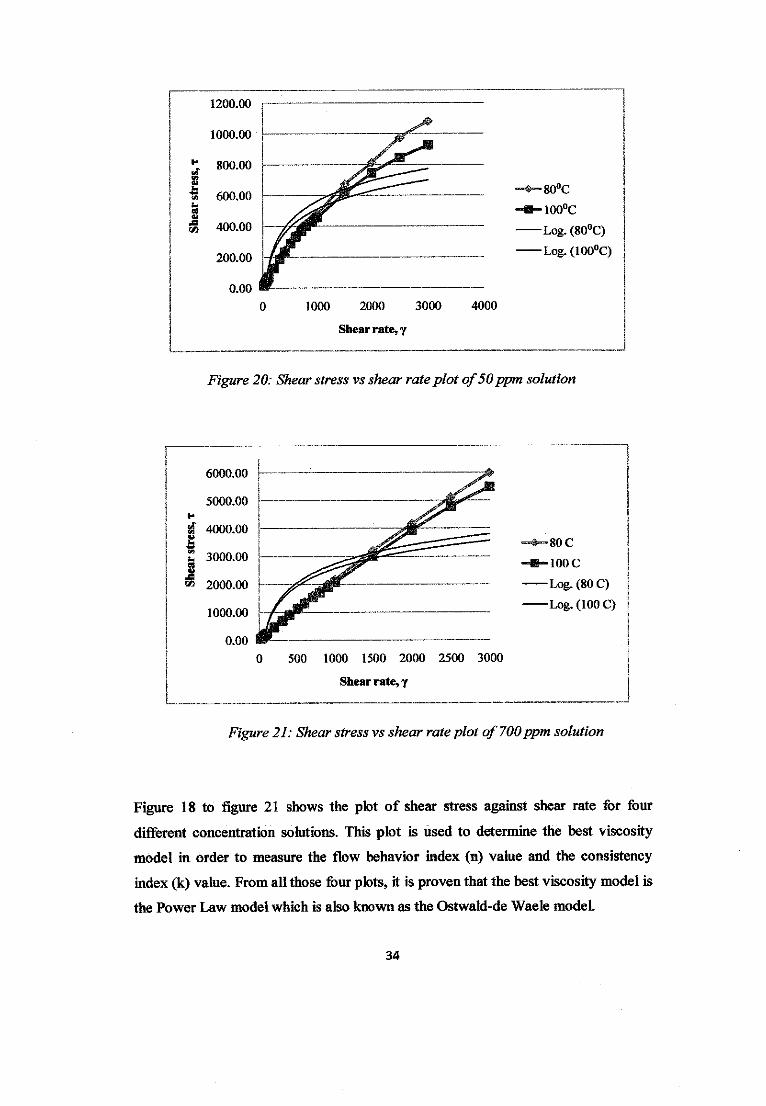
Figure 19: Shearstressvs shearrateplot of20 ppmsolution
33
1200.00
1000.00
1 800.00M(A<U
"S 600.00
«
I 400.00
200.00
0.00
1000 2000 3000
Shearrate, y
4000
™§™80°C
100°C
•Log. (80°C)
•Log.(100°C)
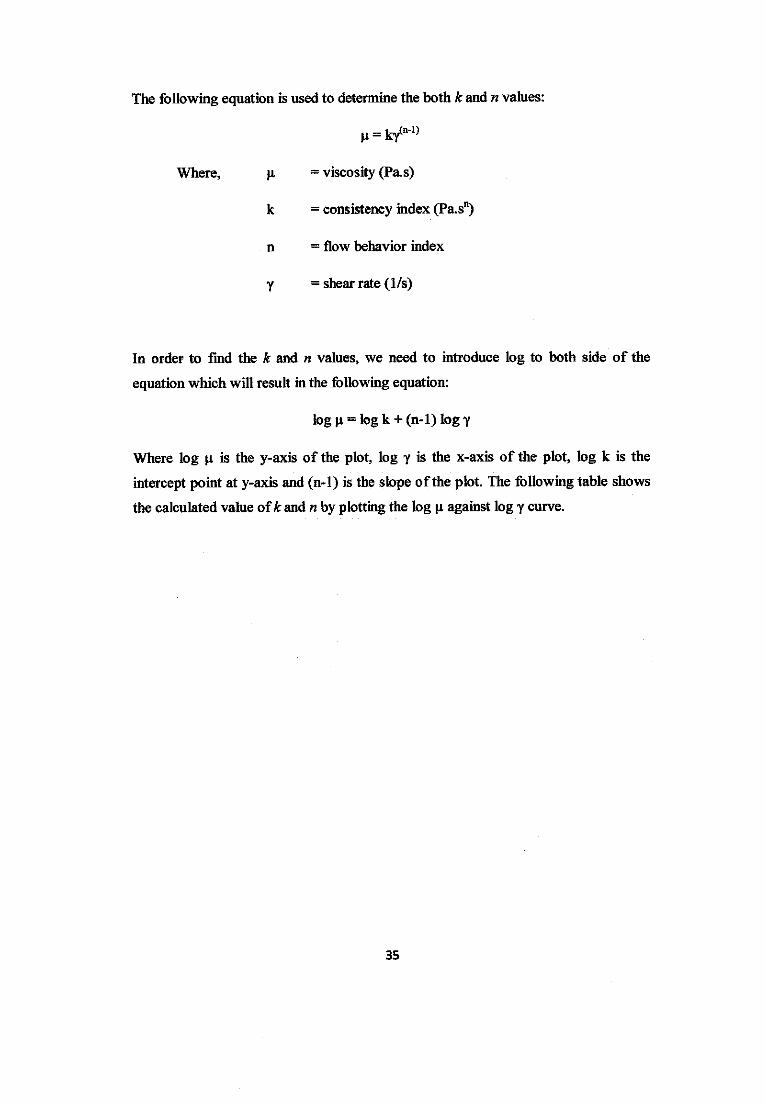
Figure 20: Shearstress vs shear rateplot of50 ppm solution
6000.00
5000.00
gf 4000.00
Z 3000.00
» 2000.00
1000.00
0.00
500 1000 1500 2000 2500 3000
Shear rate, y
""•"^""SO c
100 c
•Log. (80 C)
Log. (100 C)
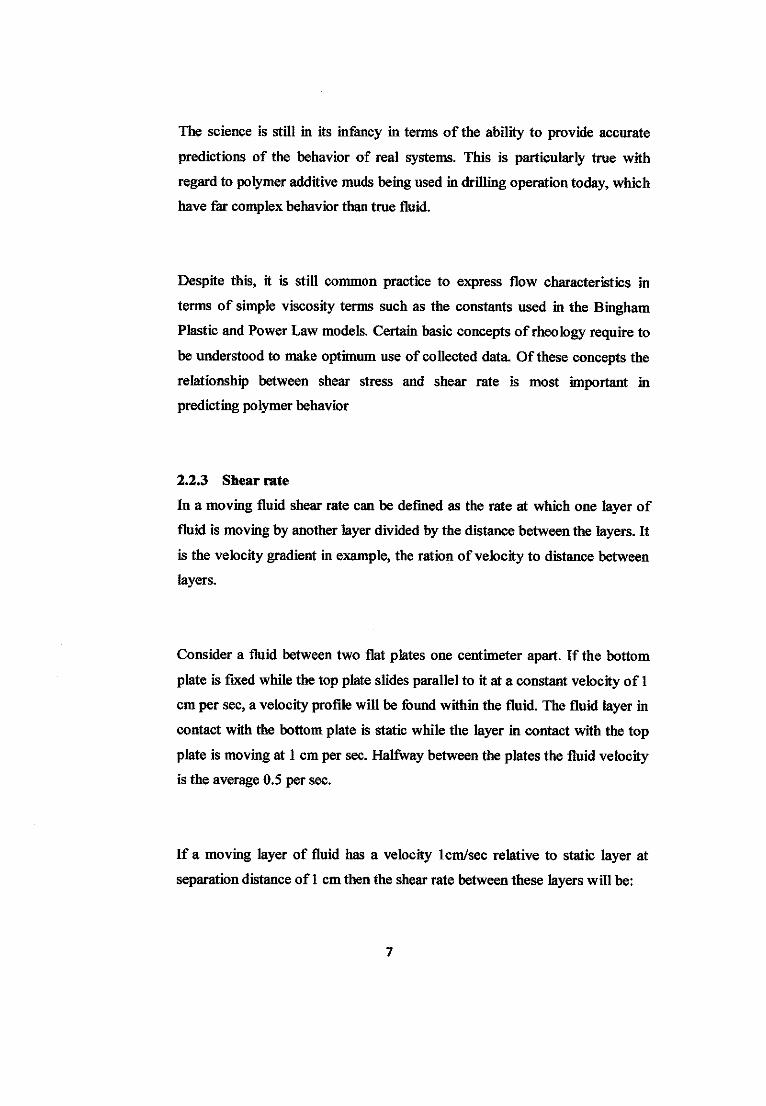
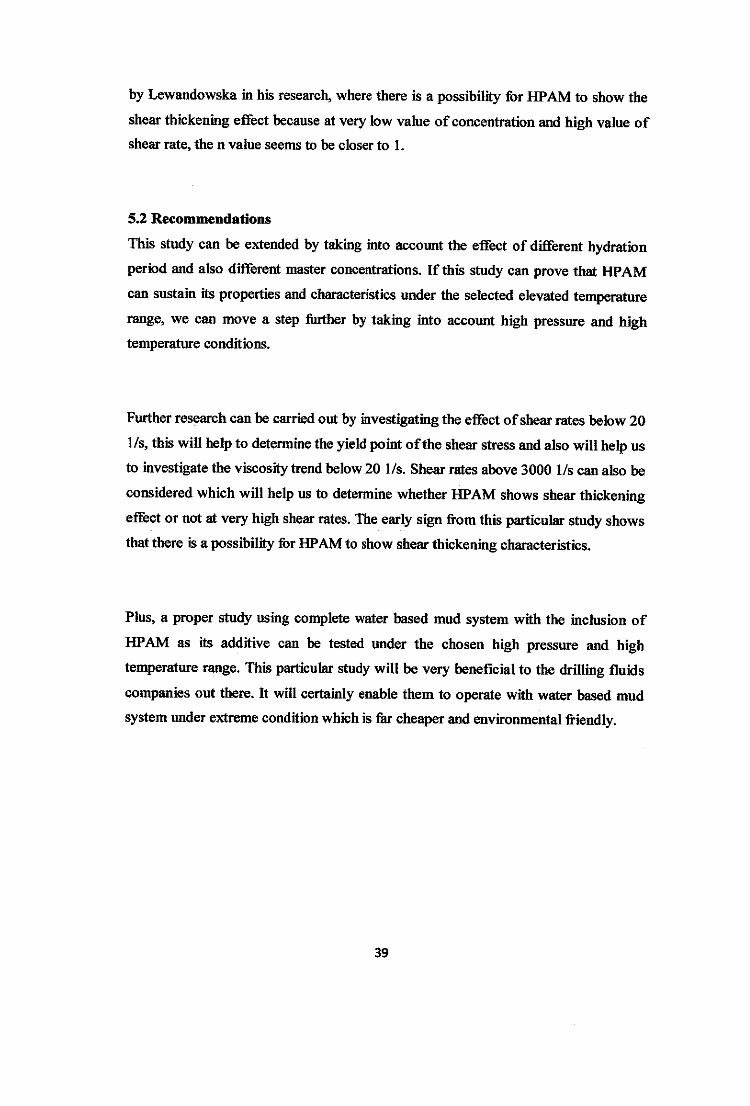
Figure21: Shear stressvs shear rateplot of 700ppmsolution
Figure 18 to figure 21 shows the plot of shear stress against shear rate for four
different concentration solutions. This plot is used to determine the best viscosity
model in order to measure the flow behavior index (n) value and the consistency
index(k) value. From all those four plots, it is proven that the best viscosity model is
the Power Law model which is also known as the Ostwald-de Waele model.
34
The following equation is used to detennine the both k and n values:
H= kr(a-1)
Where, u - viscosity (Pa.s)
k = consistency index (Pa.s")
n = flow behavior index
v = shear rate (1/s)
In order to find the k and n values, we need to introduce log to both side of the
equation which will result in the following equation:
log u - log k + (n-1) log y
Where log u. is the y-axis of the plot, tog y is the x-axis of the plot, log k is the
intercept point at y-axis and (n-1) is the slope ofthe plot. The following table shows
the calculated value ofk and n by plotting the log \i against log y curve.
35

Table 10: Theflow behaviorindex (n) and the consistency index (k) valuesforvarious ranges ofshear rates.
Polymer Concentration Temperature Range of shear rate (1/s) n k(Pa,s)
Hf^AMlOppm
80°C
20 -107 0.8513 0.6965
107 -1000 0.656 1.9706
1000-3000 0.1034 76.754
100°C
20-107 0.8349 0.6861
107 -1000 0.6465 1.8685
1000-3000 0.065 89.04
HPAM 20ppm
80°C
20-107 0.8754 0.814
107 -1000 0.8028 1.2089
1000 - 3000 0.4838 10.37
100°C
20 -107 0.8561 0.8251
107 -1000 0.7633 1.374
1000 - 3000 0.5304 6.269
HPAMSOdpm
80°C
20-107 0.9138 1.0323
107 -1000 0.8431 1.515
1000-3000 0.7413 2.9094
100°C
20 -107 0.9187 0.9802
107 -1000 0.8379 1.4887
1000-3000 0.6486 5.2674
__ HPA^j170Qppm ;_ _
80°C
20 -107 0.9652 2.8747
107-1000 0.9516 3.101
1000-3000 0.924 3.702
100°C
20 -107 0.9551 2.906
107 -1000 0.9432 3.1203
1000 - 3000 0.8951 4.3152
From the table above, we can clearly see that all the flow behavior (n) index values
are below 1, which brings to a conclusion that HPAM still behaves as a non-
Newtonian fluid although the temperature has been elevated. If we compare the w
value of 10ppmsolution with20 ppm solution at 80°C, we cansee the increment of
value due to the increase in concentration ofthe solution.
Furthermore, highly concentrated solution tend to have higher value of » which
shows that there is a possibility for the « value to cross the shear thinning region (a
36

fluid is categorized as shear thinning fluid if the n < 1, when n > 1, the fluid shows
shear thickening behavior)
On the other hand, results in table 10 shows that with increasing value ofshear rate,
the n value tend to decrease. This is due to the effect of rotational speed on the
polymer solution which stretches the long-chain porymer to make it easier to flow.
37

CHAPTER 5: CONCLUSION & RECOMMENDATION
5.1 Conclusion
In this project there are six parameters which will be tested in the experimental work
namely, pressure, temperature, master concentration, dilute concentration, shear rate
and hydration period. It is decided that three of the parameters which are hydration
period, pressure and master concentration will remain constant throughout the
experiment. Whereas, the other three parameters will be varied to understand the
viscosity behavior of HPAM under elevated temperature and normal pressure
condition.
From the experiment which has been carried, it can be concluded that the main
objective ofthis study which is to investigate the effect oftemperature and shear rate
on the HPAM solution has been achieved. From the data gained it is proven that
temperature gives minimal effect on the viscosity trend of HPAM solution, this is
due to the reason that the viscosity trend for both 80°C and 100°C seems to be
decreasing in the same manner. On the other hand, the comparison between both
temperatures for a certain concentration of solution for an example SO ppm solution
shows that, 100°C gives a lesser viscosity value than80°C.
The viscosity trend also proves that increment in shear rate results in decrease in
viscosity value. Increasing the shear rate makes the polymer solution to be stretched.
This particular point proves that the HPAM solution still exhibits Non-Newtonian
fluid properties under elevated temperature condition.
Furthermore, the calculation of flow behavior index (n) value shows that partially
hydrolyzed polyacrylamide is a shear thinning polymer solution within the tested
range of shear rate. This is due to the reason that the n value is below 1 which shows
that it is still in the shear thinning region. This study also proves the statement made
38
by Lewandowska in his research, where there is a possibility for HPAM to show the
shear thickening effect because at very lowvalue of concentration and high value of
shear rate, the n value seems to be closer to 1.
5.2 Recommendations
This study can be extended by taking into account the effect of different hydration
period and also different master concentrations. If this study can prove that HPAM
can sustain its properties and characteristics under the selected elevated temperature
range, we can move a step further by taking into account high pressure and high
temperature conditions.
Further research can be carried out by investigating the effect ofshear rates below 20
1/s, this will help to determine the yield point ofthe shear stress andalso willhelp us
to investigate the viscosity trend below 20 1/s. Shear rates above 3000 1/s can also be
considered which will help us to determine whether HPAM shows shear thickening
effect or not at very high shear rates. The earlysignfrom this particular study shows
that there is a possibilityfor HPAM to showshear thickeningcharacteristics.
Phis, a proper study using complete water based mud system with the inclusion of
HPAM as its additive can be tested under the chosen high pressure and high
temperature range. This particular study will be very beneficial to the drilling fluids
companies out there. It will certainly enable them to operate with water based mud
system under extreme condition which is farcheaper andenvironmental friendly.
39

REFERENCE
Carreau, P. J., De Kee, D. C, & Chhabra, R. P. (1997). Rheology of Polymeric
Systems: Principles andApplications. New York: Hanser Publishers.
Joachim Klein, C. K.-D. (1980). Characterisation of Poly(acrylamide) in Solution.
Macromol. Chem., 227 - 240.
Kulicke, W. M., Kniewske, R., & Klein, J. (1982). Preparation, Charaterization,
Solution Properties and Rheological Behavior of Polyacrylamide. Prog.
Polymer Science, Vol. 8, 373 -468.
Lewandowska, K. (2006). Comparative Studies of Rheological Properties of
Polyacrylamide and Partially Hydrolyzed Polyacrylamide Solutions. Wiley
InterScience, 1.
Macosko, C. W. (1994). Rheology Principles, Measurements, andApplications. New
York: Wiley-VCH, Inc.
Munk, P., Aminabhavi, T. M., Williams, P., & hoffman, D. E. (1980). Some Solution
Properties ofPolyacrylamide. Macromolecules, 871 - 875.
Styles, S., Meads, K., Bonsack, M., Singh, A., & Schlemmer, R. (2006). KMC
Oiltools DrillingFluidManual Kuala Lumpur.
Yang, M.-H., & Yen, H.-Y. (2003). The Effect of Metal Ion Additive on the
Rheological Behavior of Polyacrylamide Solution. Polymer Testing22 , 389 -
393.
Zeynali, M. E., Rabii, A., & Baharvand, H. (2004). Synthesis ofPartially Hydrolyzed
Polyacrylamide and Investigation of Solution Properties (Viscosity Behavior).
Iranian PolymerJournal, 479 - 484.
Zhang, Y., Gao, P., Chen, M., & Huang, G. (2008). Rheological Behavior of
Partially Hydrolyzed Polyacrylamide Hydrogel Produced by Chemical
Gelation. JournalofMacromolecular Science, Part B: Physics, 26 - 38.
40

APPENDICES
Data tables using Method 1 of riieoiogy testing
10 ppm dilute solution
Shear
Rate
(1/s)
Viscosity (cP)
80°C 100°C
1 2 % oferror average 1 2 % of error average
107 4921.8 4931 0.186923483 4926.40 4587.2 4612 0.54063481 4599.6
200 0 0 - 0.00 782.4 804 2.760736196 793.2
307 4 7 75 5.50 0 0 - 0
400 44.1 53.2 20.63492063 48.65 78.3 82.3 5.108556833 80.3
507 0 0 - 0.00 425.7 423.5 0.516795866 424.6
600 542.6 539,6 0.552893476 541.10 257.4 248 3.651903652 252.7
707 78 85 8.974358974 81.50 459.9 460 0.021743857 459.95
800 324.5 320 1.386748844 322.25 338.2 344 1.714961561 341.1
907 243 248.3 2.181069959 245.65 287.3 278.54 3.049077619 282.92
1000 87 90 3.448275862 88.50 0 0 - 0
2000 0 0 - . 0.00 887.5 880.2 0.822535211 883.85
3000 54 55 1.851851852 54.50 89.4 90 0.67114094 89.7
20 pjjm dilute solution
Shear
Rate
(1/s)
Viscosity(cP)
80°C 100°C
1 2 % of error average 1 2 % of error average
107 3672.5 3679.4 0.187882914 3675.95 3275.4 3308 0.995298284 3291.7
200 787.6 792 0.558659218 789.80 1905 1840 3.412073491 1872.5
307 492.5 490.2 0.467005076 491.35 598.3 602 0.618418853 600.15
400 448.4 450.2 0.401427297 449.30 476 488 2.521008403 482
507 256.82 255 0.708667549 255.91 372.5 383.2 2.872483221 377.85
600 482.7 440.5 8.74249016 461.60 886.7 869.2 1.973610015 877.95
707 376.2 382.5 1.674641148 379.35 0 0 - 0
800 320 307 4.0625 313.50 287 278 3.135888502 282.5
907 778 773 0.642673522 775.50 398.6 386 3.161063723 392.3
1000 649.2 650.4 0.184842884 649.80 287.3 288.5 0.417681866 287.9
2000 87.2 82.3 5.619266055 84.75 189.2 201 6.236786469 195.1
3000 43 45 4.651162791 44.00 105.2 100.4 4.562737643 102.8
41
30 ppm dilute solution
Shear
Rate
(1/s)
Viscosity (cP)
80°C 100°C
1 2 % of error average 1 2 % oferror average
107 4875.4 4902 0.545596259 4888.70 4285.5 4312 0.618364252 4298.75
200 2385 2386 0.041928721 2385.50 1965 1899 3.358778626 1932
307 1858 1845 0.699677072 1851.50 982.5 978.3 0.427480916 980.4
400 859.2 860.5 0.151303538 859.85 764.8 765 0.026150628 764.9
507 674.5 660.5 2.075611564 667.50 572.9 568.2 0.820387502 570.55
600 498.4 500.6 0.44141252 499.50 0 0 - 0
707 842.6 840 0.308568716 841.30 765.2 746.5 2.443805541 755.85
800 0 0 - 0.00 592.3 600.3 1.350666892 596.3
907 504 500.2 0.753968254 502.10 0 0 - 0
1000 209.5 210.5 0.477326969 210.00 165 147.8 10.42424242 156.4
2000 184.5 176 4.60704607 180.25 90 89 1.111111111 89.5
3000 56 50 10.71428571 53.00 74.2 75.2 1.347708895 74.7
40 ppm dilute solution
Shear
Rate
(1/s)
Viscosity (cP)
80°C 100°C
1 2 % oferror average 1 2 % of error average
107 5264.6 5275.2 0.201344832 5269.90 4982.4 4943 0.790783558 4962.7
200 3827 3875 1.254246146 3851.00 3398 3389 0.264861683 3393.5
307 1759.4 1762 0.147777651 1760.70 1683 1712.5 1.752822341 1697.75
400 854.7 887.5 3.837603838 871.10 715.8 723.4 1.061749092 719.6
507 694.1 700.2 0.878835903 697.15 582 602.4 3.505154639 592.2
600 551.4 548.4 0.544069641 549.90 448.9 450.6 0.378703497 449.75
707 0 0 _ 0.00 852.8 843 1.149155722 847.9
800 782.4 767.5 1.904396728 774.95 0 0 - 0
907 401.2 387.2 3.489531406 394.20 421.7 432.5 2.561062367 427.1
1000 382.4 367.5 3.896443515 374.95 189 178 5.82010582 183.5
2000 189 178 5.82010582 183.50 109.5 90.5 17.35159817 100
3000 75 65 13.33333333 70.00 87 78.5 9.770114943 82.75
42
50 ppm dilute solution
Shear
Rate
(1/s)
Viscosity (cP)
80°C 100°C
1 2 % oferror average 1 2 % of error average
107 5743.5 5729.2 0.248977105 5736.35 5382 5345 0.687476774 5363.5
200 4872.8 4776 1.986537514 4824.40 4234.5 4237 0.059038848 4235.75
307 2859.4 2756.9 3.584668112 2808.15 2653.6 2651 0.097980103 2652.3
400 1475.2 1654 12.12039046 1564.60 1213.7 1235 1.754964159 1224.35
507 952 987.5 3.728991597 969.75 872.4 867.7 0.538743696 870.05
600 782.4 778.4 0.511247444 780.40 704.5 717.2 1.802696948 710.85
707 695 713 2.589928058 704.00 0 0 - 0
800 502 512.2 2.03187251 507.10 745.3 752.3 0.939219106 748.8
907 449.5 450 0.111234705 449.75 659.7 660 0.045475216 659.85
1000 285.4 287.3 0.665732306 286.35 209 218,5 4.545454545 213.75
2000 100.5 98.5 1.990049751 99.50 87 89 2.298850575 88
3000 67 79 17.91044776 73.00 46.8 47.2 0.854700855 47
43
Data tables using Method 2 of rheology testing
10 ppm dilute solution
Shear
Rate
(1/s)
Viscosity (cP)
80°C 100°C
1 2 % oferror average 1 2 % oferror average
20 437.57 441.2 0.829581553 439.39 411.26 400.28 2.669843894 405.77
30 426.37 416.4 2.33834463 421.39 398.63 389.23 2.358076412 393.93
40 410 408.48 0.370731707 409.24 387 379.57 1.919896641 383.285
50 386.25 392.49 1.615533981 389.37 368.33 357 3.076045937 362.665
60 378.4 384.39 1.582980973 381.40 354.69 350.3 1.237700527 352.495
70 368.3 372.36 1.102362205 370.33 347 343.58 0.985590778 345.29
80 363.8 368.29 1.234194612 366.05 338.52 330.2 2.457757296 334.36
90 356.83 352.47 1.221870358 354.65 329.4 312 5.282331512 320.7
107 347.7 338.41 2.671843543 343.06 315.63 304.48 3.532617305 310.055
200 329 321.3 2.340425532 325.15 296.54 284.5 4.060160518 290.52
307 307.94 300.18 2.519971423 304.06 279.14 266.17 4.646413986 272.655
400 274.3 270.28 1.465548669 272.29 251.3 239.64 4.639872662 245.47
507 248.69 256.42 3.108287426 252.56 233.1 226.49 2.835692836 229.795
600 231 226.4 1.991341991 228.70 215.75 200.58 7.031286211 208.165
707 218.59 213.72 2.227915275 216.16 197.4 184.39 6.590678825 190.895
800 195 191.57 1.758974359 193.29 173.57 167.3 3.61237541 170.435
907 178.43 170.17 4.629266379 174.30 152.4 155.29 1.896325459 153.845
1000 157.21 161.28 2.588893836 159.25 139.29 141.32 1.457391055 140.305
1500 118.5 95.48 19.42616034 106.99 98.17 92.19 6.091473974 95.18
2000 84.3 82.23 2.455516014 83.27 71.27 73.19 2.693980637 72.23
2500 68.11 70.18 3.039201292 69.15 58.16 60.63 4.246905089 59.395
3000 60.12 58.37 2.910844977 59.25 49.18 51.29 4.290361936 50.235
44
20ppm dilute solution
Shear
Rate
(1/s)
Viscosity (cP)
80°C 100°C
1 2 % of error average 1 2 % of error average
20 548.35 553.28 0.899060819 550.82 522.48 521.47 0.193308835 521.98
30 534.75 539.31 0.852734923 537.03 514.2 500.24 2.714896927 507.22
40 521.84 511.53 1.975701364 516.69 495.25 487.39 1.587077234 491.32
50 507 500.48 1.285996055 503.74 481.97 477 1.031184514 479.49
60 494.59 489.3 1.069572777 491.95 467.38 465.28 0.449313193 466.33
70 487.13 478.38 1.796235091 482.76 455.31 448.36 1.52643254 451.84
80 475.38 476.42 0.218772351 475.90 441 435.35 1.281179138 438.18
90 463.17 459.85 0.716799447 461.51 427.96 432.2 0.990746799 430.08
107 450.28 442 1.838855823 446.14 412.48 404.31 1.980702095 408.40
200 437 423.73 3.036613272 430.37 399.89 387.47 3.10585411 393.68
307 413.74 394.29 4.701019964 404.02 382 379.12 0.753926702 380.56
400 395.84 384.3 2.915319321 390.07 360.96 355.48 1.518173759 358.22
507 377.54 366.48 2.929490915 372.01 342.58 338 1.336914005 340.29
600 359.63 362.3 0.742429719 360.97 319.93 308.4 3.603913356 314.17
707 346.65 338.59 2.325111784 342.62 301.28 297.15 1.370817844 299.22
800 324.47 312 3.843190434 318.24 284.27 292.58 2.923277166 288.43
907 307 297.4 3.127035831 302.20 263.71 254.38 3.537977324 259.05
1000 286.69 276.38 3.596218912 281.54 237.5 223.3 5.978947368 230.40
1500 249.78 253.49 1.48530707 251.64 215.84 207.2 4.002965159 211.52
2000 214 201.4 5.887850467 207.70 193.29 189.47 1.976305034 191.38
2500 189.74 178.3 6.029303257 184.02 167.75 154 8.196721311 160.88
3000 162.58 159 2.201992865 160.79 143.53 127 11.51675608 135.27
45
50 ppm dilute solution
Shear
Rate
(1/s)
Viscosity (cP)80°C 100°C
1 2 % oferror average 1 2 % oferror average
20 783.28 794.65 1.451588193 788.97 758.37 763.28 0.647441223 760.8330 767.84 773 0.672015003 770.42 743.29 739.27 0.540838704 741.28
40 758.39 752.34 0.797742586 755.37 730.16 730.39 0.031499945 730.28
50 743.86 739.49 0.587476138 741.68 716.38 722.3 0.826377062 719.34
60 736.49 728.47 1.088948933 732.48 705.47 713 1.067373524 709.24
70 723.48 714 1.310333389 718.74 693 703.23 1.476190476 698.12
80 710.2 704.37 0.820895522 707.29 685.46 689.74 0.624398214 687.60
90 702.69 694.24 1.202521738 698.47 673.92 680.37 0.957086895 677.15
107 685.53 677.38 1.188861173 681.46 658.39 662.35 0.601467215 660.37
200 663.83 669.32 0.827018966 666.58 636.36 627.19 1.441008234 631.78
307 646.48 639.24 1.119910902 642.86 613.98 600.24 2.237857911 607.11
400 621 612.3 1.400966184 616.65 589.37 577 2.098851316 583.19
507 597.48 584 2.256142465 590.74 572.38 562.32 1.75757364 567.35
600 582.39 563.48 3.246965092 572.94 553 549.3 0.669077758 551.15
707 556.74 558.39 0.296368143 557.57 529.63 512.37 3.25887884 521.00
800 528.48 517.27 2.121177717 522.88 501.29 498.93 0.470785374 500.11
907 501.27 493.2 1.609910827 497.24 476.35 465.48 2.281935552 470.92
1000 478.28 482.37 0.855147612 480.33 452.37 461.28 1.969626633 456.83
1500 453.26 442.75 2.318757446 448.01 417.31 400.34 4.066521291 408.83
2000 417.83 395.42 5.363425317 406.63 378.49 368 2.771539539 373.25
2500 397 382 3.778337531 389.50 344.57 332.43 3.523231854 338.50
3000 361.67 359.4 0.627643985 360.54 312 305.68 2.025641026 308.84
46
700 ppm dilute solution
Shear
Rate
(1/s)
Viscosity (cP)
80°C 100°C
1 2 % of error average 1 2 % of error average
20 2574.3 2583.2 0.345725051 2578.75 2529.5 2517.3 0.482308757 2523.40
30 2556.2 2542.3 0.543775917 2549.25 2501.3 2495.2 0.243873186 2498.25
40 2538.7 2537.4 0.051207311 2538.05 2476.2 2469.9 0.254422098 2473.05
50 2524.4 2518.3 0.241641578 2521.35 2458.3 2438.4 0.809502502 2448.35
60 2502.8 2496.5 0.251718076 2499.65 2432.4 2425.3 0.291892781 2428.85
70 2487.2 2476.9 0.414120296 2482.05 2409 2391.7 0.718140307 2400.35
80 2471.9 2466 0.238682795 2468.95 2384 2383.4 0.025167785 2383.70
90 2459.5 2449.7 0.398454971 2454.60 2369.6 2357.2 0.523295071 2363.40
107 2438 2421.3 0.684987695 2429.65 2348.2 2352.9 0.200153309 2350.55
200 2411.2 2395.1 0.667717319 2403.15 2316.3 2304 0.531019298 2310.15
307 2379.4 2383.4 0.168109607 2381.40 2287.2 2274.3 0.564008395 2280.75
400 2353 2348.7 0.182745431 2350.85 2253.8 2238 0.701038247 2245.90
507 2328.9 2303.2 1.103525269 2316.05 2229 2213.2 0.708838044 2221.10
600 2294.7 2287.5 0.313766505 2291.10 2194.3 2187.8 0.29622203 2191.05
707 2264.3 2278.4 0.622709005 2271.35 2168.4 2153.5 0.687142594 2160.95
800 2241.8 2231.9 0.441609421 2236.85 2139.8 2104.3 1.659033555 2122.05
907 2218 2203.5 0.65374211 2210.75 2092.6 2083.2 0.44920195 2087.90
1000 2184.4 2168.3 0.737044497 2176.35 2074.3 2074.1 0.009641807 2074.20
1500 2137 2142.3 0.248011231 2139.65 2017.9 2001.3 0.822637395 2009.60
2000 2089.5 2074 0.741804259 2081.75 1973.2 1967.4 0.29393878 1970.30
2500 2048.3 2049.3 0.048820973 2048.80 1928.6 1902.5 1.353313284 1915.55
3000 1997.2 2004.3 0.355497697 2000.75 1873 1793 4.271222637 1833.00
47