Study of the Rheological Behavior of the Phosphate- Water ...
9
International Journal of Mechanical & Mechatronics Engineering IJMME-IJENS Vol:18 No:04 73 182304-5959-IJMME-IJENS © August 2018 IJENS I J E N S Abstract—The rheological behavior of the phosphate-water slurry depends on several parameters, the density of the slurry, the concentration of solids, the particle size distribution, temperature…The rheological behavior of the slurry was studied using a rotary viscometer (Anton-Paar). The phosphate slurry consists of solid phosphate and water. We conducted experiments on a solids mass concentration range of (φ = 34.24% at φ = 57.27%) in the shear rate range (1 to 1000 s -1 ). we have noticed that the phosphate slurry changes its pseudoplastic behavior towards a Bingham behavior from the 46.03% concentration, and changes its Bingham behavior towards a dilatant behavior from the concentration 38.45%. Models of rheological description are numerous, we were interested in this study to four models (Casson, Bingham, Ostwald-Pawer Law, and Herschel-Buckley), Model enables us to adjust and predict the apparent viscosity and yield stress of phosphate-water slurry, and will also allow us to predict dynamic motion of the slurry and understand mechanisms for characteristic rheological behaviors. Index Term— phosphate-water slurry, solids concentration, particle size distribution, temperature, viscosity, yield stress, rheological Models. . I. INTRODUCTION The mode of transportation of phosphate water slurry from Khouribga (Morocco) to Jorf-Lasfar (Morocco) via pipeline falls within the framework of the strategic axes of the OCP group, which aims to optimize transport costs and increase production capacity. This mode of slurry transport essentially depends on the following two constraints: The geographic profile of the route (Khouribga- Jorf Lasfar), and the physical properties of the phosphate slurry. The "Slurry pipeline" project consists of a main line of 187 km in length and 90 cm in diameter, linking the pumping station (Khouribga) to the terminal station (Jorf-Lasfar), and 4 secondary pipelines feeding the head station in slurry from phosphate laundries [1]-[3]. In this study, the phosphate slurry behaves like a pseudoplastic fluid characterized by its density and its viscosity, the flow regime of the slurry is always turbulent to avoid the sedimentation of solid aggregates down the driving. This new pipeline phosphate transport technology requires a thorough study of the flow of the phosphate slurry, in order to H. Belbsir, Hassan I University, Khouribga Polydisciplinary Faculty, Laboratory of Nanosciences and Modeling, Khouribga, Morocco (e-mail: [email protected]). K. El-Hami, Hassan I University, Khouribga Polydisciplinary Faculty, Laboratory of Nanosciences and Modeling, Khouribga, Morocco (e-mail: [email protected]). A. Soufi , Hassan 1 University , ENSA Khouribga, Laboratory of Nanosciences and Modeling, Khouribga, Morocco (e-mail: [email protected]). extract a maximum of rheological information on the one hand, and to confirm some information’s on the other hand. Rheology plays an essential role in the design procedures of the slurry transport system, in general, the rheology of the suspensions is based on the measurement of the shear stress as a function of the shear rate. The relationship between shear stress and shear rate during a single shear defines the rheological behavior of a given fluid, because ‘any mechanical system obeys a fundamental equation that establishes a relationship between dynamic quantities responsible for the movement and the kinematic quantities describing this movement’ [4]. This mathematical relation describing the flow of a fluid, expresses the law of behavior of the material. Based on fluid behavior, two large groups were identified. These are Newtonian fluids and non-Newtonian fluids. The mathematical models of rheological description of which we have an interest in this study are the models, Casson, Bingham, Ostwald-Pawer Law and Herschel-Buckley. The different physical and chemical properties of slurry have important influences on the rheology of the suspension, because of a change or a modification of the surface property [5], these properties are: the particle size distribution, temperature, the concentration in solids, shear rates, etc. The study of the rheological behavior of phosphate water slurry indicated pseudoplastic behavior at high concentrations. In the preparation of phosphate slurry it is required that the solid phosphate concentration should be in the range recommended by the pipeline designer (50% at 60% in solids), but the viscosity should be minimal to facilitate the storage and transport of slurry via pipeline. But the stability of the phosphate slurry becomes mediocre if the viscosity is reduced and the viscosity of the slurry increases with the concentration of the solid grains in the suspension [6]-[9]. In this paper, we studied the rheological behavior of the phosphate-water slurry, and the effect of the variation of the solids mass concentration, the particle size distribution, and the temperature on the rheological behavior of the slurry. And we will carry out a modeling of the rheological behavior of the phosphate slurry, we will search between the 4 models (Casson, Bingham, Ostwald-Pawer Law and Herschel- Buckley), the most suitable model for the description of the rheological behavior of the phosphate slurry at each index of concentration, we seek the mathematical model having the curve which passes by the maximum of the experimental points. Adjusting the mathematical models of rheology to experimental data allows us to calculate and predict the values of viscosity and yield stress. Hamza BELBSIR, Khalil EL-HAMI, Aziz SOUFI Study of the Rheological Behavior of the Phosphate- Water Slurry and Search for a Suitable Model to Describe its Rheological Behavior
Transcript of Study of the Rheological Behavior of the Phosphate- Water ...

International Journal of Mechanical & Mechatronics Engineering IJMME-IJENS Vol:18 No:04 73
182304-5959-IJMME-IJENS © August 2018 IJENS I J E N S
Abstract—The rheological behavior of the phosphate-water
slurry depends on several parameters, the density of the slurry,
the concentration of solids, the particle size distribution,
temperature…The rheological behavior of the slurry was studied
using a rotary viscometer (Anton-Paar). The phosphate slurry
consists of solid phosphate and water. We conducted experiments
on a solids mass concentration range of (φ = 34.24% at
φ = 57.27%) in the shear rate range (1 to 1000 s-1). we have
noticed that the phosphate slurry changes its pseudoplastic
behavior towards a Bingham behavior from the 46.03%
concentration, and changes its Bingham behavior towards a
dilatant behavior from the concentration 38.45%. Models of
rheological description are numerous, we were interested in this
study to four models (Casson, Bingham, Ostwald-Pawer Law,
and Herschel-Buckley), Model enables us to adjust and predict
the apparent viscosity and yield stress of phosphate-water slurry,
and will also allow us to predict dynamic motion of the slurry
and understand mechanisms for characteristic rheological
behaviors.
Index Term— phosphate-water slurry, solids concentration,
particle size distribution, temperature, viscosity, yield stress,
rheological Models. .
I. INTRODUCTION
The mode of transportation of phosphate water slurry from
Khouribga (Morocco) to Jorf-Lasfar (Morocco) via pipeline
falls within the framework of the strategic axes of the OCP
group, which aims to optimize transport costs and increase
production capacity. This mode of slurry transport essentially
depends on the following two constraints: The geographic
profile of the route (Khouribga- Jorf Lasfar), and the physical
properties of the phosphate slurry. The "Slurry pipeline"
project consists of a main line of 187 km in length and 90 cm
in diameter, linking the pumping station (Khouribga) to the
terminal station (Jorf-Lasfar), and 4 secondary pipelines
feeding the head station in slurry from phosphate laundries
[1]-[3]. In this study, the phosphate slurry behaves like a
pseudoplastic fluid characterized by its density and its
viscosity, the flow regime of the slurry is always turbulent to
avoid the sedimentation of solid aggregates down the driving.
This new pipeline phosphate transport technology requires a
thorough study of the flow of the phosphate slurry, in order to
H. Belbsir, Hassan I University, Khouribga Polydisciplinary Faculty,
Laboratory of Nanosciences and Modeling, Khouribga, Morocco (e-mail: [email protected]).
K. El-Hami, Hassan I University, Khouribga Polydisciplinary Faculty,
Laboratory of Nanosciences and Modeling, Khouribga, Morocco (e-mail: [email protected]).
A. Soufi , Hassan 1 University , ENSA Khouribga, Laboratory of
Nanosciences and Modeling, Khouribga, Morocco (e-mail: [email protected]).
extract a maximum of rheological information on the one
hand, and to confirm some information’s on the other hand.
Rheology plays an essential role in the design procedures of
the slurry transport system, in general, the rheology of the
suspensions is based on the measurement of the shear stress as
a function of the shear rate. The relationship between shear
stress and shear rate during a single shear defines the
rheological behavior of a given fluid, because ‘any mechanical
system obeys a fundamental equation that establishes a
relationship between dynamic quantities responsible for the
movement and the kinematic quantities describing this
movement’ [4]. This mathematical relation describing the flow
of a fluid, expresses the law of behavior of the material. Based
on fluid behavior, two large groups were identified. These are
Newtonian fluids and non-Newtonian fluids. The
mathematical models of rheological description of which we
have an interest in this study are the models, Casson,
Bingham, Ostwald-Pawer Law and Herschel-Buckley.
The different physical and chemical properties of slurry have
important influences on the rheology of the suspension,
because of a change or a modification of the surface property
[5], these properties are: the particle size distribution,
temperature, the concentration in solids, shear rates, etc. The
study of the rheological behavior of phosphate water slurry
indicated pseudoplastic behavior at high concentrations. In the
preparation of phosphate slurry it is required that the solid
phosphate concentration should be in the range recommended
by the pipeline designer (50% at 60% in solids), but the
viscosity should be minimal to facilitate the storage and
transport of slurry via pipeline. But the stability of the
phosphate slurry becomes mediocre if the viscosity is reduced
and the viscosity of the slurry increases with the concentration
of the solid grains in the suspension [6]-[9].
In this paper, we studied the rheological behavior of the
phosphate-water slurry, and the effect of the variation of the
solids mass concentration, the particle size distribution, and
the temperature on the rheological behavior of the slurry. And
we will carry out a modeling of the rheological behavior of the
phosphate slurry, we will search between the 4 models
(Casson, Bingham, Ostwald-Pawer Law and Herschel-
Buckley), the most suitable model for the description of the
rheological behavior of the phosphate slurry at each index of
concentration, we seek the mathematical model having the
curve which passes by the maximum of the experimental
points. Adjusting the mathematical models of rheology to
experimental data allows us to calculate and predict the values
of viscosity and yield stress.
Hamza BELBSIR, Khalil EL-HAMI, Aziz SOUFI
Study of the Rheological Behavior of the Phosphate-
Water Slurry and Search for a Suitable Model to
Describe its Rheological Behavior

International Journal of Mechanical & Mechatronics Engineering IJMME-IJENS Vol:18 No:04 74
182304-5959-IJMME-IJENS © August 2018 IJENS I J E N S
II. MATERIALS AND RHEOLOGICAL MEASUREMENTS
The phosphate samples used in this study are taken from
Moroccan phosphate extraction areas (KHOURIBGA region).
These raw samples were washed, mixed with water, and
grinded to give the particle size distribution as shown in
Figure 2. The size distribution of the aggregates of the
phosphate slurry samples was measured in an analyzer
(Master-Sizer 3000), and the density of the samples was
determined with a gravity bottle of 1 liter.
The rheological measurements of the phosphate water slurry
were made through a rotary viscometer (Anton-Paar), which is
connected to a computer. The rotor is screwed onto the spindle
and the sample is poured into the cup. The rheometer also
contains a thermostat that adjusts the temperature of the
sample to make rheological measurements at any desired
temperature. Rotation varies from high to low shear rate. The
rheological measurements were made at room temperature of
25 ° C. The experimental conditions were: Shear rate:
(1 to 1000 s-1), temperature variation: 25 ° C, 35 ° C, 45 ° C,
and 55 ° C, and mass concentrations in solids range from
34.24% to 57.27%. The shear stress - shear rate plots were
obtained from the data acquired by the computer.
III. RESULTS AND DISCUSSIONS
Concentrated phosphate slurries generally have non-
Newtonian behavior (pseudoplastic). The impact of solids
concentration, particle size distribution and temperature on the
rheological properties of the slurry is briefly discussed in the
following paragraphs.
A. The effect of the concentration of solids on the
rheological behavior of phosphate-water slurry
The solids concentration for the viscosity measurement started
from 34.24% by mass. The shear stress and shear rate data
were computed from the chart recorder for mass
concentrations between 34.24% and 57.27%, plotted and
given in the figure 1. We performed this operation on several
samples, they gave the same results, and here we take a
sample between them that is called B1.
Fig.1. Rheology of phosphate slurry at different mass concentrations (sample B1)
The shear thinning behavior can be explained as a disturbance
of the structure of the applied shear suspension. For high shear
rates the fractures predominate the composition of the sample,
therefore the cohesion between the particles becomes low due
to the applied mechanical stress [10], for low shear rates the
suspension structure is close to balance, since the thermal
movement dominates the viscous forces. The influence of the
solid concentration on the rheology of the phosphate slurry is
very remarkable in figure 1; the higher the solids
concentration the higher the viscosity of the slurry increases,
we noticed from figure 1 that with the dilution, the phosphate
slurry starts to change are pseudoplastic behavior towards a
Bingham behavior from the mass concentration 46.03%. This
concentration does not represent a specific point of change in
behavior, but it is a point from which the slurry begins to
change its behavior. It can be noted that for the phosphate
slurry, the mass concentration point 46.03% has a transition
point between pseudoplastic behavior with threshold stress
and linear behavior with threshold stress (Bingham), and the
mass concentration point 38.45% has a transition point
between Bingham behavior and dilatant behavior with
threshold-stress.
0
10
20
30
40
50
60
70
80
0 200 400 600 800 1000 1200
She
ar s
tre
ss, (
Pa)
Shear rate, (S-1 )
57.27 %
54.50 %
52.32 %
50.00%
46.03 %
42.37 %
38.45 %
34.24 %
International Journal of Mechanical & Mechatronics Engineering IJMME-IJENS Vol:18 No:04 75
182304-5959-IJMME-IJENS © August 2018 IJENS I J E N S
B. Effect of particle size distribution
In this part we consider 4 different samples (M), (D), (BA) and (B).
Fig.2. Particle size distribution of phosphate slurry samples.
The rheological profile of the concentrated slurries is strongly
related to the size distribution of the particles [11]. Phosphate
slurry samples becoming thinner with increasing grinding
time. Figure (2) shows the particle size distributions of the 4
suspension samples having different sizes at a fixed
concentration of 50.54%. The viscosity of the slurry at a given
shear rate indicates a higher value for the sample (M). It is
generally noted that a decreasing particle size results in an
increase in suspension viscosity, particularly at low shear rates
(figure 3). In addition, the inter-particle attraction is expected
to become stronger as the particle surface area increases at the
same mass concentration of slurry solids. It can be mentioned
that the fines content (<37 μm) in (M) is higher than that
of (D), (BA) and (B) as indicated in the particle size
distribution diagram (figure 2).
Fig.3. The effect of particles size distributions on the viscosity of the phosphate slurry.
0.00
20.00
40.00
60.00
80.00
100.00
120.00
0 100 200 300 400 500 600
Cu
mu
lati
ve %
pas
sin
g
Particle size , (µm)
M
D
BA
B
0
0.5
1
1.5
2
2.5
0 200 400 600 800 1000 1200
Slu
rry
visc
osi
ty (
Pa.
s)
Shear rate, (S-1 )
M
D
BA
B

International Journal of Mechanical & Mechatronics Engineering IJMME-IJENS Vol:18 No:04 76
182304-5959-IJMME-IJENS © August 2018 IJENS I J E N S
We can conclude that the higher the content of fine
aggregates, the more the slurry becomes viscous. Regardless
of the solids concentration, the specific surface area of the
particles increases due to the presence of finer particles in the
sample (M) which leads to the production of new surfaces and
the total number of particles increases by promoting a
decrease in the distance between the grains . For samples (D),
(BA) and (B) with a larger average particle size and with
fewer finer particles, the interaction between the particles is
small. As a result, viscosity indicates higher values for (M)
than for the other samples at a specific mass concentration and
shear rate [12].
Fig.4. Rheology of samples (D) and (B) at the same concentration and particle size distribution. (50.54%)
It is quite remarkable from the figure (2) that the samples (D)
and (B) have the same particle size distribution, and for the
same mass concentration the two samples have a different
rheological behavior figure (4), this is attributed to the
porosity aggregates and mineralogy of each sample and also to
the content of flocculant and additives in the slurry.
C. Effect of the temperature of the slurry
Fig.5. Effect of temperature on the rheology of the phosphate slurry at a concentration of 57.27%. (B1)
The temperature dependence of the viscosity of the phosphate
slurry was investigated in the shear rate range of 1 to 1000 s -1.
Figure (5) shows the effect of temperature on the rheology of
phosphate water slurry at a concentration of 57.27% solids.
The viscosity of the slurry decreases in the temperature range
studied (25 ° C-55 ° C). The decrease in viscosity at elevated
temperatures occurs due to the increase in the kinetic energy
of the particles promoting the breaking of the intermolecular
bond between the adjacent layers, which causes a decrease in
the viscosity of the phosphate slurry.
0
5
10
15
20
25
30
35
40
0 200 400 600 800 1000 1200
She
ar s
tre
ss (
Pa)
Shear rate, (S-1 )
D
B
0
10
20
30
40
50
60
70
80
0 200 400 600 800 1000 1200
She
ar s
tre
ss ,
(Pa)
Shear rate, S-1
25°C
35°C
45°C
55°C
International Journal of Mechanical & Mechatronics Engineering IJMME-IJENS Vol:18 No:04 77
182304-5959-IJMME-IJENS © August 2018 IJENS I J E N S
For the temperature 55 ° C, we notice a deformation of the
rheological profile especially for low shear rates, this
deformation can be attributed to the change of the structure of
the slurry with the temperature, with the increase of the
temperature, the particles can to be dissolved in the
suspension, and one can also have chemical reactions which
are provoked with the increase of the temperature. This
changes the physicochemical structure of the suspension and
therefore affects the rheological behavior of the phosphate
slurry.
IV. SEARCH FOR A SUITABLE MODEL TO DESCRIBE
RHEOLOGICAL BEHAVIOR OF PHOSPHATE-WATER SLURRY
In the following, we are working on the B1 sample, the
rheological data has been fitted to the Otswald-power law,
Bingham, Herschel Buckley and Casson models to identify the
rheological model that best describes the experimental data at
each concentration index.
A. Presentation of the rheological models
The Casson Model:
The Casson model has often been used to describe the
rheological behavior of concentrated suspensions that have
pseudoplastic behavior with threshold stress (yield) [13].
σ1/2 = (a.)1/2 + b
Where: the viscosity = a² and the (yield stress) = b; γ: Shear
rate and σ: Shear stress.
The Bingham Model:
The Bingham model is a model of description of the behaviors
of the suspensions having linear rheological profiles with
threshold stress.
σ = a. + b
Where: the viscosity = a, and the (yield stress) = b.
The Ostwald-Power Law Model:
The Ostwald model is often used to describe the behavior of
suspensions having a dilatants or pseudoplastic behavior
without threshold stress.
σ = a.n
Where: a, is the coherence parameter, n is the behavior index
of the flow.
The Herschel-Buckley model:
The Herschel-Buckley model presents a generalization of all
the rheological models that have been quoted.
σ = a.p + b
B. Model fitting
In this part we will try to adjust the experimental data obtained
for sample B1, to the 4 models that we have mentioned, in
order to know the most suitable model to describe the
rheological behavior of the phosphate slurry at each index of
concentration. Therefore, it is necessary to establish the
parameters of optimal regressions of each model so as to have
a trend curve which perfectly describes the curve obtained
experimentally. The pipeline design indicated that the
dynamic viscosity should be in the range
(0,0066 – 0,0102 Pa.s) and yield stress in the range
(1.56 - 3.8 Pa), In what follows, we look for the model which
perfectly describes the rheological behavior of the phosphate
slurry in the mathematical sense (it is necessary that the R² is
close to 1), and at the same time it is necessary that this model
generates values of viscosity and yield tress in the ranges
design or close to these ranges.
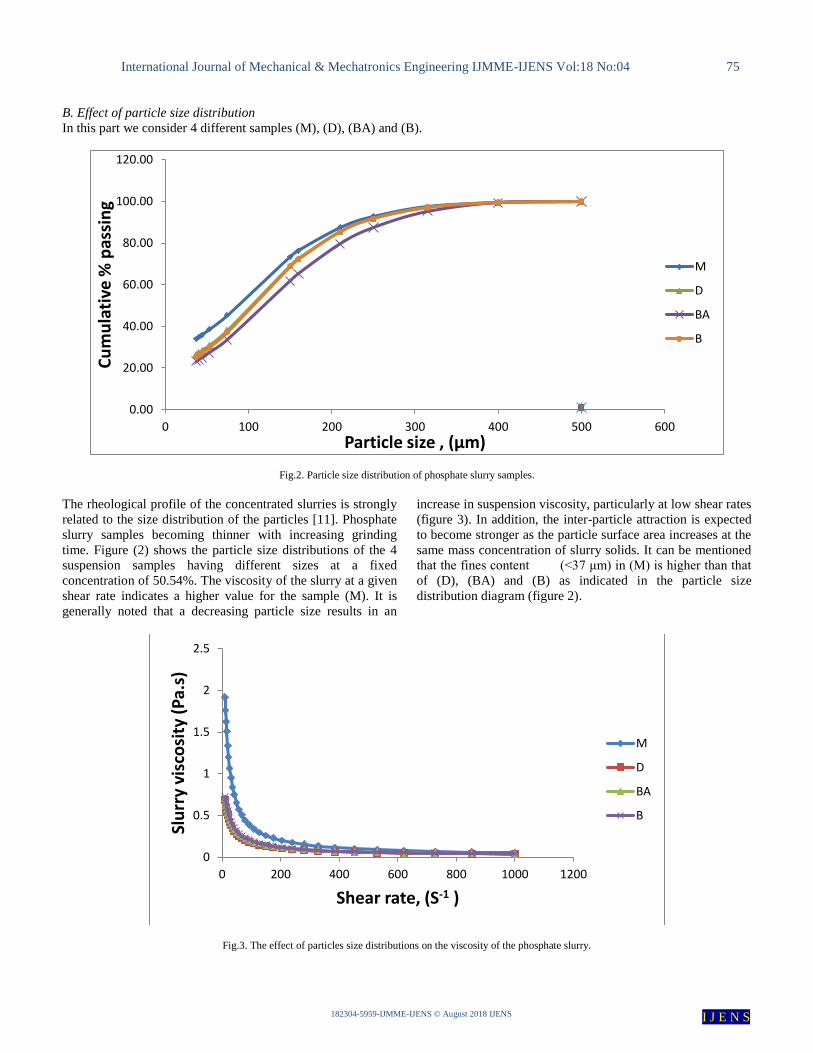
1) Case of phosphate slurry at 57.27% concentration by
mass:
The adjustment of the rheogram obtained experimentally at
a concentration of 57.27%, to the 4 rheological models gave
the following results
Fig.6 Casson model σ1/2 = 0,1814.1/2 + 3,145
Fig.7 Bingham model σ = 0,0666. + 16,22
Fig.8 Ostwald model σ = 3,507.0,4401

International Journal of Mechanical & Mechatronics Engineering IJMME-IJENS Vol:18 No:04 78
182304-5959-IJMME-IJENS © August 2018 IJENS I J E N S
Fig.9. Herschel-Buckley σ = 50,45.0,1445 – 68,9
We note that the model which perfectly describes the
rheological behavior of the phosphate slurry is the Herschel-
Buckley model (fig 9) with an R² = 0.9963. The Ostwald
model (Power-law), (fig 8) is also a suitable model for the
description of the rheological profile at this concentration,
with a R² = 0.9621. The Casson model seems to be adequate
for the description of the rheological behavior for this
concentration (fig. 6), with a R² = 0.8923. The Bingham model
(fig. 7) is not suitable for describing the rheological behavior
of phosphate slurry at the 57.27% concentration.
For a phosphate water slurry with a concentration of 57.27%,
the Casson model does not perfectly describe its rheological
behavior (R² = 0.8923), but it provides viscosity and yield
stress values that seem logical and close to reality. For the
case of (fig. 6) the viscosity of Casson is = a² = 0.0329 Pa.s
and the yield stress is b = 3.145 Pa. These values are not the
real values, but are approximate or relative values to the
Casson model.
On the other hand, the Herschel-Buckley and Ostwald-power
Law models perfectly describe the rheological behavior of the
phosphate slurry at this concentration, but we generate
viscosity and yield stress values that seem illogical (negative
values of yield stress and high values of viscosity), and this
is very far from the ranges of viscosity and yield stress for
phosphate slurry at a concentration of 57.27. %.
2) Case of phosphate slurry at 52.32% concentration by
mass:
The adjustment of the rheogram obtained experimentally at a
concentration of 52.32%, to the 4 rheological models gave the
following results:
Fig.10. Casson model σ1/2 = 0,1144.1/2 + 2,27
Fig.11. Bingham model σ = 0,02844. + 8,13
Fig.12. Ostwald model σ = 1,903.0,4087
Fig.13. Herschel-Buckley σ = 2,693.0,3647 – 1,788
We note from (fig. 12 and 13) that both the Ostwald and
Herschel-Buckley models are suitable models for the
description of the rheological profile of phosphate slurry at the
concentration of 52.32%. The Casson model (fig. 10) also
seems to be a suitable model for the description of the
rheological behavior of phosphate slurry at this concentration,
with a R² = 0.9677. The Bingham model is not a perfect
model for describing the rheological behavior of phosphate
slurry for this concentration.
The viscosity and yield stress values generated by the Casson
model for this case are:
= a² = 0.013 Pa.s and yield stress b = 2.27 Pa.
It should be noted that in this case where the concentration is
52.32%, the Casson model describes well the rheological
behavior (R² = 0.9677) and the values of viscosity and yield
stress seem logical and acceptable, because they are almost in
the design ranges of viscosity and yield stress.

International Journal of Mechanical & Mechatronics Engineering IJMME-IJENS Vol:18 No:04 79
182304-5959-IJMME-IJENS © August 2018 IJENS I J E N S
3) Case of phosphate slurry at 46.03% concentration by
mass:
The adjustment of the rheogram obtained experimentally at a
concentration of 46,03%, to the 4 rheological models gave the
following results:
Fig.14. Casson model σ1/2 = 0,1046.1/2 + 1,073
Fig.15. Bingham model σ = 0,01764. + 2,458
Fig.16. Ostwald model σ = 0,2956.0,5962
Fig.17. Herschel-Buckley σ = 0,06253.0,8152 +1,736
For the case where the concentration of the slurry is 46.03%,
we notice that all the models perfectly describe the rheological
behavior of the phosphate water slurry. This proves what we
have noticed experimentally in the paragraph
(III. A. The effect of the concentration of solids on the
rheological behavior of phosphate water slurry), we found
that the 46.03% concentration point is a transition point
between pseudoplastic behavior with threshold stress and
Bingham behavior, for this reason all models have been
suitable for this concentration. Among the four rheological
models, the two Casson and Bingham models are the most
suitable for describing the rheological behavior of the
phosphate slurry at 46.03% concentration, with R² = 0.991 for
Casson and R² = 0.984 for Bingham.
The viscosity and yield stress values for the Casson model are:
= a² = 0.0109 Pa.s and yield stress b = 1.073 Pa.
The viscosity and yield stress values for the Bingham model
are: = a = 0.01764 Pa.s and yield stress b = 2.458 Pa.
Both models (Casson and Bingham) generated logical
viscosity and yield stress values for a 46.03% concentration of
phosphate slurry, but the most acceptable values are provided
by the Casson model, because it has generated viscosity and
yield stress values in the design ranges
4) Case of phosphate slurry at 34.24% concentration by
mass:
Fig.18. Casson model σ1/2 = 0,1149.1/2 - 0,04871
Fig.19. Bingham model σ = 0,01256. + 0,1048

International Journal of Mechanical & Mechatronics Engineering IJMME-IJENS Vol:18 No:04 80
182304-5959-IJMME-IJENS © August 2018 IJENS I J E N S
Fig.20. Ostwald model σ = 0,007755.1,077
Fig. 21. Herschel-Buckley σ = 0,002132.1,262 + 0,546
We note that the four rheological models perfectly describe
the rheological behavior of the phosphate slurry at the 34.24%
concentration. Between the four models, the two models
Ostwald-power Law and Herchel Buckley are the models that
perfectly describe this rheological behavior (fig 20 ; 21), but
the law of Ostwald is a law dedicated to Newtonian fluids, for
our case there is always a threshold stress, so we adopt the
Herschel-Buckley model at this concentration 34.24%.
The values of viscosity and yield stress according to the
Herschel-Buckley model are = a = 0.0021 Pa.s and
yield stress b = 0.546 Pa. These values seem logical and
acceptable for the slurry at a concentration of 34.24%. .
It is well known in the literature that for the Herschel-Buckley
equation, if the exponent P <1 the rheological behavior is
pseudoplastic and if P> 1 the rheological behavior is dilatant,
the same thing for the equation of Ostwald-power Law. [14]
For our case (Figs 20 and 21) the exponent of the Herschel-
Buckley equation P = 1.26> 1 and the exponent of the Ostwald
equation n = 1.077> 1, so for the concentration 34.24% the
rheological behavior of the phosphate slurry is dilatant.
V. RESULTS AND DISCUSSION
The regression parameters resulting from the modeling of the
rheological behavior of the phosphate slurry through the four
models for each concentration index are grouped together in
Tables I and II. The parameters a and b are successively
viscosity and yield stress for each model, and the parameters n
and p are the exponents of the models Ostwald and Herschel-
Buckley.
Table I The regressions parameters of the Casson and Bingham models at each
concentration
Casson model Bingham model
Concentration % by mass
a²
(Pa.s)
b (Pa) R² a (Pa.s) b
(Pa)
R²
57,27% 0,0329 3,145 0,892 0,0666 16,22 0,808
54,50% 0,0194 2 ,711 0,929 0,04165 11,65 0,853
52,32% 0,013 2,27 0,967 0 ,02844 8,135 0,909
50,00% 0,0106 1,818 0,988 0 ,02182 5,459 0,952
46,03% 0,0109 1,073 0,991 0 ,01764 2,45 0,984
42,37% 0,0112 0,724 0,987 0,01578 1,471 0,99
38,45% 0,01272 0,1616 0,986 0,01355 0,3769 0,99
34,24% 0,0132 -0,0487 0 ,988 0,01256 0,1048 0,989
Table II
The regressions parameters of the Ostwald and Herschel-Buckley models at
each concentration.
Ostwald-power Law
model
Herschel-Buckley model
Concentration
% by mass a (Pa.s) n R² a (Pa.s) b (Pa) p R²
57,27% 3,507 0,4401 0,962 50,45 - 68,9 0,1445 0,996
54,50% 2,708 0 ,413 0,985 13,52 - 18,64 0,2236 0,998
52,32% 1,903 0,4087 0,997 2,693 - 1,788 0,3647 0,998
50,00% 1,135 0,4409 0,993 0 ,5682 1,805 0,5336 0,995
46,03% 0,2956 0,5962 0,978 0 ,0625 1,736 0,8152 0,989
42,37% 0,1151 0,7158 0,972 0,01456 1,503 1,012 0,99
38,45% 0,01639 0,9783 0,984 0,00303 0,7945 1,221 0,996
34,24% 0,007755 1,077 0 ,99 0,00213 0,5467 1,262 0,998
From the data in Tables I and II we can distinguish two forms
of interpretation of the results, an interpretation from a
mathematical point of view and an interpretation from a
physical point of view.
1) Interpretation from a mathematical point of view:
From a mathematical point of view, the model that has R²
closer to 1 is the perfect model for the description of
rheological behavior. Table II shows that the Herschel-
Buckley model has an R² always close to 1 for all
concentrations, so the Herschel-Buckley model is a perfect
model of the description of the rheological behavior of
phosphate slurry for the whole range of concentrations
(34.24% - 57.27%), the Ostwald-power Law model is too.

International Journal of Mechanical & Mechatronics Engineering IJMME-IJENS Vol:18 No:04 81
182304-5959-IJMME-IJENS © August 2018 IJENS I J E N S
The Casson model perfectly describes the rheological behavior
over the concentration range (34.24% - 52.32%). The
Bingham model perfectly describes the rheological behavior
of the slurry on the range (34.24% - 46.03%).
2) Interpretation from a physical point of view:
From a physical point of view, the R² must be close to 1 and in
addition the model must generate viscosity and yield stress
values in or near the design ranges, the Herschel-Buckley
model perfectly describes the rheological behavior of slurry on
the range (34.24% - 57.27%), but it provides logical values of
viscosity and yield stress as for the concentration 38.45% and
34.24%.
Thus the Herschel-Buckley model is suitable for
concentrations below 38.45%, it should be noted that for
concentrations below 38.45% the rheological behavior of the
phosphate slurry is dilatant (p> 1).
For the physical point of view we eliminate the Ostwald
model, because it is a model dedicated to Newtonian fluids. It
is quite remarkable from Table I that for the Casson model,
the viscosity decreases with the dilution of the slurry, to the
point of concentration 46.03% the viscosity begins to increase,
which is contradictory with the physical logic, for this we can
conclude that the Casson model is valid only for
concentrations between (46.03% - 57.27%), it should be noted
that the model Casson has values of R² acceptable and close to
1.
The Bingham model perfectly describes the rheological
behavior of the phosphate-water slurry over the range of
concentrations (34.24% - 46.03%) and we generate viscosity
and yield stress values that we can consider acceptable and in
the design ranges of viscosity and yield stress.
VI. CONCLUSION
In this study, we proved that with the dilution the viscosity of
the phosphate slurry decreases, and the smaller the size of the
slurry, the more viscous it becomes, we have also shown the
influence of the flocculant and additives. The temperature has
a significant effect on the physicochemical composition of the
slurry and this has an impact on its rheological behavior. For
modeling, we have made adjustments to the experimental
rheological behavior of the phosphate slurry for the four
models (Casson, Bingham, Ostwald- Power Law and Heschel-
Buckley), we have concluded that the Herschel-Buckley
model is suitable for the description of the rheological
behavior of the slurry and for the calculation of apparent
viscosity and yield stress for low concentrations (less than
38.45%). The Bingham model is suitable for the range of
concentrations (34.24% - 46.03%). The Casson model is
suitable for modeling the rheological behavior of the slurry
and for calculating viscosity and yield stress for the range of
concentrations (46.03% - 57.27%). We concluded from the
experimental results and modeling that, with dilution, the
phosphate slurry changes its pseudoplastic behavior with
threshold stress, towards a Bingham behavior from the
46.03% concentration, and changes its Bingham behavior
towards a dilatant behavior from the concentration 38.45%.
REFERENCES [1] B.E.A. Jacobs "Design of Slurry Transport Systems" pp285-
6(1991)
[2] Baha Abulnaga"Slurry Systems Handbook" McGraw-Hill (2002) [3] Miedema, S.A., "Slurry Transport: Fundamentals, a Historical
Overview and The Delft Head Loss & Limit Deposit Velocity"
Edited by Robert C. Ramsdell (2016)
[4] Baudez 2001 “Rheology of aging, concentrated, polymeric
suspensions: Application to pasty sewage sludges” Journal of
Rheology.
[5] He, M., Wang, Y. & Forssberg, E., (2004), “Slurry rheology in wet ultra-fine grinding of industrial minerals: a review”, Powder
Technology. Vol. 147, pp. 267-304.
[6] Henderson, C. B., R. S. Scheffee, and E. McHale. 1983. Energy
Progr. 3:69.
[7] Firouzi, J., Akbar Yousefi, A. & Langroudi, A.E., (2006),
“Rheological Behaviour of Metal powder Suspensions under Dynamic loading”, Iranian Polymer Journal, vol.
15(2), pp. 127-134.
[8] Kim , D. C., S. H. Cho, S. K. Kang, and D. H. Shin. 1983. Proc. Fifth Int. Symp. Coal SlurryCombust. and Technol., Tampa, FL, p.
757.
[9] Papachristodoulou, G., and O. Trass. 1987. Coal slurry fuel technology. Can. J. Chem. Eng. 65:177.
[10] Swain, P., and D. Panda. 1996. Rheology of coal-water mixture.
Fuel Sci. and Technol. Int’l.14(9):1237. [11] Tangsathitkulchai, C., Austin, L.G., (1988), “Rheology of
concentrated slurries of of natural size distribution produced by
grinding”, Powder Technology, vol. 56, pp.293-299. [12] Pradipta Kumar Senapati, Dibakar Panda , Ashutosh Parida ,
‘Predicting Viscosity of Limestone–Water Slurry’Journal of Minerals & Materials Characterization & Engineering, Vol. 8,
No.3, pp 203-221, 2009
[13] Casson N. 1959 A flow equation for pigment oil suspension of the printhing ink type. In pergament presse, Edition New York, Vol.
24.
[14] Rauwendaal,C. 2001. Polymer Extrusion. 4rd end. New York, USA :Hanser Gardner Press.