Study of the NaF-ScF3 system as a molten bath for ...
22
HAL Id: hal-02108670 https://hal.archives-ouvertes.fr/hal-02108670 Submitted on 26 Nov 2020 HAL is a multi-disciplinary open access archive for the deposit and dissemination of sci- entific research documents, whether they are pub- lished or not. The documents may come from teaching and research institutions in France or abroad, or from public or private research centers. L’archive ouverte pluridisciplinaire HAL, est destinée au dépôt et à la diffusion de documents scientifiques de niveau recherche, publiés ou non, émanant des établissements d’enseignement et de recherche français ou étrangers, des laboratoires publics ou privés. Study of the NaF-ScF3 system as a molten bath for production of Sc alloys: A combination of NMR and molecular dynamics simulations Aydar Rakhmatullin, Kelly Machado, Didier Zanghi, Ilya Polovov, Rinat Bakirov, Konstantin Maksimtsev, Catherine Bessada To cite this version: Aydar Rakhmatullin, Kelly Machado, Didier Zanghi, Ilya Polovov, Rinat Bakirov, et al.. Study of the NaF-ScF3 system as a molten bath for production of Sc alloys: A combination of NMR and molecular dynamics simulations. Journal of Alloys and Compounds, Elsevier, 2019, 786, pp.953-959. 10.1016/j.jallcom.2019.02.057. hal-02108670
Transcript of Study of the NaF-ScF3 system as a molten bath for ...

HAL Id: hal-02108670https://hal.archives-ouvertes.fr/hal-02108670
Submitted on 26 Nov 2020
HAL is a multi-disciplinary open accessarchive for the deposit and dissemination of sci-entific research documents, whether they are pub-lished or not. The documents may come fromteaching and research institutions in France orabroad, or from public or private research centers.
L’archive ouverte pluridisciplinaire HAL, estdestinée au dépôt et à la diffusion de documentsscientifiques de niveau recherche, publiés ou non,émanant des établissements d’enseignement et derecherche français ou étrangers, des laboratoirespublics ou privés.
Study of the NaF-ScF3 system as a molten bath forproduction of Sc alloys: A combination of NMR and
molecular dynamics simulationsAydar Rakhmatullin, Kelly Machado, Didier Zanghi, Ilya Polovov, Rinat
Bakirov, Konstantin Maksimtsev, Catherine Bessada
To cite this version:Aydar Rakhmatullin, Kelly Machado, Didier Zanghi, Ilya Polovov, Rinat Bakirov, et al.. Study ofthe NaF-ScF3 system as a molten bath for production of Sc alloys: A combination of NMR andmolecular dynamics simulations. Journal of Alloys and Compounds, Elsevier, 2019, 786, pp.953-959.�10.1016/j.jallcom.2019.02.057�. �hal-02108670�

1
Study of the NaF-ScF3 system as a molten bath for production of Sc alloys: a
combination of NMR and Molecular Dynamics simulations
Aydar Rakhmatullin1*, Kelly Machado1, Didier Zanghi1, Ilya B. Polovov2, Rinat Bakirov3,
Konstantin V. Maksimtsev2, and Catherine Bessada1
1Conditions Extrêmes et Materiaux: Haute Température et Irradiation, CEMHTI, UPR 3079 -
CNRS Univ Orleans 45071 Orléans, France.
2Department of Rare Metals and Nanomaterials, Institute of Physics and Technology Ural
Federal University, Ekaterinburg, Russia
3Department of Technology of mechanical engineering and instrument making, Votkinsk
branch of Kalashnikov Izhevsk State Technical University, 1, Shuvalova str. 427000
Votkinsk, Russia
Corresponding author Aydar Rakhmatullin, e-mail: [email protected]
Abstract
In situ high temperature NMR spectroscopy was used to characterize the NaF-ScF3 melt
over a wide range of compositions. 19F, 23Na, and 45Sc NMR spectra were acquired in NaF-
ScF3 melts of up to 70 mol% of ScF3. The interpretation of all experimental results obtained in
situ in the melt is significantly enhanced by the contribution of Molecular Dynamics (MD)
calculations. A new interatomic potential for the molten NaF-ScF3 system was developed by
using a Polarizable Ion Model (PIM). The potential parameters were obtained by force-fitting
to density functional theory (DFT) reference data. MD simulations were combined with further
DFT calculations to determine NMR chemical shifts for 19F, 23Na, and 45Sc. The agreement
between the experimental NMR data and the corresponding calculated data from our applied
computational protocol indicated the polymerization and network formation in the melt.
Additionally, the density and the electrical conductivity in the molten state were calculated from
the statistical analysis of ionic trajectories obtained through MD simulations.
Keywords: High temperature NMR, scandium fluorides, molten salts, Molecular Dynamics,
DFT
1. Introduction

2
One of the main fields of application of scandium is the development of lightweight,
high-strength aluminum alloys [1]. Scandium in aluminum-based alloys is introduced during
their manufacture as an aluminum-scandium master alloy where scandium content is varied
from 1.5 to 5 wt%. The structure of the Al-Sc master alloy represents a solid solution of
scandium in aluminum with dispersed particles of the Al3Sc intermetallic compound [2]. The
maximal solubility of scandium in aluminum-based solid solutions does not exceed 0.8 wt%
[3]. Thus, А13Sс is formed during both initial and eutectic crystallization, and as result of
decomposition of a supersaturated solid solution. This intermetallic phase, with a face centered
cubic lattice, has very close geometrical parameters to the aluminum lattice that results in the
unique influence of scandium on structure and properties of aluminum alloys [4].
The main manufacturers of Al-Sc master alloys use the following methods for their
synthesis: direct alloying of scandium metal with aluminum, electrowinning from molten salts
containing scandium salts or oxide, and aluminothermic reduction of scandium salts or Sc2O3
[5]. The last technique allows technological use of scandium concentrate based on NaScF4 that
was obtained from waste solutions arising from uranium underground leaching according to the
original method [6].
Therefore, the study and comprehension of the ionic structure of the electrolyte,
consisting of NaF and ScF3, represents an important contribution to understanding the
mechanism of the formation of Al3Sc. Chemical and physical properties of this melt strongly
depend on scandium speciation.
The information concerning scandium speciation in halide systems is relatively poor.
Moreover, most authors have used limited number of techniques in their works. Several
electrochemical studies indicated that complex Sc3+ ions are the only soluble scandium species
in chloride and chloride-fluoride molten salts [1, 7, 8], however their structure in the melts is
unknown. CsI-ScI3 and CsCl-ScCl3 mixtures were studied in detail in both molten and solid
state by Raman spectroscopy over the entire composition range at temperatures up to 1000 °C
[9-11]. In the molten CsI-ScI3 system with scandium iodide mole fractions below 0.6, the
presence of ScI63- and ScI4
- species in the equilibrium was proposed. In the CsCl-ScCl3 system,
a different ionic species, i.e. ScCl74-, ScCl6
3-, Sc2Cl93-, and ScCl4
-, were established. A cluster-
like model for the structure of pure molten ScCl3 was also proposed, where fragments of
scandium octahedra bridged by chlorides were terminated with scandium tetrahedra having
terminal chlorides.

3
The aim of this contribution is to investigate the structure of molten NaF-ScF3 binary
systems by a multinuclear (19F, 45Sc, and 23Na) in situ NMR spectroscopy at high temperature
and by computations combining Molecular Dynamics (MD) simulations and density functional
theory (DFT) calculations. To perform MD simulations over a large dynamic time interval (1 –
5 ns), a classical interaction atomic potential for NaF-ScF3 melts has been specially developed.
The interatomic potential was validated over a wide range of compositions, by computing the
NMR chemical shifts of each nucleus in the framework of the density functional theory. DFT
calculations were performed on configurations generated along the MD simulations without
further optimization. Statistical analysis of ion trajectory from MD simulations allowed to
describe accurately the structure of the melts and to establish the relation between the
physicochemical and structural properties.
2. Methods and Experiments
2.1. Materials.
For the preparation of the samples, the following chemicals were used: NaF (Fluka, min.
99.9 %; dried in vacuum at 773 K for 4 h), ScF3 (Sigma-Aldrich, 99.9 %), without further
purification. All fluorides were stored in a dry box under argon atmosphere maintained below
0.3 ppm of moisture and 0.1-0.5 ppm of oxygen. Different compositions of ScF3 and NaF were
prepared by mixing and grinding the corresponding fluorides. For high temperature (HT) NMR
measurements, approximately 60 mg of the mixtures were put into tightly closed high purity
boron nitride crucibles to avoid any contamination by the surrounding atmosphere.
2.2.NMR spectroscopy.
The HT NMR spectra were acquired using the laser heated NMR system developed in
CEMHTI Orleans [12]. The BN crucible was hermetically closed, containing the sample in
powder form is placed inside the RF-coil, in the center of the cryomagnet. To insure a good
homogeneous heating, the top and the bottom of the crucible are heated by a CO2 laser
(Coherent Diamond 250W), passing axially through the NMR probe. The temperature was
controlled by the laser power following a preliminary calibration curve. During the experiment,
the temperature was held at 10 °C above the corresponding sample melting point [13]. The
melting point of the sample is clearly detected by the modification of the shape and width of
the NMR line. The transition from solid to liquid state can be followed by 19F NMR spectra
during the heating of the sample. The desired temperature should be reached in the sample after
4-5 minutes. During the NMR experiments, the peaks do not change with time once the sample

4
is in the liquid state. NMR spectra of 19F, 23Na, and 45Sc have been acquired for NaF–ScF3
compositions ranging from 0 to 70 mol% ScF3. It was not possible to obtain HT NMR spectra
at concentrations above 70 mol%, due to the very high melting point [13]. ScF3 has a maximum
melting temperature among all simple fluorides (MFx) Tm = 1550 ± 3 °C [14].
2.3.Molecular dynamics simulations
Molecular dynamics simulations were performed using the polarizable ion model (PIM)
[15, 16]. This model uses a classical interatomic potential which is a sum of four pairwise additive
interactions. The analytical expression is made up of four terms:
𝑉 = ∑ (𝑞𝑖𝑞𝑗
𝑟𝑖𝑗+ 𝐵𝑖𝑗 𝑒−𝑎𝑖𝑗𝑟𝑖𝑗
− 𝑓6𝑖𝑗(𝑟𝑖𝑗)
𝐶6𝑖𝑗
(𝑟𝑖𝑗)6− 𝑓8
𝑖𝑗(𝑟𝑖𝑗)𝐶8
𝑖𝑗
(𝑟𝑖𝑗)8)
𝑖<𝑗
+ 𝑉𝑝𝑜𝑙
The first term corresponds to the electrostatic interactions. The two following terms are
expressed by a Born-Huggins-Mayer type potential; they consist of an exponentially decaying
term accounting for the overlap repulsion of the electronic clouds at short distances, and a term,
which represents the dispersion effects. The Bij and aij represent the repulsion coefficients and
the Cij6 and Cij
8 parameters are the dipole–dipole and dipole–quadrupole dispersion coefficients.
The fn are Tang-Toennies dispersion damping functions [17] describing the short range
penetration correction to the asymptotic multipole expansion of dispersion.
Finally, the fourth term, called polarization term reflects the distortion of the electronic
density in response to the electric fields due to all the other ions, which results in induced dipole
on each ion [18]. This polarization term include charge-dipole and dipole-dipole interactions as
well as the polarizability , corresponding to the energy cost of deforming the charge density
of the ion i to create the induced dipole:
𝑉𝑝𝑜𝑙 = ∑ [(𝑞𝑖𝜇𝛼𝑗
𝑔𝑖𝑗(𝑟𝑖𝑗) − 𝑞𝑗𝜇𝛼𝑖 𝑔𝑗𝑖(𝑟𝑖𝑗)) 𝑇𝛼
𝑖𝑗− 𝜇𝛼
𝑖 𝜇𝛽𝑗
𝑇𝛼𝛽𝑖𝑗 ]
𝑖,𝑗
+ ∑ (1
2𝛼𝑖|𝜇𝑖|
2)
𝑖
where µi are induced dipoles on each ion i, T and T are the charge–dipole and dipole–dipole
interaction tensors, i is the polarizability of ion i and 𝑔𝑗𝑖 are Tang-Toennies functions.
The parameters listed in Table 1 for each atomic pair are specific of the studied system and
force field used.
5
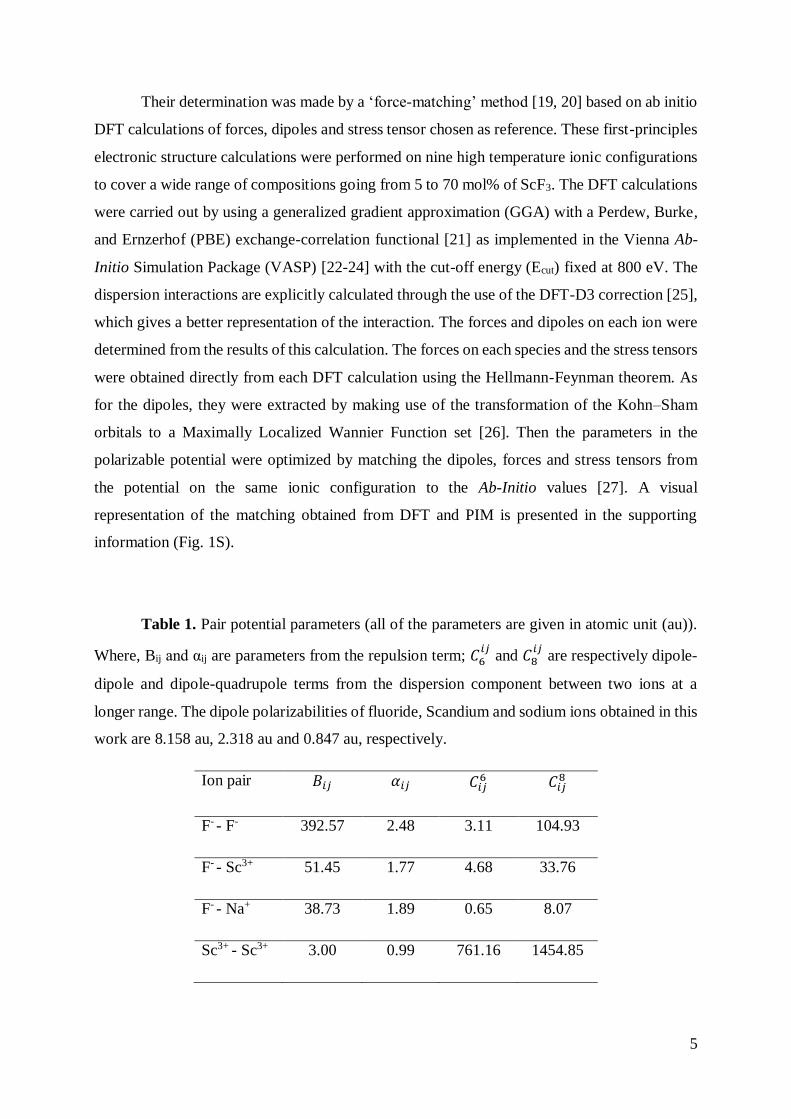
Their determination was made by a ‘force-matching’ method [19, 20] based on ab initio
DFT calculations of forces, dipoles and stress tensor chosen as reference. These first-principles
electronic structure calculations were performed on nine high temperature ionic configurations
to cover a wide range of compositions going from 5 to 70 mol% of ScF3. The DFT calculations
were carried out by using a generalized gradient approximation (GGA) with a Perdew, Burke,
and Ernzerhof (PBE) exchange-correlation functional [21] as implemented in the Vienna Ab-
Initio Simulation Package (VASP) [22-24] with the cut-off energy (Ecut) fixed at 800 eV. The
dispersion interactions are explicitly calculated through the use of the DFT-D3 correction [25],
which gives a better representation of the interaction. The forces and dipoles on each ion were
determined from the results of this calculation. The forces on each species and the stress tensors
were obtained directly from each DFT calculation using the Hellmann-Feynman theorem. As
for the dipoles, they were extracted by making use of the transformation of the Kohn–Sham
orbitals to a Maximally Localized Wannier Function set [26]. Then the parameters in the
polarizable potential were optimized by matching the dipoles, forces and stress tensors from
the potential on the same ionic configuration to the Ab-Initio values [27]. A visual
representation of the matching obtained from DFT and PIM is presented in the supporting
information (Fig. 1S).
Table 1. Pair potential parameters (all of the parameters are given in atomic unit (au)).
Where, Bij and αij are parameters from the repulsion term; 𝐶6𝑖𝑗
and 𝐶8𝑖𝑗
are respectively dipole-
dipole and dipole-quadrupole terms from the dispersion component between two ions at a
longer range. The dipole polarizabilities of fluoride, Scandium and sodium ions obtained in this
work are 8.158 au, 2.318 au and 0.847 au, respectively.
Ion pair 𝐵𝑖𝑗 𝛼𝑖𝑗 𝐶𝑖𝑗6 𝐶𝑖𝑗
8
F- - F- 392.57 2.48 3.11 104.93
F- - Sc3+ 51.45 1.77 4.68 33.76
F- - Na+ 38.73 1.89 0.65 8.07
Sc3+ - Sc3+ 3.00 0.99 761.16 1454.85

6
Sc3+ - Na+ 0 5.22 189.72 1382.19
Na+ - Na+ 9.04 1.82 91.06 83.52
In this work, a simple cubic box corresponding to the unit cell was used with periodic
boundary conditions that impose a specific symmetry on the system under study. For the MD
simulations, the systems were first equilibrated using the isothermal-isobaric (NPT) ensemble
for several compositions ranging from 5 to 70 mol% of ScF3. The temperature and the average
internal pressure were held at 10 °C above melting point (Table 2) and 0 GPa, respectively, by
coupling the simulation cell to Nosé-Hoover thermostat chains and a barostat [28, 29]. The
melting temperatures for the different compositions were extracted from the phase diagram
established by Thoma and Karraker [13].
The relaxation time that sets the strength of the coupling of the system to the thermostats
or to the barostat was fixed to 20 ps and the time step for integrating the equations of motion
was fixed to 1 fs using the Verlet algorithm [30]. The aim of this equilibration period, whose
duration was typically 200 ps, was to allow the system to reach equilibrium. The cell length
was fixed to the stable average value of the NPT run. In our case, this equilibration time
corresponds to the time required for the total energy of the system, the temperature and the
density were calculated from length of the cell, to reach a steady state around an average value.
We considered that this stability was achieved when the ratio between the average absolute
deviation and the average value is less 5 %.
After the first stage of equilibration, the system was simulated for 1 ns in the canonical
ensemble (NVT) by fixing the length of the cell to its average value. During this production
phase, the atomic coordinates, the energies, the dipoles and the velocities of the different ions
were recorded every 100 fs. The parameters of the cubic cells (compositions, number of atoms
and volumes) used for simulations are provided in Table 2. The volume of the box was
calculated by considering a cubic box. Using a confidence interval of 68 %, the uncertainty
about the length cell was determined from the calculation of its mean value and the
corresponding standard deviation on the last 100 ps of the equilibration phase.
Table 2. Molecular dynamics simulations conditions of NaF-ScF3: compositions, number of
atoms (NF-, NNa+, and NSc3+), volume of the cubic cell, and melting point.
mol% ScF3 NF- NNa+ NSc3+ Volume, Å3 Melting point, K

7
0 100 100 0 3638 ±113 1268
5 115 100 5 3865 ±78 1227
10 124 94 10 3941 ±79 1186
15 138 90 16 4074 ±81 1082
20 148 85 21 4256 ±83 1123
25 120 60 20 3400 ±72 1158
28 122 56 22 3268 ±70 1135
31 124 52 24 3216 ±69 1090
33 125 50 25 3260 ±70 1004
37 126 45 27 3042 ±67 925
40 128 44 28 3061 ±67 926
46 131 38 31 3183 ±69 1175
50 132 33 33 3247 ±70 1370
56 134 29 35 3282 ±70 1483
60 143 26 39 3445 ±109 1523
70 161 20 47 3762 ±77 1665
2.4. NMR DFT computational details
The chemical shielding tensors for all atoms (19F, 23Na, 45Sc) in the molten system NaF-
ScF3 have been calculated using the gauge including projector augmented wave (GIPAW) method
[31] implemented with the NMR-CASTEP code [32, 33]. The PBE functional [21] was used
for the exchange-correlation energy and the core-valence interactions were described by ultra-
soft pseudopotentials (USPP) [33]. The USPP were generated during “the on the fly” generator
(OTFG_USPP) included in CASTEP. The wave functions were expanded on a plane-wave

8
basis set with a cutoff-energy of 610 eV. The Brillouin zone was sampled using a Monkhorst–
Pack grid [34] spacing of 0.05 Å-1.
In order to take into account, the thermal agitation of the ions due to the temperature into
the NMR parameters calculation, 10 snapshots were extracted every 100 ps along the MD
trajectory simulated in the NVT ensemble. For each snapshot, the individual chemical shielding
tensor is calculated for all the nuclei of the system. The isotropic shielding values are then
averaged to give a mean value for each atomic configuration. For each composition, the isotropic
chemical shielding was obtained by averaging the values obtained from the 10 snapshots [19,
35, 36]. Therefore, to convert the calculated isotropic chemical shielding into isotropic chemical
shift, the definition of calibration curve relating isotropic chemical shift and shielding is
necessary. For 45Sc and 19F the relationship reported in our previous study [37] and for 23Na the
relationship reported on [19] were applied.
3. Results and Discussions
3.1.HT NMR in NaF–ScF3 melts
The NMR spectra acquired in the molten state consist in a single Lorentzian line,
characteristic of a rapid exchange at the timescale of NMR between the different atomic
configurations around the observed nucleus. The measured chemical shift is thus the average
of the individual chemical shifts of the different species.
The 19F spectra obtained in NaF–ScF3 melts at high temperature, over the whole range of
compositions are presented in Figure 1. 19F chemical shifts obtained in our system ranged from
-233.5 ppm to -7.9 ppm. The evolution of chemical shift was monotonous and nonlinear with
composition (Fig. 2 left). This evolution is very similar to the trend already observed in the case
of rare earth fluoride – alkali fluoride systems AF-ReF3 [38, 39], LiF-ZrF4 [40], and for the AF-
ThF4 [41] system (A= Li, Na, and K; Re=Y, La, Ce, Lu). This evolution is explained by the
existence of three different fluoride types. At high NaF content, fluoride anions are mainly free.
The signals for the terminal (non-bridging) fluorines appear in the chemical shift range from -
63 to -114 ppm and the chemical shift range for the bridging fluorines is from -23 to -75 ppm
[37]. Therefore, from fluorine NMR results, when ScF3 is added, fluorine atoms start to bond
with Sc atoms and to be involved in scandium based complexes [ScFx]3-x. For higher amounts
of ScF3, connections are formed between scandium complexes [ScFx]3-x by bridging fluorides.
Hence, the average coordination number around fluorine atoms tends to monotonically
increase.

9
The 45Sc chemical shift decreases linearly from 9 ppm to -2 ppm with increasing
concentration of ScF3 and it remains constant after 50 mol% (Fig. 2 right). In alkali
fluoroscandate solid compounds, scandium is present in octahedral (Li3ScF6 [42], Na3ScF6 [43],
KScF4 [44], and K5Sc3F14 [37]), seven (KSc2F7 [45] and NaScF4 [46]) and eight (LiScF4 [42])
coordinations with fluorine. The scandium chemical shifts domains are correlated with the
different possible coordination state of scandium atoms. The 45Sc chemical shift values for six
and seven coordinated scandium environments range from -20 to 14 ppm and from -53.5 to -40
ppm, respectively [37]. Therefore, we can conclude from scandium NMR that in our melts, the
average coordination number around scandium is six over the whole range of compositions.
High temperature 23Na measurements were performed for the different compositions.
We observe a decrease of the chemical shifts values over the whole range of ScF3 content (Fig.
2 right). This reduction with ScF3 addition corresponds to the increased shielding of the alkali
cations. Therefore, the electronic cloud around the Na nucleus becomes more symmetric. This
means that the Na–F interaction decreases with ScF3 amount and sodium becomes free. This
conclusion is important in terms of conductivity as the Na+ ion would become the main charge
carrier at high ScF3 content.
3.2.Experimental and calculated Chemical shifts
The chemical shift is one of the most sensitive markers of the local structure. It is sensitive
to the first neighbors, i.e. to the coordination numbers and the corresponding bond lengths. The
chemical shifts, computed using the coupled MD/DFT approach, are compared with
experimental data on Figure 2. The uncertainty of the calculated chemical shift was estimated
to be ±5 ppm for 45Sc, ±5 ppm for 23Na and ±3 ppm for 19F and; it is comparable with the
uncertainty in NMR experimental measurements: ±2 ppm for 19F, ±3 ppm for 45Sc and ±1 ppm
for 23Na. A good agreement between the calculated and experimental shift values is observed,
which indicates that the polarizable ion model used in these simulations is capable of
reproducing accurately the local structure around each nucleus in the NaF-ScF3 molten salt.
3.3.Coordination Number
The coordination numbers are obtained using the first minimum of the radial distribution
function as the radius of the solvation shell to count the number of neighbors around a given
ion. Figure 3 shows the proportion of each species, extracted from ion trajectory obtained by
MD simulations. As mentioned above, in solid alkali fluoroscandates, the Sc3+ ions can usually
occur in a 6-, 7-, or rarely 8-fold coordination. In the molten state, the dominant fluoroscandate

10
species is ScF63- in all compositions. In contrast to the solid state, the four-fold and five-fold
coordinated ScF52− ions were found. It has to be noted that the presence of ScF8
5- species was
detected, but their relative concentration is very small (less than 1 %). The second species
present over the whole range of concentrations is ScF52-. Up to 40 mol%, the concentration of
ScF52- varies slightly, then it increases up to 30 mol%. It appears that ScF7
4- entities starts to
form at 25 mol%. The average coordination number around scandium obtained from
calculations remained almost unchanged and its value was 5.8±0.1.
Figure 4 shows the fluorine environments extracted from the MD calculations. As expected,
at low ScF3 concentrations fluorine is present mainly as the free anion, whereas with an increase
in ScF3 concentration the fluorine anion takes part in the formation of anionic species containing
the Sc-F bond (Sc-F···Na+). At around 25 mol% its concentration reaches a maximum. More
than 90 % of the fluorine atoms are connected with only one scandium atom, forming the
terminal fluorines. Bridging fluorides (Sc-F-Sc) appear for a concentration of ScF3 larger than
25 mol% and it becomes the dominant fluoroscandate species for concentrations of ScF3
exceeding 55 mol%. It should be noted that the free fluorine atoms disappear from the melt at
the eutectic composition (40 mol% ScF3) and there are only terminal and bridging fluorines.
Then the polymerization process continues: 1) amount of bridging F increases rapidly which
leads to the formation of bonded chain or network -F-Sc-F-Sc-; 2) three coordinated fluorine
atoms start to form with the formation of bonds between the chains (Fig. 4). It is worth noting
that the formation of fluorine atoms bonded with three scandium atoms is accompanied by the
formation of five- and seven-fold coordinated scandium ions, whereas the concentration of six-
coordinated scandium decreases. At melt compositions rich in scandium fluoride, the melt
becomes fully polymerized. We can therefore deduce that the polymerization process is the
origin of the variation of the density shown below.
In the case of Li- and Na-cryolites, the formation of AlFm6-m dimers bridged via common F
atoms was detected by Raman, NMR spectroscopies [12, 47] and computing methods [19, 35,
48]. In contrast to these systems, in our case, formation of dimeric species was not observed.
The average coordination number around scandium obtained from calculations and NMR
experiments agrees closely and it does not change with the concentration of ScF3. Corradini et
al. [49] compared experimental and simulation data of the molten YCl3-(LiCl-KCl)eut and
LaCl3-(LiCl-KCl)eut mixtures. The average coordination number around a lanthanum ion
chloride melt ranges from 6 to 8. As in our system, the yttrium coordination number remains

11
close to 6 across the concentration range. They propose two possible behaviors of the melt:
either the cation can reduce the number of anions in its coordination shell to remain isolated, or
the individual cations might begin to share anions and have overlapping shells. In other words,
there is an increasing degree of corner and edge-sharing between coordination polyhedra as the
YCl3 or ScF3 concentration increases, leading ultimately to a network structure. They show that
the tendency to increase coordination number is linked to the propensity to form linkages of
different types.
The average coordination number around fluorine atoms increases monotonically in case of
both methods. Our calculation results are fully consistent with our earlier conclusions deduced
from the NMR experimental data.
3.4. Density and electrical conductivity
Density and electrical conductivity are very important properties for industrial applications
of molten salts. Such systems are rarely amenable to experimental measurements due to the
high price of scandium fluoride. To the best of our knowledge, there are no data in the literature
on these physical properties of NaF-ScF3 melts. Thus, to obtain a quantitative estimation of
such systems, we resorted to calculation. The good agreement shown above between
calculations and experiment allows us to present computed parameters here with confidence in
the accuracy of the results.
The electrical conductivity is calculated from MD simulations by taking into account the
correlations of the displacements between the different species, according to the formula:
𝜎 =𝑒2
𝑘𝐵𝑇𝑉lim𝑡→∞
1
6𝑡(|∑ 𝑞𝑖𝛿𝑟𝑖(𝑡)
𝑖
|
2
)
where, e is the elementary charge, T is the temperature, V is the volume of the cubic cell, kB is
the Boltzmann constant, qi is the formal charge of the atom i, and δri(t) is the displacement of
ion i in time t.
Figures 5 and 6 show the variations of the density and electrical conductivity of the NaF–
ScF3 melts with the composition. The density increases with increasing concentration of ScF3
and after 40 mol% it remains almost constant. The conductivity shows an important decrease
up to 40 mol%, and then it rapidly increases. Both physical quantities change their trend at the
eutectic point due to changes of the speciation in the melt. This is consistent with the structural

12
analysis, which shows a decrease in the proportion of free fluoride in the melt and an increase
in the involvement of fluoride in the “polymerization” process. As such, the structure of the
liquids indicates an important decrease of the electrical conductivity and an increase of the
density with composition in NaF–ScF3 due to the network formation. Rollet et al. [51] have
come to the same conclusion in the case of LiF–YF3 system. The authors explain the decrease
of the conductivity with increasing of YF3 concentration by the network formation.
According to Figure 6, the total ionic conductivity, calculated from the molecular dynamics
data, decreases when the ScF3 content is between 5 and 40 mol% then increases again in the
range 40 -70 mol%. The minimum conductivity value is reached for the eutectic concentration
of 38 mol% in ScF3. The evolution of conductivity as a function of ScF3 content shows the same
evolution as the liquidus curve. This behavior can be explained by the fact that total ionic
conductivity is directly dependent on temperature and composition x. The total ionic
conductivity (σ) can be written as a sum of individual contribution of each ion:
𝜎 = ∑ 𝜌𝑖|𝑞𝑖|𝜇𝑖
𝑖
= ∑𝑁𝐴
𝑉𝑚
|𝑞𝑖|𝜇𝑖
𝑖
where ρi, qi and μi are respectively the density number, the charge and the conventional mobility
of the ion of type i. The density number is given by the ratio of the Avogadro number and the
molar volume: NA/Vm. As shown in the above formula, the conductivity obeys to the ratio
𝜇𝑖(𝑇, 𝑥) 𝑉𝑚(𝑇, 𝑥)⁄ and it is given by the comparative growth, in temperature and composition,
between both the molar volume Vm and ionic mobility µi. However, the temperature dependence
of the ionic mobility is in general greater than the thermal expandability, thus, the conductivity
tends to increase with temperature.
In our future work, we plan to investigate the mechanism of the Al metal dissolution in the
NaF– ScF3 melt and to analyze how different anionic species affect this process.
4. Conclusions
The local structure of scandium and fluoride ions was investigated in the molten NaF- ScF3
system by combining HT NMR measurements and molecular dynamics simulations. From 45Sc
high-temperature NMR spectra an average coordination number of 6 has been determined for
the scandium on all domains of composition of 5-70 mol%. The 19F chemical shift evolution
coincides with the existence of at least three types of fluorines: free at infinite dilution, fluorines
connected with one scandium, and bridging fluorines at high ScF3 contents.

13
The anionic structure was calculated for the first time for a wide range of compositions of
NaF-ScF3, and was in agreement with experimental results. The agreement between
experimental and calculated chemical shifts for the three nuclei (19F, 45Sc and 23Na) allows us
to validate the new interatomic potential specially developed for simulating the molten binary
NaF-ScF3 in a wide range of composition (0–70 mol%). The validity of this polarizable ion
model allows us to calculate reliable thermophysical data, such as density and electrical
conductivity. Their evolutions with the ScF3 content are consistent with the structural
description of the molten NaF-ScF3 systems. Analysis of computed data made it possible to
identify the network formation in the melt. This work will open new perspectives for the study
of structural, dynamic and thermodynamic properties of NaF-ScF3 mixtures for the production
of Sc alloys, for which experimental data are lacking.
Acknowledgment
This work was supported by the Ministry of Education and Science of the Russian Federation
No. 02.G25.31.0210 of 27.04.2016. For the calculations, we thank the “Centre de Calcul
Scientifique en region Centre” (Orleans, France). We thank also Dr. M. Salanne and Dr. M.
Pitcher for useful discussions.
References:
[1] A. Kononov, E. Polyakov, High-temperature electrochemical synthesis and properties of
intermetallic compounds of the Ni-Sc system Part 1. Electrochemical behaviour of Sc(III) in
chloride-fluoride melts, J. Alloys Compd. 239 (1996) 103-106. https://doi.org/10.1016/0925-
8388(96)02209-8.
[2] V.V. Zakharov, Kinetics of Decomposition of the Solid Solution of Scandium in
Aluminum in Binary Al-Sc Alloys, Met. Sci. Heat Treat. 57 (2015) 410-414.
http://dx.doi.org/10.1007/s11041-015-9897-z.
[3] S.-I. Fujikawa, M. Sugaya, H. Takei, K.-I. Hirano, Solid solubility and residual resistivity
of scandium in aluminum, J. Less Common Met. 63 (1979) 87-97.
https://doi.org/10.1016/0022-5088(79)90211-X.
[4] R.R. Sawtell, C.L. Jensen, Mechanical properties and microstructures of Al-Mg-Sc alloys,
Metall. Trans. A 21 (1990) 421-430. http://dx.doi.org/10.1007/BF02782422.
[5] A. Suzdaltsev, A. Nikolaev, Y. Zaikov, Modern ways for obtaining Al–Sc master alloys:
A review, Tsvetnye Metally 1 (2018) 69-73. http://dx.doi.org/10.17580/tsm.2018.01.09.
[6] V.N. Rychkov, E.V. Kirillov, S.V. Kirillov, G.M. Bunkov, M.S. Botalov, N.A. Poponin,
A.L. Smirnov, M.A. Mashkovtsev, D.V. Smyshlyaev, Method of reprocessing of wasted

14
scandium-containing solutions from uranium extraction, Patent №2622201, Russian
Federation, (2016).
[7] Y.P. Stangrit, V.P. Yurkinskij, Electrochemical behaviours of scandium in chloride melts,
Zhurnal Prikladnoi Khimii 72 (1999) 1300-1303.
[8] Y. Castrillejo, P. Hernandez, J. Rodriguez, M. Vega, E. Barrado, Electrochemistry of
scandium in the eutectic LiCl-KCl, Electrochim. Acta 71 (2012) 166-172.
http://dx.doi.org/10.1016/j.electacta.2012.03.124.
[9] G.D. Zissi, G.N. Papatheodorou, Changes of vibrational modes upon melting solid
Cs2NaScCl6, Cs3ScCl6, Cs3Sc2Cl9 and ScCl3, Chem. Phys. Lett. 308 (1999) 51-57.
https://doi.org/10.1016/S0009-2614(99)00583-7.
[10] G.D. Zissi, G.N. Papatheodorou, Composition and temperature induced changes on the
structure of molten ScCl3-CsCl mixtures, Phys. Chem. Chem. Phys. 6 (2004) 4480-4489.
http://dx.doi.org/10.1039/B408289C.
[11] M.M. Metallinou, L. Nalbandian, G.N. Papatheodorou, W. Voigt, H.H. Emons, Thermal
analysis and Raman spectroscopic measurements on the scandium iodide-cesium iodide
system, Inorg. Chem. 30 (1991) 4260-4264. http://dx.doi.org/10.1021/ic00022a030.
[12] V. Lacassagne, C. Bessada, P. Florian, S. Bouvet, B. Ollivier, J.-P. Coutures, D. Massiot,
Structure of High-Temperature NaF−AlF3−Al2O3 Melts: A Multinuclear NMR Study, J. Phys.
Chem. B 106 (2002) 1862-1868. https://doi.org/10.1021/jp013114l.
[13] R.E. Thoma, R.H. Karraker, The Sodium Fluoride-Scandium Trifluoride System, Inorg.
Chem. 5 (1966) 1933-1937. http://dx.doi.org/10.1021/ic50045a021.
[14] F.H. Spedding, B.J. Beaudry, D.C. Henderson, J. Moorman, High temperature enthalpies
and related thermodynamic functions of the trifluorides of Sc, Ce, Sm, Eu, Gd, Tb, Dy, Er,
Tm, and Yb, J. Chem. Phys. 60 (1974) 1578-1588. http://dx.doi.org/10.1063/1.1681233.
[15] P.A. Madden, M. Wilson, ‘Covalent’ effects in ‘ionic’ systems, Chem. Soc. Rev. 25
(1996) 339-350. http://dx.doi.org/10.1039/CS9962500339.
[16] F. Hutchinson, M. Wilson, P.A. Madden, A unified description of MCI3 systems with a
polarizable ion simulation model, Mol. Phys. 99 (2001) 811-824.
https://doi.org/10.1080/00268970010022878.
[17] K.T. Tang, J.P. Toennies, An improved simple model for the van der Waals potential
based on universal damping functions for the dispersion coefficients, J. Chem. Phys. 80
(1984) 3726-3741. https://doi.org/10.1063/1.447150.
[18] M. Salanne, P.A. Madden, Polarization effects in ionic solids and melts, Mol. Phys. 109
(2011) 2299-2315. http://dx.doi.org/10.1080/00268976.2011.617523.

15
[19] K. Machado, D. Zanghi, V. Sarou-Kanian, S. Cadars, M. Burbano, M. Salanne, C.
Bessada, Study of NaF–AlF3 Melts by Coupling Molecular Dynamics, Density Functional
Theory, and NMR Measurements, J. Phys. Chem. C 121 (2017) 10289-10297.
http://dx.doi.org/10.1021/acs.jpcc.7b01530.
[20] M. Salanne, C. Simon, P. Turq, P.A. Madden, Calculation of Activities of Ions in Molten
Salts with Potential Application to the Pyroprocessing of Nuclear Waste, J. Phys. Chem. B
112 (2008) 1177-1183. http://dx.doi.org/10.1021/jp075299n.
[21] J.P. Perdew, K. Burke, M. Ernzerhof, Generalized Gradient Approximation Made
Simple, Phys. Rev. Lett. 77 (1996) 3865-3868.
http://dx.doi.org/10.1103/PhysRevLett.77.3865.
[22] G. Kresse, J. Hafner, Ab initio molecular-dynamics simulation of the liquid-metal--
amorphous-semiconductor transition in germanium, Phys. Rev. B 49 (1994) 14251-14269.
https://doi.org/10.1103/PhysRevB.49.14251.
[23] G. Kresse, J. Furthmüller, Efficient iterative schemes for ab initio total-energy
calculations using a plane-wave basis set, Phys. Rev. B 54 (1996) 11169-11186.
https://doi.org/10.1103/PhysRevB.54.11169.
[24] G. Kresse, J. Furthmüller, Efficiency of ab-initio total energy calculations for metals and
semiconductors using a plane-wave basis set, Comput. Mater. Sci. 6 (1996) 15-50.
https://doi.org/10.1016/0927-0256(96)00008-0.
[25] S. Grimme, J. Antony, S. Ehrlich, H. Krieg, A consistent and accurate ab initio
parametrization of density functional dispersion correction (DFT-D) for the 94 elements H-
Pu, J. Chem. Phys. 132 (2010) 154104. http://dx.doi.org/10.1063/1.3382344.
[26] N. Marzari, D. Vanderbilt, Maximally localized generalized Wannier functions for
composite energy bands, Phys. Rev. B 56 (1997) 12847-12865.
https://doi.org/10.1103/PhysRevB.56.12847.
[27] R.J. Heaton, R. Brookes, P.A. Madden, M. Salanne, C. Simon, P. Turq, A First-
Principles Description of Liquid BeF2 and Its Mixtures with LiF: 1. Potential Development
and Pure BeF2, J. Phys. Chem. B 110 (2006) 11454-11460.
https://doi.org/10.1021/jp061000+.
[28] G.J. Martyna, M.L. Klein, M. Tuckerman, Nosé–Hoover chains: The canonical ensemble
via continuous dynamics, J. Chem. Phys. 97 (1992) 2635-2643.
https://doi.org/10.1063/1.463940.
[29] G.J. Martyna, D.J. Tobias, M.L. Klein, Constant pressure molecular dynamics
algorithms, J. Chem. Phys. 101 (1994) 4177-4189. https://doi.org/10.1063/1.467468.

16
[30] L. Verlet, Computer "Experiments" on Classical Fluids. I. Thermodynamical Properties
of Lennard-Jones Molecules, Phys. Rev. 159 (1967) 98-103.
http://dx.doi.org/10.1103/PhysRev.159.98.
[31] C.J. Pickard, F. Mauri, All-electron magnetic response with pseudopotentials: NMR
chemical shifts, Phys. Rev. B 63 (2001) 245101.
http://dx.doi.org/10.1103/PhysRevB.63.245101.
[32] J. Clark Stewart, D. Segall Matthew, J. Pickard Chris, J. Hasnip Phil, I.J. Probert Matt,
K. Refson, C. Payne Mike, First principles methods using CASTEP, Z. Kristallogr. 220
(2005) 567-570. https://doi.org/10.1524/zkri.220.5.567.65075.
[33] J.R. Yates, C.J. Pickard, F. Mauri, Calculation of NMR chemical shifts for extended
systems using ultrasoft pseudopotentials, Phys. Rev. B 76 (2007) 024401.
https://doi.org/10.1103/PhysRevB.76.024401.
[34] H.J. Monkhorst, J.D. Pack, Special points for Brillouin-zone integrations, Phys. Rev. B
13 (1976) 5188-5192. http://dx.doi.org/10.1103/PhysRevB.13.5188.
[35] K. Machado, D. Zanghi, M. Salanne, V. Stabrowski, C. Bessada, Anionic Structure in
Molten Cryolite–Alumina Systems, J. Phys. Chem. C 122 (2018) 21807-21816.
http://dx.doi.org/10.1021/acs.jpcc.8b06905.
[36] K. Machado, D. Zanghi, M. Salanne, C. Bessada, Structural, Dynamic, and
Thermodynamic Study of KF–AlF3 Melts by Combining High-Temperature NMR and
Molecular Dynamics Simulations, J. Phys. Chem. C (2019) in press.
http://dx.doi.org/10.1021/acs.jpcc.8b11907.
[37] A. Rakhmatullin, I.B. Polovov, D. Maltsev, M. Allix, V. Volkovich, A.V. Chukin, M.
Boča, C. Bessada, Combined Approach for the Structural Characterization of Alkali
Fluoroscandates: Solid-State NMR, Powder X-ray Diffraction, and Density Functional Theory
Calculations, Inorg. Chem. 57 (2018) 1184-1195.
http://dx.doi.org/10.1021/acs.inorgchem.7b02617.
[38] C. Bessada, A.-L. Rollet, A. Rakhmatullin, I. Nuta, P. Florian, D. Massiot, In situ NMR
approach of the local structure of molten materials at high temperature, C.R. Chim. 9 (2006)
374-380. http://dx.doi.org/10.1016/j.crci.2005.06.007.
[39] A.-L. Rollet, A. Rakhmatullin, C. Bessada, Local Structure Analogy of Lanthanide
Fluoride Molten Salts, Int. J. Thermophys. 26 (2005) 1115-1125.
http://dx.doi.org/10.1007/s10765-005-6688-6.
[40] O. Pauvert, M. Salanne, D. Zanghi, C. Simon, S. Reguer, D. Thiaudière, Y. Okamoto, H.
Matsuura, C. Bessada, Ion Specific Effects on the Structure of Molten AF-ZrF4 Systems (A+=

17
Li+, Na+, and K+), J. Phys. Chem. B 115 (2011) 9160-9167.
http://dx.doi.org/10.1021/jp203137h.
[41] C. Bessada, A. Rakhmatullin, A.-L. Rollet, D. Zanghi, Lanthanide and actinide
speciation in molten fluorides: A structural approach by NMR and EXAFS spectroscopies, J.
Nucl. Mater. 360 (2007) 43-48. http://dx.doi.org/10.1016/j.jnucmat.2006.08.012.
[42] A.K. Tyagi, J. Köhler, P. Balog, J. Weber, Syntheses and structures of Li3ScF6 and high
pressure LiScF4, luminescence properties of LiScF4, a new phase in the system LiF–ScF3, J.
Solid State Chem. 178 (2005) 2620-2625. http://dx.doi.org/10.1016/j.jssc.2005.04.038.
[43] A. Bohnsack, G. Meyer, Ternäre Halogenide vom Typ A3MX6. IV. [1]. Ternäre
Halogenide des Scandiums mit Natrium, Na3ScX6 (X = F, Cl, Br): Synthese, Strukturen,
Ionenleitfähigkeit, Z. Anorg. Allg. Chem. 622 (1996) 173-178.
http://dx.doi.org/10.1002/zaac.19966220125.
[44] J.C. Champarnaud-Mesjard, B. Frit, KScF4: A New ABX4 Octahedral cis-trans Layered
Structure., Eur. J. Solid State Inorg. Chem. 29 (1992) 161-170.
https://doi.org/10.1002/chin.199221005.
[45] S. Turrell, M. Toussaint, G. Turrell, J.C. Champarnaud, G. Cuveiller, Spectroscopic
studies of mixed hexa-hepta scandium fluorides, J. Mol. Struct. 143 (1986) 121-124.
http://dx.doi.org/10.1016/0022-2860(86)85219-X.
[46] Y. Ai, D. Tu, W. Zheng, Y. Liu, J. Kong, P. Hu, Z. Chen, M. Huang, X. Chen,
Lanthanide-doped NaScF4 nanoprobes: crystal structure, optical spectroscopy and
biodetection, Nanoscale 5 (2013) 6430-6438. http://dx.doi.org/10.1039/C3NR01529G.
[47] E. Robert, V. Lacassagne, C. Bessada, D. Massiot, B. Gilbert, J.P. Coutures, Study of
NaF−AlF3 Melts by High-Temperature 27Al NMR Spectroscopy: Comparison with Results
from Raman Spectroscopy, Inorg. Chem. 38 (1999) 214-217.
http://dx.doi.org/10.1021/ic980677b.
[48] T. Bučko, F. Šimko, Effect of alkaline metal cations on the ionic structure of cryolite
melts: Ab-initio NpT MD study, J. Chem. Phys. 148 (2018) 064501.
http://dx.doi.org/10.1063/1.5017106.
[49] D. Corradini, P.A. Madden, M. Salanne, Coordination numbers and physical properties
in molten salts and their mixtures, Faraday Discuss. 190 (2016) 471-486.
http://dx.doi.org/10.1039/C5FD00223K.
[50] G.J. Janz, G.L. Gardner, U. Krebs, R.P.T. Tomkins, Molten Salts: Volume 4, Part 1,
Fluorides and Mixtures Electrical Conductance, Density, Viscosity, and Surface Tension
Data, J. Phys. Chem. Ref. Data 3 (1974) 1-115. http://dx.doi.org/10.1063/1.3253134.

18
[51] A.-L. Rollet, M. Salanne, H. Groult, Structural effects on the electrical conductivity of
molten fluorides: Comparison between LiF–YF3 and LiF–NaF–ZrF4, J. Fluorine Chem. 134
(2012) 44-48. https://doi.org/10.1016/j.jfluchem.2011.04.002.

19
Figure Captions:
Figure 1. The 19F NMR spectra of NaF–ScF3 melts.
Figure 2. NMR chemical shift evolution for 19F (left) and for 23Na, 45Sc (right) in NaF–ScF3.
The calculated (full markers) and experimental (empty markers) chemical shifts are shown.
Figure 3. Scandium atomic fraction of: ScF4- (); ScF5
2- (●); ScF63- (▲); ScF7
4- (▼), ScF85-
(♦), and average coordination (★) as a function of concentration of ScF3 in the molten NaF-
ScF3 system.
Figure 4. Fluor atomic fraction of: free fluorine (), terminal fluorine F-Sc (●), bridged fluorine
Sc-F-Sc (▲), three bridged fluorine (▼), and average coordination (★) varying concentrations
of ScF3 at molten state.
Figure 5. Evolution of calculated (■) and experimental (●) [50] density as a function of mol%
ScF3 in the molten state.
Figure 6. Electrical conductivity of molten the NaF–ScF3 mixtures as a function of the mol%
of ScF3 at 10 °C above melting point obtained by MD simulations.

20
Fig.1
Fig.2
Fig.3
-240-160-800
mol% ScF3
70605040302520100
T=Tmelt + 10 C
δ19F(ppm)
0 10 20 30 40 50 60 70-20
-10
0
10
20
3023Na Exp. 45Sc Exp.23Na Calc. 45Sc Calc.
d 2
3N
a,
45S
c (
pp
m)
mol% ScF 3
0 10 20 30 40 50 60 70 80-240
-200
-160
-120
-80
-40
0
Experimental
Calculated
d1
9F (
pp
m)
mol% ScF 3
free
bridged
terminal
0 10 20 30 40 50 60 70
0
20
40
60
80
100
Sc
an
diu
m A
tom
ic F
rac
tio
ns
(%
)
% mol ScF3
ScF4
ScF5
ScF6
ScF7
ScF8
4
5
6
7
8
Av
era
ged
co
ord
inati
on

21
Fig.4
Fig.5
Fig.6
0 10 20 30 40 50 60 70
0
20
40
60
80
100
Flu
or
Ato
mic
Fra
cti
on
s (
%)
% mol ScF3
Free F-Sc F-2Sc F-3Sc
0
1
2
3
Avera
ged
co
ord
inati
on
0 10 20 30 40 50 60 70
2.0
2.2
2.4
2.6
De
ns
ity
(g
/cm
3)
% mol ScF3
0 10 20 30 40 50 60 70
100
200
300
400
Ele
ctr
ical C
on
du
cti
vit
y (
S/m
)
% mol ScF3