Study of the C search.pdfC.O.P. of steam jet refrigeration unite as compared to Absorption...
83
Study of the C.O.P. of steam jet refrigeration unit as compared to vapor compression unit A Thesis Submitted to Al-Nahrain University College of Engineering in Partial Fulfillment of The Requirements For The Degree of Master of Science in Mechanical Engineering By Ahmed Jameel Hamod Al-Zaidy (B.Sc.2001) Safar 1425 April 2004
Transcript of Study of the C search.pdfC.O.P. of steam jet refrigeration unite as compared to Absorption...

Study of the C.O.P. of steam jet refrigeration unit as compared to
vapor compression unit
A Thesis
Submitted to Al-Nahrain University College of Engineering in
Partial Fulfillment of The Requirements For The Degree of
Master of Science in Mechanical Engineering
By
Ahmed Jameel Hamod Al-Zaidy (B.Sc.2001)
Safar 1425 April 2004

Certification
I certify that the preparation of this thesis entitled “Study of the C.O.P.
of steam jet refrigeration unite as compared to Absorption system”, was
prepared by Engineer Ahmed Jameel Hamod Al Zaidy, under my supervision
at Al Nahrain University in partial fulfillment of the requirements for the
degree of Master of Science in Mechanical Engineering.
Signature:
Name: Dr. Adnan A. Al-Qalamchi
Date: / /2004
Signature:
Name:
Head of Department
Date: / /2004

We certify that we have read this dissertation entitled “Study of the
C.O.P. of steam jet refrigeration unite as compared to Absorption system”,
and as an examining committee, examined the student in it’s contents and that
in our opinion it meets the standard of a dissertation for the degree of Master
of Science in Mechanical Engineering.
Signature: Signature:
Name: Dr.Adnan A.Al-Qalamchi Name:
(Supervisor) (Chairman)
Date: / /2004 Date: / /2004
Signature: Signature:
Name: Name:
(Member) (Member)
Date: / /2004 Date: / /2004
Approved by the Dean of the College of Engineering:
Signature:
Name: Prof.Dr.Fuzzy
(Dean of Engineering College) Date:
/ /2004

Acknowledgment In the name of ALLAH, The gracious the all merciful
Praise to ALLAH for providing me the willingness and
strength to accomplish this work.
It is pleasure to record my indebtedness to my supervisor
Dr.Adnan Al-Qalamchi for his help during this work and for the
chance he gave me to enter to the world of Study of the C.O.P. of
steam jet refrigeration unite as compared to Absorption system.
Very special thanks are due to my father for his help and encouragement. Special words of thanks and deepest gratitude are presented to my
mother for her patience and compassion during this work.
My thanks also extended to the head and staff members of the
department of Mechanical engineering for all the facilities offered.
Thanks are expressed to all my friends especially to Engineer Ali
Hussain, Saif, Fady, Sinan, Husam.
Finally, special thanks are devoted to my family for their care
during this work.
Ahmed Jameel Hamod Al-Zaidy
April 2004
Abstract
The present study has been carried out to investigate the performance
of the steam jet refrigeration system at various operating conditions, and to
compare the C.O.P. results with that of Absorption system.
The study includes design analyses of the ejector performance. The
performance enhancement options and desired ejector geometry are also
examined. The coefficients of performance for a simple ejector was found to
range between (0.5 to 1.168) for the cooling mode and (1.5 to 2.168) for the
heating mode at a sample operating condition in which the boiler temperature
varies between (100-150oC), Condenser temperature between (45-60oC),
and evaporator temperature between (3-9oC).
Theoretical comparison of the C.O.P. was made between the Steam jet
refrigeration system and Absorption system. The results show that the C.O.P.
of the two systems decreases with condenser temperature rise, but the C.O.P.
of the former system is larger than that of the second, and the C.O.P. of the
former was found to decrease with evaporating temperature rise, while the
C.O.P. of the second system increase.
For the steam jet refrigeration system it was found that the secondary
vapor mass flow rate increases with increasing boiler temperature and ejector
throat area, and it decrease when condensing and evaporating temperatures
increases.

The study revealed that with larger ejector throat area the secondary
vapor mass flow rate becomes higher giving rise to system capacity at a given
set of conditions.
Contents
Abstract I
Contents II
Nomenclatures V
Chapter one: Introduction 1
Chapter two: Literature survey 5
Chapter three: Theoretical Analysis 19
3.1 Introduction 19
3.2 Description of the model 20
3.2.1 Evaporator 20
3.2.2 Condenser 23
3.2.3 Boiler 24
3.2.4 Steam-jet ejector 25
3.3 General Assumptions 27
3.4 Design considerations 27
3.4.1 Nozzle 28
3.4.2 Ejector suction opening and suction chamber 29
3.4.3 Mixing section 30
3.4.4Constant area section 30
3.4.5 Subsonic diffuser 31
3.5 Controls 32
3.6 Analysis of system components 33
3.6.1Ejector efficiency 33

3.6.2 Optimum ejector analysis 35
3.6.3 Ideal cycle performance 42
3.6.4 Non-ideal cycle calculations 43
Chapter four: Results and Discussion 47
4.1 The variation of the system characteristics with boiler temperature
with different throat areas. 47
4.1.1 Effect of boiler temperature on primary
vapor flow rate. 47
4.1.2 Effect of the boiler temperature on secondary
vapor flow rate. 49
4.1.3 Effect of the boiler temperature on the
cooling Coefficient of performance. 51
4.1.4 Effect of the boiler temperature on the
system capacity . 53
4.1.5 Effect of the boiler temperature on the
heating Coefficient of performance . 54
4.2 The variation of the system characteristics
with condenser temperature at different throat areas. 56
4.2.1 Effect of the condenser temperature on
the evaporator mass flow rate. 56
4.2.2 Effect of the condenser temperature on
the cooling coefficient of performance. 58
4.2.3 Effect of the condenser temperature
on the heating Coefficient of performance. 60
4.2.4 Effect of the condenser temperature on
the system capacity. 61
4.3 The variation of the system characteristics
with evaporator temperature for the variation throat areas. 63
4.3.1 Effect of the evaporator temperature on
the evaporator flow rate. 63 4.3.2 Effect of the evaporator temperature
on the cooling Coefficient of performance. 65
4.4 Comparison of the Coefficients of performance between the Steam jet
refrigeration system and the Absorption system with condenser
temperature. 66
4.5 Comparison of the Coefficients of performance between the Steam jet
refrigeration system and the Absorption system with evaporator
temperature. 67
Chapter five: Conclusions and Recommendations for future work
5.1 Conclusions 69
5.2 Recommendations for future work 70
References 71
Appendix A: Table of results A-1
Appendix B: Sequence of steps for the Mat lab program B-1
Appendix C: Absorption system C-1

Nomenclature
Symbol Definition Units
A Area 2m
thA Throat area 2m
2A Diffuser throat area 2m
a Velocity of sound sm
cPOC ... Cooling Coefficient of performance
hPOC ... Heating Coefficient of performance
pC Specific heat at constant pressure CkgkJ o.
E Total energy kJ
e Total energy per unit mass kgkJ
g Acceleration of gravity 2sm
h Enthalpy kgkJ
oh Enthalpy of the Saturation motive flow kgkJ
th Stagnation enthalpy kgkJ
1h Exit nozzle enthalpy kgkJ
sh1 Isentropic Exit nozzle enthalpy kgkJ
2h Enthalpy at diffuser throat area kgkJ
3h Enthalpy of Saturation steam at
Condenser temperature
kgkJ
3′h Ideal condenser enthalpy kgkJ
4h Enthalpy of Saturation steam
Evaporator
kgkJ
5h
Enthalpy of the Saturation liquid at
condenser temperature
kgkJ
7h Enthalpy of the Saturation liquid at
evaporator temperature
kgkJ
k Isentropic exponent
..EK Kinetic energy kJ
M Mach number
2M Mach number at Diffuser throat area
m& Mass flow rate skg
om& Motive Mass flow rate skg
4m& Secondary Mass flow rate skg
P Pressure Pa
..EP Potential energy Pa
bP Saturation Boiler pressure Pa
eP , , evP 4P Saturation Evaporator pressure Pa
tP Stagnation pressure Pa
1P Exit nozzle pressure Pa
2P Pressure at Diffuser throat area Pa
3P Saturation condenser pressure Pa
Q Capacity kJ
R Gas constant KkgJ .
os Boiler entropy KkgJ .
3s Condenser entropy KkgJ .

4s Evaporator entropy KkgJ .
T Temperature Co
bT Saturation Boiler temperature Co
cT ,T con Saturation Condenser temperature Co
eT ,T ev Saturation Evaporator temperature Co
tT Stagnation temperature Co
1T Exit nozzle temperature Co
2T Temperature at Diffuser throat area Co
3′T Ideal condenser temperature Co
t Time s
U Internal energy kJ
u Internal energy per unit mass kgkJ
V Velocity sm
2V Fluid velocity at diffuser throat area sm
2v Specific volume at diffuser throat area kgm3
W Work kJ
z Head m ρ Density 3mkg
dη Diffuser efficiency
Eη Ejector efficiency
nη Nozzle efficiency
∀ Volume 3m

Chapter one
Introduction
Air-conditioning and refrigeration equipment play very important role
in modern human life. The utilization of these equipment in homes, buildings,
vehicles, and industries provides for living comfort and necessary means for
industrial production.
However, the large amount of energy consumed by this equipment
consequently becomes a serious problem to be solved. Thus it is desirable to
seek a new technique, which can effectively and economically use heat such
as oil and coal as an energy source to directly power airconditioning and
refrigeration system and can operate at relatively low temperature, and has
very stable performance characteristics. Recent investigations have shown
that it appears to be a favored choice for this purpose. The steam or vapor jet
refrigerant system is one of such systems.
For many years ejectors have been used extensively in power
generating plants and have found wide application in the chemical industries.
In power plant practice they are used principally in exhausting air from
condensers and in priming pumps. In the chemical industries they are utilized
in vacuum evaporation, filtration, compressing air for agitation, and in
pumping of liquid and gases. During the early 1930’s, ejectors had been used
in steam jet refrigeration units for air conditioning large buildings, and for
industrial uses such as the chilling of water to moderate temperatures in
process industries. [1]

The design of jet refrigeration system is similar to that of conventional
vapor-compression system except that the mechanical compressor is replaced
by a thermal compressor, which is usually, called an “ejector”.
The jet refrigeration system consists of four basic components: -
1- An ejector
2- An evaporator,
3- A generator,
4- A condenser. Figure (1-1) shows such a system
Figure (1-1) Schematic diagram of jet refrigeration system.
Q
Ejector Con
Generator
Q
Q
The ejector is the heart of the jet refrigeration system. The
characteristics of this component have a major effect on the operating cost of
the system, and the size of both condenser and generator. Ejector is a pump
having no moving parts and utilizing fluids in motion under controlled
condition. Specifically, motive power is provided by a high pressure stream of
fluid directed through a nozzle designed to produce the highest possible
velocity.

The resultant jet of high-velocity fluid creates a low-pressure area in
mixing chamber causing the suction fluid to flow into this chamber. Ideally,
there is an exchange of momentum at this point producing a uniformly mixed
stream traveling at a velocity intermediate to the motive and suction velocity.
The diffuser is shaped to reduce the velocity gradually and convert the energy
to pressure at the discharge with as little loss as possible. The three basic parts
of any ejector are the nozzle, the mixing section, and the diffuser.
Ejectors may be classified on the basis of the conditions maintained in
the mixing section. It is customary in the design of ejectors to assume either
that:
• Mixing occurs at constant area with rising static pressure.
• Mixing occurs at constant static pressure in a converging section.
Generally, experience indicates the design based on the second
assumption is substantially correct and if any slight increase in the static
pressure results from mixing, the ejector performance will be better by the
amount of this increase [2]. In this study the second assumption is considered.
Also, the analytical results indicate that constant-pressure mixing yields
results superior to those obtained with constant-area mixing [2].
The evaporator is usually a large volume vessel, which must provide a
large water surface area for efficient evaporative cooling action. Water sprays
and cascading water in sheets are two common means of maximizing water
surface.
The steam generator can provide the primary or motive steam that is
needed to drive the system, i.e. providing the pressure, temperature and flow
rate of the motive steam.
The condenser can be one of three basic types, a conventional surface
condenser, an evaporative condenser and a barometric condenser.

As heat is added to the generator, the steam at fairly high temperature
and pressure called primary or actuating steam is evolved and enters the
ejector. By expansion through the nozzle inside the ejector, supersonic flow at
low pressure is formed at the exit of the nozzle and has the secondary vapor
entrained from the evaporator. The primary and the secondary vapors then
mix with each other at the mixing section and enter the constant-area. An
aerodynamic shock is induced to create a major compression effect.
Further compression of the mixture to the back pressure of the ejector
can be achieved as it passes through the subsonic diffuser section. By this
process in the ejector, the refrigerant vapor, which acts as the secondary
vapor, is compressed aerodynamically from the lower pressure at the
evaporator to the higher pressure at the condenser.
The inflow of the internal energy associated with the primary vapor
serves as the energy input required for the compression operation. To obtain a
cooling effect, part of the refrigerant condensate in the condenser is allowed
to expand in the evaporator to absorb heat from the environment. The rest is
recirculated to the generator by a liquid circulation pump to complete a cycle.
[3]
In Iraq the heat energy is available in large amount and cheap cost, in
time that the electric energy is expensive and not continuously available when
needed. Therefore the use of airconditioning equipment, which depends
directly on, the heat energy is important and can over come troubles resulting
from electrical energy dependence. The heat energy depending system is the
steam jet refrigeration system.
The performance of jet refrigeration system can be accurately
calculated by use of the method of system analysis only when the
performance characteristics of each component in the system are all clearly
understood. The coefficient of performance of the system is compared with an
equivalent system like Absorption system.
Chapter two
Literature survey
The literature survey considered in this chapter shall cover works
obtained on the design and performance of steam jet refrigeration system and
the ejector.
A one-dimensional analysis of the mixing of two gas streams involving
the application of the equations of continuity, momentum, and energy to the
design of ejector was investigated by Flugel [3]. The mixing at constant area
and at constant pressure was considered, but the published results of his
calculations were meager.
Keenan and Neumann [4] applied the same method of analysis to
ejectors with large ratios of mixing-tube area to the nozzle throat area and
relatively small ratios of nozzle-inlet pressure to suction pressure. The object
of their investigation, was to select the simple form of ejector which would
perform in useful fashion, to analyze its performance as nearly independently
of data on ejectors as possible, to compare the actual performance with that
predicted analytically, and not to devise a new type of ejector. The results
showed that:

1. When the ejector is serving as a blower, constant-area mixing is better
than constant-pressure mixing because it gives higher flow ratio as
shown in fig (2-1), except for area ratio less than 10
2. Experiments on the simple ejector showed that:
i) The best position of the exit of the nozzle is only a short distance
upstream from the throat of the diffuser.
ii) The best length of the mixing tube is slightly greater than 7
diameter.
05
101520253035404550
0 250 500 750 1000 1250Area of mixing tube / Area of nozzle throat
Indu
ced
flow
Ac
tuat
ing
flow
constant-areamixingconstant-preassuremixing
Fig (2-1) Performance of ejector
The flow ratio of induced-to-actuating fluid increases rapidly with the
ratio of mixing-tube area to nozzle-throat area, and decreases with increase in
the ratio of supply pressure to suction pressure, as shown in fig. (2-2).

Ş
č
ş
ş
Ć
Ć
ć
ć
Č
Ş Č Ş Ş ş Ć ş đ
Mixing tube area / ©BpBzzKKzzzKzUzzKK
SupçzzpressurezUzqqzUn pressuzKzUzqqč !
đ !
Fig (2-2) Flow ratio to Area ratio
Elrod [5] extended an ejector theory, which has previously been
confirmed by the experiments of others. A new theoretical criterion of ejector
performance and a new equation for ejector design included a calculation of
optimum area ratios and optimum flow ratios were derived.
The optimum area ratio was devised by maximizing the induced mass
flow subject to equations of conservation of mass, energy and momentum in
the actuating nozzle, mixing tube and diffuser, which yield the following
equation:
( ) ( )( ) 1
1lnln11
2
2
2
22
3
222 =
−+
−−
PPK
vdvTd
TTM
odη
Where:
=2M Mach number at inlet of the subsonic diffuser.
=dη Diffuser efficiency.
2T = Temperature at inlet of the subsonic diffuser, K
=3T Temperature at exit of the subsonic diffuser obtained with isentropic
compression, K

=2v Specific volume at inlet of the subsonic diffuser, ( ) kgm /2
=K Specific heat ratio at the subsonic diffuser.
=2PPo Ratio of suction pressure to diffuser inlet pressure.
This equation was then combined with the equation of conservation of
momentum in the mixing tube to produce,
−
+=
323
222
2
112 1
PPPP
MkP
gvma
o
Where:
Cross-section area at inlet of the subsonic diffuser, =2a 2m
Mass flow rates of the actuating fluid,=1m skg
Actuating velocity at the nozzle, =1v sm
=23 PP Ratio of pressure at the diffuser exit to pressure at inlet of
the diffuser.
=3PPo Ratio of suction pressure to diffuser exit pressure.
From which the value 23
222 1PP
Mk + is a function of ( 3PPo ), which is
tabulated by Elrod [5] and plotted by Chem [6], as shown in (fig. (2-3) A and
0
0.5
1
1 1.1 1.2 1.3 1.4 1.5 1.6 1.7 1.8 1.9 2
P3/P2
Po
P3
K2=1.1
1.2
1.3
1.4

(2-3) B) to get its optimum value to be used in this to determine the optimum
area, which is in agreement very well with the theoretical curves of Keenan
and Neumann [4], as mentioned before.
Fig (2-3) A
0
0.5
1
1 1.1 1.2 1.3 1.4 1.5
Po
P3
K2=1.11.21.31.4
2
Keenan et al. [7] mad
the comparison of analytical
variables than that presented
in this investigation are alm
referred to as constant-pressu
as a working fluid.
23
122
PP
Mk +
Fig (2-3) B
e an investigation consisting of an extension of
and experimental results for a greater range of
in reference [4]. The calculated results presented
ost wholly confined to special cases, which are
re mixing. Air was used for the experimentation
The authors found that: - 1- For the analytical conditions considered, better performance can be
obtained when constant-pressure mixing is employed.
2- The total length from the nozzle exit to the entrance to the subsonic
diffuser for best performance is nearly constant when the mixed stream
is supersonic. The ratio of this total length to the minimum diameter is
a weak function of the ratio of the nozzle inlet pressure to the suction
pressure.
3- By comparison of a few experiments with the analytical results it is
possible to design ejectors to accomplish a given purpose. A method
for ejector design was also presented.
An attempt has been made by Engle [8] to present some of the latest
developments in the design and operation of jet pumps. The design theory
developed is based on the momentum exchange between motive and suction
fluid and the assumption that entrainment occurs at constant-pressure and
mixing at constant area.
Results showed that the nozzle was in its optimum position when it
reached up to the mixing tube. For this condition the optimum mixing tube
length was seven tube diameters as mentioned in ref [4] and the entry profile
was found not to affect the operation.
In Gupta and Singh [9] studies, two theoretical models, one based on
the momentum transport approach and the other on purely thermodynamic
considerations, are presented for the design of single stage, single fluid
(steam) ejector with constant pressure mixing. The results are compared with
the design chart presented by Ludwig [10] as shown in fig. (2-4). The results
showed that for 90.7 kg/hr of suction steam at 17.78 cm Hg.abs. Suction

pressure, the first model gave a motive steam requirement of 349 kg/hr, which
compares favorably with the value of 272 kg/hr [10], whereas the
corresponding figure of 156 kg/hr based on the second model is much lower.
10
100
1000
0 1 2 3 4 5 6 7 8 9 10 11
Ejector suction pressure(in
Ejector capacity
Gupta
Ludwig
9.0
75.0
=
=
ηη
d
n
Fig (2-4) Ejector capacity with ejector suction pressure
Therefore it was concluded that the first model gives design parameters
in close agreement with those obtained from available design charts which are
largely empirical in nature.
To study the effect of molecular weight of on the performance of
ejectors, Lincoln and Vincent [11] made an experimental study used vapors
with molecular weights from 18 to 154 in two commercially manufactured
ejectors, each design for a different ratio of compression and of a size suitable
for laboratory experimentation. They are each of the single nozzle and
circular in cross section. It was concluded that: -
1-The variation of suction pressure with both boiler and exhaust pressure is
ployed, is the same for all vapors at a
-The factors inherent in an ejector refrigeration cycle indicate that, to be
lumbus and Ohio [12], involving
pumpi
approximately the same for all vapors, irrespective of no entrainment. The
suction pressure decreases with increasing boiler pressure and fixed exhaust
pressure at a variable rate down to the critical pressure ratio and then
continues to decrease at a constant rate until a minimum suction pressure is
attained, which is approximately the same for all vapors; beyond this point
the suction pressure increases with increasing boiler pressure.
2-The weight ratio of suction vapor em
given ratio of pressure, boiler to exhaust pressures, when this ratio is fixed,
the efficiency of expansion, entrainment, and compression in any ejector is
the same for all vapors.
3
highly efficient from a thermal standpoint, a system should have low
molecular weights in a favorable molecular weight ratio, it should employ
a boiler fluid with a low heat input requirement, with a relatively large
pressure differential (exhaust pressure-suction pressure) and with a boiling
point higher than that of the evaporator fluid, and it should use an
evaporator fluid with a high latent heat.
A research was made by Holton, Co
ng 13 pure gases and 12 mixtures of gases with small commercial
single and two-stage steam-jet ejectors supplied by two manufacturers.
Results were calculated in terms of “entrainment ratio”, which is the ratio of
the flow rate of gas to that of air under similar conditions. Entrainment ratios

were found to be a function of the molecular weight of the gases handled and
were plotted as a smooth curve as shown in fig. (2-5), which is independent of
pressure, design characteristics of ejectors, and is applicable to mixture of
gases. The single smooth curve passes equally well through entrainment-ratio
values obtained with both ejectors. Thus, the conclusion is reached that the
curve may reasonably be used to predict results obtainable with any ejector
system.
Fig. (2-5) Entrainment ratio as a function of molecular weight for pure gases
0
0.4
0.8
1.2
1.6
0 20 40 60 80 100 120 140
Molecular weight,LB per Mol
Entra
inm
ent r
atio
Ejector AEjector B
2
and for mixtures of gases tested with two ejectors [Ref.12]
same ejectors [12] were used by Holton and Schulz [13] to study The
the effect of temperature of entrained fluid on the performance of ejectors
handling air and steam. The flow rate of air was calculated using the
following formula recommended by HEI. [14]
−
−
×=+ kk
I
x
k
I
x
I
It
PP
PP
kk
RTCPA
m12
19.14182&
In which

=m& Mass flow rates, .
roat .
nce, in Hg at 32 F.
G er (lb) (R).
S
The results are expressed in terms of “Entrainment ratio”, which is the
hrIb /
Area of nozzle th 2in=tA ,
Nozzle coefficient of discharge. =C
Absolute pressure at nozzle entra=IP
Static pressure at nozzle outlet, in Hg. abs. =xP
as constant for fluid being handled, ft. lb p=R
Absolute temperature at nozzle entrance, R. =IT
pecific heat ratio. =k
ratio of the flow rate of gas at a given temperature to that of the same gas at a
base temperature. Entrainment-ratio was found to be a linear function of
temperature as shown in fig. (2-6).
0.70.75
0.80.850.9
0.951
0 200 400 600 800 1000Gas temp.F
Entrainment r
Steam
Air
Fig. (2-6) Entrainment ratio as a linear function of temperature for air and
The test result of pressure and of
design
thought to be applicable to any ejector system.
steam with three ejectors. [Ref.13]
s given appear to be independent
characteristics of the ejectors tested. Therefore the plot of the variation
of entrainment ratio with temperature is, within the limits of the accuracy,

Kastener and McGarry [15] studied the performance of an air ejector
experimentally. The trails to determine the variation of the induced flow with
the actuating flow, for the low actuating velocities (30.5 m or 61 m per second
or less) and mixing angle of 2½ degree, observed that the relationship
between actuating and suction velocities was very nearly a straight line as
shown in fig. (2-7), and the ratio of the suction mass flow to the actuating
mass flow plotted against the ratio of delivery pressure to suction pressure, for
the same mixing angle. It showed that this mass ratio is approximately
constant as shown in fig. (2-8).
0
3
6
9
12
0 10 20 30 40 50
Actuating velocity(m /se
Suction vel
Series1Series2
Fig. (2-7) Typical relationship between actuating and suction velocity. 2½
deg. Mixing angle [Ref.14].

0.2
0.3
1 1.005Pressure r
Mass rat
Fig. (2-8) Mass ratio versus pressure ratio. [Ref.14] 2½ deg. Mixing angle.
Dotterweich and Mooney [16] discussed the design, performance and
application of the ejector in gas mixing in the natural gas industry, to entrain
low-pressure gas into a stream of high-pressure gas, which must be reduced in
pressure principally along delivery points in natural gas transmission line
operation.
J.R. Lines of Graham Manufacturing Co. [17], Inc. attempted to show
the effects on an ejector system when various operating parameters were
modified in order to improve vacuum column cut point. Ejector system design
was directly impacted by cut point set for the atmospheric column that
precedes a vacuum column. It was noted that increasing cut point for the
atmospheric column results in added stripping steam to the vacuum column,
consequently, a larger ejector system is required. It was showed that by
decreasing flash zone pressure within the vacuum column, whereby the
column top pressure was reduced, overall utility consumption and capital cost
for a revamped ejector system were favorably reduced.
For the purposes of the approach adopted herein the author have made
the following process assumptions:
1. That the vacuum column diameter and mass transfer capabilities do not
restrict performance.
2. That column over-head discharge diameter is not limiting column
effluent capacity.
3. That modern tower internals for low-pressure drop are the basis for
establishing flash zone and tower top pressure.
Fang C.Cen, Cheng-Tsang HSU [18] were studied the performance of
ejector heat pumps. This paper applies the existing ejector theory to estimate
the performance of an ejector heat pump system at various operating
conditions. The study includes parametric, sensitivity and off- design analyses
of the heat pump performance. The performance enhancement options and
desired ejector geometry are also examined.
G. R. Martin, J. R. Lines and S. W. Golden [19] were studied the
understand vacuum-system fundamentals. They were the Crude vacuum unit
heavy vacuum gas-oil (HVGO) yield was significantly impacted by ejector-
system performance, especially at conditions below 20 mmHg absolute
pressure. A deep cut vacuum unit, to reliably met the yields, calls for proper
design of all the major pieces of equipment. Understanding vacuum ejector
system impacts, plus minimizing their negative effects equals maximum gas
yield. Ejector-system performance could be adversely affected by poor
upstream process operations.
The impacts of optimum ejector performance were more pronounced at low
flash-zone pressures. Gas-oil yield improvements for small incremental
pressure reductions were higher at 8 mmHg than at 16 mmHg. Commercial
operation of a column with a 4.0 mmHg top pressure and 10 mmHg flash-
zone pressure is possible.

Ejector Have a Wide Range of Uses was presented by F. Duncan
Berkeley [20] Ejector were simple pieces of equipment. Nevertheless many of
their possible services were overlooked. They often were used to pump gases
and vapors from a system to great a vacuum.
Ejectors were employed in the industry in numerous, unique and even
sometimes bizarre ways. They used singly or in stages to create a wide range
of vacuum conditions, or they operated as transfer and mixing pumps. The
ejectors had the following advantages over other kinds of pumps: Rugged and
simple construction, Capability of handling enormous volumes of gases in
relatively small sizes of equipment, Less maintenance requirements and
Simple operation.
W. D. Mains and R. E. Richenberg [21] were studied the steam jet
ejector in pilot and production plants. Steam jet ejector are employed in the
chemical process industries and refineries in numerous and very often unusual
ways. They provide, in most cases, the best way to produce a vacuum in these
process plants because they were rugged and of simple construction therefore,
easily maintained. Their capacities varied from the very smallest to enormous
quantities. Because of their simplicity and the manner of their construction,
difficulties were unusual under the most extreme conditions. They were
simple to operate. Ejectors which were properly designed for a given situation
were very forgiving of errors in estimated quantities to be handled and of
upsets in operation and were found to be easily changed to give the exact
results required. In pilot plant operations all of these were important
functions, because in a pilot plant a great deal of information was usually
unknown, and something must be selected which will operate over a very
wide range.

Therefore, this article will outline the differences between ejectors for a
pilot plant and those for a production plant, pointing out that pilot plant
ejectors were not just small editions of production plant ejectors.
Objective: -
The objective of the present work is to carry out a theoretical analysis
for a steam-jet refrigeration system operating at a range of evaporating
temperature, condensing temperature, boiler temperature, and at different
throat areas and develop computer program to obtain the results shall be
illustrated in chart form to allow designers to select parameters at optimum or
near optimum performance
Optimum performance of a system is defined when the largest (C.O.P.)
at a given operating conditional (pressure and temperature of generator,
evaporator and condenser).

Chapter three
Theoretical Analysis 3.1 Introduction
An ejector heat pump cycle in its simple form, as illustrated in figure
(3-1), is a combined cycle, which consists of a power cycle and a refrigeration
cycle. It differs from the conventional Rankine refrigeration cycle in which
the mechanical compressor is replaced by an ejector. The power cycle of an
ejector heat pump includes a boiler, an ejector, a condenser and a liquid
pump. In addition to an expansion valve and an evaporator, the refrigeration
cycle shares the ejector and the condenser with the power cycle. Flow
compression work, produced in the power cycle by absorbing heat at the
boiler and by rejecting residual heat to an intermediate temperature at the
condenser, is transferred to the refrigeration cycle at the ejector. This drives
the compression process to allow the low temperature heat to be absorbed at

the evaporator, upgraded to an intermediate temperature, and discharged
through the condenser.
Since the ejector heat pump is thermally activated, low-grade thermal
resources such as solar-heated water or industrial waste heat can be used as
the heat source. Alternatively, it can be driven by a gas-fired furnace.[17]
HEAT REJECTED
PUMP
EXPANSION DEVICE
HEAT COLLECTED
HEAT INPUT
EVAPORATOR
CONDENSER
EJECTOR
BOILER

Figure.3-1 An ejector heat pump cycle.
3.2 Description of the model
3.2.1 Evaporator: -
The evaporator is usually a large volume vessel which must provide a
large water surface area for efficient evaporative cooling action. Water sprays
figure (3-2) and cascading water in sheets figure (3-3) are two common means
of maximizing water surface. The design of an evaporator requires the water
to be distributed in small droplets or thin sheets so that the main body of the
water can attain equilibrium temperature by the time it reaches the bottom of
the evaporator. The vapor space in the evaporator must provide a volume for
the vapor to freely separate from the liquid at a velocity sufficiently low to
prevent liquid carry over into the booster suction. Spray systems are more
susceptible to water carry over problems than cascade-type systems. It is
important to keep pressure losses to a minimum between the point of vapor
release from the water and the steam ejector suction. Since ejectors are
inherently inefficient compression devices, the compression work must be
minimized for maximum efficiency.
Evaporators can be further divided into two types: -
1. The open chilled water system, in which the refrigerant water from the
evaporator is circulated directly to the cooling load, such as heat
exchanger or other equipment, which must be cooled.
2. The closed chilled water system, in which the refrigerant water is
recirculated within the evaporator over a coil or other heat transfer
device through which is circulated another fluid (water or brine is
commonly used) which never mixes with the refrigerant water and
which in turn is pumped to the cooling load.

The open chilled water system is more efficient because one less stage
of heat transfer is required. For the same chilled water temperature, the
refrigerant water temperature :(i.e.; evaporator) can be 3 to 5.5C (5 to 10F)
higher using the open system.[18]
0
Evaporator freezeup may occur in steam-jet system when certain
controls malfunction. The open system has two distinct advantages in such
situation. First, the 3 to 5.5C higher refrigerant water temperature means
that the system has a greater safety margin above the possible freeze level.
Second, should freezeupn actually occur, there is no danger of tube rupture,
which is certain to occur in the closed system. Some applications with special
process requirements, however, necessitate the use of a closed water system
to isolate the chilled water system.[18]
0
The open system must be carefully designed to avoid leaks. It is
recommended that the chilled water in open systems be pumped sufficiently
above atmospheric pressure so that the water returning to the evaporator will
be at 7 to 12 kPa. This will both prevent air from leaking into the pressure
side of the system and prevent vapor lock in the piping. The returning water is
introduced into the evaporator through a backpressure valve in such a case.
[18]
Steam line
Warm water return
In out Cooling Water
Chilled water
Condenser
To 2 stage air ejector
Vapor
Evaporator
Sprays
Make up water
Steam nozzle
Booster ejector
To condensate
pump

Figure 3-2 Steam-jet refrigeration system with surface condense
Hot well
Vapor
Chilled water
Warm return water
Make-up water
Steam supply
To circulating pump Condenser water and
condensed steam
To air ejector
Condenser water inlet Barometric
condenser
Booster jet
pump Evaporator
Tail pipe

Figure 3-3 Steam-jet refrigeration systems with Barometric Condenser
3.2.2 Condenser: -
The condenser can be one of three basic types: (1) conventional surface
condenser, (2) an evaporative condenser, or (3) barometric condenser.
The conventional surface condenser is commonly selected because of its
compact size and ability to be located anywhere, including inside a building
figure (3-3). When a natural supply of cooling water is not available (i.e.;
river, well, ocean, etc.), a cooling tower must be employed. Use of a cooling
tower will rise the condensing temperature above that which would be
necessary if either an evaporative or barometric condenser were used, so the
steam consumption will be correspondingly higher and a larger surface
condenser and cooling water system will be necessary.
The evaporative condenser contains tubes in which the steam from
ejector condenses. Forced air is drawn over the tube bundle, upon which
water is sprayed or otherwise distributed to produce the condensing effect
through vaporization of water from the outer tube surface. Such condensers
were used in railway car steam-jet refrigeration units of 18 to 25 kw (5 to 7
Tons ) capacity during the late 1930s and are now available in more modern,
larger capacity units. However, since such condenser cannot be located
indoors, they are limited to outdoor installations. The evaporative condenser
operates with or at condensing temperature 2 to 4C below that of a surface 0

condenser with cooling tower; this in turn results in favorable decrease
consumption. [18]
The barometric (or contact) condenser is used to advantage in
installation, which do not have space limitations (primarily vertical), and
where it is economically feasible to treat the evaporator and boiler water on a
once-through basis figure (3-4).
The unit provides low first cost. Since cooling water mixes directly with the
steam to condense it, a closer approach between cooling water temperature
and condensing temperature results than would be found in either a surface or
evaporative condenser. [18]
3.2.3 Boiler:
The steam boiler capacity depends on the maximum mass flow rate that
received by the ejector. And the types of the boilers that can be used are Fire
tube boiler and Water tube boiler.
3.2.4 Steam-jet ejector:
The steam-jet ejector is the heart of the steam-jet refrigeration cycle. The
characteristics of this component have a major effect on the operating cost of
the system and the size of both the condenser and the condenser cooling water
system.
A steam ejector is shown in figure (3-4). The Terminology of the heat
exchange institute is given, but, in addition, the sections are identified
functionally. [18]
The high-pressure steam used to energize the ejector is called the
primary fluid or motive steam. The induced steam, which is to be raised to a
higher-pressure level, is the secondary fluid; it is often referred to as vapor.
The motive steam is expanded through a converging-diverging nozzle to
velocities of the order of 1200 m / s. the corresponding nozzle pressure ratio

is very high. For example, a nozzle expanding 1030 kpa absolute pressure
motive steam to an evaporator pressure of 1 kpa absolute (7.2C chilled water
temperature) will have a pressure ratio of about 1000. Nozzle pressure ratios
less than 200 are uncommon due to poor ejector efficiency when operating at
low steam pressures.
0
The high velocity steam issuing from the nozzle entrains the water
vapor leaving the suction chamber, and the two streams merge in the mixing
section, which is usually conical in shape, converging in the direction of flow.
Theoretically, mixing is assumed to occur at constant pressure and,
therefore, at constant total momentum per unit time. For a typical steam-jet
ejector in a refrigeration cycle, the mean velocity of the mixture will be
supersonic (after mixing is complete). The most efficient way to recover the
kinetic energy in a supersonic vapor stream is to decelerate it to just above
sonic velocity then let it undergo a compression shock to just below
supersonic velocity followed by a subsonic deceleration to exit velocity. The
typical ejector design attempts to achieve this recovery by providing a
constant area throat section following the mixing section. This, in turn, is
followed by a diverging section, (such a design is illustrated in figure (3-4).
[18]

1. Diffuser. 6. Suction.
Subsonic diffuser
Shock diffuser
Mixing section
7 10 1 2 63 5 8 4
9
i
0
3 2 1x
2. Suction chamber. 7. Discharge.
3. Steam nozzle. 8. Steam inlet.
4. Steam chest. 9. Nozzle throat.
5. Nozzle plate. 10. Diffuser throat.
Figure.3-4 Basic Steam-Jet Ejector or Booster Assembly.
3.3 General Assumptions: -
For the theoretical analysis of steam-jet refrigeration system, the
following general assumptions are applied:
• Both motive steam as well as the secondary vapor enters the ejector at
essentially saturated condition.
• Flow separation inside the ejector nozzle or in the secondary inlet does
not occur.
• Heat transfer and friction losses to the wall and mixing losses are
neglected (isentropic flow).
• The process of mixing in the mixing section is constant pressure mixing
process. Also the static pressure of the exit of the nozzle is the same of
that of the suction section.
• To eliminate analytical errors induced by the assumption of an ideal gas
for ejector, the thermodynamics properties are directly introduced from
steam table.
• The system without precooler and pregenerator.
3.4 Design considerations: -
Not much material on the physical Design of efficient steam ejectors
has been published. Although many papers pertaining to ejector design have
been written, most have been concerned with analysis of air–to–air, steam–to
air, or other combinations, and their applicability to steam– jet refrigeration
systems is questionable. The majority of papers in the literature describe the
best ejector of a particular investigative series; unfortunately, these have
rarely, if ever, been as efficient as commercially available ejectors [18]. It is
therefore undesicable to utilize or rely on the design data generally found in
the literature as a basis for an efficient ejector design. Nevertheless, much
valuable work is recorded in the literature, which contributes a better
understanding of ejector design problems. The reluctance of ejector
manufacturers to publish design data is understandable, since they have
evolved their design through decades of costly experimentation. This relative
secrecy implies that ejector design is more of an art than a science, which is,

in fact, the situation at the moment. A major contribution to the science of
ejector Design has been the paper by Keenan, Neumann, and Lustwerk [18].
While this is a one-dimensional ideal analysis, it is very useful in describing a
logical mathematical model of ejector operation. The most extensive
discussion is that by Johannesen. [18]
3.4.1 Nozzle
The motive steam Nozzle has a characteristic convergent divergent
shape. Its throat is sized to give the desired steam flow at the design inlet
steam conditions. The nozzle’s divergent section is typically conical in shape
and the theoretical area ratio (cone outlet area to the throat area) is found
through conventional supersonic flow equations [18]. The cone angles (total
included angle) employed in the divergent nozzle cone range from 8 to 15
degree, with 10 to 12 degree most common.
The theoretical area ratio and an assumed design divergent cone angle
will define the theoretical length. However, experience has shown that in
practice the cone length at the design cone angle should be reduced to 70 to
80% of the theoretical length for a broader efficiency characteristic of the
ejector. This arises from the need of the ejector to operate at off-design
conditions. It has been found [18] that it is more efficient to operate the
ejector when the last portion of the expansion process in the divergent nozzle
section takes place at or beyond the exit plane of the cone than when the
expansion process is completed within the cone itself, giving rise to a normal
shock at this point. Such a condition would arise both at an evaporator
temperature higher than design and at startup if no shortening of the cone took
place.
The nozzle axis must coincide with the main ejector axis. The nozzle is
usually mounted so that its axial position relative to the inlet of the mixing

section at Station x of figure (3-4) can be varied to achieve optimum
performance. It can be shown in tests that the use of superheated motive
steam causes a slight decrease in ejector efficiency.
While saturated steam is the most efficient motive steam condition for
ejector operation, such a steam condition is difficult to control because of heat
losses. Since drops of wet steam can cause serious erosion of both nozzle and
main ejector parts due to the very high velocities encountered, a few degrees
of superheat are often used to effectively eliminate the erosion hazard from
ejector. In actual installations, erosion is virtually nonexistent. Good thermal
insulation on the steam lines and good steam trapping practices also help
eliminate erosion.
3.4.2 Ejector suction opening and suction chamber: -
The ejector suction opening is generally sized to give an average vapor
velocity of about 76m/s (250 fps) .the suction chamber is a volume in which
the entering water vapor is turned 90 degree and accelerated to some optimum
velocity at station x figure (3-4). It can be shown both theoretically [18] and
experimentally that there is an optimum velocity of the vapor entering the
mixing section at station x for every ejector design condition. Typically, the
vapor velocity increase as the design pressure ratio of the ejector (condenser
to evaporator pressure) decreases. For steam-jet refrigeration units tied to
comfort air-conditioning systems, the vapor velocity is typically 120 to 180
m/s (400 to 600 fps) at station x (based on evaporator state conditions).
3.4.3 Mixing section
The Mixing section is conical in shape. For refrigeration application,
most ejector manufacturers normally use a double cone in series arrangement,
with the larger included angle cone starting at station x and the smaller cone

ending at station 1. The length of the Mixing section is often expressed in
terms of throat diameters at station 1 to station 2. For steam jet refrigeration
work, the Mixing section will be 6 to 10 throat diameters long, with an
average value of 7. It can be shown theoretically [18] and by test that the
optimum mixing section cone angle decreases with decreasing ejector design
pressure ratio. For a design pressure ratio of one, the cone angle becomes zero
and a cylindrical constant area mixing section results. For the typical steam–
jet ejector on refrigeration service, the included angles of the mixing section
cone are about 7 to 10 degree for the first portion and 3 to 4 degree for the
second portion. Larger angles will result in the ejector being unable to
compress design vapor flow to the design condensing pressure.
3.4.4Constant area section: -
The Constant area section is the supersonic shock diffuser section
(stations 1-2). In an ideal one–dimensional analysis, the pressure rise in this
section might be expected to take place across a normal shock of essentially
zero axial length. This is not the real situation. Because of a thick boundary
layer and a very peaked velocity profile (as opposed to the ideal case of no
boundary layer and a uniform velocity profile), the shock is not fully normal
but includes complex oblique shock patterns [18] as well, and in practice
several throat diameters of axial length are required to complete this portion
of the pressure recovery process [18].
During load variation, this complex and lengthy shock patterns shifts
axially. For a broad and efficient ejector operating characteristic, this constant
area throat section is typically three to five throat diameters long to
accommodate the shock patterns and its axial movement under load. The
constant area section diameter is critical for a specific design and, although
the literature gives several methods for computing this dimension, none is

precisely accurate [18]. Only ejector manufacturers possess data with which
to accurately predict the throat diameter for ejectors of all sizes and operating
requirements.
3.4.5 Subsonic diffuser: -
The Subsonic diffuser is always conical in shape with an included angle
range of 5 to 12 degree, although 8 to degree are most common. An axial
length of four to 12 throat diameters is found in practice, with a five-diameter
length most common. A small included angle of 5 to 7 degree would be more
efficient if sufficient axial length were available to decelerate the flow to the
typical average leaving velocity of 76 m/s (250 fps) at station 3 figure (3-4).
However, ejector manufacturers have attempted to standardize ejector sizes
and usually employ cone angles greater than 7 degree to keep within length
limitations, which are often quite arbitrary.
Pressure distribution
g
g
c nmx y t
c nmx t
Entrained vapor
Actuating vapor
y

Figure 3-5 pressure variations inside the ejector.
3.5 Controls: -
The control of a steam-jet unit are usually relatively simple compared
to other types of refrigeration systems. The evaporator water level and the
condenser hot-well level are usually controlled by liquid level control devices,
such as float valves. A thermostatic control of the chilled water temperatures
can be applied to operate the steam-jet unit (or, in multiple ejector
applications, sequential activation) in an on-off mode. [18]
3.6 Analysis of system components: -
Based on the above assumptions, the following analysis is applied.
3.6.1Ejector efficiency: -
A Mollier diagram and the schematic diagram of an ejector with its
corresponding state points for an ejector heat pump are shown in Figure (3-6).
The high-pressure motive gas is the refrigerant vapor supplied from the boiler.
At state point 0 the total pressure corresponds to the boiler pressure, .
From there, the motive gas expands through the nozzle to a static pressure,
bp

ep (evaporator pressure), at state point 1, which is located to the right of the
isentropic expansion location 1 . The low-pressure refrigerant vapor
(secondary gas) from the evaporator enters the ejector at a total pressure
corresponding to state point 4. The two streams are merged at x and
completely mixed at state point 2. The combined refrigerant vapor is self-
compressed through the diffuser section and then leaves the ejector at state
point 3, which is located to the right of state point 3 of the isentropic
compression. The total pressure of state point 3 corresponds to the condenser
pressure, .
s
ep
'
cp
idealacual
)
The ratio of the secondary mass flow rate to the primary mass flow
rate may be defined as the entrainment rate. For given inlet conditions and
outlet presser of the working fluids, there is a maximum ideal value of
entrainment rate attainable by an ejector. This ideal entrainment rate can be
used as a criterion of ejector performance. Therefore, the efficiency of an
ejector can be defined by [17]
ratetentrainmenratententrainme
E=η (3-1)
The ideal entrainment rate may be derived by assuming the reversible
processes of expansion, mixing and compression of the refrigerant vapor
throughout the ejector. If the inlet and outlet conditions of the refrigerant are
prescribed and the overall changes of kinetic and potential energy are
negligible, the conservation of energy requires that
( hmmhmhm ooo 3444 &&&& +=+ (3-2)
'"
o
2
Pb 3
P2 Pc
Pe 4 x11s
Enthalpy (h) Vapor line

Figure 3-6 Mollier diagram for an ejector heat pump system
The isentropic process requires that
( )smmsmsm oooo 344 &&&& +=+ (3-3)
If both primary and secondary gases are of the same species, it has been
shown (Chen, 1978) that the ideal entrainment rate can be determined
graphically on the Mollier diagram (Figure 3-6). The state point 3 is the ideal
exit condition, which satisfies equations (3-2, 3). The ideal entrainment rate,
′′
( )mm && 04 s, can be expressed as the ratio of the length of the line 30 ′′ to the
length of line 4′′3 .
However, it is cumbersome to construct a Mollier diagram and measure
the relevant lengths. Instead, the ideal entrainment rate is calculated using a
trial-and-error solution with an existing refrigerant property computer
program (Kartsounes and erth, 1971; Hsu, 1984).

3.6.2 Optimum ejector analysis: -
The actual entrainment rate of an ejector depends on many factors,
including the ejector operating conditions optimum mixing section area, ,
can be found by maximizing subject to the governing equations which are
shown below
2A
4m&
Mass flow rate through the nozzle-throat area is obtained from
continuity equation [21]:
AVm ××= ρ& (3-4)
Mach number is
aVM =Q (3-5)
Where kRTa = (3-6)
Substitute equation (3-6) in (3-5)
kRTMV ×=∴ (3-7)
And from equation of state [21]:
RTP
=ρ (3-8)
Substitute equations (3-7) and (3-8) in (3-4)
AkRTRTPm ××=∴ & (3-9)
By using Energy equation [21]:
(∫∫∫ ∫∫ ××+∀××∂∂
=..vc s
dAVedetdt
dEρρ ) (3-10)
dtdW
dtdQ
−=

If the system total energy is divided between internal, kinetic, and potential energy, as defined by [21]
.... EPEKUE ++=
Then
gzVu ++= 2
21e (3-11)
=u Internal energy per unit mass
Now, Substitute equation (3-11) in (3-10)
( ) (∫∫∫∫∫ −=××
+++∀××
∂∂
svc
WQdtddAVgzVude
tρρ 2
.. 21 ) (3-12)
From thermodynamic properties [21]:
ρPuh += (3-13)
Substitute equation (3-13) in (3-12)
( ) (∫∫∫∫∫ −=××
+++∀××
∂∂
svc
WQdtddAVgzVhde
tρρ 2
.. 21 ) (3-14)
The energy equation with no external heat transfer and no work,
becomes, for steady one-dimensional flow.[21]
( )∫∫ =××
+
s
dAVVh 021 2 ρ (3-15)
02
2
=V
+ ddh (3-16)
At the control volume
2
21 Vt +hh = (3-17)

But,
hh =− (3-18) ( )TTCp tt −
××
+=+×
=∴TCp
VTTCp
VTt 21
2
22
(3-19)
1−
×=
kRkCpQ (3-20)
From equations (3-19) and (3-20) find:
( )
×−+
kRTVk
t 211
2
= TT (3-21)
a =Q (3-22) kRT2
And from equation (3-5) were,
2
22
aVM = (3-23)
Now, Substitute equation (3-22) and (3-23) in (3-21)
( )
×
++ 2
211 Mk
t = TT (3-24)
For a perfect gas with constant specific heats undergoing an isentropic
process[21]:
)1(
1
2
1
2
−
=
kk
TT
PP (3-25)
For stagnation state:

1−
=
kk
tt
TT
PP (3-26)
By using equation (3-24) we find that:
( )1
2
211
−
×
−+=∴
kkt Mk
PP (3-27)
By using equation (3-24) and (3-27) we find that the mass flow rate is:
( ) ( )kk
t
t MkMkARTP 221
2
211
−+
−
+=&m (3-28)
For maximum mass flow rate through the throat area when chocked
flow at Mach number =1. [21]
( ) ( )
th
kk
tto Ak
RTkPm ×
+
×
=∴
−+ 22121
21
& (3-29)
where . btbt TTPP == &
From figure (3-6) Nozzle efficiency is[17]
so
on hh
hh
1
1
−−
=η (3-30)
By using equation (3-17) and substitute equation (3-30) we find that the
velocity of the primary fluid at the nozzle exit is
Nozzle
oo Vh , 11 ,Vh
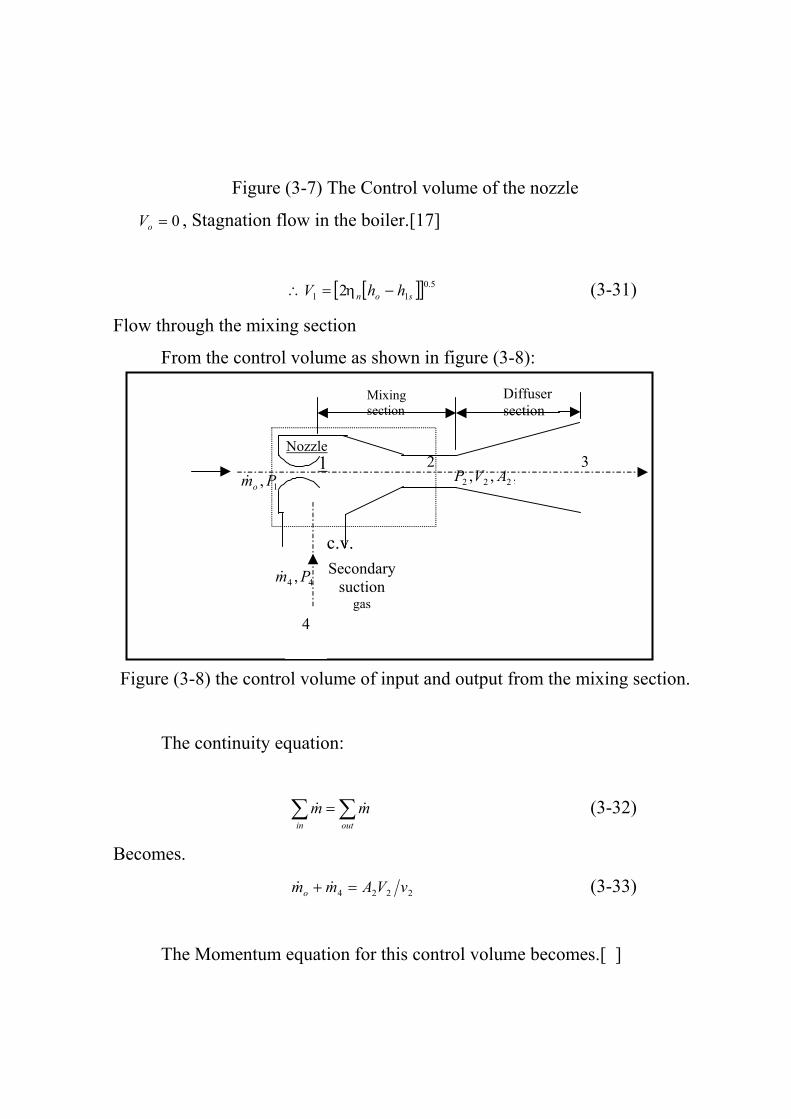
Figure (3-7) The Control volume of the nozzle
0=oV , Stagnation flow in the boiler.[17]
[ ][ 5.011 2 son hhV −= ]∴ η (3-31)
Flow through the mixing section
From the control volume as shown in figure (3-8):
Primarymotive
gas
o ,,, 222 AVP
1, Pmo&
44 , Pm&
c.v.
4
2 3
Secondary uction
gas s4
Nozzle 1
Mixing section
Diffuser section
Figure (3-8) the control volume of input and output from the mixing section.
The continuity equation:
(3-32) ∑∑ =outin
mm &&
Becomes.
2224 vVAmmo =+ && (3-33)
The Momentum equation for this control volume becomes.[ ]

( ) 2224241 APVmmAPVm oo ++=+ &&& (3-34)
And the Energy.[17]
( )( )2222444 Vhmmhmh ooo ++=+ &&&&m (3-35)
Where . 14 PPP e ==
The criterion for an optimized ejector, derived by Elrod (1945), is as
follows[17]:
( ) ( ) 11ln
ln11
242
2
2
3
222 =
−+
−+′ PP
kvdvTd
TTM
s
dη (3-36)
Applying ideal gas and isentropic process relations, equation (3-36)
may be simplified to.[17]
( ) 11
1124
1
3
222 =
−
−
−+
−
kPP
kPPM
kk
dη (3-37)
Where , and the energy equation in the diffuser section
(equation (3-35)) can be expressed as.[17]
′= 33 PP

( ) 12122
1
2
3 =−−
−
kMPP
d
kk
η (3-38)
For given values of η and , equations (3-37) and (3-38) can be
solved simultaneously to obtain and (within the range of interest of
0< M <1). Thus, the optimum mixing section area, , with respect to a unit
nozzle-throat area can be obtained by substituting these values into equation
(3-42).
3,, Pkd 4P
2M 2P
2 2A
Flow through the diffuser
From the control volume for the diffuser as shown in figure (3-9) find:
Energy.[17]
32
22 2 hVh =+ (3-39)
Diffuser efficiency equation.[17]
(3-40) ( 2323 hhhh d −=−′ η )
Where state has coordinates and . 3′ 3P 2S
4
Primary motive
gas
o 222 ,, MhP
c.v. S condary
uction gas
es4
Nozzle 1
Diffuser section
Mixing section
3 333 ,, ThP
2

Figure (3-8) the control volume of the diffuser.
The mixing section area
Let M = Mach number at section 2, and for a perfect gas 2
( ) 5.02222 vkPVM = (3-41)
From equations (3-33), (3-34) and (3-41), the cross-sectional area, ,
may be solved by.[17]
2A
( ) 4222
12 1 PkMP
VmA o
−+=
& (3-42)
For the unit area of nozzle throat.
3.6.3 Ideal cycle performance[17]: -
From thermodynamics, a Carnot cycle machine will give the maximum
thermal efficiency for an engine and the maximum COP for a refrigerator. It
has been shown (Hamner, 1978;Chen, 1978) that a reversible ejector heat
pump cycle is a combination of a Carnot engine cycle operating between the
boiler and the condenser temperatures, and a Carnot refrigeration cycle
operating between the condenser and the evaporator temperatures. The ideal
system COP for cooling can then be derived as [17]
Ideal COP =c )()(
ec
e
b
cb
TTT
TTT
−− (3-43)
Similarly, the ideal COP for an ejector heat pump heating cycle can be
derived as 1 plus the ideal cooling COP. it is equal to the efficiency of a

Carnot engine operating between the temperatures T and T multiplied by the
COP for a Carnot heat pump operating between the temperatures T and T .
b e
c e
3.6.4 Non-ideal cycle calculations[17]: -
In reality, an ejector heat pump will be operating in a less-than ideal
environment with thermodynamic irreversibility’s including imperfect energy
transfer and flow friction losses.
Anon-ideal ejector heat pump in cooling mode is assumed to operate at
a boiler temperature of nearly to 100 C, a condenser temperature of about
45 0 C, and an evaporator temperature of 10 C. The T-S diagram of ejector
heat pump cycle is shown in
0
0
Figure 3.The boiler, condenser and evaporator
are assumed to operate at saturation pressures corresponding to the given
temperatures. With the assumed values of specific heat ratio k=1.4(taken at
30 0 C and 1 atmosphere), diffuser efficiency η =0.5 and nozzle efficiency
=0.97,the non-ideal ejector heat pump cycle performance with an optimized
ejector for the given operating condition can be calculated from equations (3-
1)-(3-38).
d
nη
The results and the procedure for a sample calculation are summarized
in Table (3-1).
The pump work of the liquid refrigerant is small, about 1 per cent of the
equivalent thermal energy input. The COPs of the non-ideal cycle are
calculated according to the definition of coefficient of performance: [17]
=)(COP c tsthatenergysoughtenergycooling
cos= ( )
( ) 638.05
744 =−−
hhmhhm
oo&
& (3-44)
( )( )( ) 638.1
cos 5
534)( =−
−+==
hhmhhmm
tsthatenergysoughtenergyheating
oo
ohCOP
&
&& (3-45)

These values are sought to be more representative of the actual
performance of an ejector heat pump. The ratios of actual COPs to their ideal
value are 26 per cent for the cooling cycle and 60 percent for the heating
cycle.
Table (3-1) A sample cycle calculation of the steam jet refrigeration system
At Boiler temperature =100oC,
Condenser temperature =50oC,and
Evaporator temperature =5oC

Calculation results Determined by 9689.02 =M Equations (3-37) and (3-38)
MpaP 0091.02 = Equations (3-37) and (3-38) kgkJh s /19.20451 = oS and 4P
smV /7.12231 = Equation(3-31) kgKJR /416=
2005.0 mAth = Assumed skgmo /8215.0=& Equation (3-29)
22 0513.0 mA = Equation (3-42)
kgKJS /82 = Initial assumed value kgkJh /05.25232 = 2S and 2P
kgmv /67.15 32 = 2S and 2P
kgkJh /45.25673 =′ 2S and 3PkgkJh /85.26113 = Equation (3-40)
smV /42.4212 = Equation (3-39) skgm /52.04 =& Equation (3-2)
( ) 224 /15.26 smkgAmmo =+ && Satisfy Equation (3-33), otherwise
another must be assumed to repeat the calculations.
2S
222 /89.26 smkgvV =
633.04 =omm && 1954.1443 =PP
( ) 484.14 =somm && ( ) 638.0=−idealcCOP ( ) 638.1=−idealhCOP
4265.0=Eη Equation (3-1)
To compare with the steam jet refrigeration system we made the
calculations to an equivalent system like an Absorption system works at the
same conditions of elements temperature and capacity as shown in table (3-2)
Table (3-2) A sample of calculation to the Absorption system
At generator temperature =100oC,

Condenser temperature =50oC,
Evaporator temperature =5oC, and
Absorber temperature=30oC.
Calculation results Determined by 35.2301 wqe ×= From equation (C-4)
kWqe 1374= given skgw /597.03 =
597.021 =− ww From equation (C-1) 54.01 =x From figure (C-2) at T Co
ev 5=
62.02 =x From figure (C-2) at T Cocon 50=
21 148.1 ww ×= From equation (C-2) skgw /033.41 =
skgw /63.42 = kWqg 3.2229= From equation (C-3)
616.0=cCOP From equation (C-5)
Chapter four
Results and Discussion Analysis and results obtained are based on the assumptions considered
in section of this work
4.1 The variation of the system characteristics with boiler temperature at
various throat areas.

4.1.1 Effect of boiler temperature on primary vapor flow rate.
Fig (4-1) shows the variation of primary vapor flow rate when boiler
temperature is varied at different throat areas, taking into consideration that
evaporating and condensing temperatures are 5 and 45Co respectively. The
vapor flow rate ( ) indicated in the figure represents the maximum flow
through a chocked nozzle at the various operating conditions. For the
condition indicated above, the mass flow rate is obtained using equation (3-
28) in which it may be observed that ( ) varies directly with boiler pressure
and throat area and inversely with the temperature. This may be attributed to
the fact that the increase in boiler pressure for a given condensing back
pressure results in higher flow through the nozzle due to varying pressure
distribution while the throat remains chocked and the ratio of boiler to throat
pressure remines constant.
om&
om&
Also for a given boiler temperature and pressure, larger throat area
requires higher flow rate in order to reach chocking conditions.
Attempts are made to represent, mathematically, the relation between
primary flow rate and boiler temperature required to chock a given throat
area. The curve fitting lines and equations for the conditions of figure (4-1)
are illustrated in figure (4-2). This figure shows excellent agreement between
results and curve fitting lines.
00.30.60.91.21.51.82.12.42.7
33.33.63.9
90 100 110 120 130 140 150 160
Tb(C)
mo
At=0.005 m2At=0.004 m2At=0.003 m2At=0.002 m2

Fig (4-1) variation of boiler mass flow rate with boiler temperature at
different throat areas (T ) CTC oev
ocon 5,45 ==
y = 0.0437e0.0296x
y = 0.035e0.0296x
y = 0.0262e0.0296x
y = 0.0175e0.0296x
00.30.60.91.21.51.82.12.42.7
33.33.63.94.2
90 100 110 120 130 140 150 160
Tb(C)
mo
At=0.005 m2
At=0.004 m2
At=0.003 m2
At=0.002 m2
Expon.(At=0.005 m2)E
Fig (4-2) Curve fitting equations representing primary vapor flow rate at
different boiler temperature and throat areas (T ) CTC oev
ocon 5,45 ==
4.1.2 Effect of the boiler temperature on secondary vapor flow rate.
Fig (4-3) shows the variation of secondary vapor mass flow rate ( )
emanating from the evaporator with boiler temperature (T ) at different throat
area ( ) and for the evaporating and for the evaporating and condensing
condition indicated in the figure. It can be seen that the secondary vapor mass
flow rate ( m ) increases with boiler temperature (T ) increase and throat area
increase. As seen in figure (4-1) that primary vapor flow rate is in direct
proportion to boiler temperature and pressure. From conservation of mass, the
increase in mass flow rate through a fixed geometry nozzle results in higher
4m&
b
tA
4& b

flow velocity. The momentum equation shows that the velocity gradient is
indirectly proportion to pressure gradient, i.e. when the velocity increases the
pressure decreases, hence exit pressure. The result obtained and shown in
figure (4-3) and curve fitted as shown in figure (4-4) and the resulting
equations are indicated.
0252.511
4 105 bTm ××= −& 025.511
4 104 bTm ××= −& 2301.49
4 101 bTm ××= −& 2326.410
4 109 bTm ××= −&

00.20.40.60.8
11.21.41.61.8
22.22.42.62.8
33.23.43.63.8
44.24.44.64.8
5
90 100 110 120 130 140 150 160
Tb(C)
m4( k
g
At=0.005 m2At=0.004 m2At=0.003 m2At=0.002 m2
Fig (4-3) variation of evaporate mass flow rate with boiler temperature at
different throat areas( ) CTCT oev
ocon 5,45 ==
00.20.40.60.8
11.21.41.61.8
22.22.42.62.8
33.23.43.63.8
44.24.44.64.8
5
90 100 110 120 130 140 150 160
Tb(C)
m4( k
g
At=0.005 m2
At=0.004 m2
At=0.003 m2
At=0.002 m2
Power(At 0 002 2)
Fig (4-4) The curve fitting for the variation of evaporate mass flow rate with
boiler temperature at different throat areas (T ) CTC oev
ocon 5,45 ==

4.1.3 Effect of the boiler temperature on the cooling Coefficient of
performance.
Fig (4-5) shows variation of cooling coefficient of performance ( )
of the system with boiler temperature at the conditions illustrated in the figure
and different throat areas. It can be seen that the cooling coefficient of
performance of the system increase with the increase of boiler temperature.
This can be attributed to the fact that the entrainment ratio (
cCOP
omm && 4 ) increases
as the boiling temperature increases, refer to equation number (3-8). At the
same time the enthalpy ratio appearing in the equation was found to decrease
with increased boiling temperature, but the entrainment ratio effect is
dominant. The relation between the cooling coefficient of performance and
saturated boiling temperature is curve fitted and the fallowing equation was
deduced:
3807.71692.00014.0103 236 +×−×+××−= −bbbc TTTCOP
It is of interest to see that the (COP ) is not that area dependent hence it
is the same whatever is the capacity.
c

00.10.20.30.40.50.60.70.80.9
11.11.21.31.4
90 100 110 120 130 140 150 160
Tb(C)
CO
Pc
Te=5CAt=0.05 m2Tcon=45C
Fig (4-5) variation of cooling Coefficient of performance with boiler
temperature at different throat areas ( )
Fig (4-6) The curve fitting for the variation of cooling Coefficient of
CTCT oev
ocon 5,45 ==
00.10.20.30.40.50.60.70.80.9
11.11.21.31.4
90 100 110 120 130 140 150 160
Tb(C)
CO
Pc Te=5CAt=0.05 m2Tcon=45C
performance with boiler temperature at different throat areas
( CTCT oev
ocon 5,45 == )

4.1.4 Effect of the boiler temperature on the system capacity.
) with boiler
throat areas ( )
Fig (4-7) shows variation of system capacity (Q
temperature ( bT ) at different throat areas with evaporating and condensing
temperatures as indicated. It can be seen that the capacity increases with
boiler temperature rise and throat area enlargement. Both boiler temperature
rise and larger throat area result in higher evaporator vapor flow rates, which
means higher system capacity. The result obtained and shown in figure (4-7)
and curve fitted as shown in figure (4-8) and the resulting equations are
indicated.
0256.5101 bTQ ××=
7−
0251.57101 bTQ ××= −
229.46104 bTQ ××= −
2321.46102 bTQ ××= −
Fig (4-7) variation of system capacity with boiler temperature at different
0
1000
2000
3000
4000
5000
6000
7000
8000
9000
10000
11000
12000
90 100 110 120 130 140 150 160
Tb(C)
Q ( kW
At=0.005 m2At=0.004 m2At=0.003 m2At=0.002 m2
CTCT oev
ocon 5,45 ==

Fig (4-8) The curve fitting for the variation of system capacity with boiler
temperature at different throat areas ( CTCT oev
ocon 5,45 == )
010002000300040005000600070008000
90 110 130 150Tb(C)
Q ( kW
At=0.003 m2
At=0.002 m2
Power (At=0.005m2)Power (At=0 004
9000100001100012000 At=0.005 m2
At=0.004 m2
4. f 1.5Effect of the boiler temperature on the heating Coefficient o
ce. performan
Fig (4-9) shows variation of heating coefficient of performance of the system
can be seen that the heating coefficient of performance of the
with boiler temperature at conditions illustrated in the figure at different
throat areas. It
system increases with the boiler temperature rise. And it may be seen that the
( hCOP ) at any boiling temperature is higher than ( cCOP ). And this may be
explained by examining equation (3-44). Both equation are identical except
that equation (3-45) includes ( om& ) in the numerator in addition and that results
in a difference of unity between the two sPOC ... . The result obtained and
shown in figure (4-9) and curve fitted as shown in figure (4-10) and the
resulting equations are indicated.
0835.0h TCOP ×= 6481.0b

Fig (4-9) variation of heating Coefficient of performance with boiler
temperature at different throat areas ( TCT oev
ocon 5,45 == )
11.11.21.31.41.51.61.71.8
90 100 110 120 130 140 150 160
Tb (C)
CO
Ph
At=0.05 Tcon=45C
1.92
2.12.2
Te=5C
C
Fig (4-10) The curve fitting for the variation of heating Coefficient of
performance with boiler temperature at different throat areas
( CTCT oev
ocon 5,45 == )
11.11.21.31.41.51.61.7
90 100 110 120 130 140 150 160
Tb (C)
CO
Ph
At=0.05 Tcon=45C
Te=5C1.81.9
22.12.2

4.2 ure The variation of the system characteristics with condenser temperat
nt throat areas. at differe
4.2.1 Effect of the condenser temperature on the evaporator mass flow rate.
Fig (4-11) shows variation of evaporator flow rate with condenser
mperature at different throat areas at conditions illustrated in the figure. The
owed to rise. This is due to the effect of back
te
figure shows that appreciable drop in entrained vapor flow rate when the
condenser pressure is all
pressure rise in back pressure while boiler pressure is maintained results in
lower boiler vapor flow rate. Since the entrained vapor flow rate. Since the
entrained vapor flow rate varies directly with motive vapor, it will eventually
decrease, as motive vapor is less.
Figure (4-11) also shows that for a given condensing temperature the
entrained vapor flow rate is higher at bigger throat area. This is also due to the
higher boiler motive vapor flow rate with bigger throat areas.
The results obtained are curve fitted and illustrated in figure (4-12) and
obtained on the below equations.
5895.06403.5 −×= Tm& 5942.0−
4 con
4 con
m&
5956.4 ×= Tm& 5893.0
4 3811.3 −×= conT
5913.04 271.2 −×= conTm& 4
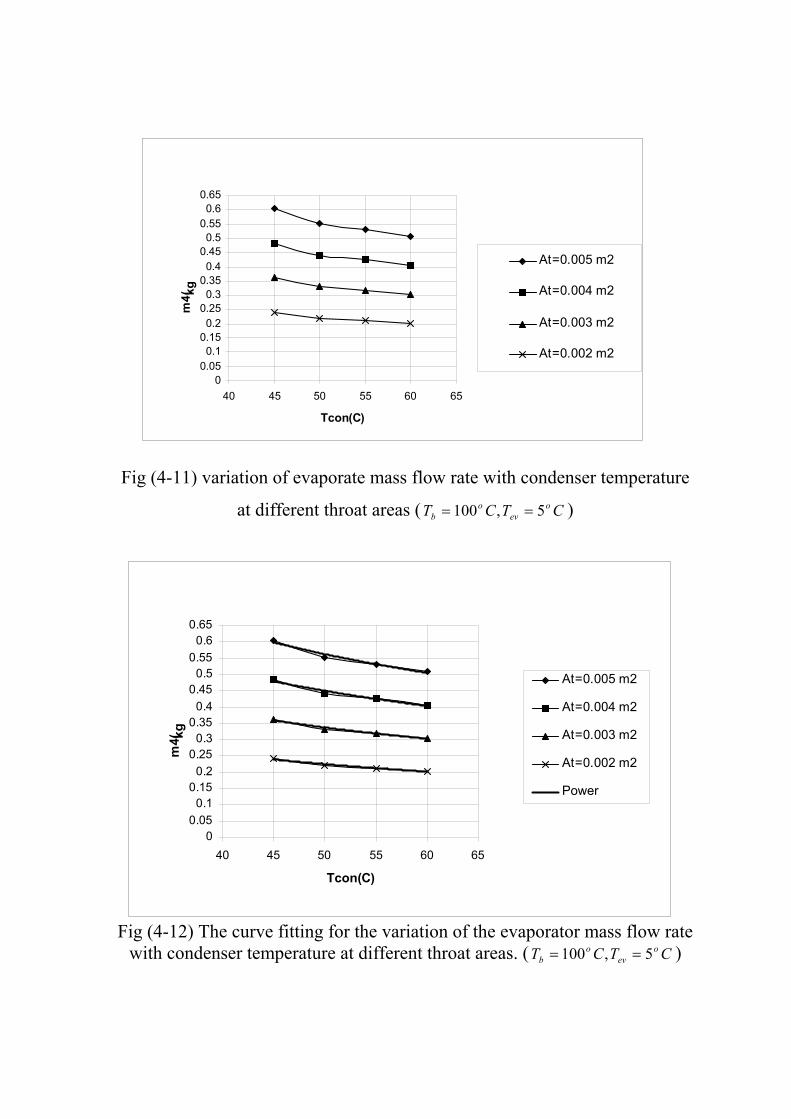
Fig (4-12) The curve fitting for the variation of the evaporator mass flow rate with condenser temperature at different throat areas. ( )
Fig (4-11) variation of evaporate mass flow rate with condenser temp
at different throat areas ( ,100 == )
erature
00.050.1
0.150.2
0.250.3
0.350.4
0.45
40 45 50 55 60 65
Tcon(C)
m4( k
g
At=0.005 m2
At=0.004 m2
At=0.003 m2
At=0.002 m2
0.60.65
0.50.55
CTCT oev
ob 5
0.55
00.05
0.10.15
0.20.25
0.30.35
0.40.45
0.5
0.60.65
40 45 50 55 60 65
Tcon(C)
m4( k
g
At=0.005 m2
At=0.004 m2
At=0.003 m2
At=0.002 m2
Power
CTCT oev
ob 5,100 ==

4.2.2 Effect of the condenser temperature on the cooling coefficient of
performance.
Fig (4-13) shows variation of cooling coefficient of performance
( cCOP
The entrainment ratio for any throat area used seems to remain
unchanged and this may explain that the ( cCOP ) for the different areas are at
the same track. The results obtained are curve fi
) of the system with condenser temperature at different throat areas for
the indicated evaporator and boiler conditions.
It can be seen that the cooling coefficient of performance of the system
remains constant at the different throat areas encountered in this study, but as
the condensing temperature rises the cooling coefficient of performance drops
and at condensing temperature range between 50 to 60oC the rate of decrease
becomes slower.
This behavior can be attributed to the decrease in refrigeration effect
at rising condensing temperature. Also figure (4-11) shows that the
entrained vapor flow rate is less at higher condensing temperature at
co
Hence by referring to equation (3-44), it may be seen that the
ensing temperature.
tted and illustrated in figure
(4-14)
( )74 hh −
( )m& 4
nstant boiling conditions.
numerator of the equation are ( )4m& and ( )74 hh − which both are less at
increasing cond
and obtained on the below equations.
8901.20766.00007.0 2 +×−×= conconc TTCOP

Fig (4-13) variation of cooling Coefficient
0.5
0.55
Tcon(C)
0.8
0.6
0.65
40 45 50 55 60 65
0.7
0.75
CO
Pc
At=0.005-0.002 m2
of performance with condenser
temperature at different throat areas ( CTCT oev
ob 5,100 == )
0.5
0.55
0.6
0.65
0.7
0.75
0.8
40 45 50 55 60 65
Tcon(C)
CO
Pc
At=0.005-0.002 m2
Poly. (At=0.005-0.002 m2)
Fig (4-14) The curve fitting for the variation of cooling Coefficient of
formance with condenser temperature rper at different throat a eas
) ( CTCT oev
ob 5,100 ==

4.2.3 Effect of the condenser temperature on the heating Coefficient of
performance.
Fig (4-15) shows variation of heating coefficient of performance
) of the system with condenser temperature at different throat areas at
the conditions illustrated in the figure. It can be seen that the heating
coefficient of performance of the system remains constant with different
throat areas, and as condenser temperature increase the heating coefficient of
ance ( ) of the system decrease and the rate of the decrease
becomes less.
This behavior is due to the convergence between the condensing and
boiler pressure and the change in latent of the vapor. As the condensing
ressure rises at constant boiler pressure, the entrained mass flow rate and the
laten 5),
the num hich
results in less ( ). The results obtained are curve fitted and illustrated in
figure (4-16) and obtained on the below equations.
( hCOP
perform hCOP
0.5
0.70.8
11.11.21.31.41.51.61.71.81.9
40 45 50 55 60 65
CO
Ph
p
t heat of evaporation become less. Hence by inspecting equation (3-4
erator decreases as the condensing temperature becomes higher w
hCOP
(4-15) variation of heating Coefficient of performance with condenser
temperature for at different throat areas ( CTCT oev
ob 5,100 == )
0048.01677.2 −×= conThCOP
0.6
0.9
Tcon (C
At =0.005 -0 .002 m
Fig

1.11.2
1.41.5
1.71.81.9
0.50.60.70.80.9
1
1.3
1.6
40 45 50 55 60 65Tcon(C)
CO
Ph
At=0.005-0.002 m2
Expon. (At=0.005-0.002m2)
Fig (4-16) The curve fitting for the variation of heating Coefficient of
performance with condenser temperature at different throat areas
)
4.2.4 Effect of the condenser temperature on the system capacity.
( CTCT oev
ob 5,100 ==
Fig (4-17) shows variation of system capacity ( ) with condenser
temperature ( ) at different throat areas at the conditions illustrated in the
figure. It can be seen that the capacity decreased with condenser temperature
rise and throat area increase, because of decreasing in the evaporator mass
flow rate ( ) as discussed earlier. The results obtained are curve fitted and
illustrated in figure (4-18) and obtained on the below equations.
Q
Tcon
4m&
5899.014064 −×= conTQ
5939.011426 −×= conTQ
5872.08.8349 −×= conTQ 5938.08.5710 −×= conTQ

Fig (4-17) variation of system capacity with condenser temperature at
different throat areas ( CTCT oev
ob 5,100 == )
300
500
700800
Tcon(C)
=0.002 m2
400
600
11001200130014001500
40 45 50 55 60 65
Q (At=0.005 m2
At=0.004 m2
At
1600
9001000
kW
At=0.003 m2
1600
300400
500600
700800
9001000
1200
13001400
1500
40 45 50 55 60 65Tcon(C)
Q
1100 At=0.005 m2
( kW
At=0.004 m2
At=0.003 m2
At=0.002 m2
Power(At 0 005 2)
Fig (4-18) The curve fitting for the variation of system capacity with
condenser temperature at different throat areas ( )
CTCT oev
ob 5,100 ==

4.3 The variation of the system characteristics with evaporator temperature
for the variation throat areas.
4.3.1 Effect of the evaporator temperature on the evaporator flow rate.
Fig (4-19) shows variation of evaporator mass flow rate ( 4m&
) at the conditions
ss flow rate
area increase, because as
re increase therefore the
) with
evaporator temperature ( ) at different throat areas (
illustrated in the figure. It can be seen that the evaporator ma
decrease with evaporator temperature rise and throat
evaporator temperature increase the saturation pressu
pres the
evaporator mass f .
The results obtained are curve fitted and illustrated in figure (4-20) and
obtained on the below equations.
evT tA
sure variation between boiler and evaporator decrease, this lead to that
low rate ( 4m& ) decreases
1592.12517.004.00024.0 234 +−+−= eee TTTm&
9231.01986.00314.00019.0 234 +−+−= eee TTTm&
6955.01511.0024.00014.0 234 +−+−= eee TTTm&
4573.00966.00152.00009.0 234 +++−= eee TTTm&

Fig (4 ow rate with evaporator temperature
for at different throat areas ( )
0.3
0.4
4 8 9 10
Tev(C)
kg
At=0.005 m2
0.8
0.7
0
0.1
0.2
0.5
0.6
0 1 2 3 5 6 7
m4(
At=0.004 m2At=0.003 m2At=0.002 m2
-19) variation of evaporate mass fl
CTCT ocon
ob 45,100 ==
00.050.1
0.150.2
0.250.3
0.350.4
0.450.5
0.550.6
0.650.7
0.75
0 1 2 3 4 5 6 7 8 9 10Tev (C
m4( k
g
At =0.005 m2
At =0.004 m2
At =0.003 m2
At =0.002 m2
Poly .(At 0 005
Fig (4-20) The curve fitting for the variation of the evaporate mass flow rate with evaporator temperature at different throat areas ( ) CTCT o
cono
b 45,100 ==

4.3.2 Effect of the evaporator temperature on the cooling Coefficient of
performance.
Fig (4-21) shows variation of cooling coefficient of performance
) of the system with evaporator temperature at different throat areas at
the conditions illustrated in the figure. It can be seen that the cooling
coefficient of performance of the system remains constant with throat area
variable, and as evaporator temperature increase the cooling coefficient of
ance ( ) of the system decrease, because when the evaporator
porator mass flow rate ( ) decreases, as
ooling coefficient of performance ( ) of
the system decrease. The results obtained are curve fitted and illustrated in
figure (4-22) and obtained on the below equation.
ance with evaporato
temperature at different throat areas ( )
( cCOP
perform cCOP
temperature increase the eva
discussed earlier, therefore the c
4m&
cCOP
545evc .0167.00315.00014.0 23 +×+×−×= evev TTTCOP
00.050.1
0.150.2
0.250.3
0.350.4
0.450.5
0.550.6
0.650.7
0.750.8
0.85
0 1 2 3 4 5 6 7 8 9 10
Tev(C)
CO
Pc
At=0.005-0.002 m2
Fig (4-21) variation of cooling Coefficient of perform r
CTCT ocon
ob 45,100 ==

Fig (4-22) The curve fitting for the variation of cooling Coefficient of
performance with evaporator temperature at
00.05
0.10.15
0.20.25
0.30.35
0.40.45
0.5
0.60.65
0.70.75
0.80.85
0 1 2 3 4 5 6 7 8 9 10
At=0.005-0.002 m2
0.55
Tev (C)
CO
Pc
Poly. (At=0.005-0.002 m2)
different throat areas
)
4.4 Comparison of the Coefficients of performance between the Steam jet
( CTCT ocon
ob 45,100 ==
refrigeration system and the Absorption system with condenser temperature.
Fig (4-23) shows variation of cooling coefficient of performance
) of the two systems with condenser temperature at a given evaporator
temperature (5oC). It can be seen that the cooling coefficient of performance
of the two system decreases with condenser temperature rise, but the cooling
coefficient of performance of the steam jet refrigeration system remains
greater than the absorption system at the same capacity and input
characteristic. This may be attributed to the fact that in Absorption
refrigeration heat is rejected in two locations i.e. in the condenser and
absorber, while in Steam jet heat is rejected in condenser only. The reason for
th
( cCOP
is behavior of the steam jet as discussed in section (4.2.2).

0.40 .430.460.490.520.550.580.610.640.670.7
0 .730.760.790.820.850.880.910.940.97
1C
OPc
SJRS Tb = 130 SJRS Tb = 120 SJRS Tb = 110 SJRS Tb = 100 AS Tb = 130 CAS Tb = 120 CAS Tb = 110 CAS Tb = 100 C
40 45 50 55 60 65
Tcon (C
Fig (4-23) the cooling Coefficient of performance for the steam jet refrigeration system and the absorption system with the condenser
temperature.
4.5 Comparison of the Coefficients of performance between the Steam jet
refrigeration system and the Absorption system with evaporator
temperature.
Fig (4-24) shows variation of cooling coefficient of performance
( cCOP ) of the two systems with evaporator temperature. It can be seen that the
cooling coefficient of performance of the steam jet refrigeration system
decreases with evaporator temperature rise, as discussed in section (4.3.2), but
the cooling coefficient of performance of the absorption system increases at
the same capacity and input characteristic. Thus because the evaporator mass
flow rate in the steam jet refrigeration system decrease at evaporator
temperature rise therefore the ( cCOP ) of the system decrease.

0.40.450.5
0.550.6
0.650.7
0.750.8
0.850.9
0.951
1.051.1
1.151.2
0 1 2 3 4 5 6 7 8 9 10Tev(C)
CO
PcSJRS Tb=130 C
SJRS Tb=120 C
SJRS Tb=110 C
SJRS Tb=100 C
AS Tb=130 C
AS Tb=120 C
AS Tb=110 C
AS Tb=100 C
Fig (4-24) the cooling Coefficient of performance for the steam jet refrigeration system and the absorption system with the evaporator
temperature.

Chapter five
Conclusions and Recommendations
for future work 5.1 Conclusions: -
The following has been concluded from the case studies done for the
steam jet refrigeration system analysis:
1. For a given ejector throat area, and constant condensing and
evaporating temperature, The secondary vapor mass flow rate was
found to increase with increasing boiler temperature, thus giving rise to
2. with
increasing ejector throat a boiler temperature, condensing
and evaporating temperatures.
3. For a given ejector throat area and constant boiler and evaporating
temperatures, the secondary vapor mass flow rate was found to
decrease with increasing condensing temperature, thus dropping the
cooling capacity.
4. The larger throat area is the higher secondary vapor mass flow rate and
higher system capacity at a given set of conditions.
5. At a given ejector throat area and constant condensing and boiler
temperatures, the secondary vapor mass flow rate was found to
decrease with increasing evaporating temperature, thus resulting in
drop of cooling capacity.
6. The cooling coefficient of perf
system was found to decrease with condenser temperature rise, but the
cooling capacity.
The secondary mass vapor flow rate was found to increase
rea at c nstanto
ormance of Steam jet and Absorption

cooling coefficient of p ormer system is larger than
the lat
7. The c efrigeration
system is found to d temperature rise, but the
icient of performance of the absorption system is found to
o C.O.P. of the steam jet is grater than
o
9.
n system at boiler temperatures exceeding 120oC. o
o
5.2 Re
erformance of the f
er one. Both at a given evaporator temperature.
ooling coefficient of performance of the steam jet r
ecrease with evaporator
cooling coeff
increase.
8. At boiler temperature 130 C the
the Absorption system at evaporator temperature range
(3-9 C).
The C.O.P. of the steam jet refrigeration was found to be higher than
that of Absorptio
Below 120 C, the later system C.O.P. becomes larger than that the
former system at evaporating temperature exceeding 7 C.
commendations for future work: -
Two ejectors, in se1. ries, may be used to increase the cooling capacity of
2. ransit conditions is
3.
the equations as a result from curves fitting
the system.
A study of the performance of the system under t
also required.
To apply the present system design for a different capacity, new set of
calculation should be made to obtain the proper parameters for the best
performance, depending on
shown previous.