Study of Land Cover Change Analysis around Obajana, Kogi ...
12
International Journal of Scientific & Engineering Research Volume 8, Issue 6, June-2017 979 ISSN 2229-5518 IJSER © 2017 http://www.ijser.org Study of Land Cover Change Analysis around Obajana, Kogi State, Nigeria: A Geoinformatics Approach 1 AgeneJ.I. and 2 HarunaA.I. 1 National Centre for Remote Sensing, P.M.B. 2136, Jos, Plateau State, Nigeria 2 Geology Department ATBU Bauchi, Nigeria ABSTRACT This study is a research work carried out around Obajana Kogi State Nigeria to monitor the effects of industrialization in the area. The study area is located on longitude 6°24'E to 6°27'E and latitude 7°54'N to 7°56'N(Kabba Sheet 146 and Aiyegunle 226). The study area is particularly of interest because of the recent cement production in the area.Two sets of Landsat images of 1987; 2001and NigeriaSat-x image of 2012 underwent image processing and enhancement after which Maxim Likelihood Classification (MLC) was used to determine the changes over the past 25 years. The LULC analysis indicates a very high rate of land degradation and unplanned settlements over the past 25years (1987 to 2012) with an increase insettlements, bare surface, water bodies and a decrease in vegetation. From the land use analysis of the area, anthropogenic activities such as unplanned settlements and industrialization over the period of two decades (25 years) have affected the Land use land cover of the area greatly. Built-up in the study area witnessed anomalous increase up to 547.6% from 1987 to 2012 while vegetation decreased by 37.9 % from 1987 to 2012. Keywords:Land Use Land Cover, Change detection, urbanization 1. INTRODUCTION In recent years, scholars such as Scott (1998) and Pallen (1996) tried to analyze the correlation between environmental damage and the growth of industries particularly in developing countries where the growth has been phenomenal. This is very important because environmental degradation distorts the ecosystem making it vulnerable to contaminants.Excavation of raw materials for industrial use is also another factor that often results to land degradation, soil and drinking water contamination, air and noise pollution among others hence distorting the environment. That is why a regulatory body, legal and administrative framework is always put in place by various government agencies to enforce and monitor certain anomalies. Such anomalies are often associated with health complications and environmental degradation. The intention behind the encouragement of industries, according to Ofori- Cudjoe (2009) lies in the development of a diversified economy that could propel the achievement of stable and sustainable societies. According to the UN Brundtland Report (2008), all our needs should be met in a way which does not compromise the ability of future generations to meet their own needs. Acquiring the information about Land Use Land Cover changes is imperative to the understanding of interactions between human activities and the environment. Remote sensing (RS) data have been one of the most fundamental data sources for studies of land use land cover spatial and temporal changes. In fact, multi-temporal remote sensing datasets, opportunely processed and elaborated, allow mapping and identifying landscape changes, provide effective effort to sustainable landscape planning and management (Dewan et al., 2009). In particular, by means of the integration of Remote Sensing/GIS techniques, it is possible to analyze and to classify the changing pattern of land cover during a long time period and, as a result, to understand the changes within the area of interest. GIS techniques help in the analyses, displaying, manipulating and storage of various factors/ features of land cover changes. During the last three decades, satellite time series as Landsat images have been exploited in several studies (Masek et al., 2000) to evaluate built up expansion and to assess urban morphology changes. The development of an urban area is the transformation of landscapes formed by rural into urban life styles and to make functional changes, from a morphological and structural point of view (Antrop, 2000; 2004). Historically, urban development, industrialization and agriculture are competing for the same land, for example, the amount of land consumed by urban areas and associated infrastructure throughout Europe was about 800 km2/year between 1990 and 2000 (Antrop, 2000; 2004). Moreover, population outside central cities has grown faster than downtown areas in many developed regions, demonstrating a certain tendency of an IJSER
Transcript of Study of Land Cover Change Analysis around Obajana, Kogi ...

International Journal of Scientific & Engineering Research Volume 8, Issue 6, June-2017 979 ISSN 2229-5518
IJSER © 2017 http://www.ijser.org
Study of Land Cover Change Analysis around Obajana, Kogi State, Nigeria: A Geoinformatics
Approach 1AgeneJ.I. and 2HarunaA.I.
1National Centre for Remote Sensing, P.M.B. 2136, Jos, Plateau State, Nigeria 2Geology Department ATBU Bauchi, Nigeria
ABSTRACT
This study is a research work carried out around Obajana Kogi State Nigeria to monitor the effects of industrialization in the area. The study area is located on longitude 6°24'E to 6°27'E and latitude 7°54'N to 7°56'N(Kabba Sheet 146 and Aiyegunle 226). The study area is particularly of interest because of the recent cement production in the area.Two sets of Landsat images of 1987; 2001and NigeriaSat-x image of 2012 underwent image processing and enhancement after which Maxim Likelihood Classification (MLC) was used to determine the changes over the past 25 years. The LULC analysis indicates a very high rate of land degradation and unplanned settlements over the past 25years (1987 to 2012) with an increase insettlements, bare surface, water bodies and a decrease in vegetation. From the land use analysis of the area, anthropogenic activities such as unplanned settlements and industrialization over the period of two decades (25 years) have affected the Land use land cover of the area greatly. Built-up in the study area witnessed anomalous increase up to 547.6% from 1987 to 2012 while vegetation decreased by 37.9 % from 1987 to 2012.
Keywords:Land Use Land Cover, Change detection, urbanization
1. INTRODUCTION
In recent years, scholars such as Scott (1998) and Pallen (1996) tried to analyze the correlation between environmental damage and the growth of industries particularly in developing countries where the growth has been phenomenal. This is very important because environmental degradation distorts the ecosystem making it vulnerable to contaminants.Excavation of raw materials for industrial use is also another factor that often results to land degradation, soil and drinking water contamination, air and noise pollution among others hence distorting the environment. That is why a regulatory body, legal and administrative framework is always put in place by various government agencies to enforce and monitor certain anomalies. Such anomalies are often associated with health complications and environmental degradation. The intention behind the encouragement of industries, according to Ofori-Cudjoe (2009) lies in the development of a diversified economy that could propel the achievement of stable and sustainable societies. According to the UN Brundtland Report (2008), all our needs should be met in a way which does not compromise the ability of future generations to meet their own needs. Acquiring the information about Land Use Land Cover changes is imperative to the understanding of interactions between human activities and the environment. Remote sensing (RS) data have been one of the most fundamental data sources for studies of land use land cover spatial and temporal
changes. In fact, multi-temporal remote sensing datasets, opportunely processed and elaborated, allow mapping and identifying landscape changes, provide effective effort to sustainable landscape planning and management (Dewan et al., 2009). In particular, by means of the integration of Remote Sensing/GIS techniques, it is possible to analyze and to classify the changing pattern of land cover during a long time period and, as a result, to understand the changes within the area of interest.
GIS techniques help in the analyses, displaying, manipulating and storage of various factors/ features of land cover changes. During the last three decades, satellite time series as Landsat images have been exploited in several studies (Masek et al., 2000) to evaluate built up expansion and to assess urban morphology changes.
The development of an urban area is the transformation of landscapes formed by rural into urban life styles and to make functional changes, from a morphological and structural point of view (Antrop, 2000; 2004). Historically, urban development, industrialization and agriculture are competing for the same land, for example, the amount of land consumed by urban areas and associated infrastructure throughout Europe was about 800 km2/year between 1990 and 2000 (Antrop, 2000; 2004). Moreover, population outside central cities has grown faster than downtown areas in many developed regions, demonstrating a certain tendency of an
IJSER

International Journal of Scientific & Engineering Research Volume 8, Issue 6, June-2017 980 ISSN 2229-5518
IJSER © 2017 http://www.ijser.org
outward expansion of urban areas (Angel et al., 2005). The principles of Remote Sensing/GIS techniques is very helpful to analyze land use/land cover change over a certain period of time in order to understand the factors that are responsible for the dynamic processes of the land transformation and to monitor both the negative and positive effects on the environment and the ecosystem at large (Angel et al., 2005). Different applications of land use and land cover information normally require that remotely sensed data be obtained at different spatial resolutions. GIS and Remote Sensing as conceptualized are helpful in mapping and analysing of spatial data (Danka and Klein, 2002).
The area of this study is Obajana and its environs (Fig.1) consisting of the Dangote Cement Factory, an artificially constructed dam, Mines where raw materials are excavated and several communities (Chokochoko, Oyo, Iwa and Jakura) which lies within longitude 6°24'E to 6°27'E and latitude 7°54'N to 7°56'N (fig.1).
This work seeks to investigate the environmental effects of cement production on the land cover around Obajana. In the past, studies on the land use land cover analysis around Obajana, Nigeria have not been sufficiently documented.
Fig 1: Map of Nigeria showing location of study area
IJSER

International Journal of Scientific & Engineering Research Volume 8, Issue 6, June-2017 981 ISSN 2229-5518
IJSER © 2017 http://www.ijser.org
3. MATERIALS AND METHODS
Land use change study gives a good idea of how major activities are affected within a particular setting over years due to anthropogenic activities. A field survey approach was used to examine the changes in thestudy area from 1987 to 2012.The field survey approach employed remote sensing and GIS data to classify land use changes. The characteristics of data used are shown in Table 1. The spatial analyses for this study include various classes of land use identified on the images of Landsat ETM and SPOT 5 grouped into six namely; rock outcrop, built-up, water body, vegetation, burnt surface and bare surfaces (Table 2). The level 1 land cover classification scheme was also applied (Anderson et al .1976). The land cover areas are classified into six classes because these are the land cover types observed in the area. Anderson classification was used because it can be customized to suit this study and most especially because it has been successfully used to study urban areas in Africa (Chima, 2012). The fieldwork carried out for this research employs the use of geological maps of Obajana, topo sheets of parts of Kabba Sheet 146 and Aiyegunle 226 (Fig.3), a pre-classified land use land cover map of the area for ground truthing (Plate I), other relevant data and existing literatures.
The images were geo-referenced to Universal Transverse Mercator (UTM) projection (WGS 1984 UTM 32 North) and a
subset was carried out. The images were classified using a pixel based method involving the selection of training samples for the land cover classification. Six land cover classes were identified including built-up, burnt surfaces, water body, bare surface, rock outcrop and vegetation. Twelve sample areas were selected for built-ups, five samples were selected for water body, and six samples were selected for bare surfaces, burnt surfaces and rock outcrops while nine sample areas were for vegetation. The land cover classes were chosen because they are widely represented in the area. The classifier used for the classification is the Maximum Likelihood algorithm because it had been successfully used to classify urban areas most especially in Abuja where land cover types are difficult to identify because of the metropolitan nature of Abuja city (Chima, 2012).Image classifications using Maximum Likelihood involve the assignment of a pixel to a land cover class is called pixel based image classification (Table 2).
To better understand the before and after changes in the area, a land use land cover analysis over a period of twenty five (25) years from 1987 to 2012 (Fig 3 to 5) was carried out with the use of medium resolution image (Landsat ETM and Nigeria sat-x).
Table 1.Characteristic of data used for the study
Characteristics SPOT5
2005
Landsat ETM
1987
Landsat ETM
2001
Nigeriansat-X
2012
Shuttle Radial Terrain SRTM
Bands used 4 bands 6 bands 6 bands 3 bands Single
Resolution 10m 30m 30m 22m 90m
Quantisation 8bit 8bit 8bit 8bit 8bit
Orbital angle 98.7 98.2 98.2 98.25 570
Orbital altitude 822km 705km 705km 663km 233km
Orbital type Sun synchronous
Sun synchronous
Sun synchronous
Sun synchronous
Sun synchronous
IJSER

International Journal of Scientific & Engineering Research Volume 8, Issue 6, June-2017 982 ISSN 2229-5518
IJSER © 2017 http://www.ijser.org
Table2. Level 1 classification
Land use classes Representative color
Water body
Vegetation
Bare surfaces
Burnt surface
Built-up
Rock
IJSER

International Journal of Scientific & Engineering Research Volume 8, Issue 6, June-2017 983 ISSN 2229-5518
IJSER © 2017 http://www.ijser.org
Fig 3.Landsat image of study area in (1987)
IJSER

International Journal of Scientific & Engineering Research Volume 8, Issue 6, June-2017 984 ISSN 2229-5518
IJSER © 2017 http://www.ijser.org
Fig 4.Landsat of study area (2001)
Fig 5.Nigeriasat-x (2012) showing massive anthropogenic activities within the study area
IJSER
International Journal of Scientific & Engineering Research Volume 8, Issue 6, June-2017 985 ISSN 2229-5518
IJSER © 2017 http://www.ijser.org
4. DISCUSSION AND RESULTS
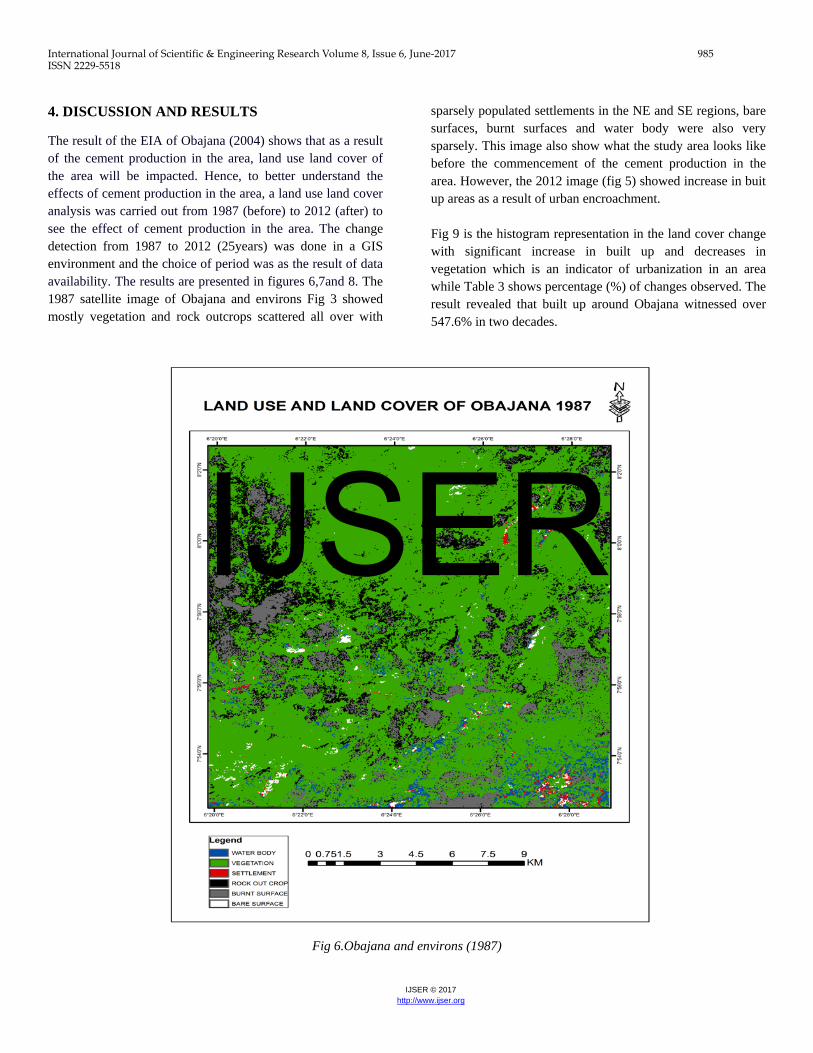
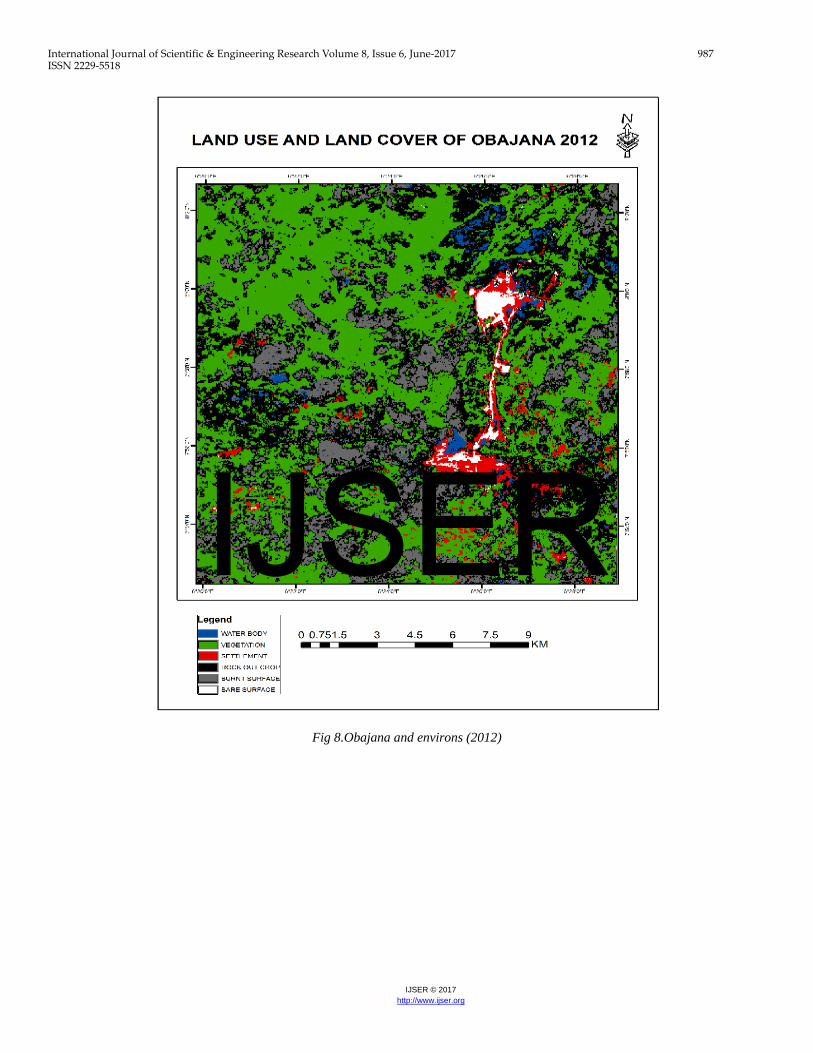
The result of the EIA of Obajana (2004) shows that as a result of the cement production in the area, land use land cover of the area will be impacted. Hence, to better understand the effects of cement production in the area, a land use land cover analysis was carried out from 1987 (before) to 2012 (after) to see the effect of cement production in the area. The change detection from 1987 to 2012 (25years) was done in a GIS environment and the choice of period was as the result of data availability. The results are presented in figures 6,7and 8. The 1987 satellite image of Obajana and environs Fig 3 showed mostly vegetation and rock outcrops scattered all over with
sparsely populated settlements in the NE and SE regions, bare surfaces, burnt surfaces and water body were also very sparsely. This image also show what the study area looks like before the commencement of the cement production in the area. However, the 2012 image (fig 5) showed increase in buit up areas as a result of urban encroachment. Fig 9 is the histogram representation in the land cover change with significant increase in built up and decreases in vegetation which is an indicator of urbanization in an area while Table 3 shows percentage (%) of changes observed. The result revealed that built up around Obajana witnessed over 547.6% in two decades.
Fig 6.Obajana and environs (1987)
IJSER

International Journal of Scientific & Engineering Research Volume 8, Issue 6, June-2017 986 ISSN 2229-5518
IJSER © 2017 http://www.ijser.org
Fig 7.Obajana and environs (2001)
IJSER
International Journal of Scientific & Engineering Research Volume 8, Issue 6, June-2017 987 ISSN 2229-5518
IJSER © 2017 http://www.ijser.org
Fig 8.Obajana and environs (2012)
IJSER

International Journal of Scientific & Engineering Research Volume 8, Issue 6, June-2017 988 ISSN 2229-5518
IJSER © 2017 http://www.ijser.org
Fig 9. Histogram showing LULC of Obajana in 1987, 2001 and 2012.
Table 3.Table showing LULC analysis from 1987 to 2012
Class name AREA(KM²)
1987 AREA(KM²)
2001 AREA(KM²)
2012 % Change
(1987-2012)
Settlement 2.1 12.9 13.6 547.6
Vegetation 230.9 177.2 143.2 37.9
Water body 0.8 1.1 4.2 425
Rock out crop 39.8 45.1 104.4 162.3
Burnt surface 29.3 75.3 37.9 29.4 Bare surface 2.5 2 3.9 56
0
50
100
150
200
250
AREA
(KM
²)
LAND USE
AREA(KM²) 1987
AREA(KM²) 2001
AREA(KM²) 2012
IJSER
International Journal of Scientific & Engineering Research Volume 8, Issue 6, June-2017 989 ISSN 2229-5518
IJSER © 2017 http://www.ijser.org
5. CONCLUSION
Land use of the area over the past 25 years with over 547.6% increase indicates urban encroachment while high decrease of vegetation cover was observed. The exposed rock outcrop in the area may be as a result of both geogenic and anthropogenic activities.
The present study will contribute immensely in providing scientific baseline data on the use of remote sensing/GIS for land cover change in Obajana.
IJSER

International Journal of Scientific & Engineering Research Volume 8, Issue 6, June-2017 990 ISSN 2229-5518
IJSER © 2017 http://www.ijser.org
REFERENCES
[1] Anderson, James R., 1976, Land use classification schemes used in selected recent geographic applications of remote sensing: Photogramm. Eng., v. 37, no. 4, p. 379-387.
[2] Angel, S, J. R. Parent and D.L. Civco. May 2007. Urban Sprawl Metrics: An Analysis of Global Urban Expansion Using GIS. ASPRS May 2007 annual Conference. Tampa, FL
[3] Antrop, M., 2004.De landschapsatlas, Methode. In: Hofkens, E., Roossens, I. (Eds.), Nieuweimpulsenvoor de landschapszorg. De landschapsatlas, bakenvooreenverruimdbeleid.Ministerie van de VlaamseGemeenschap, AfdelingMonumenten en Landschappen, Brussel, pp. 21–43.
[4] Antrop, M., Van Eetvelde, V., 2000. Holistic aspects of suburban landscapes: visual image interpretation and landscape metrics. Landsc.UrbanPlann. 50, 43–58.
[5] Chima, C.I. (2012): Monitoring and modelling of urban land use in Abuja Nigeria , using geospatial information technologies. Unpublished PhD thesis, Coventry: Coventry University
[6] Dangote Cement 2014 Annual report
[7] Dangote Cement Factory Obajana EIA (2004)
[8] Danka F.S. and Klein C., (2002).Using GIS to Predict Potential Wildlife Habitat: A Case Study of Muskoxen in Northern Alaska.International Journal of Remote Sensing, 23(21), pp.4611-4632
[9] Dewan, C. 2009. Piper calls the tune query: A case study of power-dynamics between Northern donors and Southern recipients in Bangladesh. MA dissertation, University of Edinburgh, Edinburgh, UK.
[10] Masek J.G., Lindsay F.E., Goward S.N. (2000) - Dynamics of urban growth in the Washington DC metropolitan area, 1973-1996, from Landsat observations. International Journal of Remote Sensing, 25: 3473-3486. http://dx.doi.org/10.1080/014311600750037507.
[11] NGSA, 2004 geology map of Obajana.
[12] Ofori-Cud Joe Samuel (2009) Small scale industries and regional development in eastern region of Ghana. Being a PhD thesis submitted to the college of
architecture and planning Kwame. Nkrumah University of science and technology Ghana.
[13] Pallen, D. (1996). Environmental assessment manual for community development project. Canadian International Development Agency, Gatineau, Quebec: CIDA, Asia Branch.
[14] Scott HS, et al. (1998) Identification and characterization of two putative human arginine methyltransferases (HRMT1L1 and HRMT1L2). Genomics 48(3):330-40
[15] UN Brundtland Report (2008). Romania, on its way to a sustainable society, Sustainable Society Foundation, Retrieved from: (1996). Key element of sustainable development in third world Development report. Geneva.
IJSER


![NIGERIA POLIO ERADICATION SUPPORT PROJECT (NPESP ... · states [Sokoto, Jigawa, Kebbi, Gombe, Adamawa, Zamfara, Kogi, Taraba, Nasarawa, Yobe, Bayelsa and Plateau]. ES 2.3 Major Activities:](https://static.fdocuments.in/doc/165x107/5f79b031c3a31435df0501b9/nigeria-polio-eradication-support-project-npesp-states-sokoto-jigawa-kebbi.jpg)