STUDY OF EXPRESSION OF HYPOXIA INDUCIBLE FACTOR - 1 …
145
STUDY OF EXPRESSION OF HYPOXIA INDUCIBLE FACTOR - 1 ALPHA IN THE RISK PREDICTION OF ORAL EPITHELIAL DYSPLASIA AND IN ORAL SQUAMOUS CELL CARCINOMA - AN IMMUNOHISTOCHEMISTRY STUDY Dissertation submitted to THE TAMILNADU Dr. M.G.R. MEDICAL UNIVERSITY In partial fulfilment for the Degree of MASTER OF DENTAL SURGERY BRANCH VI ORAL PATHOLOGY AND MICROBIOLOGY APRIL 2016
Transcript of STUDY OF EXPRESSION OF HYPOXIA INDUCIBLE FACTOR - 1 …

STUDY OF EXPRESSION OF HYPOXIA INDUCIBLE
FACTOR - 1 ALPHA IN THE RISK PREDICTION OF ORAL
EPITHELIAL DYSPLASIA AND IN ORAL SQUAMOUS CELL
CARCINOMA - AN IMMUNOHISTOCHEMISTRY STUDY
Dissertation submitted to
THE TAMILNADU Dr. M.G.R. MEDICAL UNIVERSITY
In partial fulfilment for the Degree of
MASTER OF DENTAL SURGERY
BRANCH VI
ORAL PATHOLOGY AND MICROBIOLOGY
APRIL 2016


Acknowledgement
ACKNOWLEDGEMENT
I bow in gratitude to Almighty and my mother for all her showers of
blessings.
My heartfelt gratitude to my teacher Dr. K. Ranganathan, MDS., MS
(Ohio), Ph.D. , Professor and Head of Department of Oral and Maxillofacial
Pathology, Ragas Dental College and Hospital for his constant support and
encouragement throughout my course. I consider myself extremely lucky to
have had the opportunity to study under him. He has always been a source of
inspiration to perform better not only in academics but also in life. Thank you
so much sir.
I extend my sincere gratitude to Dr. UmaDevi. K. Rao, Professor,
Department of Oral and Maxillofacial Pathology, Ragas Dental College and
Hospital for her constant guidance, support and her advice in completion of
my work. I want to take this opportunity to acknowledge and thank her for the
help and support .Thank you mam.
My sincere thanks to Dr. Elizabeth Joshua, Professor, Department of
Oral and Maxillofacial Pathology, Ragas Dental College and Hospital for her
constant support and encouragement throughout my study. She has always
been like a friend in guiding me in academics. Thank you mam.

I earnestly thank Professor, Dr.T. Rooban, Department of Oral and
Maxillofacial Pathology, Ragas Dental College and Hospital for his
encouragement and concern in helping me to complete this study.
My sincere thanks to the principal Dr. S. Ramachandran and
Chairman Mr. Kanakaraj, Ragas Dental College and Hospital for their
permission to use the facilities of the institution.
I extend my sincere thanks to Readers Dr. N. Lavanya and Dr. C.
Lavanya, Department of Oral and Maxillofacial Pathology, Ragas Dental
College and Hospital for their encouragement and support .
I extend my sincere thanks to Senior lecturer Dr. Sudharsan,
Dr. Kavitha, Department of Oral and Maxillofacial Pathology, Ragas Dental
College and Hospital for his help throughout my project.
I am very grateful to our Geneticist and Lab Manager, Mrs. Kavitha,
who helped a lot throughout my dissertation procedure.
I extend my sincere thanks to our Biostatistician, Ms. Aarthi, Lab
Technician, Mr. Rajan, Department of Oral and Maxillofacial Pathology and
Attender Mrs .Vasanthi, Ragas Dental College and Hospital for their constant
help in completion of my study.

I acknowledge gratefully the help of my batchmates Dr.Deepasri,
Dr. Saranya, Dr. Divya, Dr. Angaiyarkkanni and Dr. Joseph. I also thank
Ambika mam, Jayasri, Saranya, Revathi, Roxana and Vasanthi for their
support and encouragement.
I am dedicating this work to my father Mr. Kamarajan and my
husband Mr. C.V. Lenin and to my kids Keona and Ronald. I thank them for
all their sacrifices, understanding, support and constant encouragement.

ABSTRACT
Background:
Oral squamous cell carcinoma (OSCC) is a multistep process which
includes combined effects of individual genetic predisposition and exposure to
environmental carcinogens. The rapidly proliferating tumor has insufficient
vascularization which limits oxygen diffusion resulting in the development of
hypoxic region. Hypoxic micro-environment of tumor cell is an important step
in the progression of OSCC with involvement of hypoxia inducible factor
1 alpha (HIF-1 alpha).
Aim and Objectives:
To study the expression of HIF-1 alpha in mild, moderate and severe
epithelial dysplasia, OSCC and normal mucosa by immunohistochemistry
(IHC).
Material and Methods:
Immunohistochemical detection of HIF-1 alpha was done using
polyclonal antibody and Poly Excel HRP/DAB chromogen detection system
on 60 samples, which included mild epithelial dysplasia (15 cases), moderate
and severe dysplasia (15 cases), oral squamous cell carcinoma
(OSCC-15 cases) and the expression was compared with that of normal
mucosa (15 cases). The positive control used for HIF-1 alpha was human
normal kidney.

Results:
The pattern of HIF-1 alpha staining in all the cases (N=60) was
cytoplasmic. All the cases of OSCC showed 100% positivity for HIF-1 alpha
expression. 93.3% of mild epithelial dysplasia and moderate to severe
dysplasia showed positive expression when compared to normal which was
80% positive. Tissue localization of HIF-1 alpha stain in the suprabasal,
keratin and connective tissue increased from normal mucosa to increasing
grades of epithelial dysplasia. All the cases of well differentiated and poorly
differentiated OSCC expressed HIF-1 alpha. 66.6% and 33.3% of moderately
differentiated carcinoma expressed mild and moderate intensity respectively.
Conclusion:
Compared to that of normal mucosa, HIF-1 alpha expression was
increased with increasing grades of epithelial dysplasia and increasing grades
of OSCC. This indicates that HIF-1 alpha expression was found to increase
with the severity of the lesion. Hence HIF-1 alpha could be considered as one
of the marker comparing the stages of dysplasia.
Key words: HIF-1 alpha, hypoxic micro-environment, oral epithelial
dysplasia

CONTENTS
1. INTRODUCTION 1
2. AIM AND OBJECTIVES 3
3. MATERIALS AND METHODS 5
4. REVIEW OF LITERATURE 15
5. RESULTS 45
6. DISCUSSION 55
7. SUMMARY AND CONCLUSION 64
8. BIBLIOGRAPHY 66
9. ANNEXURES
I - Institutional Review Board approval form
II - Dissertation protocol
III - Primary antibody
IV - Secondary antibody
V - Department declaration form
VI - Plagiarism check form
VII - Abbreviations

Introduction

Introduction
1
Head and neck cancer is a major problem globally and a significant
problem in the Indian subcontinent. More than two lakh new cases of head and
neck cancers are diagnosed each year in India. India contributes up to 7.8% of
the global cancer burden and 8.33% of global cancer deaths. In developed
countries around 40% of patients present with advanced disease whereas in
developing countries like India around 60% of patients have advanced disease
at the time of presentation1.
Epithelial dysplasia is a step that often precedes squamous cell
carcinoma2. The term “dysplasia” is generally employed in the sense of a
disordered development. In a stratified squamous epithelium, architectural
disturbances affecting normal maturation and stratification may occur. When
such alterations are accompanied by cytological atypia, the term “dysplasia” is
applied2.
Although it is established that oral potentially malignant lesions with
epithelial dysplasia are statistically more likely to progress to cancer, the
actual mechanisms are poorly understood3.
The degree of dysplasia is a best guide to the potential progression of
oral lesions. Severe epithelial dysplasia has an overall malignant
transformation rate around 7–50%4. Moderate dysplasias have a malignant
transformation potential of 3–15%, whereas mild epithelial dysplasia shows a
relatively low risk (5%). Potential markers of progression to malignancy
include analysis of p53 mutations and loss of heterozygosity. Gross genomic

Introduction
2
aberrations that can be assessed by DNA ploidy status also have promise as a
predictor of malignant progression4.
WHO (2005) defined leukoplakia as “a white plaque of questionable
risk having excluded (other) known diseases or disorders that carry no
increased risk for cancer.”
Hypoxia
Hypoxia is a condition in which the body or a region of the body is
deprived of adequate oxygen supply. Generalized hypoxia occurs in healthy
people at high altitudes, where it causes altitude sickness. The oxygen binding
capacity of hemoglobin is influenced by the partial pressure of oxygen in the
environment. A small amount of oxygen is transported in solution in the
blood.
HIF-1 alpha is upregulated in oral epithelial dysplasia and oral
submucous fibrosis at both protein and mRNA levels in hypoxic conditions.
A statistically significant correlation with the degree of epithelial dysplasia
and expression level of the gene HIF-1 alpha has been reported. HIF-1alpha is
a known transcription factor induced by hypoxia and has been proposed that
hypoxia together with HIF-1 alpha play a significant role in malignant
transformation5.
This study was done to ascertain the expression of HIF 1 alpha in
leukoplakia, OSCC and normal mucosa by immunohistochemistry (IHC).

Aim and Objectives

Aim and Objective
3
AIM
To evaluate the expression of hypoxia inducible factor (HIF) -1 alpha
in oral epithelial dysplasia and oral squamous cell carcinoma.
OBJECTIVES
1. To study the expression of HIF-1 alpha in formalin fixed paraffin
embedded tissue specimen of mild epithelial dysplasia by
Immunohistochemistry.
2. To study the expression of HIF-1 alpha in formalin fixed paraffin
embedded tissue specimen of moderate and severe epithelial dysplasia
by Immunohistochemistry.
3. To study the expression of HIF-1 alpha in formalin fixed paraffin
embedded tissue specimen of OSCC by Immunohistochemistry.
4. To study the expression of HIF-1 alpha in formalin fixed paraffin
embedded tissue specimen of normal mucosa by
Immunohistochemistry.
5. To compare the expression of HIF-1 alpha in mild, moderate, severe
epithelial dysplasia, OSCC and normal oral mucosa by
Immunohistochemistry.

Aim and Objective
4
HYPOTHESIS (NULL)
There is no difference in expression of HIF-1 alpha in mild, moderate,
severe epithelial dysplasia and OSCC when compared to normal mucosa.
STUDY SETTING
The study was conducted in the Department of Oral and Maxillofacial
Pathology, Ragas Dental College and Hospital, Chennai, using archival
formalin-fixed-paraffin embedded blocks of mild, moderate, severe epithelial
dysplasia, OSCC and normal mucosa using IHC. This study was approved by
Institutional Review Board (IRB) of Ragas Dental College and Hospital,
Chennai (Annexure I).
STUDY SUBJECTS:
The study material comprised of 60 formalin-fixed, paraffin embedded tissue
specimens. The samples were divided into 4 groups namely: Group I, Group
II, Group III and Group IV.
Group I: 15 normal oral mucosal tissue specimens.
Group II: 15 histopathologically confirmed mild epithelial dysplasia
tissue specimens
Group III: 15 histopathologically confirmed moderate and severe
epithelial dysplasia tissue specimens
Group IV: 15 histopathologically confirmed OSCC tissue specimens

Materials and Methods

Materials and Methods
5
1. Tissue samples of normal oral mucosa (n=15), mild epithelial
dysplasia (n=15), moderate and severe dysplasia (n=15) and OSCC
(n=15) were taken from the archival blocks.
2. A detailed case history including patient’s age, gender, occupation,
past medical and dental history, history of drugs and trauma were
recorded.
3. Extra oral and intra oral examination was done.
4. Biopsy was performed from the lesional site. Normal oral mucosa was
obtained when the patients were undergoing minor surgery for
impacted teeth cases.
5. The tissue biopsied was immediately transferred to 10 % buffered
formalin.
6. After adequate fixation, tissues were embedded in paraffin.
7. From the paraffin embedded blocks 4 microns thick, sections were cut
and used for routine hematoxylin and eosin (H & E) staining and
immunohistochemical staining.
8. Tissue sections of normal kidney were used as positive control for
HIF-1 alpha positivity.

Materials and Methods
6
HEMATOXYLIN AND EOSIN STAINING:
REAGENTS
Harris hematoxylin
1% acid alcohol
Eosin
Xylene
Alcohol
PROCEDURE
The slides were dewaxed in xylene and hydrated through three grades
of alcohol and then to water. The sections on the slides were flooded with
Harris hematoxylin for 5 minutes. The slides were washed in running tap
water for 5 minutes. Then the slides were differentiated in 1% acid alcohol for
5 minutes followed by running tap water wash for 5 minutes. The tissue
sections on the slides were then stained in eosin for 30 seconds and washed
again with running tap water for 1minute. The slides were then dehydrated
through alcohol, cleared, mounted and viewed under light microscope.

Materials and Methods
7
IHC STAINING:
Armamentarium for HIF-1 alpha
Microtome
Autoclave
Hot air oven
Slide warmer
Couplin jars
Measuring jar
Weighing machine
APES coated slides (Amino propyl triethoxysilane)
Slide carrier
Aluminium foil
Micro-pipettes
Toothed forceps
Electronic timer
Beakers
Rectangular steel tray with glass rods
Sterile gauze
Cover-slips
Light microscope

Materials and Methods
8
REAGENTS USED
1. Concentrated HCl
2. APES (3 amino propyl tri ethoxysilane)
3. 1N sodium hydroxide
4. 1N HCl
5. Citrate buffer
6. Phosphate buffer solution
7. 3% H2O2
8. Deionized water
9. Distilled water
10. Hematoxylin
11. Absolute alcohol (Isopropyl alcohol)
12. Xylene
ANTIBODIES USED
1. Primary antibody – Anti HIF-1 alpha rabbit polyclonal antibody-
Abcam
2. Secondary antibody – Poly Excel-HRP Micro polymer IHC
detection system-Vkan Life Care
3. Chromogen – DAB-3, 3’- di amino-benzidine tetrahydrochloride
Vkan Life Care

Materials and Methods
9
PREPARATION OF PARAFFIN SECTIONS
After the slides were dried, tissue sections of 4 micron thickness were
made in a rotary manual microtome. The ribbons of tissue section were
transferred onto the APES coated slides from the tissue float bath such that
two tissue bits come onto each slide with a gap in between. One of the tissue
sections towards the frosted end of the slide was labeled positive to which the
primary antibody, secondary antibody and chromogen were added and the
tissue section away from frosted side is the negative to which primary
antibody is not added. Instead buffer is added to prevent the drying of tissue
which is followed by the addition of the secondary antibody and then the
chromogen was added.
IHC PROCEDURE
The slides with tissue sections were treated with three changes of
xylene to remove paraffin wax which is called as deparaffinisation. They were
put in descending grades of alcohol (100% absolute alcohol, 90% and 70%
alcohol) and then to phosphate buffer solution. The slides were transferred to
citrate buffer of pH 6 and steamed in a pressure cooker for antigen retrieval at
15 lbs pressure for 15 minutes. Slides were washed two times with phosphate
buffer solution and then treated with 3% hydrogen peroxide for 5 minutes to
quench endogenous peroxidase activity of cells that would otherwise result in
non-specific staining. Again it was washed 2 times with phosphate buffer

Materials and Methods
10
solution. Circles were drawn using a diamond marker around the tissues, so
that the antibodies added later on do not spread and are restricted to the circle.
The slides were wiped carefully without touching the tissue section. The
primary antibody, anti HIF 1 alpha antibody was diluted in 1: 100 dilutions
and was added to positive tissue on the slide and to the normal tissue citrate
buffer was added. The slides were incubated for overnight at 40C in the
refrigerator. Next day the slides were washed in phosphate buffer solution for
two times and then wiped carefully without touching the tissue section to
remove excess of antibody. Then target binder reagent is added and incubated
for 12 minutes. The slides washed with phosphate buffer solution for two
times in 2 minutes each and were wiped carefully without touching the tissue
section to remove excess buffer solution. Then a drop of poly horseradish
peroxidase was added on both the sections and the slides were incubated for
30 minutes. Later the slides washed with phosphate buffer solution for two
times in 2 minutes each and were wiped carefully without touching the tissue
section to remove excess buffer solution. A drop of DAB was added to the
sections and incubated for 10 minutes. Slides were then washed in phosphate
buffer to remove excess chromogen and counter stained with hematoxylin.
Then the slides were shown under tap water wash followed by drying and one
change of xylene. The tissue sections were mounted with DPX. The slides
were then observed under the microscope. Throughout the procedure care was
taken not to dry the tissues.

Materials and Methods
11
POSITIVE CONTROL
A case of normal kidney specimen known to express HIF-1 alpha
positive cells were fixed, processed, embedded, sectioned, stained in same
manner and used as positive control. One positive control tissue slide was
included for each batch of staining. The tissue section away from the frosted
end of the slide was taken as the negative control.
IHC PROCEDURE:
1. APES coated slides with 2 paraffin embedded tissue
2. Placed in xylene twice (5 minutes each)
3. Placed in 100% isopropanol twice (5 minutes)
4. Placed in 90% isopropanol (5 minutes)
5. Placed in 70% isopropanol (5 minutes)
6. Washed in phosphate buffer twice (2 minutes each)
7. Kept in citrate buffer at pH 6 for antigen retrieval
8. Placed in 3% hydrogen peroxide (5 minutes)
9. Washed with phosphate buffer twice (2-3 minutes)
10. Primary antibody added and incubated at 40C (overnight)

Materials and Methods
12
11. Washed in phosphate buffer (2-3 minutes)
12. Poly excel target binder reagent added and incubated (12 minutes)
13. Washed in phosphate buffer twice (2-3 minutes)
14. Poly excel HRP added and incubated (30 minutes)
15. Washed slides in phosphate buffer twice (2-3 minutes)
16. DAB added and incubated in an enclosed in hydrated container
(10 minutes)
17. Washed in phosphate twice (2-3 minutes)
18. Stained with Harris Hematoxylin (30 seconds)
19. Washed in tap water
20. Placed in xylene (1 dip)
21. Slides to be mounted using DPX
22. Slides to be observed under the LM and graded

Materials and Methods
13
CRITERIA FOR EVALUATION OF HIF-1 ALPHA STAINING:
TISSUE LOCALISATION:
HIF-1 alpha staining was present in basal, suprabasal, keratin and
connective tissue and hence its intensity was analyzed in the above mentioned
layers in the study groups.
CELLULAR LOCALIZATION OF STAIN
The normal localization of the staining includes both nucleus and
cytoplasm. In our study the stain is localized to the cytoplasmic region. The
stained slides were screened, examined systematically for HIF-1 alpha
expression in the cytoplasmic portion.
STAINING PATTERN OF HIF-1 ALPHA
The evaluation of expression included the staining intensity. The intensity was
evaluated based on the intensity in the control section of normal kidney using
IHC. Staining intensity evaluation was given using a 0 to 3 scale.
0 - negative
1- mild
2-moderate
3- intense

Materials and Methods
14
STATISTICAL ANALYSIS
Data were entered and analyzed using SPSSTM
software
(version 20.0). Pearson’s Chi-square test was done to compare intensity of
staining between the groups. p value ≤ 0.05 was considered statistically
significant. Kappa analysis was done to compare the intensity of HIF-1 alpha
staining as observed between three observers.

Review of Literature

Review of Literature
15
ORAL EPITHELIAL DYSPLASIA
Dysplasia refers to a series of subtle changes in cell signifying that
anaplasia will soon develop. Dysplasia is a premalignant change. It is a change
in the tissue level whereas atypia is a change at cellular level. The alteration in
dysplasia includes genetic changes, epigenetic changes and surface alterations.
The genetic change involves complex process due to interaction of host with
the carcinogen in the environment and includes activation of proto-oncogenes
and inactivation of tumour suppressor genes and genomic instability genes.
Epigenetic changes include heritable changes in the gene expression that occur
without alteration in the DNA sequence.
The surface alteration includes cellular adaptations, reversible and
irreversible changes. The reversible changes are reversible if causative factors
are removed. If they persist, dysplastic cells escapes normal homeostatic
control and assume the autonomy of tumor cells. The irreversible changes is
characterised by accelerated cell division, which facilitates accumulation of
genetic damage and further drives toward path of transformation and lead to
cell death or neoplastic transformation6.
The diagnosis and grading of oral epithelial dysplasia is based on a
combination of architectural and cytological changes, but evaluation of these
is subjective and has been subject to considerable inter- and intra-observer
variations in the grading of lesions.

Review of Literature
16
The architectural features that should be addressed are7
Loss of polarity
Disordered maturation from basal to squamous cells
Includes top-to-bottom change of carcinoma in situ
Increased cellular density
Basal cell hyperplasia
Dyskeratosis
Bulbous drop shaped rete pegs
Increased number of mitotic figures / abnormally superficial mitoses
The cytological alterations to be observed are as follows
Nuclear pleomorphism
Cellular pleomorphism
Anisonucleosis
Anisocytosis
Increased nuclear size
Increased nuclear-cytoplasm ratio
Review of Literature
17
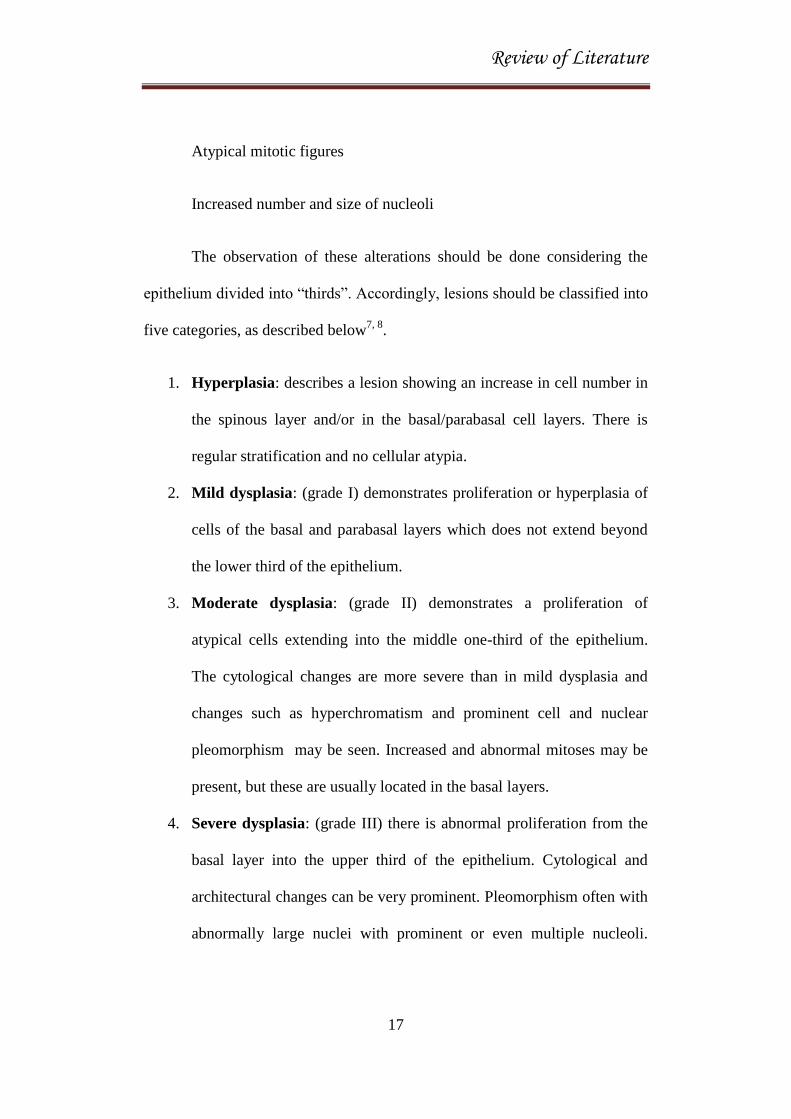
Atypical mitotic figures
Increased number and size of nucleoli
The observation of these alterations should be done considering the
epithelium divided into “thirds”. Accordingly, lesions should be classified into
five categories, as described below7, 8
.
1. Hyperplasia: describes a lesion showing an increase in cell number in
the spinous layer and/or in the basal/parabasal cell layers. There is
regular stratification and no cellular atypia.
2. Mild dysplasia: (grade I) demonstrates proliferation or hyperplasia of
cells of the basal and parabasal layers which does not extend beyond
the lower third of the epithelium.
3. Moderate dysplasia: (grade II) demonstrates a proliferation of
atypical cells extending into the middle one-third of the epithelium.
The cytological changes are more severe than in mild dysplasia and
changes such as hyperchromatism and prominent cell and nuclear
pleomorphism may be seen. Increased and abnormal mitoses may be
present, but these are usually located in the basal layers.
4. Severe dysplasia: (grade III) there is abnormal proliferation from the
basal layer into the upper third of the epithelium. Cytological and
architectural changes can be very prominent. Pleomorphism often with
abnormally large nuclei with prominent or even multiple nucleoli.

Review of Literature
18
Prominent and suprabasal mitoses are usually evident and abnormal
tripolar or star-shaped forms may be seen. Apoptotic bodies may also
be prominent. Architectural changes are severe, often with complete
loss of stratification and with deep abnormal keratinisation and even
formation of keratin pearls.
5. Carcinoma in situ: Theoretically, indicates that malignant
transformation has occurred but invasion has not. Full or almost full
thickness architectural disturbance in viable cellular layers with
pronounced cellular atypia. Atypical mitotic figures and abnormal
superficial mitoses are common7 , 8
.
Risks associated with smoking and drinking are not necessarily
constant over the multistage pathway to oral cancer. They investigated
whether smoking and drinking patterns differ for persons with oral cancer
(OC) relative to those with oral epithelial dysplasia (OED), a precancerous
condition by conducting a questionnaire containing questions on smoking and
drinking. Odds ratios (ORs) compared the odds of smoking and drinking
among persons with OC relative to OED and this was found to be statistically
significant( Morse DE et al, 2007)9.
The effects of betel nut chewing, smoking and alcohol on the
occurrence of leukoplakia and its malignant transformation to oral carcinoma
were quantified in a leukoplakia cohort (n = 435) from one medical centre
between 1988 and 1998 in Taiwan. Sixty oral carcinomas were ascertained in
Review of Literature
19
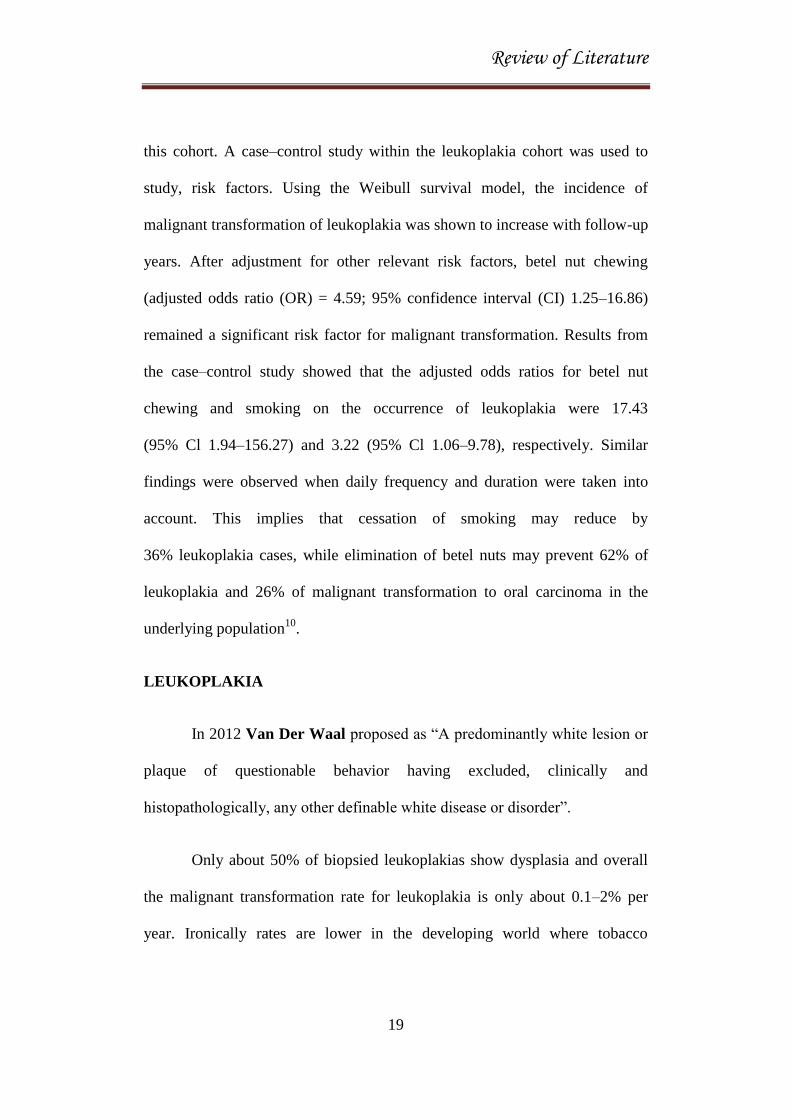
this cohort. A case–control study within the leukoplakia cohort was used to
study, risk factors. Using the Weibull survival model, the incidence of
malignant transformation of leukoplakia was shown to increase with follow-up
years. After adjustment for other relevant risk factors, betel nut chewing
(adjusted odds ratio (OR) = 4.59; 95% confidence interval (CI) 1.25–16.86)
remained a significant risk factor for malignant transformation. Results from
the case–control study showed that the adjusted odds ratios for betel nut
chewing and smoking on the occurrence of leukoplakia were 17.43
(95% Cl 1.94–156.27) and 3.22 (95% Cl 1.06–9.78), respectively. Similar
findings were observed when daily frequency and duration were taken into
account. This implies that cessation of smoking may reduce by
36% leukoplakia cases, while elimination of betel nuts may prevent 62% of
leukoplakia and 26% of malignant transformation to oral carcinoma in the
underlying population10
.
LEUKOPLAKIA
In 2012 Van Der Waal proposed as “A predominantly white lesion or
plaque of questionable behavior having excluded, clinically and
histopathologically, any other definable white disease or disorder”.
Only about 50% of biopsied leukoplakias show dysplasia and overall
the malignant transformation rate for leukoplakia is only about 0.1–2% per
year. Ironically rates are lower in the developing world where tobacco
Review of Literature
20
chewing habits are most prevalent. In the west malignant transformation is
estimated at about 5% of leukoplakias. Higher rates of about 20% have been
reported in non-homogeneous lesions, which are also more likely to show
dysplasia on biopsy.
The cohort studies about oral leukoplakia are very rare, so it is difficult
to appreciate its real malignant transformation rate due to various regional
habits. Average of about 1% have been reported annually in different
populations11,12
.
The risk factors for malignancy are vicious habits (smoking, alcohol
intake), clinical form, location of lesions were studied. Among them, tobacco
cigarette smoking was reported to be the most important etiological factor for
the development of oral premalignant lesions and to their progression into oral
carcinoma13
.
According to Nasser W et al., 36% of dysplastic lesions and 16% of
non-dysplastic lesions progress to carcinoma. However it is known that
epithelial dysplasia is correlated with clinically heterogeneous lesions that are
considered to have the greatest risk. Expression of p53 and loss of expression
of p16 are shown to be the earliest events in the process of malignant
conversion. In non-dysplastic leukoplakia a combined alteration of
p53/Ki67/p16INK4a was proven to be a risk of progression14
.

Review of Literature
21
Genetic Susceptibility to malignant transformation
Genomic instability denotes early genetic events during malignant
transformation causing Loss of Heterozygosity (LOH) and chromosomal copy
number abnormality. Considering the well known fact that chromosome 13q is
highly susceptible to genomic instability in HNSCC, they hypothesized that
genes within the 13q14–q33 LOH region may play essential roles in the
initiation of oral carcinogenesis. The other susceptibility regions in HNSCC
also include 3p24-p22, 6q26-q27, 9q22.3, 12p11.2, and 20p12-11. These LOH
loci were found to harbor numerous oncogenes and tumour suppressor genes
involved in the regulation of hypoxia, cellular adhesion/migration, matrix
remodeling, cell cycle/apoptosis, DNA repair and inflammation. This
acquisition of LOH may subsequently alter gene function and expression15,16
.
ORAL SQUAMOUS CELL CARCINOMA
Carcinogenesis can be divided conceptually into four steps: tumor
initiation, tumor promotion, malignant conversion, and tumor progression.
Carcinogenesis requires the malignant conversion of benign hyperplastic cells
to a malignant state, and invasion and metastasis are manifestations of further
genetic and epigenetic changes17
.
Molecular Changes in Oral Cancer
Cancer occurs through multiple steps, each characterized by the
sequential stimulation of additional genetic defects, followed by clonal
Review of Literature
22
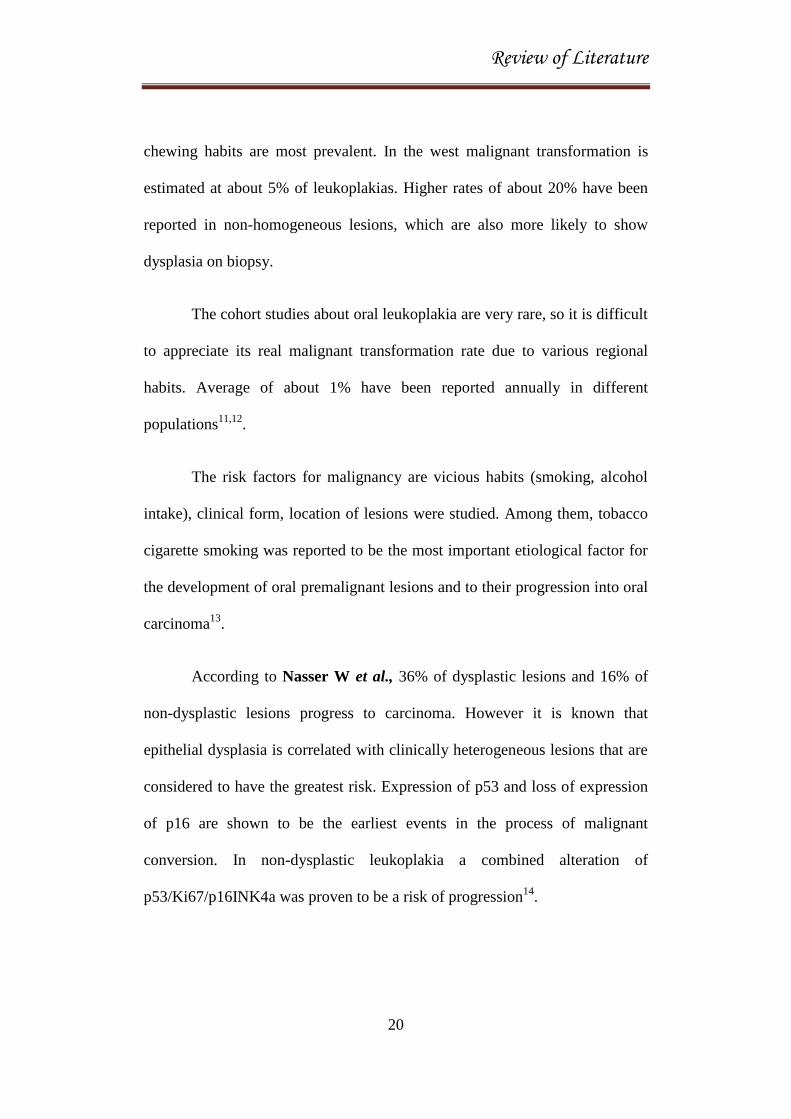
expansion. The genetic alterations observed in head and neck cancer are
mainly due to oncogene activation and tumor suppressor gene inactivation,
leading to deregulation of cell proliferation and death. These genetic
alterations include gene amplification and overexpression of oncogenes such
as myc, erbB-2, Epidermal Growth Factor Receptor (EGFR), cyclin D1 and
mutations, deletions and hypermethylation leading to p16 and p53 tumor
suppressor gene inactivation18
.
Regulators
Growth regulators and TSGs act as transducers of negative growth
signals. The TSG p53, is called as „Guardian of the Genome‟, having a role in
maintaining genomic stability, cell cycle progression, cellular differentiation,
DNA repair and apoptosis. The gene can be inactivated by several
mechanisms, including point mutations, deletions and binding with cellular
and viral proteins18
.
Genomic instability
The risk of progression from premalignancy to cancer is low, when no
genetic changes were seen, intermediate, if there is genetic loss on the short
arms of chromosomes 3 and 9 (3p and9p) and high, if there is 3p and 9p loss
accompanied by genetic loss on additional chromosome arms, including
4q, 8p, 11q, 13q and 17p18
.

Review of Literature
23
Role of deregulated apoptosis in the pathogenesis of oral cancer
Evasion of apoptosis via abnormal expression of bcl-2, mcl-1 and p53,
may contribute to oral cancer pathogenesis18
.
Enhanced telomerase activity
Telomerase activity is not seen in any of the normal tissues, but it was
found in 100% of the cell lines, 90% of the invasive neoplasia and 100% of
the dysplastic lesions18
.
Neovascularization
The steps critical to successful angiogenesis include the degradation of
the extracellular matrix, endothelial cell proliferation, migration and assembly
of endothelial cells into higher order structures. In the majority of cancers,
highly vascularized tumors showed a poor prognosis18
.
HYPOXIA INDUCIBLE FACTOR – 1 ALPHA
The transcription factor hypoxia-inducible factor-1 (HIF-1) is a key
regulator responsible for the induction of genes that facilitate adaptation and
survival of cells and the whole organism from normoxia (21% O2) to hypoxia
(1% O2)19
.
Review of Literature
24
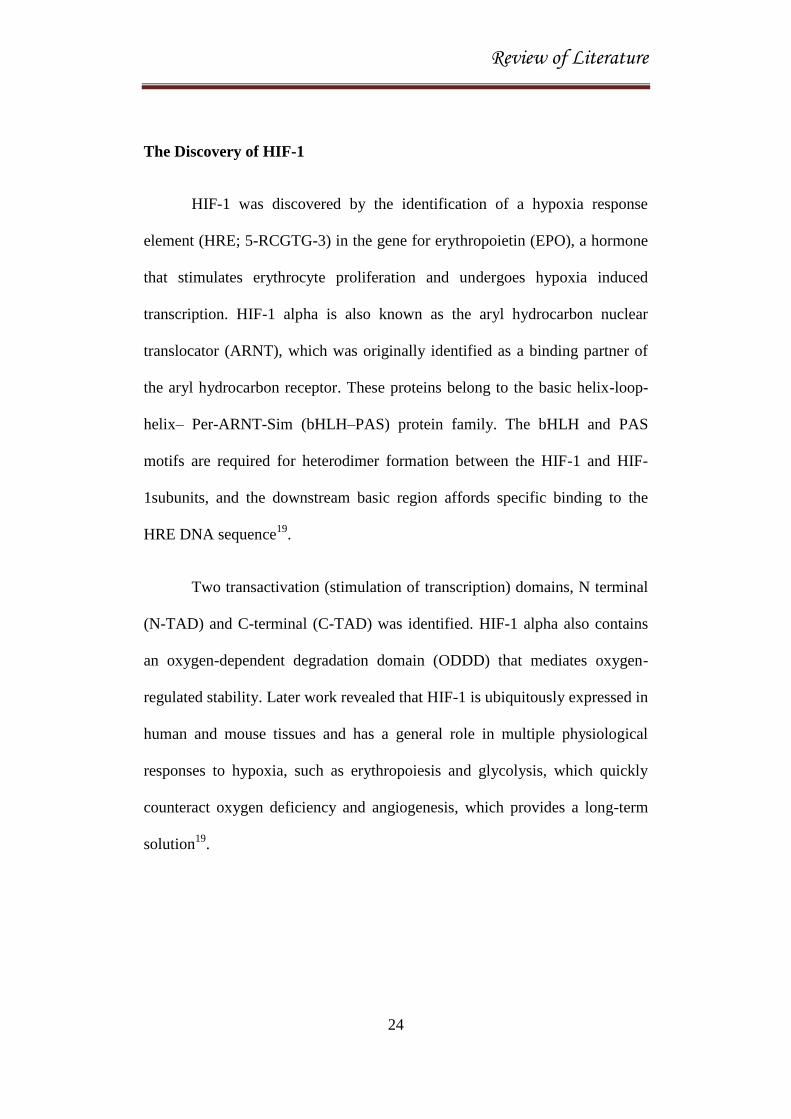
The Discovery of HIF-1
HIF-1 was discovered by the identification of a hypoxia response
element (HRE; 5-RCGTG-3) in the gene for erythropoietin (EPO), a hormone
that stimulates erythrocyte proliferation and undergoes hypoxia induced
transcription. HIF-1 alpha is also known as the aryl hydrocarbon nuclear
translocator (ARNT), which was originally identified as a binding partner of
the aryl hydrocarbon receptor. These proteins belong to the basic helix-loop-
helix– Per-ARNT-Sim (bHLH–PAS) protein family. The bHLH and PAS
motifs are required for heterodimer formation between the HIF-1 and HIF-
1subunits, and the downstream basic region affords specific binding to the
HRE DNA sequence19
.
Two transactivation (stimulation of transcription) domains, N terminal
(N-TAD) and C-terminal (C-TAD) was identified. HIF-1 alpha also contains
an oxygen-dependent degradation domain (ODDD) that mediates oxygen-
regulated stability. Later work revealed that HIF-1 is ubiquitously expressed in
human and mouse tissues and has a general role in multiple physiological
responses to hypoxia, such as erythropoiesis and glycolysis, which quickly
counteract oxygen deficiency and angiogenesis, which provides a long-term
solution19
.

Review of Literature
25
Domain structure of human HIF
The Regulation of HIF-1
Although HIF-1 is constitutively expressed and its mRNA and protein
are maintained at constant levels regardless of oxygen availability, HIF-1
protein has a short half-life (t1/2-5 min) and is highly regulated by oxygen.
The transcription and synthesis of HIF-1 are constitutive and seem not to be
affected by oxygen. However, in normoxia, the HIF-1 proteins are rapidly
degraded, resulting in essentially no detectable HIF-1 protein. During hypoxia,
HIF-1 becomes stabilized and translocates from the cytoplasm to the nucleus,
where it dimerizes with HIF-1 and the HIF complex formed becomes
transcriptionally active. The activated HIF complex then associates with HREs
in the regulatory regions of target genes and binds the transcriptional
co-activators to induce gene expression. In addition, hydroxylation of an
Review of Literature
26
asparagine residue in the C-TAD inhibits the association of HIF-1 with
CBP/p300 and thus inhibits its transcriptional activity19.
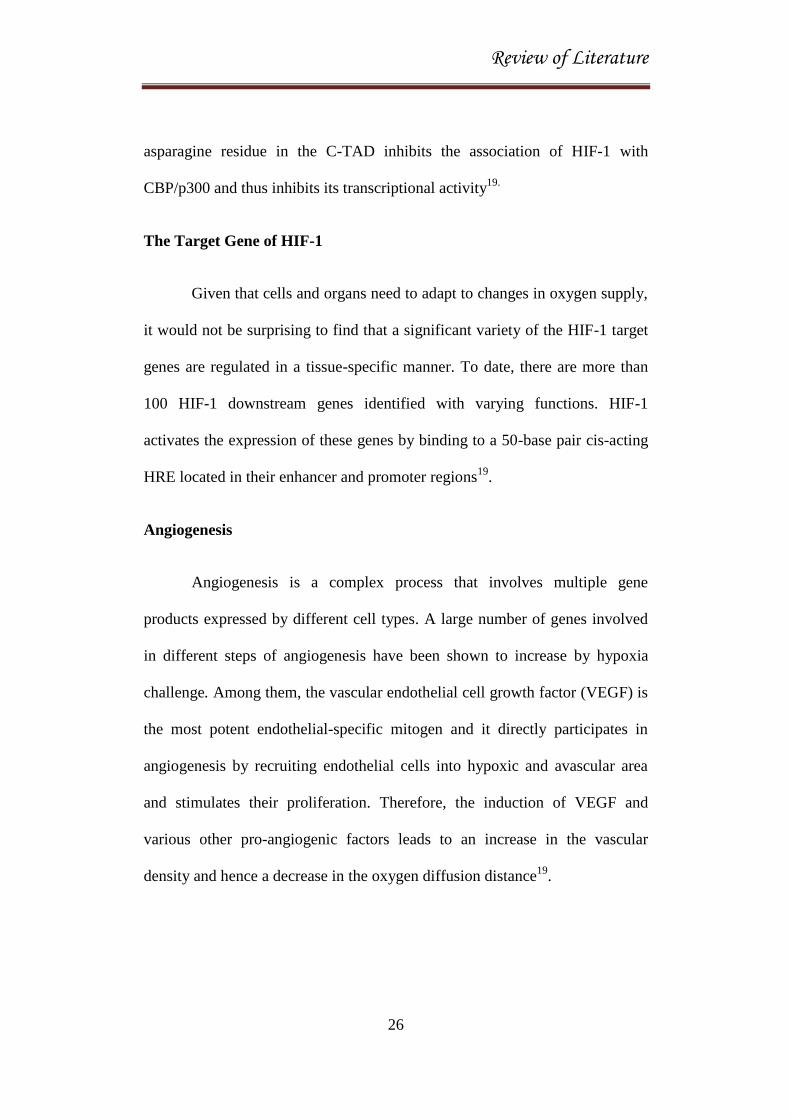
The Target Gene of HIF-1
Given that cells and organs need to adapt to changes in oxygen supply,
it would not be surprising to find that a significant variety of the HIF-1 target
genes are regulated in a tissue-specific manner. To date, there are more than
100 HIF-1 downstream genes identified with varying functions. HIF-1
activates the expression of these genes by binding to a 50-base pair cis-acting
HRE located in their enhancer and promoter regions19
.
Angiogenesis
Angiogenesis is a complex process that involves multiple gene
products expressed by different cell types. A large number of genes involved
in different steps of angiogenesis have been shown to increase by hypoxia
challenge. Among them, the vascular endothelial cell growth factor (VEGF) is
the most potent endothelial-specific mitogen and it directly participates in
angiogenesis by recruiting endothelial cells into hypoxic and avascular area
and stimulates their proliferation. Therefore, the induction of VEGF and
various other pro-angiogenic factors leads to an increase in the vascular
density and hence a decrease in the oxygen diffusion distance19
.

Review of Literature
27
Glucose Metabolism
Under low oxygen supply, cells switch their glucose metabolism
pathway away from the oxygen-dependent tricarboxylic acid (TCA) cycle to
the oxygen-independent glycolysis. With only 2 ATP molecules from each
glucose molecule produced by glycolysis, instead of 38 ATP provided by TCA
cycle, hypoxic cells elevate their ability to generate ATP by increasing the
glucose uptake. This is achieved by up-regulating the expression of glycolytic
enzymes and glucose transporters. Hypoxia and HIF-1 increase virtually all
the enzymes in the glycolytic pathway, as well as the glucose transporters
1 and 3 (GLU1, GLU3). Furthermore, the glycolysis metabolic products such
as lactate and pyruvate have been reported to cause HIF-1 accumulation under
normoxia and regulate hypoxia-inducible gene expression hence establishing a
potential positive feedback loop19
.
Cell Proliferation/Survival
Hypoxia and HIF-1 induce growth factors such as insulin-like growth
factor-2 (IGF2) and transforming growth factor (TGF). Binding of such
growth factors to their cognate receptors activates signal transduction
pathways like MAPK and PI3K that lead to cell proliferation/survival and
stimulates the expression of HIF-1 itself. This leads to increased HIF-1
transcriptional activity of target genes including those encoding IGF2 and

Review of Literature
28
TGF, thereby contributing to autocrine-signaling pathways that are crucial for
cancer progression19
.
Apoptosis
Hypoxia has been shown to induce apoptosis where HIF-1 plays a
complex role. Activation of caspase-3 and Apaf-1-mediated caspase-9, and the
release of cytochrome C, have been reported in several cell types under
hypoxic conditions. It has also been demonstrated that the expression of
HIF-1 alpha and HIF-1 beta significantly correlated with apoptosis and the
pro-apoptotic factors such as caspase-3, Fas, and Fas ligand. p53 has been
implicated in regulating hypoxia-induced apoptosis through induction of
apoptosis-related genes such as Bax, NOXA, PUMA and PERP. In addition to
the above classes of genes, HIF-1 also regulated many other target genes
implicated in diverse processes such as adipogenesis, carotid body formation,
B lymphocyte development and immune reactions19
.
The Role of HIF-1 in Development and Diseases
Development
Components of the HIF-1 system play essential roles in embryonic
development. Knockout of either HIF-1 or HIF-2 resulted in abnormal
vascular development and lethality in mice19
.

Review of Literature
29
Cancer
Overexpression of HIF-1 alpha and HIF-2 alpha was found in various
human cancers, probably as a consequence of intratumoral hypoxia or genetic
alteration. Immunohistochemical analyses demonstrated that there are
detectable levels of HIF-1 protein in benign tumors, elevated levels in primary
malignant tumors, and a marked amount in tumor metastases, in contrast to its
absence in normal tissues. There is a remarkable frequency of common genetic
alterations in cancer cells associated with increased HIF-1 alpha expression19
.
Ischemic Disease
The levels of HIF-1 alpha and VEGF were increased in the
myocardium when patients developed acute coronary artery occlusion.
Effective vascular remodeling after ischemic injury depends on an integrated
program of HIF dependent gene expression. In addition, induction of HIF-1
alpha or HIF-2 alpha and their target genes has been shown in the
pre-eclamptic placenta, in the ischemic retina and as well as from wound
healing19
.

Review of Literature
30
HIF-1 alpha and Metabolic Adaptation
HIF-1 alpha controls metabolic and pH-regulating pathways. Cells
respond to hypoxia by HIF- 1 alpha mediated upregulation of glucose
transporters (Glut-1 and Glut-3) and enzymes of glycolysis. Conversion of
pyruvate to lactic acid is facilitated by the induction of lactate dehydrogenase
(LDH). HIF-1 alpha also induces pyruvate dehydrogenase kinase-1 (PDK-1),
which inhibits the conversion of pyruvate into acetyl-CoA by pyruvate
dehydrogenase (PDH), thus preventing entry of pyruvate into the TCA cycle.
Subunit composition of cytochrome c oxidase (COX4) is influenced by HIF-1
alpha in hypoxia. COX4-2 is induced and COX4-1 is reciprocally reduced by
induction of the protease LON that degrades COX4-1. Switching the COX
subunits ensures optimal efficiency of mitochondrial respiration in hypoxia20
.

Review of Literature
31
HIF-1 alpha and Angiogenesis
The three major processes involved in the formation of new blood
vessels are referred to as vasculogenesis, angiogenesis and arteriogenesis. If
the cell mass expands, angiogenic factors would be released, but the triggers
for the so-called angiogenic switch, a phenomenon in which a tumor
progresses from a non-angiogenic to an angiogenic phenotype, remained
obscure. The hypoxic microenvironment caused by the increased oxygen
consumption of hyperplasia and/or hypertrophy and the decreased oxygen
delivery due to the increase in diffusion distance was assumed to contribute to
the angiogenic switch. An important link between hypoxia and angiogenesis
was the discovery that the expression of the potent vascular endothelial growth
factor was induced by hypoxia. Angiogenesis is essential for development,
wound healing and tissue or organ regeneration. It is an intricate multistep and
temporally ordered process that involves a great number of genes, modifiers
and pathways. Many of these genes are directly induced by HIF-1 alpha, such
as nitric oxide synthases, angiogenic and vascular growth factors (VEGF) and
genes regulating matrix metabolism (urokinase type plasminogen activator
receptor; uPAR). Others are independently regulated by hypoxia and might be
influenced by secondary mechanisms, but a central role of HIF-1 alpha is well
established20
.
The individual steps of angiogenesis require distinct changes to a
variety of cells (e.g. endothelial cells or pericytes). Endothelial cells have to be

Review of Literature
32
transformed from a stable growth-arrested state to a plastic proliferative
phenotype. The basement membrane has to be digested and the extracellular
matrix remodeled so that the endothelial cells are able to migrate. HIF-1 alpha
signaling pathways have been demonstrated to influence factors such as
uPAR, collagen prolyl-4-hydroxylases, matrix metalloproteinases (e.g. MMP-
2) and tissue inhibitors of matrix metalloproteinases (TIMP-1)20
.
HIF-1 alpha and Cancer
Many genes that are induced by HIF-1 alpha are expressed at higher
levels in cancer than in normal tissues particularly angiogenic growth factors
(such as VEGF) and enzymes of the glucose metabolism. The hallmark of
cancer metabolism is significantly influenced by HIF-1 alpha: increased
glucose uptake, lactate production and decreased respiration20
.
In malignant tissue, different stimuli activate HIF-1 alpha : Local
hypoxia due to increased proliferation or insufficient oxygen supply,
inactivation of tumor suppressors such as VHL, oncogenes, growth factors,

Review of Literature
33
accumulation of TCA intermediates such as fumarate or succinate and
therapeutic irradiation20
.
Together with other cell types such as macrophages these factors
contribute to a tumor microenvironment that is capable of modulating the HIF
response itself. These complex interactions together influence the phenotype
and the behavior of the tumor in terms of progression, invasiveness or
metastatic potential20
.
HIF in Renal Development
Hypoxia occurs physiologically during embryogenesis, and
stabilization of HIF alpha subunits has been demonstrated during
nephrogenesis. Although the role of HIF signaling in renal development is
unclear, HIF alpha subunits exhibit a cell type and stage-specific expression
pattern during nephrogenesis. This correlated with the expression of important

Review of Literature
34
angiogenic factors, such as VEGF and endoglin, supporting the notion that
HIF signaling has a regulatory role in the developing kidney. HIF-1 alpha
expression was predominantly found in the cortical and medullary collecting
ducts, S-shaped bodies, and glomerular cells. The expression of HIF-2 alpha
was detectable in podocytes, as well as in cortical and medullary endothelial
and interstitial cells, but was absent in the fully developed kidney.
Furthermore, a distinct role for HIF-1 alpha and HIF-2 alpha in glomerular
development has been proposed based on the finding that S- or comma-shaped
bodies expressed only HIF-1 alpha, whereas more mature glomeruli expressed
HIF-2 alpha21,22
.
HIF 1 alpha and breast cancer
Dales JP et al., 2010- Using real-time quantitative reverse
transcription PCR assays, mRNA concentrations of total HIF-1 alpha and 4
variants in breast tissue specimens in a series of 29 normal tissues or benign
lesions (normal/benign) and 53 primary carcinomas were measured. In breast
cancers HIF-1 alpha splice variant levels were compared to
clinicopathological parameters including tumour microvessel density and
metastasis-free survival. HIF-1 alpha isoforms containing a three base pairs
TAG insertion between exon 1 and exon 2 and HIF-1 alpha 736 mRNAs were
found expressed at higher levels in oestrogen receptor (OR)-negative
carcinomas compared to normal/benign tissues (p = 0.009 and p = 0.004
respectively). In breast carcinoma specimens, lymph node status was

Review of Literature
35
significantly associated with HIF-1 alpha TAG mRNA levels (p = 0.037).
Significant statistical association was found between tumour grade and HIF-1
alpha TAG (p = 0.048) and total HIF-1 alpha (p = 0.048) mRNA levels. It also
showed that high HIF-1 alpha TAG mRNA levels correlated with shortened
metastasis free survival (p = 0.01)23
.
Kallergi G et al., 2009- The expression of pFAK, HIF-1 alpha, VEGF
and VEGF2 in CTCs of patients with metastatic breast cancer could explain
the metastatic potential. This was studied using peripheral blood mononuclear
cells (PBMCs) staining with a monoclonal A45-B/B3 pancytokeratin antibody
in combination with either VEGF or VEGFR2 or HIF-1 alpha or pFAK
antibodies24
.
Saponaro C et al., 2013- The expression of VEGF and HIF-1 alpha
and microvessel density (MVD) in 26 BRCA1-2 carriers and 58 BRCAX
compared to 77 sporadic breast cancers was analysed by
immunohistochemistry. The percentage of nuclear HIF-1 alpha expression and
MVD was higher in the BRCA1 carriers than in BRCAX cancers (p=0.05) and
in all familial than in sporadic tumor tissues (p=0.0045) suggesting that
angiogenesis plays a crucial role in BRCA1-2 carrier breast cancers25
.
HIF 1 alpha and colorectal cancer
Simiantonaki N et al., 2008 – HIF-1 expression in normal colonic
mucosa, hyperplastic polyps (HPP), sessile serrated adenomas (SSA),
Review of Literature
36
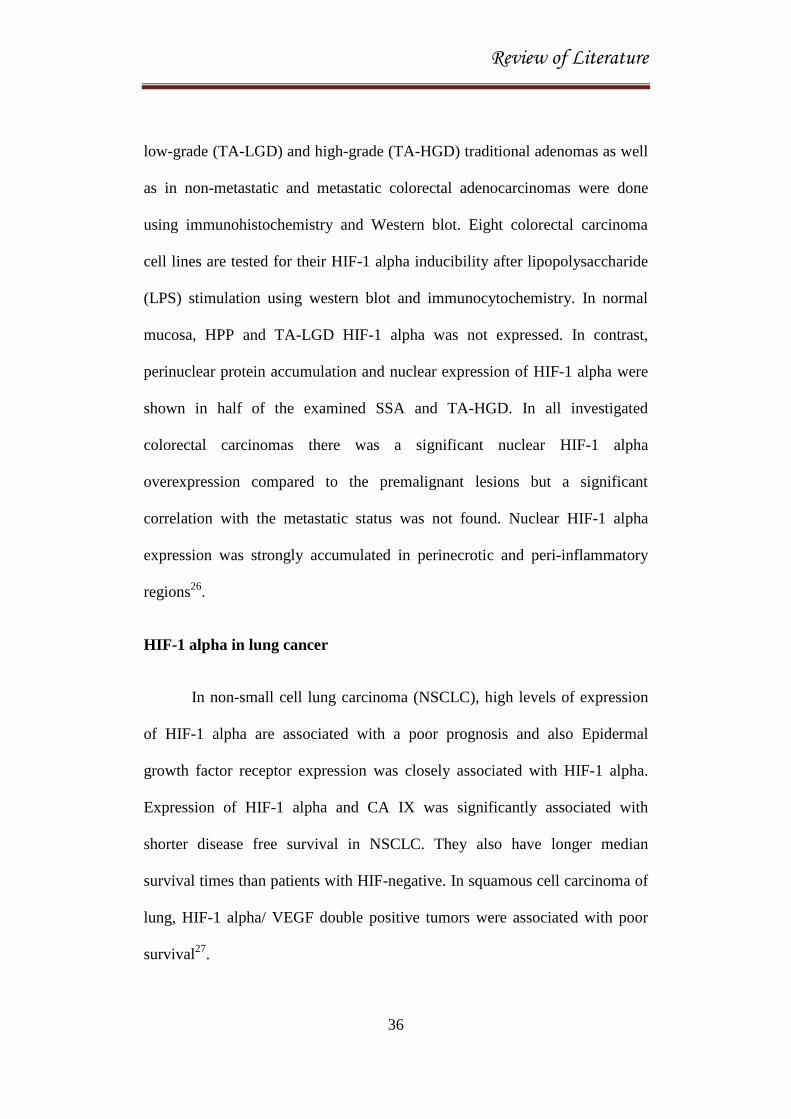
low-grade (TA-LGD) and high-grade (TA-HGD) traditional adenomas as well
as in non-metastatic and metastatic colorectal adenocarcinomas were done
using immunohistochemistry and Western blot. Eight colorectal carcinoma
cell lines are tested for their HIF-1 alpha inducibility after lipopolysaccharide
(LPS) stimulation using western blot and immunocytochemistry. In normal
mucosa, HPP and TA-LGD HIF-1 alpha was not expressed. In contrast,
perinuclear protein accumulation and nuclear expression of HIF-1 alpha were
shown in half of the examined SSA and TA-HGD. In all investigated
colorectal carcinomas there was a significant nuclear HIF-1 alpha
overexpression compared to the premalignant lesions but a significant
correlation with the metastatic status was not found. Nuclear HIF-1 alpha
expression was strongly accumulated in perinecrotic and peri-inflammatory
regions26
.
HIF-1 alpha in lung cancer
In non-small cell lung carcinoma (NSCLC), high levels of expression
of HIF-1 alpha are associated with a poor prognosis and also Epidermal
growth factor receptor expression was closely associated with HIF-1 alpha.
Expression of HIF-1 alpha and CA IX was significantly associated with
shorter disease free survival in NSCLC. They also have longer median
survival times than patients with HIF-negative. In squamous cell carcinoma of
lung, HIF-1 alpha/ VEGF double positive tumors were associated with poor
survival27
.

Review of Literature
37
HIF 1 alpha in Clear Cell Renal Cell Carcinoma
Klatte T et al., 2007- Immunohistochemical analysis was done on a
tissue microarray constructed from paraffin-embedded primary tumor
specimens from 357 patients treated by nephrectomy for renal cell carcinoma
(RCC). HIF-1 alpha expression was greater in RCC than in benign tissue.
Clear cell RCC showed the highest expression levels. In clear cell RCC, HIF-1
alpha was significantly correlated with markers of apoptosis (p21, p53), the
mammalian target of rapamycin pathway (pAkt, p27), CXCR3, and proteins of
the vascular endothelial growth factor family. HIF-1 alpha was correlated with
CAIX and CAXII in localized, but not in metastatic RCC. HIF-1 alpha
expression predicted outcome in metastatic patients. Patients with high HIF-1
alpha expression (>35%) had significantly worse survival than patients with
low expression. HIF-1 alpha and CAIX expression are the strongest
independent prognostic factors for patients with metastatic clear cell RCC28
.
HIF 1 alpha and tongue cancer
Kang FW et al., 2013 – In this study, immunohistochemistry and
reverse transcription-polymerase chain reaction (RT-PCR) were done in 49
tumor samples and 15 adjacent non-tumor samples. The expression of HIF-1
alpha was detected in 87.76% (43/49) of the TSCC samples and in 33.33%
(5/15) of the adjacent non-tumor tissues. The expression of vascular
endothelial growth factor (VEGF) was also observed in 83.67% (41/49) of the

Review of Literature
38
TSCC samples and in only 20% (3/15) of the adjacent non-tumor samples at a
low level. RT-PCR revealed that the mRNA expression of HIF-1 alpha and
VEGF was present in the tumor tissues but not in adjacent normal tissues. The
overexpression of HIF-1 alpha was significantly associated with T
classification (p=0.01), lymphatic metastasis (p=0.05) and histological
differentiation (p<0.001). Furthermore, HIF-1 alpha overexpression was
significantly associated with poor overall (p=0.001) and disease-free survival
rates (p=0.01) independent of T stage and lymphatic metastasis. The Cox
proportional hazards regression model demonstrated that the level of HIF-1
alpha expression may be an independent prognostic factor for TSCC. HIF-1
alpha overexpression was observed in TSCC and its overexpression suggests a
poor prognosis. HIF-1 alpha may be a molecular marker for predicting the
prognosis of TSCC29
.
HIF 1 alpha and gastric cancer
Griffiths EA et al., 2007 – It was found that it is a weak prognostic
factor for survival when it is studied between gastric and gastro-oesophageal
adenocarcinoma in 177 specimens. HIF-1 alpha expression was not observed
in normal gastric mucosa but increased in density and intensity with
progression from H. pylori-associated gastritis, intestinal metaplasia, dysplasia
to adenocarcinoma when it was demonstrated using immunohistochemistry30
.

Review of Literature
39
Liang X et al., 2008- HIF-1 alpha protein expression, VEGF-C protein
expression, lymphatic vessel density (LVD) and blood vessel density (BVD)
in OSCC were investigated by means of immunohistochemistry in samples
from 65 cases of OSCC. The density of the lymphatic microvessels and blood
microvessels immunohistochemically stained by LYVE-1 and CD34 antibody
respectively was calculated. The association between the HIF-1 alpha
expression and the clinicopathological parameters was evaluated. HIF-1 alpha
overexpression occurred in 43 out of the 65 tumor samples (66.2%), while
VEGF-C overexpression was observed in 34 out of the 65 tumor samples
(52.3%). Higher LVD was found in both high HIF-1 alpha and high VEGF-C
expression cases. HIF-1 alpha overexpression was significantly correlated
with VEGF-C overexpression (p=0.018, Chi-square test), higher LVD
(p<0.001, Mann–Whitney U-test), and regional lymph nodal involvement
(p=0.004, Chi-square test) as well as UICCTMN classification (p=0.043,
Chi-square test), respectively31
.
Wang Net al.,2014 – In this study they examined HIF-1 alpha,
metallothionein and SLUG expression in papillary thyroid carcinoma and
assessed association of their expression with clinicopathological indicators in
129 patients using immunohistochemistry of which 61 nodular hyperplasia
and 118 normal thyroid tissue specimens. Concomitant high expression of all
these three molecules is significantly associated with high TNM stage and
LNM32
.

Review of Literature
40
LR Alves et al., 2012- Restriction fragment length polymorphism
analysis was used to investigate HIF-1 alpha C1779T and G1790A
polymorphisms in 48 patients with epithelial dysplasia (ED) and 40 patients
with OSCC. Additionally, 88 elderly individuals without head and neck
squamous cell carcinoma were enrolled as a control group. The frequency of
the TT, GA and AA genotypes was higher in patients with ED and OSCC
when compared with controls. However CT genotype was associated with
moderate epithelial dysplasia in ED patients, while TT genotype was more
frequent in OSCC patients33
.
Rodolico V et al., 2011- They studied tumor specimens from
62 OSCC; a higher prevalence of tumors in TNM stage II and also in T2 class
between OSCC infected positive HPV16 DNA than non-infected ones was
observed. HIF-1 alpha positivity was detected throughout the analysed fields,
not associated with areas of necrosis and also observed in cells immediately
adjacent to blood vessels. A significant increase in mean values of the HIF-1
alpha labeling indexes was observed for T1-T2, as well for stage I-II in the
infected positive HPV16 DNA tumors than non-infected ones. HIF-1 alpha
and HPV16 E7 labeling indexes showed a significantly positive correlation
which suggested a positive association between HPV16 E7 and HIF-1 alpha
expression34
.
Peyssonnaux C et al., 2005- HIF-1 alpha was induced by bacterial
infection even under normoxia and regulated the production of key immune

Review of Literature
41
effector molecules, including granule proteases, antimicrobial peptides, nitric
oxide, and TNF-α. Mice lacking HIF-1 alpha in their myeloid cell lineage
showed decreased bactericidal activity and failed to restrict systemic spread of
infection from an initial tissue focus. Conversely, activation of the HIF-1
alpha pathway through deletion of von Hippel–Lindau tumor-suppressor
protein or pharmacologic inducers supported myeloid cell production of
defense factors and improved bactericidal capacity. HIF-1 alpha control of
myeloid cell activity in infected tissues could represent a novel therapeutic
target for enhancing host defense35
.
Shin MR et al., 2014- Isocudraxanthone K (IK) is a novel, natural
compound from a methanol extract of the root bark of Cudraniatricuspidata.
IK caused time dependent phosphorylation of Akt, p38, and ERK
(extracellular signal-regulated kinase). In addition, IK increased the cytosolic
to nuclear translocation of nuclear factor-𝜅B (NF-𝜅B) p65 and the degradation
and phosphorylation of I𝜅B-𝛼 in HN4 and HN12 cells. Furthermore, IK
treatment downregulated HIF-1 alpha and its target gene, vascular endothelial
growth factor (VEGF). Cobalt chloride (CoCl2), a HIF-1 alpha activator,
attenuated the IK-induced growth-inhibiting and apoptosis-inducing effects,
and blocked IK-induced expression of apoptosis regulatory proteins, such as
Bax, Bcl-2, caspase-3, caspase-8, and caspase-9 and cytochrome c.
Collectively, these data provide the first evidence of anti-proliferative and

Review of Literature
42
apoptosis-inducing effects of IK as a HIF-1 alpha inhibitor and suggest it may
be a drug candidate for chemotherapy against oral cancer36
.
Lin PY et al., 2008- The expression of HIF-1 alpha in 57 specimens of
oral squamous cell carcinoma (OSCC), 41 specimens of oral epithelial
dysplasia (OED, 12 mild, 17 moderate, and 12 severe OED cases), and
14 specimens of normal oral mucosa (NOM) by immunohistochemistry was
analyzed. The mean nuclear HIF-1 alpha labeling indices (LIs) increased
significantly from NOM (9 +/- 6%) through mild OED (25 +/- 18%), moderate
OED (41 +/- 27%), and severe OED (42 +/- 22%) to OSCC samples
(55 +/- 23%, p < 0.001). A significant correlation was found between the
higher mean nuclear HIF-1 alpha LI and OSCCs with larger tumor size
(p< 0.001), regional lymph node metastasis (p< 0.001), or more advanced
clinical stages (p< 0.001). Only larger tumor size (p= 0.002) and nuclear
HIF-1 alpha LI >or= 60% (p= 0.048) were identified as independent
unfavorable prognosis factor by multivariate analyses with Cox regression
model. Kaplan-Meier curve showed that OSCC patients with a nuclear
HIF-1 alpha LI ≥ 60% had a significantly poorer cumulative survival than
those with a nuclear HIF-1 alpha LI < 60% (log-rank test, p= 0.022)37
.
Zhang X et al., 2013 - Expression of HIF-1 alpha, Glut-1 and CA9
were detected in clinical samples of eight normal oral mucosa, 85 transitional
areas of oral squamous cell carcinoma (OSCC) and 28 OED with or without
malignant conversion using immunohistochemistry and were also

Review of Literature
43
comparatively detected in immortalised human oral keratinocyte (IHOK) and
OSCC cell lines under hypoxia using immunoblotting. Sequential expression
of HIF-1 alpha, Glut-1 and CA9 was found both in transitional areas of OSCC
and cell lines of IHOK and OSCC under hypoxia, supporting hypoxia-aerobic
and glycolysis-acidosis axis. Expression of all proteins showed significant
association with malignant conversion of OED and CA9 was an independent
risk factor of malignant transformation of OED. But the predictability of
malignant transformation was improved when all three proteins were applied
together38
.
HIF 1 alpha and prognosis
Filies T et al., 2005– In this study, immunohistochemistry and tissue
microarray were done to analyze the expression of HIF-1 alpha and its
prognosis in floor of the mouth in 85 patients. Using kaplan-Meier curves, log
rank tests and multivariate cox regression analysis it was found that HIF-1
alpha is overexpressed in disease free period, improved 5-year survival rate
independent from nodal status and tumour size. The absence of HIF-1 alpha
expression specified a subgroup of high-risk patients (p < 0.05)39
.
Dos Santos M et al., 2012 - In this study, HIF-1 alpha expression by
immunohistochemistry in tissue microarrays and its relationship with clinical
findings, histopathological results and survival of 66 patients with squamous
cell carcinoma of the lower mouth was done. They demonstrated that high

Review of Literature
44
HIF-1 alpha expression is associated with local disease-free survival,
independently from the choice of treatment. Furthermore, high expression of
HIF-1 alpha in patients treated with postoperative radiotherapy was associated
with survival, therefore being a novel prognostic marker in squamous cell
carcinoma of the mouth. Additionally, it also showed that MVD was
associated with HIF1alpha expression and local disease relapse40
.

Results

Results
45
SAMPLE CHARACTERISTICS:
The study population includes 60 cases taken from the archival blocks.
They were categorized into four groups. Group I (n=15) comprised of normal
mucosa samples. Group II (n= 15) comprised of mild epithelial dysplasia
samples. Group III (n=15) comprised of both moderate and severe epithelial
dysplasia samples. Group IV (n=15) comprised of oral squamous cell
carcinoma samples. All the samples were analyzed for the immunoreactivity
of HIF-1 alpha stain.
DISTRIBUTION OF AGE IN THE STUDY GROUPS: (TABLE 1 &
GRAPH 1):
The distribution of age of the patients was divided into 3 groups:
20-40 years, 41-60 years and those above 61 years of age. Group I consisted of
14 (93.3%) cases in the age group 20-40 years and 1 (6.6%) case in the age
group of 41-60. Group II consisted of 5 (33.3%) cases in 20-40 years, 9 (60%)
cases in 41-60 years and 1 (6.6%) cases above 61 years. Group III consisted of
6 (40%) cases in 20-40 years, 7 (46.6%) cases in 41-60 year and 2 (13.3%)
case of above 61 years. Group IV consisted of 2 (13.3%) cases in 20-40 years,
8 (53.3%) cases in the 41-60 years and 5 (33.3%) cases above 61 years of age.

Results
46
DISTRIBUTION OF GENDER IN THE STUDY GROUPS: (TABLE 2 &
GRAPH 2):
In group I, 8 (53.3%) were males and there was 7 (46.6%) female. In
group II, all 15 (100%) were males. In group III, 11 (73.3%) were males and
4 (26.6%) were females. In group 1V, 9 (60%) were males and 6 (40%) were
females.
DISTRIBUTION OF HABITS IN THE STUDY GROUPS (TABLE 3 &
GRAPH 3):
Based on the prevalence of habits in the study groups, they were
categorized in to six groups. They were those without any habits, those with
habit of chewing tobacco and consuming alcoholic beverages, chewing
tobacco alone, smoking alone, consuming alcoholic beverages alone, chewing
tobacco, smoking & consuming alcoholic beverages. In group I (control
group) none of them had any habits. In group II, there were 7 (46.6%) with
habit of chewing tobacco and consuming alcoholic beverages, 4 (26.6%) had
chewing tobacco alone, 1 (6.6%) had smoking alone, 2 (13.3%) had
consuming alcoholic beverages alone and 1 (6.6%) had chewing tobacco,
smoking & consuming alcoholic beverages. In Group III, 8 (53.3%) of the
cases had no habit, 1 (6.6%) had the habit of chewing tobacco and smoking,
5 (33.3%) had the habit of chewing tobacco alone and 1 (6.6%) had the habit
of chewing tobacco, smoking and consuming alcoholic beverages.

Results
47
In group IV, 9 (60%) had no habits, 5 (33.3%) had the habit of chewing alone
and 1 (%) had the habit of smoking alone (p=0.000).
DISTRIBUTION OF SITE IN THE STUDY GROUPS (TABLE 4 &
GRAPH 4):
In group I, 15(100%) incisional biopsies were from retro-molar region.
In group II, 14 (93.3%) cases were from buccal mucosa and 1 (6.6%) were
from alveolar mucosa. In group III, 10 (66.6%) were from buccal mucosa and
5 (33.3%) were from lateral border of tongue. In group IV, 4 (26.6%) was
from buccal mucosa, 8 (53.3%) were from the lateral border of tongue,
2 (13.3%) were from palatal region and 1 (6.6%) cases were from commissure
of the mouth (p=0.007).
DISTRIBUTION OF STAINING OF HIF-1 ALPHA IN THE STUDY
GROUPS (TABLE 5 & GRAPH 5):
Of the total number of cases subjected to HIF-1 alpha staining, in
group I, 12 (80%) showed positivity while 3 (20%) were negative. In group II,
14 (93.3%) showed positivity and 1 (6.6%) were negative. In group III,
14 (93.3%) showed positivity and 1 (6.6%) were negative. Group IV showed
100% positivity (p=0.246).
Results
48
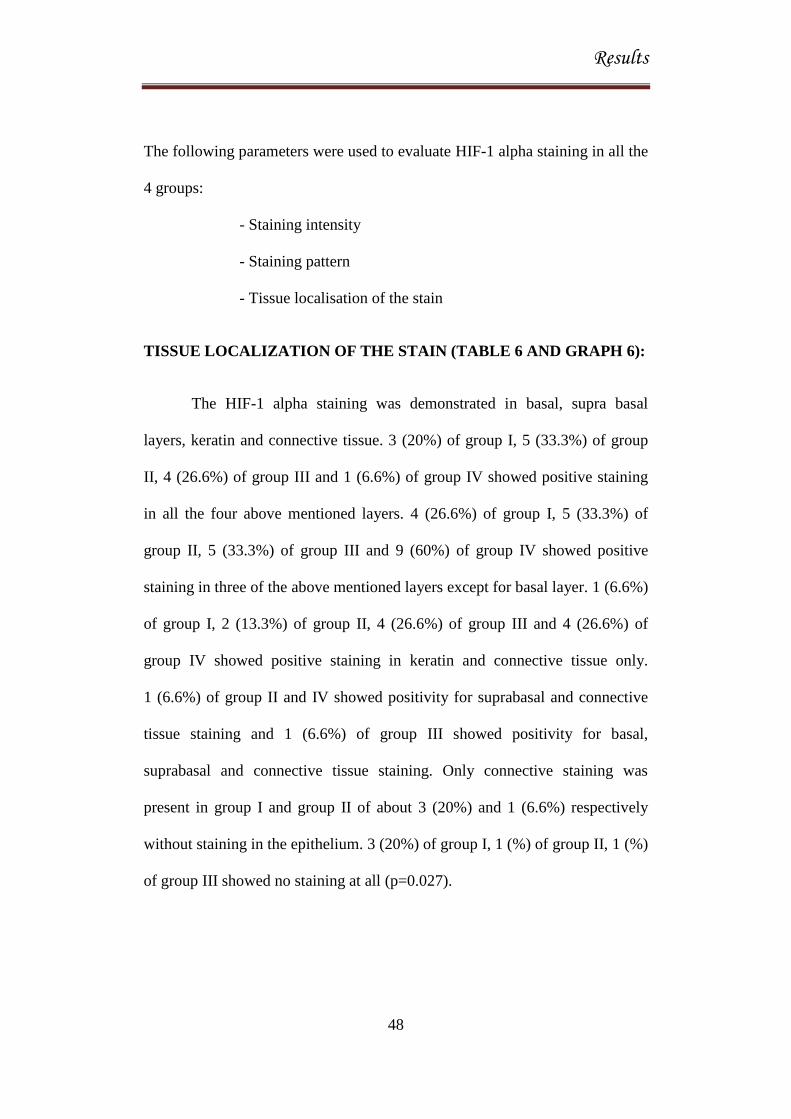
The following parameters were used to evaluate HIF-1 alpha staining in all the
4 groups:
- Staining intensity
- Staining pattern
- Tissue localisation of the stain
TISSUE LOCALIZATION OF THE STAIN (TABLE 6 AND GRAPH 6):
The HIF-1 alpha staining was demonstrated in basal, supra basal
layers, keratin and connective tissue. 3 (20%) of group I, 5 (33.3%) of group
II, 4 (26.6%) of group III and 1 (6.6%) of group IV showed positive staining
in all the four above mentioned layers. 4 (26.6%) of group I, 5 (33.3%) of
group II, 5 (33.3%) of group III and 9 (60%) of group IV showed positive
staining in three of the above mentioned layers except for basal layer. 1 (6.6%)
of group I, 2 (13.3%) of group II, 4 (26.6%) of group III and 4 (26.6%) of
group IV showed positive staining in keratin and connective tissue only.
1 (6.6%) of group II and IV showed positivity for suprabasal and connective
tissue staining and 1 (6.6%) of group III showed positivity for basal,
suprabasal and connective tissue staining. Only connective staining was
present in group I and group II of about 3 (20%) and 1 (6.6%) respectively
without staining in the epithelium. 3 (20%) of group I, 1 (%) of group II, 1 (%)
of group III showed no staining at all (p=0.027).

Results
49
STAINING INTENSITY
COMPARISON OF OVERALL HIF-1 ALPHA INTENSITY BETWEEN
THE STUDY GROUPS (TABLE 7 & GRAPH 7):
On comparing the HIF-1 alpha intensity between the study groups,
Group I showed 3 (20%), 10 (66.6%) and 2 (13.3%) of negative, mild and
moderate staining respectively. Group II showed 1 (6.6%), 11 (23.3%) and
3 (20%) of negative, mild and moderate staining respectively. In Group III,
1 (6.6%), 7 (46.6%) and 7 (46.6%) cases showed negative, mild and moderate
staining respectively. In group IV, 14 (93.3%) and 1 (6.6%) cases showed
mild and moderate staining respectively. There was no intense staining in any
of the groups (p=0.050).
COMPARISON OF BASAL LAYER INTENSITY BETWEEN THE
STUDY GROUPS (TABLE 8 & GRAPH: 8)
On analyzing the basal layer intensity of HIF-1 alpha in all the four
groups, in group I, 12 (80%) and 3 (20%) cases showed negative and mild
staining respectively. In group II, 10 (66.6%) and 5 (33.3%) cases showed
negative and mild staining respectively. In group III, 10 (66.6%), 3 (33.3%)
and 2 (13.3%) cases showed negative and mild and moderate staining
respectively. In group IV, 14 (93.3%) and 1 (6.6%) cases showed negative and
mild staining respectively. There was no intense staining in any of the groups
(p=0.141).
Results
50
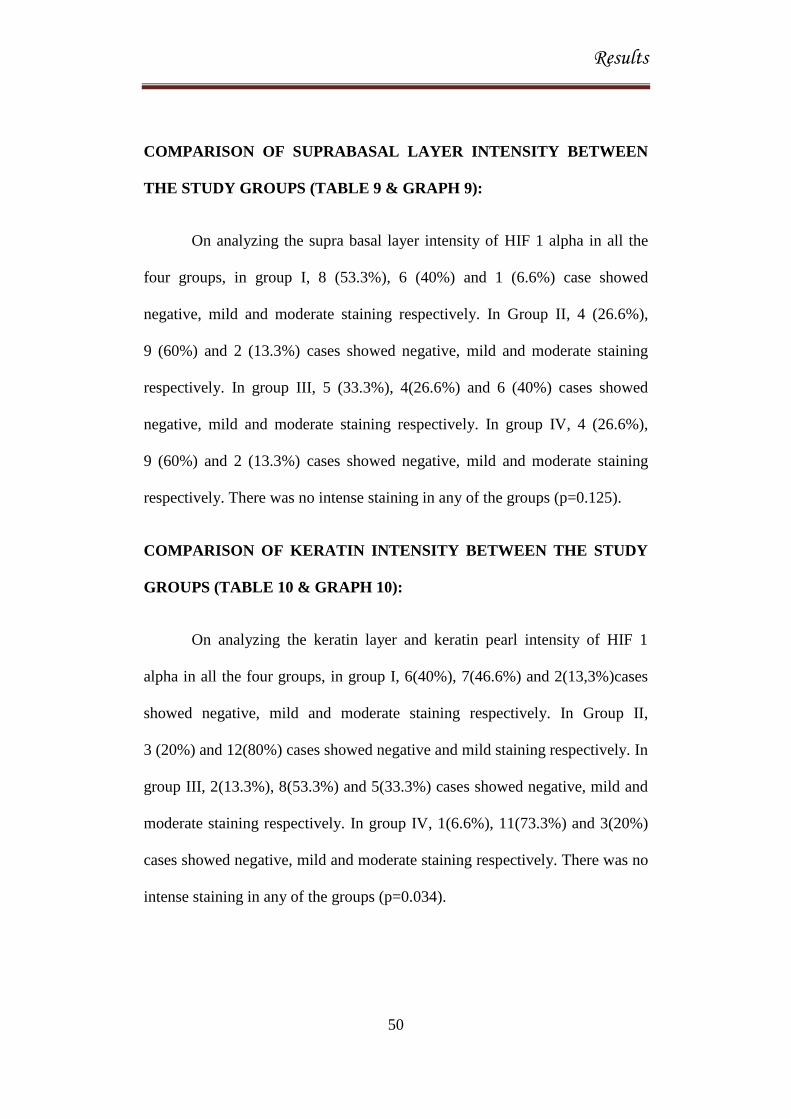
COMPARISON OF SUPRABASAL LAYER INTENSITY BETWEEN
THE STUDY GROUPS (TABLE 9 & GRAPH 9):
On analyzing the supra basal layer intensity of HIF 1 alpha in all the
four groups, in group I, 8 (53.3%), 6 (40%) and 1 (6.6%) case showed
negative, mild and moderate staining respectively. In Group II, 4 (26.6%),
9 (60%) and 2 (13.3%) cases showed negative, mild and moderate staining
respectively. In group III, 5 (33.3%), 4(26.6%) and 6 (40%) cases showed
negative, mild and moderate staining respectively. In group IV, 4 (26.6%),
9 (60%) and 2 (13.3%) cases showed negative, mild and moderate staining
respectively. There was no intense staining in any of the groups (p=0.125).
COMPARISON OF KERATIN INTENSITY BETWEEN THE STUDY
GROUPS (TABLE 10 & GRAPH 10):
On analyzing the keratin layer and keratin pearl intensity of HIF 1
alpha in all the four groups, in group I, 6(40%), 7(46.6%) and 2(13,3%)cases
showed negative, mild and moderate staining respectively. In Group II,
3 (20%) and 12(80%) cases showed negative and mild staining respectively. In
group III, 2(13.3%), 8(53.3%) and 5(33.3%) cases showed negative, mild and
moderate staining respectively. In group IV, 1(6.6%), 11(73.3%) and 3(20%)
cases showed negative, mild and moderate staining respectively. There was no
intense staining in any of the groups (p=0.034).
Results
51
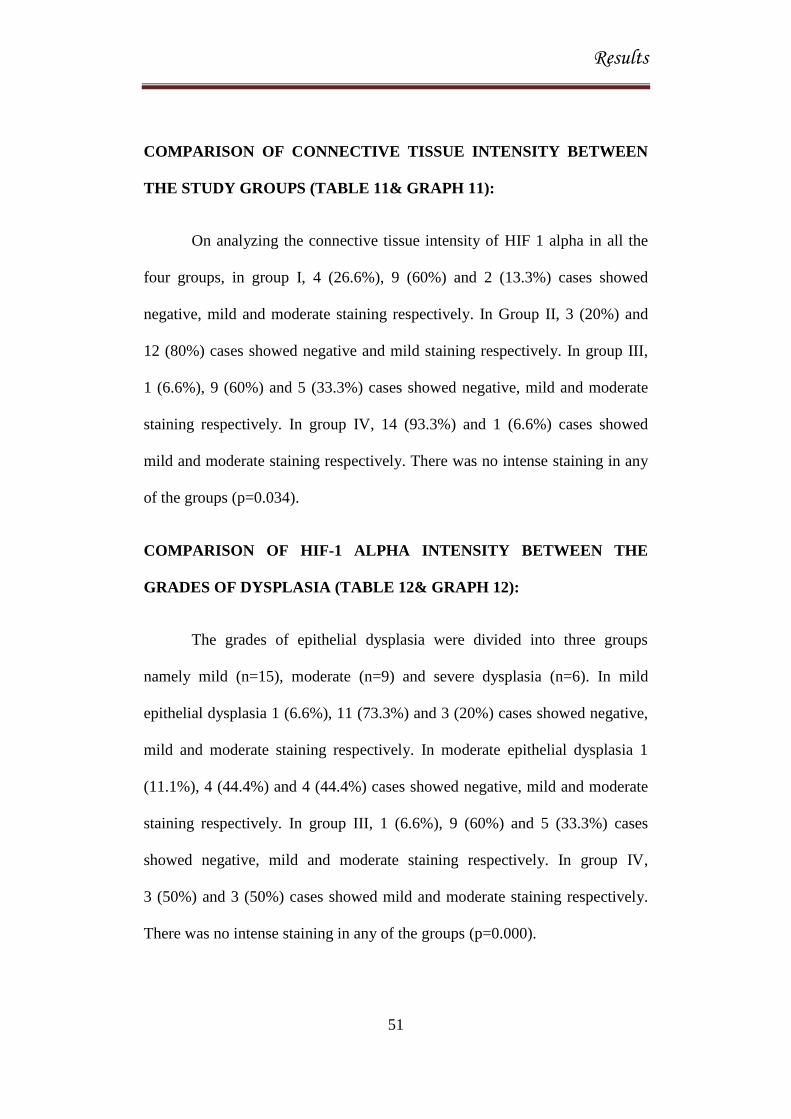
COMPARISON OF CONNECTIVE TISSUE INTENSITY BETWEEN
THE STUDY GROUPS (TABLE 11& GRAPH 11):
On analyzing the connective tissue intensity of HIF 1 alpha in all the
four groups, in group I, 4 (26.6%), 9 (60%) and 2 (13.3%) cases showed
negative, mild and moderate staining respectively. In Group II, 3 (20%) and
12 (80%) cases showed negative and mild staining respectively. In group III,
1 (6.6%), 9 (60%) and 5 (33.3%) cases showed negative, mild and moderate
staining respectively. In group IV, 14 (93.3%) and 1 (6.6%) cases showed
mild and moderate staining respectively. There was no intense staining in any
of the groups (p=0.034).
COMPARISON OF HIF-1 ALPHA INTENSITY BETWEEN THE
GRADES OF DYSPLASIA (TABLE 12& GRAPH 12):
The grades of epithelial dysplasia were divided into three groups
namely mild (n=15), moderate (n=9) and severe dysplasia (n=6). In mild
epithelial dysplasia 1 (6.6%), 11 (73.3%) and 3 (20%) cases showed negative,
mild and moderate staining respectively. In moderate epithelial dysplasia 1
(11.1%), 4 (44.4%) and 4 (44.4%) cases showed negative, mild and moderate
staining respectively. In group III, 1 (6.6%), 9 (60%) and 5 (33.3%) cases
showed negative, mild and moderate staining respectively. In group IV,
3 (50%) and 3 (50%) cases showed mild and moderate staining respectively.
There was no intense staining in any of the groups (p=0.000).

Results
52
COMPARISON OF HIF-1 ALPHA INTENSITY BETWEEN THE
GRADES OF OSCC (TABLE 13& GRAPH 13):
The grades of OSCC were divided into well differentiated (n=10),
moderately differentiated (n=3) and severely differentiated OSCC (n=2). In
well differentiated OSCC, 10 (100%) cases showed mild intensity. In
moderately differentiated OSCC, 2 (66.6%) and 1 (33.3 %) case showed mild
and moderate intensity respectively. In poorly differentiated OSCC, 2 (100%)
cases showed mild intensity (p=0.001).
COMPARISON OF HIF-1 ALPHA INTENSITY BETWEEN GROUPS I
AND GROUP II (TABLE 14& GRAPH 14):
Group I showed 3 (20%) cases negative, 10 (66.6%) cases mild and 2
(13.3%) cases moderate intensity of staining. Group II showed 1 (6.6%) case
negative, 11 (73.3%) cases mild and 3 (20%) cases moderate intensity of
staining (p=0.536).
COMPARISON OF HIF-1 ALPHA INTENSITY BETWEEN GROUPSI
AND GROUP III (TABLE 15 & GRAPH 15):
Group I showed 3 (20%) cases negative, 10 (66.6%) cases mild and 2
(13.3%) cases moderate intensity of staining. Group III showed 1 (6.6%) case
negative, 7 (46.6%) cases mild and 7(46.6%) cases moderate of intensity
(p=0.116).
Results
53
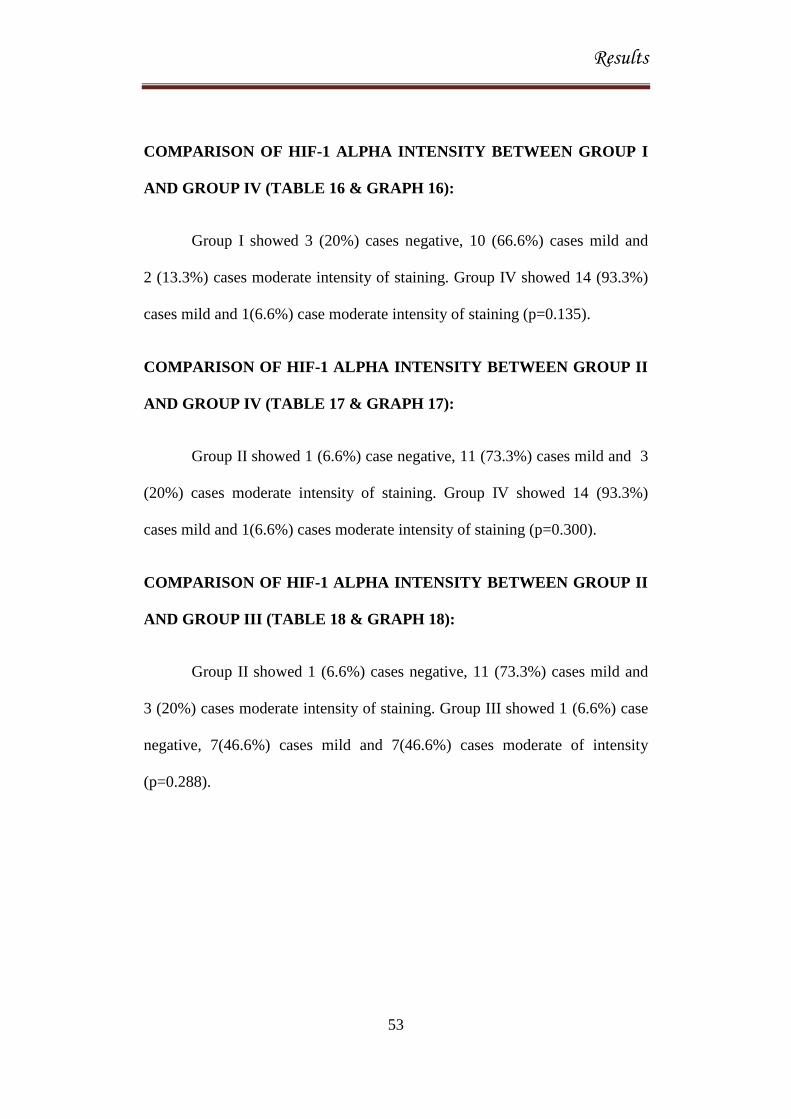
COMPARISON OF HIF-1 ALPHA INTENSITY BETWEEN GROUP I
AND GROUP IV (TABLE 16 & GRAPH 16):
Group I showed 3 (20%) cases negative, 10 (66.6%) cases mild and
2 (13.3%) cases moderate intensity of staining. Group IV showed 14 (93.3%)
cases mild and 1(6.6%) case moderate intensity of staining (p=0.135).
COMPARISON OF HIF-1 ALPHA INTENSITY BETWEEN GROUP II
AND GROUP IV (TABLE 17 & GRAPH 17):
Group II showed 1 (6.6%) case negative, 11 (73.3%) cases mild and 3
(20%) cases moderate intensity of staining. Group IV showed 14 (93.3%)
cases mild and 1(6.6%) cases moderate intensity of staining (p=0.300).
COMPARISON OF HIF-1 ALPHA INTENSITY BETWEEN GROUP II
AND GROUP III (TABLE 18 & GRAPH 18):
Group II showed 1 (6.6%) cases negative, 11 (73.3%) cases mild and
3 (20%) cases moderate intensity of staining. Group III showed 1 (6.6%) case
negative, 7(46.6%) cases mild and 7(46.6%) cases moderate of intensity
(p=0.288).

Results
54
COMPARISON OF HIF-1 ALPHA INTENSITY BETWEEN GROUP III
AND GROUP IV (TABLE 19 & GRAPH 19):
Group III showed 1 (6.6%) case negative, 7(46.6%) cases mild and
7(46.6%) cases moderate intensity of staining. Group IV showed 14 (93.3%)
cases mild and 1(6.6%) case moderate intensity of staining (p=0.020).
KAPPA VALUE:
Three observers analyzed the slides for scoring the intensity of
staining. The overall Kappa value for the inter observer variation is 0.7.

TABLE 1: DISTRIBUTION OF AGE IN STUDY GROUPS (N=60)
GRAPH 1: DISTRIBUTION OF AGE IN STUDY GROUPS (N=60)
GROUP I: NORMAL MUCOSA
GROUP II: MILD DYSPLASIA
GROUP III: MODERATE & SEVERE DYSPLASIA
GROUP IV: OSCC
93.3%
33.3%
40%
13.3%
6.6%
60 %
46.6%
53.3%
6.6%
13.3%
33.3%
0%
10%
20%
30%
40%
50%
60%
70%
80%
90%
100%
GROUP I GROUP II GROUP III GROUP IV
DIS
TR
IBU
TIO
N O
F S
TU
DY
GR
OU
PS
(%)
AGE GROUPS IN YEARS
20 - 40
41 - 60
ABOVE 61
AGE
GROUPS
IN YEARS
GROUP I
n =15
GROUP II
n =15
GROUP III
n =15
GROUP IV
n =15
20- 40 14 (93.3%) 5 (33.3%) 6 (40%) 2 (13.3%)
41 – 60 1 (6.6%) 9 (60%) 7 (46.6%) 8 (53.3%)
ABOVE 61 0 1 (6.6%) 2 (13.3%) 5 (33.3%)

TABLE 2: DISTRIBUTION OF GENDER IN STUDY GROUPS (N=60)
GENDER GROUP I
n =15
GROUP II
n =15
GROUP III
n =15
GROUP IV
n =15
MALE 8 (53.3%) 15 (100%) 11 (73.3%) 9 (60%)
FEMALE 7 (46.6%) 0 4 (26.6%) 6 (40%)
GRAPH 2: DISTRIBUTION OF GENDER IN STUDY GROUPS (N=60)
GROUP I: NORMAL MUCOSA
GROUP II: MILD DYSPLASIA
GROUP III: MODERATE & SEVERE DYSPLASIA
GROUP IV: OSCC
53.3%
100%
73.3%
60%
46.6%
26.6%
40%
0%
20%
40%
60%
80%
100%
120%
GROUP I GROUP II GROUP III GROUP IV
DIS
TR
IBU
TIO
N O
F S
TU
DY
GR
OU
PS
(%)
GENDER
MALE
FEMALE

TABLE 3: DISTRIBUTION OF HABITS IN THE STUDY GROUPS (N=60)
HABITS GROUP I
n=15
GROUP II
n =15
GROUP III
n =15
GROUP IV
n =15 p Value
NO HABITS 15 (100%) 0 8 (53.3%) 9 (60%)
0.000*
CHEWING+
ALCOHOL(C+A) 0 7 (46.6%) 1 (6.6%) 0
CHEWING ALONE (C) 0 4(26.6%) 5 (33.3%) 5 (33.3%)
SMOKING ALONE (S) 0 1 (6.6%) 0 1 (%)
ALCOHOL ALONE (A) 0 2 (13.3%) 0 0
CHEWING+SMOKING
+ ALCOHOL(C+S+A) 0 1 (6.6%) 1 (6.6%) 0
GRAPH 3: DISTRIBUTION OF HABITS IN THE STUDY GROUPS (N=60)
10
0%
46
.6%
26
.6%
6.6
%
33
.3%
6.6
%
53
.3%
6.6
%
33
.3%
6.6
%
60
.0%
33
.3%
6.6
%
0%
20%
40%
60%
80%
100%
120%
NO
HABITS
C+A C S A C+S+A
DIS
TR
IBU
TIO
N O
F S
TU
DY
GR
OU
PS
(%
)
HABITS
GROUP I
GROUP II
GROUP III
GROUP IV
GROUP I: NORMAL MUCOSA
GROUP II: MILD DYSPLASIA
GROUP III: MODERATE & SEVERE DYSPLASIA
GROUP IV: OSCC
* p value < 0.05 is significant
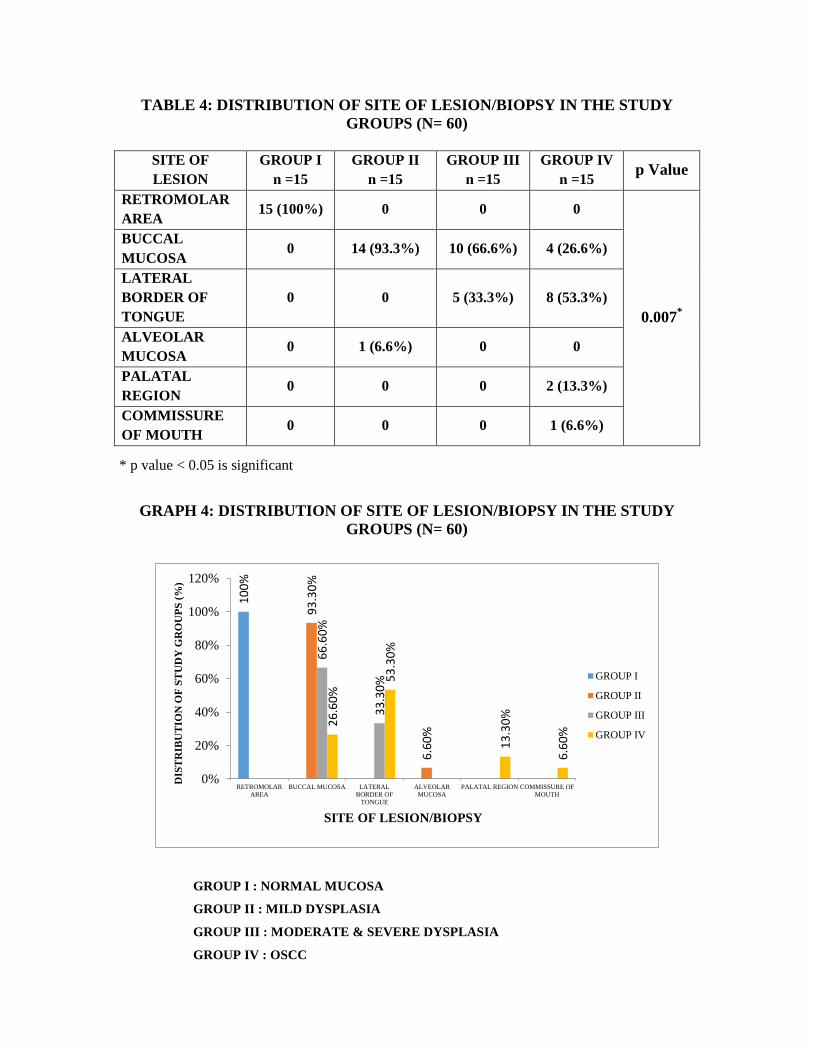
TABLE 4: DISTRIBUTION OF SITE OF LESION/BIOPSY IN THE STUDY
GROUPS (N= 60)
SITE OF
LESION
GROUP I
n =15
GROUP II
n =15
GROUP III
n =15
GROUP IV
n =15 p Value
RETROMOLAR
AREA 15 (100%) 0 0 0
0.007*
BUCCAL
MUCOSA 0 14 (93.3%) 10 (66.6%) 4 (26.6%)
LATERAL
BORDER OF
TONGUE
0 0 5 (33.3%) 8 (53.3%)
ALVEOLAR
MUCOSA 0 1 (6.6%) 0 0
PALATAL
REGION 0 0 0 2 (13.3%)
COMMISSURE
OF MOUTH 0 0 0 1 (6.6%)
GRAPH 4: DISTRIBUTION OF SITE OF LESION/BIOPSY IN THE STUDY
GROUPS (N= 60)
10
0%
93
.30
%
6.6
0%
66
.60
%
33
.30
%
26
.60
% 5
3.3
0%
13
.30
%
6.6
0%
0%
20%
40%
60%
80%
100%
120%
RETROMOLAR
AREA
BUCCAL MUCOSA LATERAL
BORDER OF
TONGUE
ALVEOLAR
MUCOSA
PALATAL REGION COMMISSURE OF
MOUTH
DIS
TR
IBU
TIO
N O
F S
TU
DY
GR
OU
PS
(%
)
SITE OF LESION/BIOPSY
GROUP I
GROUP II
GROUP III
GROUP IV
GROUP I : NORMAL MUCOSA
GROUP II : MILD DYSPLASIA
GROUP III : MODERATE & SEVERE DYSPLASIA
GROUP IV : OSCC
* p value < 0.05 is significant
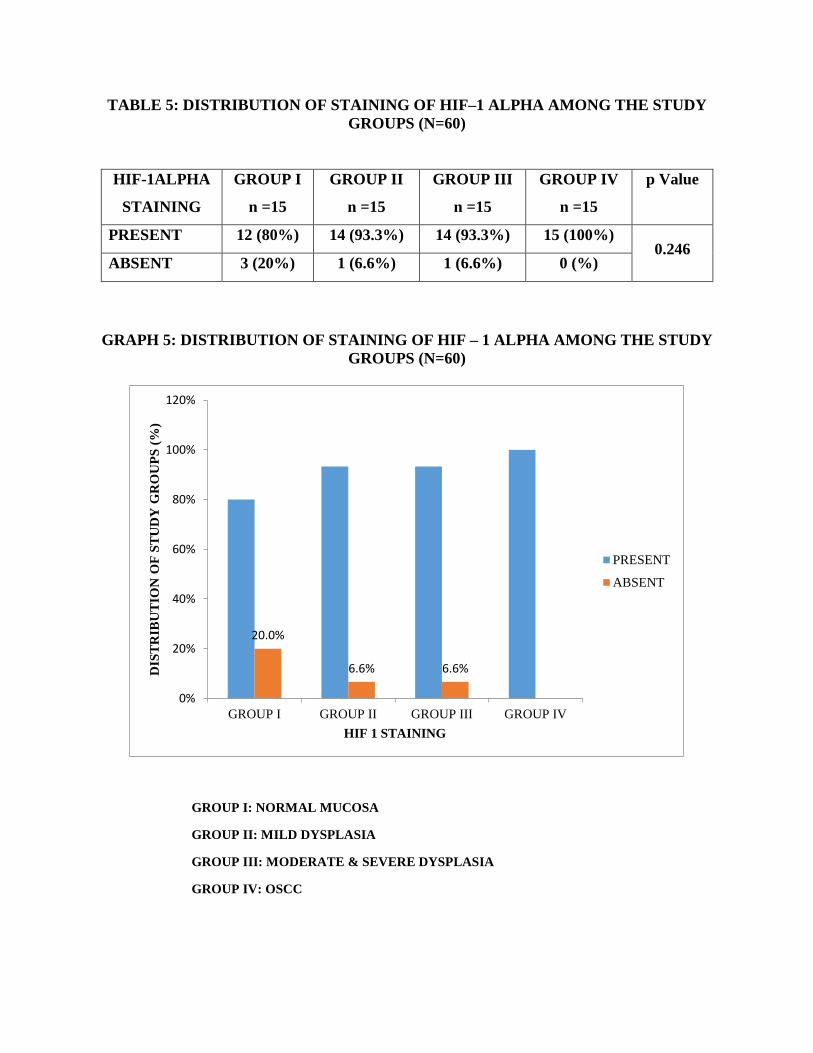
TABLE 5: DISTRIBUTION OF STAINING OF HIF–1 ALPHA AMONG THE STUDY
GROUPS (N=60)
HIF-1ALPHA
STAINING
GROUP I
n =15
GROUP II
n =15
GROUP III
n =15
GROUP IV
n =15
p Value
PRESENT 12 (80%) 14 (93.3%) 14 (93.3%) 15 (100%) 0.246
ABSENT 3 (20%) 1 (6.6%) 1 (6.6%) 0 (%)
GRAPH 5: DISTRIBUTION OF STAINING OF HIF – 1 ALPHA AMONG THE STUDY
GROUPS (N=60)
GROUP I: NORMAL MUCOSA
GROUP II: MILD DYSPLASIA
GROUP III: MODERATE & SEVERE DYSPLASIA
GROUP IV: OSCC
20.0%
6.6% 6.6%
0%
20%
40%
60%
80%
100%
120%
GROUP I GROUP II GROUP III GROUP IV
DIS
TR
IBU
TIO
N O
F S
TU
DY
GR
OU
PS
(%
)
HIF 1 STAINING
PRESENT
ABSENT

TABLE 6: TISSUE LOCALISATION IN HIF-1 ALPHA POSITIVE
STAINED CELLS IN THE STUDY GROUPS
TISSUE
LOCALISATION
GROUP I
n =15
GROUP II
n =15
GROUP III
n =15
GROUP IV
n =15 p Value
BASAL+ SUPRA
BASAL+KERATIN+
CONNECTIVE
TISSUE (B+S+K+C)
3 (20%) 5 (33.3%) 4 (26.6%) 1 (6.6%)
0.027*
SUPRA
BASAL+KERATIN+
CONNECTIVE
TISSUE (S+K+C)
4 (26.6%) 5 (33.3%) 5 (33.3%) 9 (60%)
BASAL +
SUPRABASAL+
CONNECTIVE
TISSUE (B+S+C)
0 (%) 0 (%) 1 (6.6%) 0 (%)
SUPRABASAL+
CONNECTIVE
TISSUE (S+C)
0 (%) 1 (6.6%) 0 (%) 1 (6.6%)
KERATIN+
CONNECTIVE
TISSUE (K+C)
1 (6.6%) 2 (13.3%) 4 (26.6%) 4 (26.6%)
CONNECTIVE
TISSUE (C) 3 (20%) 1 (6.6%) 0 (%) 0 (%)
NEGATIVE 3 (%) 1 (%) 1 (%) 0 (%)
GRAPH 6: TISSUE LOCALISATION IN HIF-1ALPHA POSITIVE STAINED
CELLS IN THE STUDY GROUPS (N=60)
20
.0%
26
.6%
6.6
%
20
.0%
20
.0%
33
.3%
33
.3%
6.6
% 13
.3%
6.6
%
6.6
%
26
.6%
33
.3%
6.6
%
26
.6%
6.6
%
6.6
%
60
.0%
6.6
%
26
.6%
0%
10%
20%
30%
40%
50%
60%
70%
B+S+K+C S+K+C B+S+C S+C K+C C NEGATIVE
DIS
TR
IBU
TIO
N O
F S
TU
DY
GR
OU
PS
(%)
TISSUE LOCALIZATION OF HIF 1 ALPHA
GROUP I
GROUP II
GROUP III
GROUP IV
GROUP I: NORMAL MUCOSA
GROUP II: MILD DYSPLASIA
GROUP III: MODERATE & SEVERE DYSPLASIA
GROUP IV: OSCC
* p value < 0.05 is significant
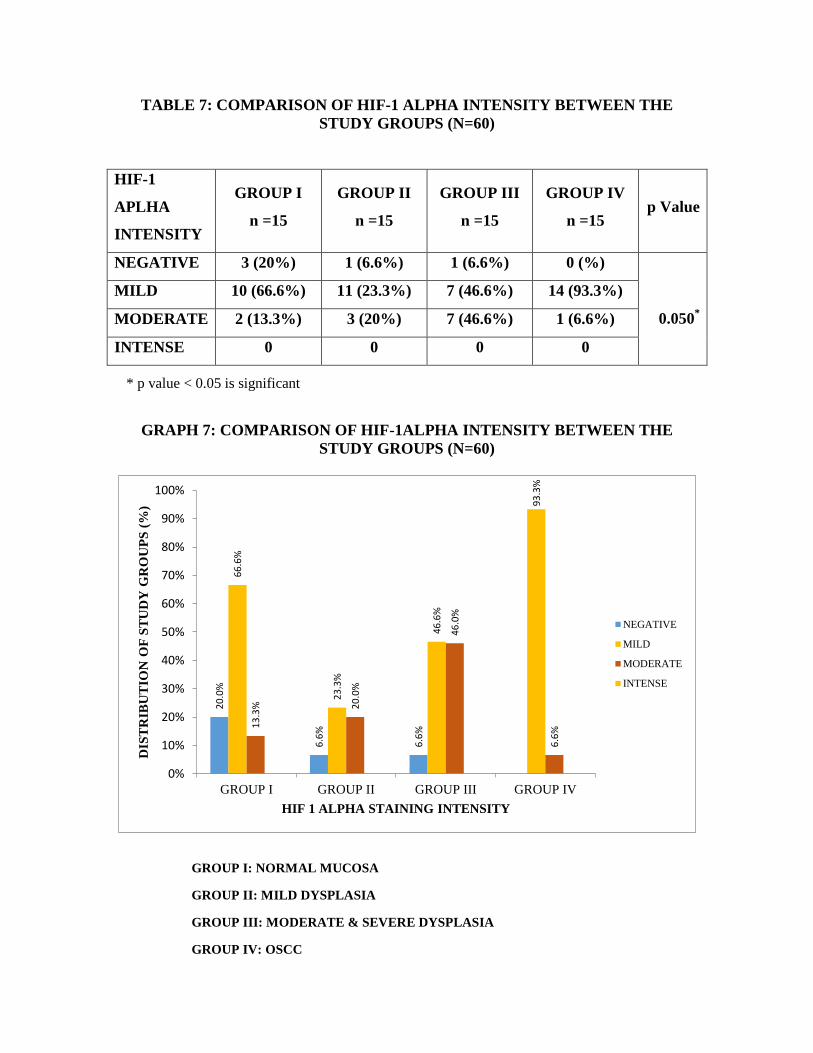
TABLE 7: COMPARISON OF HIF-1 ALPHA INTENSITY BETWEEN THE
STUDY GROUPS (N=60)
HIF-1
APLHA
INTENSITY
GROUP I
n =15
GROUP II
n =15
GROUP III
n =15
GROUP IV
n =15 p Value
NEGATIVE 3 (20%) 1 (6.6%) 1 (6.6%) 0 (%)
0.050*
MILD 10 (66.6%) 11 (23.3%) 7 (46.6%) 14 (93.3%)
MODERATE 2 (13.3%) 3 (20%) 7 (46.6%) 1 (6.6%)
INTENSE 0 0 0 0
GRAPH 7: COMPARISON OF HIF-1ALPHA INTENSITY BETWEEN THE
STUDY GROUPS (N=60)
GROUP I: NORMAL MUCOSA
GROUP II: MILD DYSPLASIA
GROUP III: MODERATE & SEVERE DYSPLASIA
GROUP IV: OSCC
20
.0%
6.6
%
6.6
%
66
.6%
23
.3%
46
.6%
93
.3%
13
.3%
20
.0%
46
.0%
6.6
%
0%
10%
20%
30%
40%
50%
60%
70%
80%
90%
100%
GROUP I GROUP II GROUP III GROUP IV
DIS
TR
IBU
TIO
N O
F S
TU
DY
GR
OU
PS
(%
)
HIF 1 ALPHA STAINING INTENSITY
NEGATIVE
MILD
MODERATE
INTENSE
* p value < 0.05 is significant

TABLE 8: COMPARISON OF BASAL LAYER INTENSITY BETWEEN THE
STUDY GROUPS (N=60)
BASAL
LAYER
INTENSITY
GROUP I
n =15
GROUP II
n =15
GROUP III
n =15
GROUP IV
n =15 p Value
NEGATIVE 12 (80%) 10 (66.6%) 10 (66.6%) 14 (93.3%)
0.141
MILD 3 (20%) 5 (33.3%) 3 (33.3%) 1 (6.6%)
MODERATE 0 0 2 (13.3%) 0
INTENSE 0 0 0 0
GRAPH 8: COMPARISON OF BASAL LAYER INTENSITY BETWEEN THE
STUDY GROUPS (N=60)
GROUP I: NORMAL MUCOSA
GROUP II: MILD DYSPLASIA
GROUP III: MODERATE & SEVERE DYSPLASIA
GROUP IV: OSCC
80
.0%
66
.6%
66
.6%
93
.3%
20
.0%
33
.3%
20
.0%
6.6
% 13
.3%
0%
10%
20%
30%
40%
50%
60%
70%
80%
90%
100%
GROUP I GROUP II GROUP III GROUP IV
DIS
TR
IBU
TIO
N O
F S
TU
DY
GR
OU
PS
(%
)
STAINING INTENSITY IN BASAL LAYER
NEGATIVE
MILD
MODERATE
INTENSE
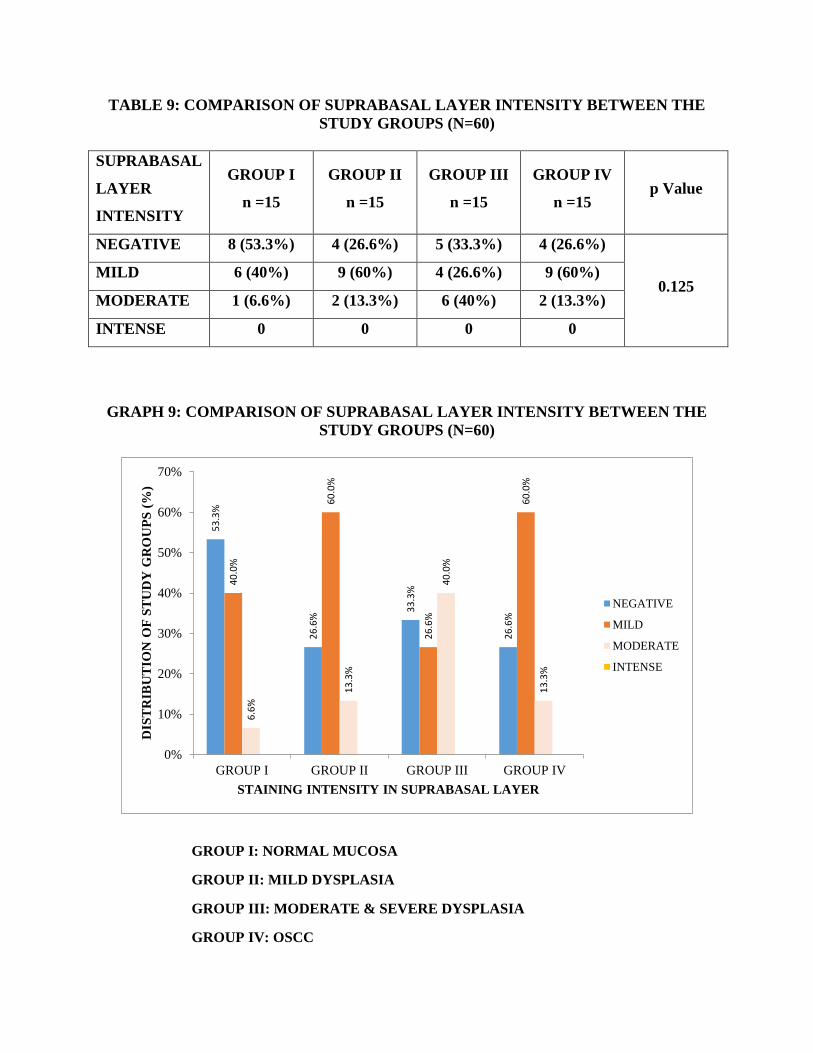
TABLE 9: COMPARISON OF SUPRABASAL LAYER INTENSITY BETWEEN THE
STUDY GROUPS (N=60)
SUPRABASAL
LAYER
INTENSITY
GROUP I
n =15
GROUP II
n =15
GROUP III
n =15
GROUP IV
n =15 p Value
NEGATIVE 8 (53.3%) 4 (26.6%) 5 (33.3%) 4 (26.6%)
0.125 MILD 6 (40%) 9 (60%) 4 (26.6%) 9 (60%)
MODERATE 1 (6.6%) 2 (13.3%) 6 (40%) 2 (13.3%)
INTENSE 0 0 0 0
GRAPH 9: COMPARISON OF SUPRABASAL LAYER INTENSITY BETWEEN THE
STUDY GROUPS (N=60)
GROUP I: NORMAL MUCOSA
GROUP II: MILD DYSPLASIA
GROUP III: MODERATE & SEVERE DYSPLASIA
GROUP IV: OSCC
53
.3%
26
.6%
33
.3%
26
.6%
40
.0%
60
.0%
26
.6%
60
.0%
6.6
%
13
.3%
40
.0%
13
.3%
0%
10%
20%
30%
40%
50%
60%
70%
GROUP I GROUP II GROUP III GROUP IV
DIS
TR
IBU
TIO
N O
F S
TU
DY
GR
OU
PS
(%
)
STAINING INTENSITY IN SUPRABASAL LAYER
NEGATIVE
MILD
MODERATE
INTENSE
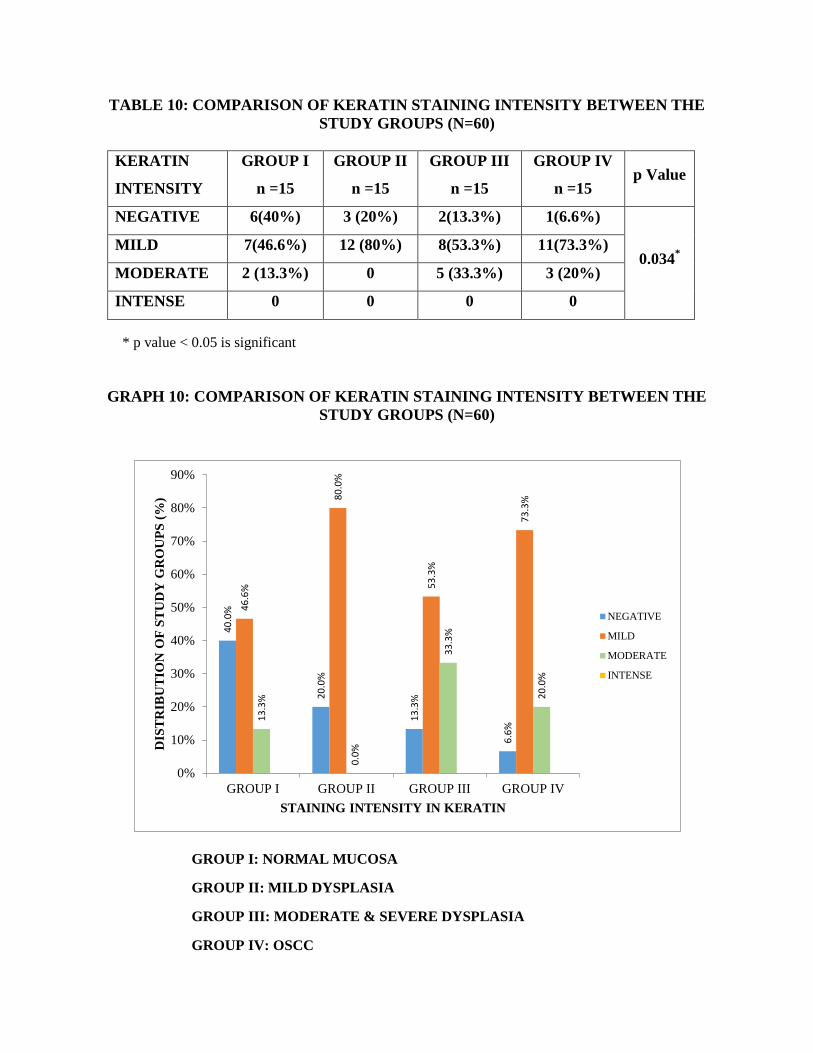
TABLE 10: COMPARISON OF KERATIN STAINING INTENSITY BETWEEN THE
STUDY GROUPS (N=60)
KERATIN
INTENSITY
GROUP I
n =15
GROUP II
n =15
GROUP III
n =15
GROUP IV
n =15 p Value
NEGATIVE 6(40%) 3 (20%) 2(13.3%) 1(6.6%)
0.034*
MILD 7(46.6%) 12 (80%) 8(53.3%) 11(73.3%)
MODERATE 2 (13.3%) 0 5 (33.3%) 3 (20%)
INTENSE 0 0 0 0
GRAPH 10: COMPARISON OF KERATIN STAINING INTENSITY BETWEEN THE
STUDY GROUPS (N=60)
GROUP I: NORMAL MUCOSA
GROUP II: MILD DYSPLASIA
GROUP III: MODERATE & SEVERE DYSPLASIA
GROUP IV: OSCC
40
.0%
20
.0%
13
.3%
6.6
%
46
.6%
80
.0%
53
.3%
73
.3%
13
.3%
0.0
%
33
.3%
20
.0%
0%
10%
20%
30%
40%
50%
60%
70%
80%
90%
GROUP I GROUP II GROUP III GROUP IV
DIS
TR
IBU
TIO
N O
F S
TU
DY
GR
OU
PS
(%
)
STAINING INTENSITY IN KERATIN
NEGATIVE
MILD
MODERATE
INTENSE
* p value < 0.05 is significant

TABLE 11: COMPARISON OF CONNECTIVE TISSUE INTENSITY BETWEEN THE
STUDY GROUPS (N=60)
CONNECTIVE
TISSUE
INTENSITY
GROUP I
n =15
GROUP II
n =15
GROUP III
n =15
GROUP IV
n =15 p Value
NEGATIVE 4 (26.6%) 3 (20%) 1 (6.6%) 0
0.034*
MILD 9 (60%) 12 (80%) 9 (60%) 14 (93.3%)
MODERATE 2 (13.3%) 0 5 (33.3%) 1 (6.6%)
INTENSE 0 0 0 0
GRAPH 11: COMPARISON OF CONNECTIVE TISSUE INTENSITY BETWEEN THE
STUDY GROUPS (N=60)
GROUP I: NORMAL MUCOSA
GROUP II: MILD DYSPLASIA
GROUP III: MODERATE & SEVERE DYSPLASIA
GROUP IV: OSCC
26
.6%
20
.0%
6.6
%
60
%
80
%
60
%
93
.30
%
13
.3%
33
.3%
6.6
%
0%
10%
20%
30%
40%
50%
60%
70%
80%
90%
100%
GROUP I GROUP II GROUP III GROUP IV
DIS
TR
IBU
TIO
N O
F S
TU
DY
GR
OU
PS
(%
)
STAINING INTENSITY IN CONNECTIVE TISSUE
NEGATIVE
MILD
MODERATE
INTENSE
* p value < 0.05 is significant

TABLE 12: COMPARISON OF INTENSITY OF HIF-1 ALPHA BETWEEN GRADES
OF EPITHELIAL DYSPLASIA (GROUP II & III) N=30
GRADES OF
EPITHELIAL
DYSPLASIA
NEGATIVE MILD MODERATE INTENSE p Value
MILD
EPITHELIAL
DYSPLASIA
1 (6.6%) 11 (73.3%) 3 (20%) 0
0.000*
MODERATE
EPITHELIAL
DYSPLASIA
1 (11.1 %) 4 (44.4 %) 4 (44.4%) 0
SEVERE
EPITHELIAL
DYSPLASIA
0 3 (50%) 3 (50%) 0
GRAPH 12: COMPARISON OF INTENSITY OF HIF-1 ALPHA BETWEEN GRADES
OF EPITHELIAL DYSPLASIA (GROUP II & III) N=30
GROUP I: NORMAL MUCOSA
GROUP II: MILD DYSPLASIA
GROUP III: MODERATE & SEVERE DYSPLASIA
GROUP IV: OSCC
6.6
%
73
.3%
20
.0%
11
.1%
44
.4%
44
.4%
50
.0%
50
.0%
0%
10%
20%
30%
40%
50%
60%
70%
80%
NOT EXPRESSED MILD MODERATE INTENSE
DIS
TR
IBU
TIO
N O
F S
TU
DY
GR
OU
PS
(%
)
STAINING INTENSITY IN GRADES OF DYSPLASIA
MILD DYSPLASIA
MODERATE DYSPLASIA
SEVERE DYSPLASIA
* p value < 0.05 is significant
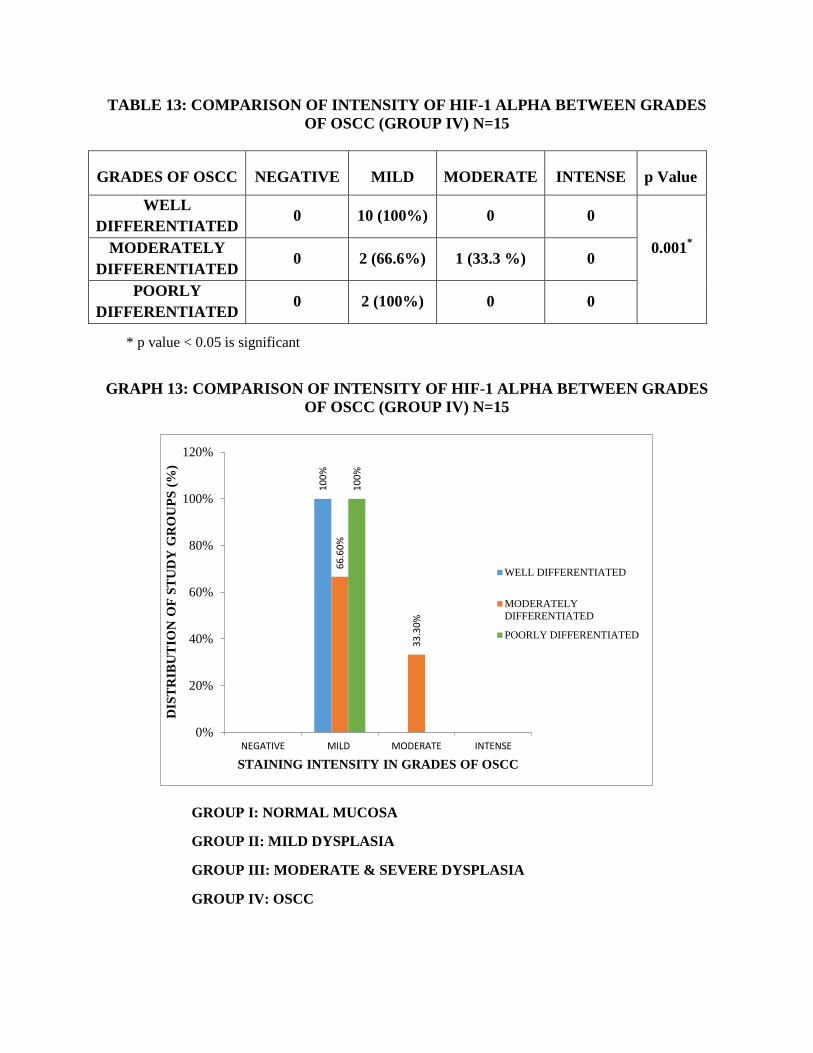
TABLE 13: COMPARISON OF INTENSITY OF HIF-1 ALPHA BETWEEN GRADES
OF OSCC (GROUP IV) N=15
GRADES OF OSCC NEGATIVE MILD MODERATE INTENSE p Value
WELL
DIFFERENTIATED 0 10 (100%) 0 0
0.001*
MODERATELY
DIFFERENTIATED 0 2 (66.6%) 1 (33.3 %) 0
POORLY
DIFFERENTIATED 0 2 (100%) 0 0
GRAPH 13: COMPARISON OF INTENSITY OF HIF-1 ALPHA BETWEEN GRADES
OF OSCC (GROUP IV) N=15
GROUP I: NORMAL MUCOSA
GROUP II: MILD DYSPLASIA
GROUP III: MODERATE & SEVERE DYSPLASIA
GROUP IV: OSCC
10
0%
66
.60
%
33
.30
%
10
0%
0%
20%
40%
60%
80%
100%
120%
NEGATIVE MILD MODERATE INTENSE
DIS
TR
IBU
TIO
N O
F S
TU
DY
GR
OU
PS
(%
)
STAINING INTENSITY IN GRADES OF OSCC
WELL DIFFERENTIATED
MODERATELY
DIFFERENTIATED
POORLY DIFFERENTIATED
* p value < 0.05 is significant

TABLE 14: COMPARISON OF INTENSITY BETWEEN GROUP I AND GROUP II
GROUPS NEGATIVE MILD MODERATE INTENSE p Value
GROUP I
(n=15) 3 (20%) 10 (66.6%) 2 (13.3%) 0
0.536 GROUP
II (n=15) 1 (6.6%) 11 (73.3%) 3 (20%) 0
GRAPH 14: COMPARISON OF INTENSITY BETWEEN GROUP I AND GROUP II
GROUP I: NORMAL MUCOSA
GROUP II: MILD DYSPLASIA
20
.0%
66
.6%
13
.3%
6.6
%
73
.3%
20
.0%
0%
10%
20%
30%
40%
50%
60%
70%
80%
NEGATIVE MILD MODERATE INTENSE
DIS
TR
IBU
TIO
N
BE
TW
EE
N S
TU
DY
GR
OU
PS
(%
)
STAINING INTENSITY OF HIF 1 ALPHA
GROUP I
GROUP II
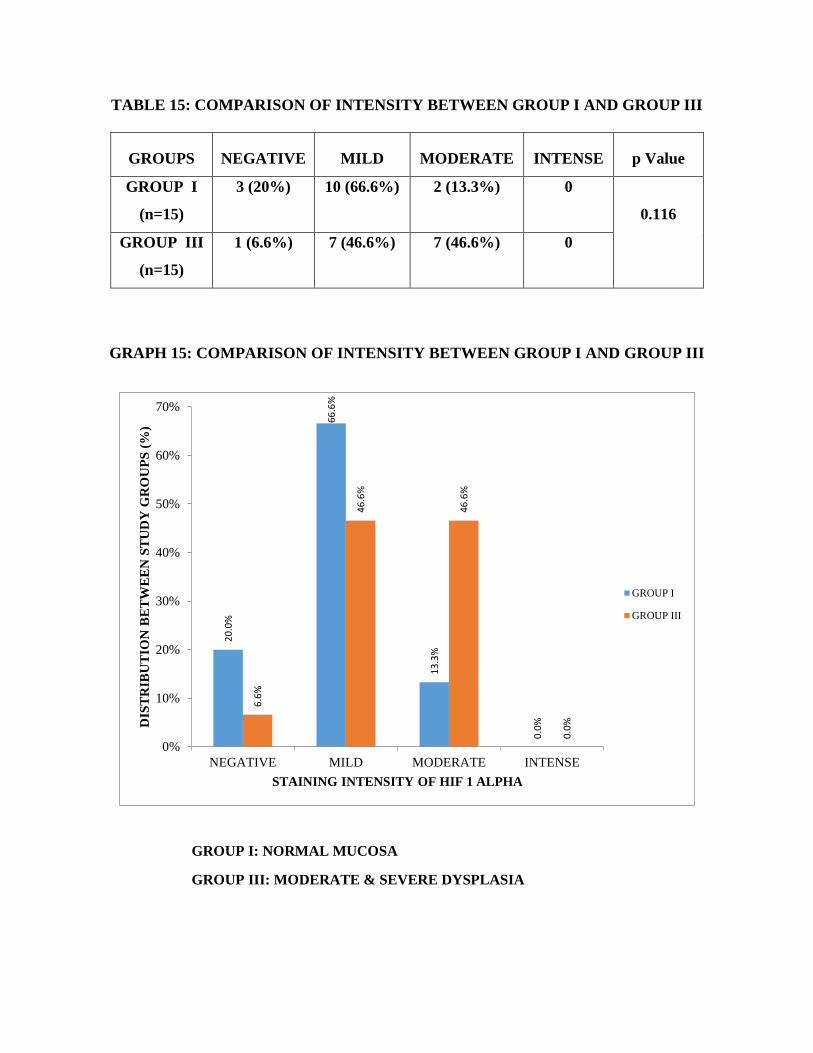
TABLE 15: COMPARISON OF INTENSITY BETWEEN GROUP I AND GROUP III
GROUPS NEGATIVE MILD MODERATE INTENSE p Value
GROUP I
(n=15)
3 (20%) 10 (66.6%) 2 (13.3%) 0
0.116
GROUP III
(n=15)
1 (6.6%) 7 (46.6%) 7 (46.6%) 0
GRAPH 15: COMPARISON OF INTENSITY BETWEEN GROUP I AND GROUP III
GROUP I: NORMAL MUCOSA
GROUP III: MODERATE & SEVERE DYSPLASIA
20
.0%
66
.6%
13
.3%
0.0
%
6.6
%
46
.6%
46
.6%
0.0
%
0%
10%
20%
30%
40%
50%
60%
70%
NEGATIVE MILD MODERATE INTENSE
DIS
TR
IBU
TIO
N B
ET
WE
EN
ST
UD
Y G
RO
UP
S (
%)
STAINING INTENSITY OF HIF 1 ALPHA
GROUP I
GROUP III

TABLE 16: COMPARISON OF INTENSITY BETWEEN GROUP I AND GROUP IV
GROUPS NEGATIVE MILD MODERATE INTENSE p Value
GROUP I
(n=15) 3 (20%) 10 (66.6%) 2 (13.3%) 0
0.135 GROUP IV
(n=15) 0 14 (93.3%) 1 (6.6%) 0
GRAPH 16: COMPARISON OF INTENSITY BETWEEN GROUP I AND GROUP IV
GROUP I: NORMAL MUCOSA
GROUP IV: OSCC
20
.0%
66
.6%
13
.3%
93
.3%
6.6
%
0%
10%
20%
30%
40%
50%
60%
70%
80%
90%
100%
NEGATIVE MILD MODERATE INTENSE
DIS
TR
IBU
TIO
N B
ET
WE
EN
ST
UD
Y G
RO
UP
S (
%)
STAINING INTENSITY OF HIF 1 ALPHA
GROUP I
GROUP IV

TABLE 17: COMPARISON OF INTENSITY BETWEEN GROUP II AND GROUP IV
GROUPS NEGATIVE MILD MODERATE INTENSE p Value
GROUP II
(n=15) 1 (6.6%) 11 (73.3%) 3 (20%) 0
0.30 GROUP
IV (n=15) 0 14 (93.3%) 1 (6.6%) 0
GRAPH 17: COMPARISON OF INTENSITY BETWEEN GROUP II AND GROUP IV
GROUP II: MILD DYSPLASIA
GROUP IV: OSCC
6.6
%
73
.3%
20
.0%
93
.3%
6.6
%
0%
10%
20%
30%
40%
50%
60%
70%
80%
90%
100%
NEGATIVE MILD MODERATE INTENSE
DIS
TR
IBU
TIO
N B
ET
WE
EN
ST
UD
Y G
RO
UP
S
STAINING INTENSITY OF HIF 1 ALPHA
GROUP II
GROUP IV
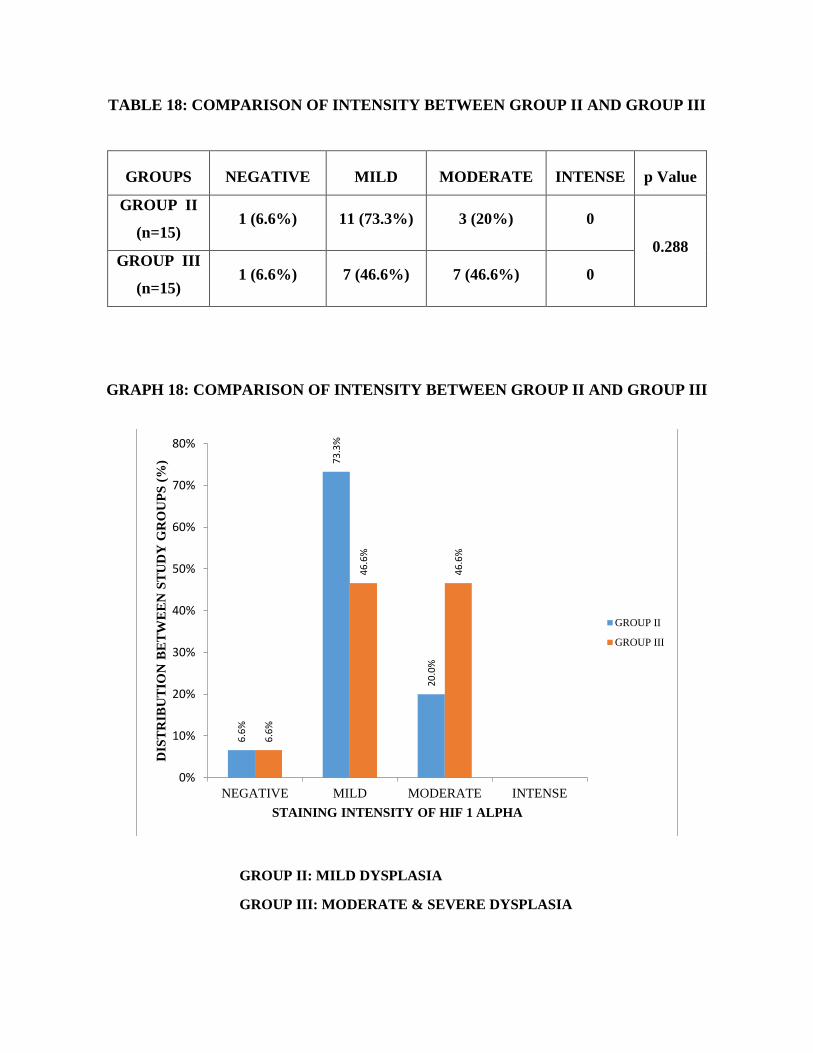
TABLE 18: COMPARISON OF INTENSITY BETWEEN GROUP II AND GROUP III
GROUPS NEGATIVE MILD MODERATE INTENSE p Value
GROUP II
(n=15) 1 (6.6%) 11 (73.3%) 3 (20%) 0
0.288
GROUP III
(n=15) 1 (6.6%) 7 (46.6%) 7 (46.6%) 0
GRAPH 18: COMPARISON OF INTENSITY BETWEEN GROUP II AND GROUP III
GROUP II: MILD DYSPLASIA
GROUP III: MODERATE & SEVERE DYSPLASIA
6.6
%
73
.3%
20
.0%
6.6
%
46
.6%
46
.6%
0%
10%
20%
30%
40%
50%
60%
70%
80%
NEGATIVE MILD MODERATE INTENSE
DIS
TR
IBU
TIO
N B
ET
WE
EN
ST
UD
Y G
RO
UP
S (
%)
STAINING INTENSITY OF HIF 1 ALPHA
GROUP II
GROUP III

TABLE 19: COMPARISON OF INTENSITY BETWEEN GROUP III AND GROUP IV
GROUPS NEGATIVE MILD MODERATE INTENSE p Value
GROUP III
(n=15) 1 (6.6%) 7 (46.6%) 7 (46.6%) 0
0.020*
GROUP
IV(n=15) 0 14 (93.3%) 1 (6.6%) 0
GRAPH 19: COMPARISON OF INTENSITY BETWEEN GROUP III AND GROUP IV
GROUP III: MODERATE & SEVERE DYSPLASIA
GROUP IV: OSCC
6.6
%
46
.6%
46
.6%
93
.3%
6.6
%
0%
10%
20%
30%
40%
50%
60%
70%
80%
90%
100%
NEGATIVE MILD MODERATE INTENSE
DIS
TR
IBU
TIO
N B
ET
WE
EN
ST
UD
Y G
RO
UP
S (
%)
STAINING INTENSITY OF HIF 1 ALPHA
GROUP III
GROUP IV
* p value < 0.05 is significant

ANTIBODY KIT
PRIMARY ANTIBODY SECONDARY ANTIBODY
(HIF-1 ALPHA)
ARMAMENTARIUM

POSITIVE CONTROL – NORMAL KIDNEY (HUMAN)
10 X
40 X
CYTOPLASMIC EXPRESSION OF HIF-1 ALPHA

ORAL SQUAMOUS CELL CARCINOMA
10 X 40 X
10 X 40 X
CYTOPLASMIC EXPRESSION OF HIF-1 ALPHA

SEVERE EPITHELIAL DYSPLASIA
10 X 40 X
10 X 40 X
CYTOPLASMIC EXPRESSION OF HIF-1 ALPHA
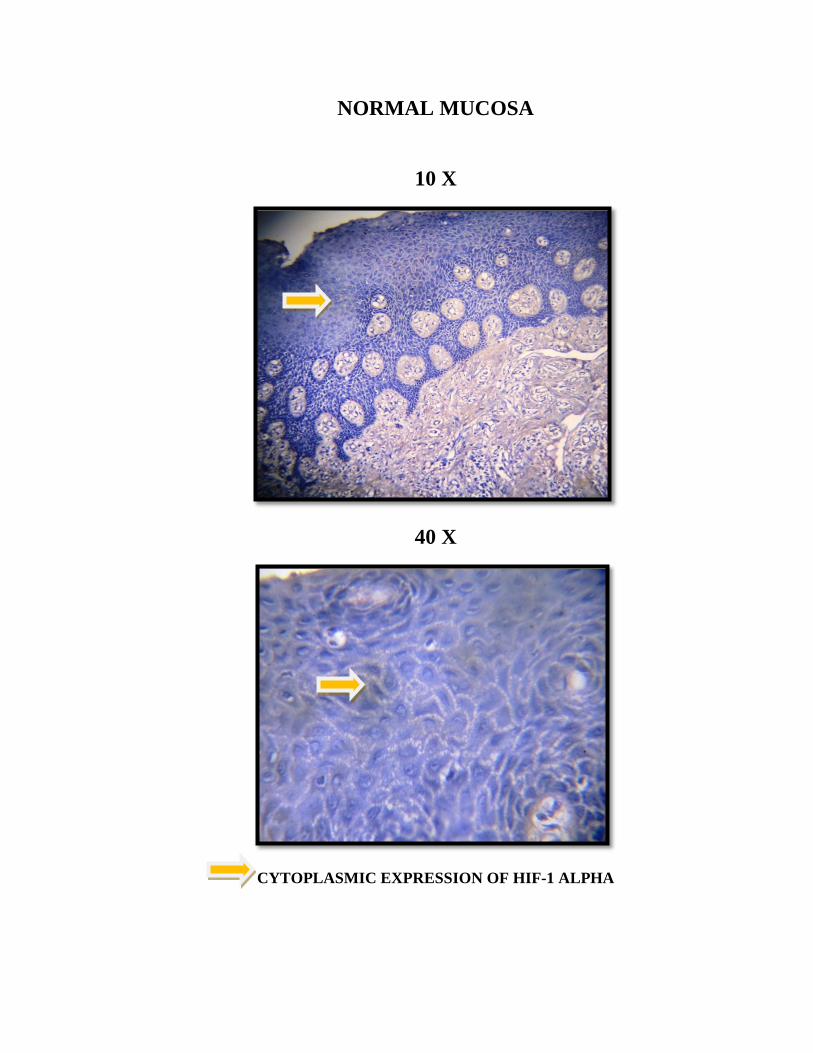
NORMAL MUCOSA
10 X
40 X
CYTOPLASMIC EXPRESSION OF HIF-1 ALPHA

MILD EPITHELIAL DYSPLASIA
4 X
10 X
40 X
CYTOPLASMIC EXPRESSION OF HIF-1 ALPHA

MODERATE EPITHELIAL DYSPLASIA
10 X
40 X
CYTOPLASMIC EXPRESSION OF HIF-1 ALPHA

Discussion

Discussion
55
Oral squamous cell carcinoma (OSCC) is the sixth most common
cancer worldwide with 300,000 new cases being diagnosed every year41
.
OSCC occurs as a result of multiple molecular events which develop from
combined effects of individual genetic predisposition and exposure to
environmental carcinogens42
.
The presence of hypoxic microenvironment which is caused by the
imbalance between oxygen demand and oxygen delivery in solid tumors is a
negative prognostic factor in head and neck squamous cell carcinoma
(HNSCC).The rapidly proliferating HNSCC has insufficient vascularization
which limits the oxygen diffusion, resulting in the development of localized
hypoxia. This leads to unregulated expression of hypoxia-inducible factor and
vascular endothelial growth factor, which promotes irregular vascular
endothelial cell proliferation and differentiation and growth of new blood
capillaries, leading to the development of neovascularization43
.
The threshold oxygen tension in solid tumor is (expressed as partial
pressure of oxygen) 10mmHg. HNSCC is characterized by low oxygen
tension44,45
. Acute hypoxic stress leads to the development of aggressive
cancer phenotype with high rate of metastasis, resistance to therapeutic agents
and high tumor recurrence rates. Prolonged deprivation of oxygen leads to
chronic hypoxic stress which results in tumor necrosis. These features
observed in HNSCC are regarded as a major contributing factor leading to
poor treatment outcome46, 47
.

Discussion
56
HIF-1 alpha targets the transcription of over 60 genes involved in
many aspects of cancer biology including cell survival, glucose metabolism,
cell invasion and angiogenesis. Among these genes, vascular endothelial
growth factor (VEGF) is essential as a regulatory gene of angiogenesis in the
adaptation to a hypoxic microenvironment which in turn has a critical role in
tumour development and progression in different types of malignances48
.
Given the fact that HIF-1 alpha has a vital role in the progression of
carcinogenesis, this study was done on oral epithelial dysplasia and OSCC
using immunohistochemistry to study the expression of HIF-1 alpha and was
compared with that of the normal mucosa.
Archival blocks were taken from the department for the study purpose.
The study population includes 60 cases. They were categorized into four
groups. Group I (n=15) comprised of clinically normal mucosa samples which
was obtained from retromolar region from the patients who came for the
removal of impacted teeth. Group II (n= 15) comprised of mild epithelial
dysplasia samples. Moderate and severe epithelial dysplasias have a high risk
for malignant transformation and so we have considered them as a single
group. Hence, Group III (n=15) comprised of both moderate and severe
epithelial dysplasia samples. Group IV (n=15) comprised of oral squamous
cell carcinoma samples.
In our study 60% of the cases in group II (mild epithelial dysplasia),
46% of cases in group III (moderate and severe dysplasia) and 53% of cases in

Discussion
57
group IV (oral squamous cell carcinoma) were in the age group between 20-40
years. The distribution of age of patients with oral epithelial dysplasia and oral
squamous cell carcinoma was statistically significant. The pattern of age
distribution for OSCC was also consistent with those of Massarelli. E et al in
whose study 89% of OSCC cases were seen above 40 years49
. Our observation
from the above data suggests that the occurrence of OSCC was predominantly
seen in the age group of above 40 years i.e.,53% in the group of 40 – 60 years
and 33% cases was in the age group of above 60 years. This was also
consistent with the study of Pires FR et al who stated that 46% of the patients
in their study were between 41 – 60 years and 41% of affected age group was
between 61 – 80 years50
. Youssef HE et al also found that mean age of 54
years old is common for the occurrence of OSCC51
. This could be probably
due to the fact that mutations are more common to occur in older people, who
could inturn activate oncogenes that encourage the expression of many
transcriptional factors such as HIF-1alpha and their activation52
.
In all the three groups (mild, moderate and severe epithelial dysplasia
and OSCC), males were more predominantly affected than females. The
overall male and female ratio was 7:2. This pattern of gender distribution was
statistically significant (p=0.024) and was consistent with the study of Lee CH
et al in whose study 94% of subjects with epithelial dysplasia were males53
.
ChenYJ et al in their study of 703 OSCC cases, reported that 93% of their
study population were males. The authors thus suggested that the prevalence

Discussion
58
of OSCC was common in males when compared to females41
. Waris S and
Nagi AH stated that male preponderance could be due to the fact that the habit
of pan chewing is more common in males. The habit is less prevalent in
females and this finding could be attributed to prevalent religious and
socio-cultural reasons where females avoid coming out and buying pan at pan
shops54
.
The oral epithelial dysplasia and OSCC onset is epidemiologically
related to the presence of habits. The etiology of leukoplakia includes various
smokeless tobacco habits such as snuffing, chewing and smoking55
.In our
study nearly 50% of epithelial dysplasia (group II) patients had the habit of
chewing tobacco and consuming alcohol when compared to the control groups
and this difference was statistically significant (p=0.000). This finding was
consistent with that of Jaber MA et al in whose case-control study sample
included 630 patients with oral epithelial dysplasia and 643 control subjects
selected in United Kingdom. They concluded that, while tobacco and alcohol
synergistically influenced the development of oral epithelial dysplasia,
exclusive tobacco consumption was more likely to give rise to oral epithelial
dysplasia than exclusive alcohol consumption56
.
About 26% of group II patients and 33% of group III and group IV
patients had the habit of chewing alone presented with moderate to severe
dysplasia and oral squamous cell carcinoma. This finding was consistent with
the study by Paymaster JC et al who proposed that an increased frequency of

Discussion
59
cancer in the oral cavity was often associated with the habit of the chewing of
tobacco with betel leaf, betel nut, and slaked lime than with other habits57
.
Squier CA et al suggested that the relative risk of developing oral cancer is
2.82 for smokers and 5.98 for chewers58
. Thus chewers are at a higher risk of
developing cancer which is proved in our study also.
In our study 53.3% of moderate to severe dysplasia and 60% of OSCC
cases did not have any habits and this finding was concurrent with the report
of Shan Ho Pet al, who in their prospective study of 148 cases with OSCC,
found that 40% did not have any habits59
.There was another study by Schmidt
BL et al, who in their study of 67 cases of OSCC reported that 33% of the
cases did not have the habit of smoking60
.
In our study, buccal mucosa was the common site of biopsy in
93% and 67% cases of mild and moderate to severe epithelial dysplasia and in
27% cases of OSCC. This finding was similar to that of Shan Ho Pet al who
stated that in their cohort of 148 cases, buccal mucosa was the common site of
occurrence for epithelial dysplasia and OSCC59
. Premalignant disorders are
usually found on the buccal mucosa, followed by gingiva, tongue and floor of
the mouth61,62
.
In OSCC 53% cases were from the lateral border of tongue followed
by 27% cases in the buccal mucosa. This was consistent with the study of
Pires FR et al who reported that the most common site of OSCC was the

Discussion
60
lateral border of the tongue (37%), followed by the alveolar mucosa and
gingiva (20%) and floor of the mouth and ventral tongue (19%)50
. In an
another study by Youssef HE et al, the tongue was the most commonly
affected site followed by buccal mucosa51
. This finding was also consistent
with Chen YJ et al in whose study nearly 35% of OSCC occurred on the
lateral border of tongue41
.
TISSUE LOCALIZATION OF HIF-1 ALPHASTAINING
In this study 80% of normal mucosa, 93% of mild, moderate and
severe epithelial dysplasia and all cases of OSCC expressed HIF-1 alpha
staining.
HIF-1 alpha expression in suprabasal layer, keratin and connective
tissue was seen to increase from normal mucosa to mild to moderate to severe
dysplasia to carcinoma which was statistically significant (p=0.027). This
pattern of distribution of HIF-1 alpha is due to the microenvironment that
affects the malignant progression by contributing to altered gene expression61
.
In our study, the expression of HIF-1 alpha is seen in about 80% of cases of
normal mucosa. This suggests that the HIF-1 alpha plays a role in maintaining
homeostasis at a cellular, local, and systemic level. It has been suggested that
HIF-1 alpha may be present in normal tissue for a basal induction of genes that
are necessary to provide the cellular energy requirements. In our study the
proportion of cases which expressed HIF-1 alpha increased in case of oral
epithelial dysplasias (93%) when compared to the normal mucosa and was

Discussion
61
found to be the highest in oral squamous cell carcinoma (100%) and this
finding could probably be due to the increase in hypoxic stress with
progression to malignancy63
.
STAINING PATTERN OF HIF 1 ALPHA
We observed the expression of HIF-1 alpha only in the cytoplasm in all
the cases. Nuclear expression was not seen. This observation was consistent
with that of Stroka DM who stated that, there is an increase in both nuclear
and cytoplasmic HIF-1alpha levels in hypoxic tissues. The strong cytoplasmic
presence of HIF-1alpha could be the result of enhanced protein stabilization
and accumulation before to nuclear translocation64
. Likewise, cytoplasmic
staining of HIF-1alpha was detected in various adenocarcinomas65
, hypoxic
differentiated U937 cells66
, and normoxic rat hepatocytes67
. This was also
consistent with the study by Youssef HE et al who demonstrated that
cytoplasmic HIF-1alpha was predominant than nuclear staining or the only
pattern of expression in 63% cases of well-differentiated OSCC in their
study51
.
In our study, there was increasing expression of HIF-1 alpha with the
increasing grades of epithelial dysplasia and in increasing grades of OSCC.
When those cases which showed moderate staining intensity were compared,
we observed that in mild epithelial dysplasia there were 20% of cases which
increased to 44.4% in moderate dysplasia and further increased to 50% of
cases in severe dysplasia. Similarly when comparing moderately and poorly

Discussion
62
differentiated carcinoma, HIF-1 alpha expression increased from 66.6% to
100% of the cases where the staining intensity was mild. This was similar to
the study by Kopfstein L et al 68
and Roh JL et al 69
who studied that
HIF-1alpha immunostaining and stated that it significantly increased with
advanced clinical stages of OSCC(p=0.002). In their study, 11 out of 20 cases
with stage III and IV of OSCC showed strong HIF-1alpha positivity, while
only one case out of 25 with stage I and II showed marked upregulation of
HIF-1 alpha expression. Costa AD et al in their retrospective study with 38
cases of OSCC found out that there is a significant correlation between TNM
clinical staging and histopathologic parameters70
. Thus the pattern of
expression between grades of dysplasia and OSCC in our study was
concurrent with that of Kopfstein L et al, Roh JL et al and Costa AD et al.
The presence of staining in the keratin and connective tissue in our
study is supported by the study of Kopfstein L et al and Roh JL et al who
proposed that HIF-1 alpha immunoreactivity can be presented in the peripheral
malignant cell layers, in the keratin and epithelial pearls. They also suggested
that HIF-1alpha expression was more pronounced around areas of necrosis and
keratinization and appeared more intense in areas away from the closest blood
vessels68, 69
. This was consistent with our study where the expression of HIF-1
alpha in keratin of OSCC cases was seen in 93% of the cases, whereas in
normal mucosa cases it was observed only in 60% of the cases.
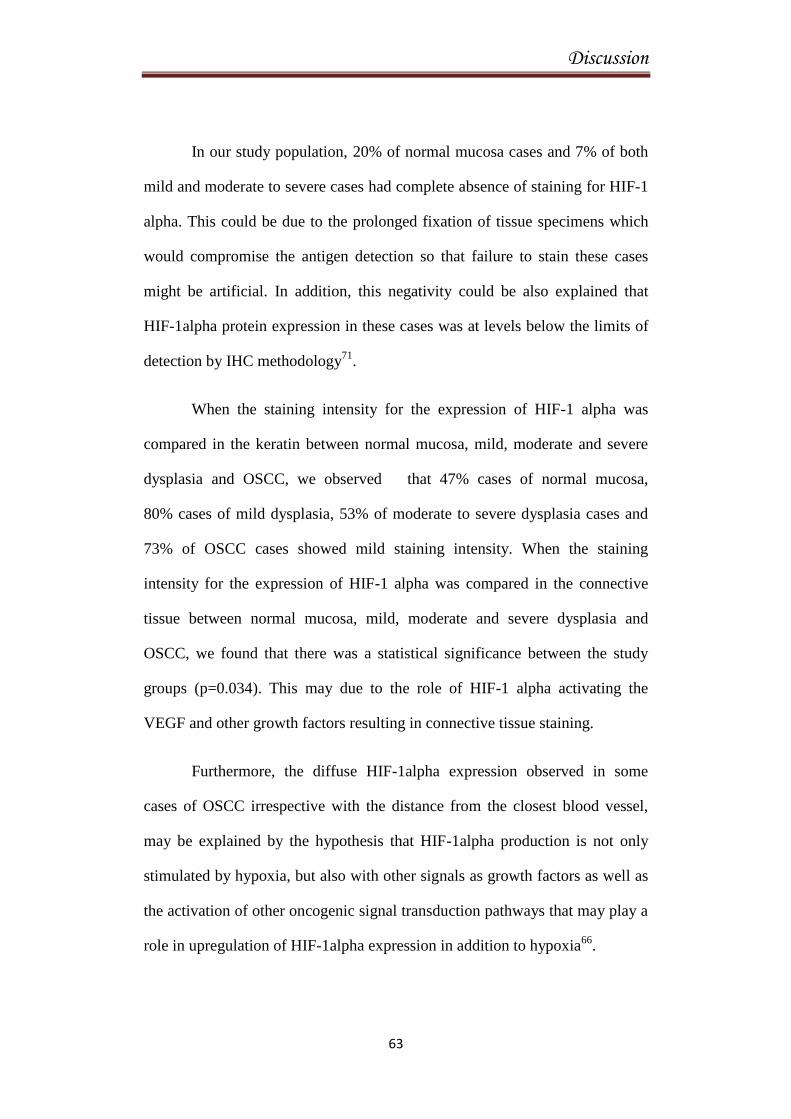
Discussion
63
In our study population, 20% of normal mucosa cases and 7% of both
mild and moderate to severe cases had complete absence of staining for HIF-1
alpha. This could be due to the prolonged fixation of tissue specimens which
would compromise the antigen detection so that failure to stain these cases
might be artificial. In addition, this negativity could be also explained that
HIF-1alpha protein expression in these cases was at levels below the limits of
detection by IHC methodology71
.
When the staining intensity for the expression of HIF-1 alpha was
compared in the keratin between normal mucosa, mild, moderate and severe
dysplasia and OSCC, we observed that 47% cases of normal mucosa,
80% cases of mild dysplasia, 53% of moderate to severe dysplasia cases and
73% of OSCC cases showed mild staining intensity. When the staining
intensity for the expression of HIF-1 alpha was compared in the connective
tissue between normal mucosa, mild, moderate and severe dysplasia and
OSCC, we found that there was a statistical significance between the study
groups (p=0.034). This may due to the role of HIF-1 alpha activating the
VEGF and other growth factors resulting in connective tissue staining.
Furthermore, the diffuse HIF-1alpha expression observed in some
cases of OSCC irrespective with the distance from the closest blood vessel,
may be explained by the hypothesis that HIF-1alpha production is not only
stimulated by hypoxia, but also with other signals as growth factors as well as
the activation of other oncogenic signal transduction pathways that may play a
role in upregulation of HIF-1alpha expression in addition to hypoxia66
.

Summary and Conclusion

Summary and Conclusion
64
A total of 60 biopsies were included in this study, comprising of
15 cases of normal oral mucosa (group I), 15 cases of mild epithelial
dysplasia (group II), 15 cases of moderate and severe epithelial
dysplasia (group III) and 15 cases of oral squamous cell carcinoma
(group IV).
In group II, group III and in group IV, 60%, 46.6% and 53.3% of were
in the age group of 41- 60 years respectively. This age distribution was
statistically significant (p=0.000)
In group I, all the cases were taken from from retromolar region from
the patient who has come for impaction.
In group II, 93.3% of biopsies were taken from the buccal mucosa and
6.6% from alveolar mucosa.
In group III, 66.6% of biopsies were taken from the buccal mucosa and
33.3% from lateral border of the tongue.
In group IV 26.6% biopsies were taken from buccal mucosa, 53.3%
from lateral border of the tongue, 13.3% from palatal region and 6.6%
from commissure of mouth.
Out of 15 cases in group IV, 66.6% were well differentiated OSCC,
20% were moderately differentiated OSCC and 13.3% were poorly
differentiated.
The pattern of HIF-1 alpha staining in all the groups was cytoplasmic.
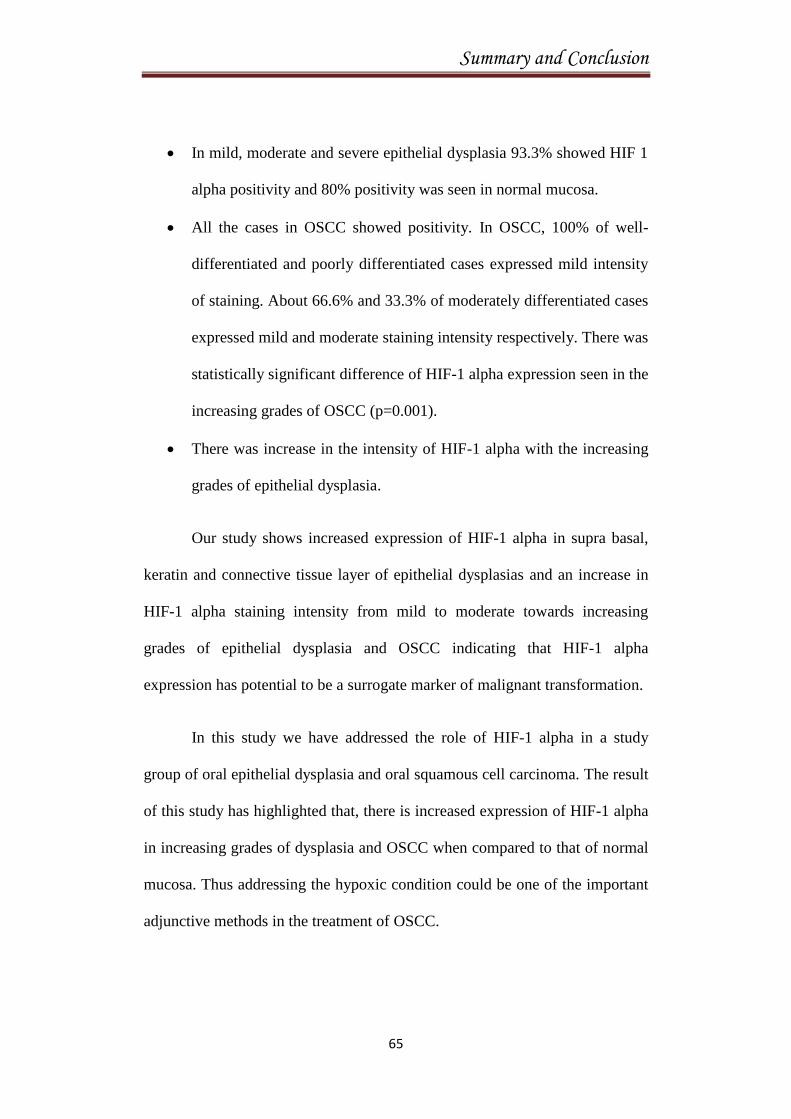
Summary and Conclusion
65
In mild, moderate and severe epithelial dysplasia 93.3% showed HIF 1
alpha positivity and 80% positivity was seen in normal mucosa.
All the cases in OSCC showed positivity. In OSCC, 100% of well-
differentiated and poorly differentiated cases expressed mild intensity
of staining. About 66.6% and 33.3% of moderately differentiated cases
expressed mild and moderate staining intensity respectively. There was
statistically significant difference of HIF-1 alpha expression seen in the
increasing grades of OSCC (p=0.001).
There was increase in the intensity of HIF-1 alpha with the increasing
grades of epithelial dysplasia.
Our study shows increased expression of HIF-1 alpha in supra basal,
keratin and connective tissue layer of epithelial dysplasias and an increase in
HIF-1 alpha staining intensity from mild to moderate towards increasing
grades of epithelial dysplasia and OSCC indicating that HIF-1 alpha
expression has potential to be a surrogate marker of malignant transformation.
In this study we have addressed the role of HIF-1 alpha in a study
group of oral epithelial dysplasia and oral squamous cell carcinoma. The result
of this study has highlighted that, there is increased expression of HIF-1 alpha
in increasing grades of dysplasia and OSCC when compared to that of normal
mucosa. Thus addressing the hypoxic condition could be one of the important
adjunctive methods in the treatment of OSCC.

Bibliography

Bibliography
1. Kulkarni MR.
Head and neck cancer burden in India.
International Journal of Head and Neck Surgery. 2013 Jan; 4(1):29-35.
2. Warnakulasuriya S, Reibel J, Bouquot J, Dabelsteen E.
Oral epithelial dysplasia classification systems: predictive value,
utility, weaknesses and scope for improvement.
Journal of Oral Pathology & Medicine. 2008 Mar 1; 37(3):127-33.
3. Scully C, Sudbo J, Speight PM.
Progress in determining the malignant potential of oral lesions.
Journal of Oral Pathology & Medicine. 2003 May 1; 32(5):251-6.
4. Bouquot JE, Speight PM, Farthing PM.
Epithelial dysplasia of the oral mucosa — Diagnostic problems and
prognostic features.
Current Diagnostic Pathology. 2006 Feb 28;12(1):11-21
5. Tilakaratne WM, Iqbal Z, Teh MT, Ariyawardana A, Pitiyage G,
Cruchley A, Stewart JE, Hagi‐Pavli E, Lalli A, Waseem A,
Parkinson EK.
Upregulation of HIF‐1α in malignant transformation of oral
submucous fibrosis.
Journal of Oral pathology & Medicine. 2008 Jul 1; 37(6):372-7.
6. Rastogi V, Puri N, Mishra S, Arora S, Kaur G, Yadav L.
An insight to oral epithelial dysplasia.
International Journal of Head and Neck Surgery. 2013; 4:74-82.
66

Bibliography
7. Do Carmo MA, Caldeira PC.
Binary System of Grading Epithelial Dysplasia in Oral Leukoplakias.
INTECH Open Access Publisher; 2013.
8. Speight PM.
Update on oral epithelial dysplasia and progression to cancer.
Head and Neck Pathology. 2007 Sep 1;1(1):61-6.
9. Morse DE, Psoter WJ, Cleveland D, Cohen D, Mohit-Tabatabai M,
Kosis DL, Eisenberg E.
Smoking and drinking in relation to oral cancer and oral epithelial
dysplasia.
Cancer Causes & Control. 2007 Nov 1; 18(9):919-29.
10. Shiu MN, Chen TH, Chang SH, Hahn LJ.
Risk factors for leukoplakia and malignant transformation to oral
carcinoma: a leukoplakia cohort in Taiwan.
British Journal of Cancer. 2000 Jun; 82(11):1871.
11. Liu W, Wang YF, Zhou HW, Shi P, Zhou ZT, Tang GY.
Malignant transformation of oral leukoplakia: a retrospective cohort
study of 218 Chinese patients.
BMC cancer. 2010 Dec 16;10(1):685.
12. Van der Waal I.
Potentially malignant disorders of the oral and oropharyngeal mucosa;
terminology, classification and present concepts of management.
Oral oncology. 2009 May 31; 45(4):317-23.
Bibliography
13. Pentenero M, Giaretti W, Navone R, Rostan I, Gassino L,
Broccoletti R, Arduino PG, Malacarne D, Gandolfo S.
Evidence for a possible anatomical subsite–mediated effect of tobacco
in oral potentially malignant disorders and carcinoma.
Journal of Oral Pathology & Medicine. 2011 Mar 1; 40(3):214-7.
14. Nasser W, Flechtenmacher C, Holzinger D, Hofele C, Bosch FX.
Aberrant expression of p53, p16INK4a and Ki‐67 as basic biomarker
for malignant progression of oral leukoplakias.
Journal of Oral Pathology & Medicine. 2011 Sep 1; 40(8):629-35.
15. Teh MT, Tilakaratne WM, Chaplin T, Young BD, Ariyawardana
A, Pitiyage G, Lalli A, Stewart JE, Hagi‐Pavli E, Cruchley A,
Waseem A.
Fingerprinting genomic instability in oral submucous fibrosis.
Journal of Oral Pathology & Medicine. 2008 Aug 1; 37(7):430-6.
16. Moutasim KA, Jenei V, Sapienza K, Marsh D, Weinreb PH,
Violette SM, Lewis MP, Marshall JF, Fortune F, Tilakaratne WM,
Hart IR.
Betel‐derived alkaloid up‐regulates keratinocyte alphavbeta6 integrin
expression and promotes oral submucous fibrosis.
The Journal of Pathology. 2011 Feb 1; 223(3):366-77.
17. Holland-Frei Cancer Medicine.
Multistage Carcinogenesis
6th edition ; Pg. no: 347-49.
Bibliography
18. Mehrotra R, Yadav S.
Oral squamous cell carcinoma: etiology, pathogenesis and prognostic
value of genomic alterations.
Indian Journal of Cancer. 2006 Apr 1;43(2):60.
19. Ke Q, Costa M
Hypoxia-inducible factor-1 (HIF-1)
Molecular pharmacology.2006Nov 1;70(5):1469-80.
20. WeidemannA, JohnsonRS
Biology of HIF-1a – Review
Cell Death and Differentiation. 2008Feb;15, 621-627.
21. Bernhardt WM, Schmitt R, Rosenberger C, Munchenhagen PM,
Gröne HJ, Frei U, Warnecke C, Bachmann S, Wiesener MS,
Willam C, Eckardt KU.
Expression of hypoxia-inducible transcription factors in developing
human and rat kidneys.
Kidney international. 2006 Jan 1;69(1):114.
22. Freeburg PB, Robert B, John PL, Abrahamson DR.
Podocyte Expression of Hypoxia-Inducible Factor (HIF)–1 and HIF–2
during Glomerular Development.
Journal of the American Society of Nephrology. 2003 Apr 1; 14(4):
927-38.

Bibliography
23. Dales JP, Beaufils N, Silvy M, Picard C, Pauly V, Pradel V,
Formisano-Tréziny C, Bonnier P, Giusiano S, Charpin C, Gabert
J.
Hypoxia inducible factor 1α gene (HIF-1alpha) splice variants:
potential prognostic biomarkers in breast cancer.
BMC Medicine. 2010 Jul 12; 8(1):44.
24. Kallergi G, Markomanolaki H, Giannoukaraki V, Papadaki MA,
Strati A, Lianidou ES, Georgoulias V, Mavroudis D, Agelaki S.
Hypoxia-inducible factor-1alpha and vascular endothelial growth
factor expression in circulating tumor cells of breast cancer patients.
Breast Cancer Research 2009 Nov 17; 11(6):R84.
25. Saponaro C, Malfettone A, Ranieri G, Danza K, Simone G,
Paradiso A, Mangia A. VEGF, HIF-1alpha expression and MVD as
an angiogenic network in familial breast cancer.
PloS one. 2013 Jan 1; 8(1):e53070.
26. Simiantonaki N, Taxeidis M, Jayasinghe C, Kurzik-Dumke U,
Kirkpatrick CJ. Hypoxia-inducible factor 1 alpha expression
increases during colorectal carcinogenesis and tumor progression.
BMC Cancer. 2008 Nov 4; 8(1):320.
27. Ioannou M, Simos G, Koukoulis GK.
HIF-1alpha in lung carcinoma: Histopathological evidence of hypoxia
targets in patient biopsies.
Journal of Solid Tumors. 2013 Feb 19; 3(2):p35.
Bibliography
28. Klatte T, Seligson DB, Riggs SB, Leppert JT, Berkman MK, Kleid
MD, Yu H, Kabbinavar FF, Pantuck AJ, Belldegrun AS.
Hypoxia-inducible factor 1α in clear cell renal cell carcinoma.
Clinical Cancer Research. 2007 Dec 15; 13(24):7388-93.
29. Kang FW, Gao Y, Que L, Sun J, Wang ZL.
Hypoxia-inducible factor-1α overexpression indicates poor clinical
outcomes in tongue squamous cell carcinoma.
Experimental and Therapeutic Medicine. 2013 Jan 1; 5(1):112-8.
30. Griffiths EA, Pritchard SA, Valentine HR, Whitchelo N, Bishop
PW, Ebert MP, Price PM, Welch IM, West CM.
Hypoxia-inducible factor-1α expression in the gastric carcinogenesis
sequence and its prognostic role in gastric and gastro-oesophageal
adenocarcinomas.
British Journal of Cancer. 2007 Jan 15; 96(1):95-103.
31. Liang X, Yang D, Hu J, Hao X, Gao J, Mao Z.
Hypoxia inducible factor-1alpha expression correlates with vascular
endothelial growth factor-C expression and
lymphangiogenesis/angiogenesis in oral squamous cell carcinoma.
Anticancer Research. 2008 May 1; 28(3A):1659-66.
Bibliography
32. Wang N, Dong CR, Jiang R, Tang C, Yang L, Jiang QF, Chen GG,
Liu ZM.
Overexpression of HIF-1α, metallothionein and SLUG is associated
with high TNM stage and lymph node metastasis in papillary thyroid
carcinoma.
International journal of clinical and experimental pathology.
2014;7(1):322.
33. LR Alves, Jones KM, de Paula AM, Guimaraes AL, AMB de
Paula, ALS Guimaraes
High HIF-1expression genotypes increase odds ratio of oral cancer.
Head and neck Oncology.2012 Dec 14;4(5):87.
34. Rodolico V, Arancio W, Amato MC, Aragona F, Cappello F, Di
Fede O, Pannone G, Campisi G.
Hypoxia inducible factor-1 alpha expression is increased in infected
positive HPV16 DNA oral squamous cell carcinoma and positively
associated with HPV16 E7 oncoprotein.
Infect Agent Cancer. 2011 Oct 27;6(1):18-22.
35. Peyssonnaux C, Datta V, Cramer T, Doedens A, Theodorakis EA,
Gallo RL, Hurtado-Ziola N, Nizet V, Johnson RS.
HIF-1α expression regulates the bactericidal capacity of phagocytes.
Journal of Clinical Investigation. 2005 Jul 1;115(7):1806.

Bibliography
36. Shin MR, Lee HJ, Kang SK, Auh Q, Lee YM, Kim YC, Kim EC.
Isocudraxanthone K Induces Growth Inhibition and Apoptosis in Oral
Cancer Cells via Hypoxia Inducible Factor-1α.
BioMed research international. 2014 Jul 3;2014.
37. Lin PY, Yu CH, Wang JT, Chen HH, Cheng SJ, Kuo MY, Chiang
CP.
Expression of hypoxia‐inducible factor‐1α is significantly associated
with the progression and prognosis of oral squamous cell carcinomas
in Taiwan.
Journal of oral pathology & medicine. 2008 Jan 1;37(1):18-25.
38. Zhang X, Han S, Han HY, Ryu MH, Kim KY, Choi EJ, Cha IH,
Kim J.
Risk prediction for malignant conversion of oral epithelial dysplasia by
hypoxia related protein expression.
Pathology-Journal of the RCPA. 2013 Aug 1;45(5):478-83.
39. Fillies T, Werkmeister R, van Diest PJ, Brandt B, Joos U, Buerger
H.
HIF1-alpha overexpression indicates a good prognosis in early stage
squamous cell carcinomas of the oral floor.
BMC Cancer. 2005 Jul 21; 5(1):84.

Bibliography
40. Dos Santos M, da Cunha Mercante AM, Louro ID, Goncalves AJ,
de Carvalho MB, da Silva EH, da Silva AM.
HIF1-alpha expression predicts survival of patients with squamous cell
carcinoma of the oral cavity.
PLOS One 2012 Sep;7(9).
41. Chen YJ, Chang JT, Liao CT, Wang HM, Yen TC, Chiu CC, Lu
YC, Li HF, Cheng AJ.
Head and neck cancer in the betel quid chewing area: recent advances
in molecular carcinogenesis.
Cancer science. 2008 Aug 1;99(8):1507-14.
42. Markopoulos AK.
Current aspects on oral squamous cell carcinoma.
The open dentistry journal. 2012;6:126.
43. Mohamed KM, Le A, Duong H, Wu Y, Zhang Q, Messadi DV.
Correlation between VEGF and HIF-1α expression in human oral
squamous cell carcinoma.
Experimental and molecular pathology. 2004 Apr 30;76(2):143-52.
44. Harriss W, Bezak E, Yeoh E, Hermans M.
Measurement of reoxygenation during fractionated radiotherapy in
head and neck squamous cell carcinoma xenografts.
Australasian Physical & Engineering Sciences in Medicine. 2010 Sep
1;33(3):251-63.
Bibliography
45. Dunst J, Stadler P, Becker A, Lautenschläger C, Pelz T, Hänsgen
G, Molls M, Kuhnt T.
Tumor volume and tumor hypoxia in head and neck cancers.
Strahlentherapie und Onkologie. 2003 Aug 1;179(8):521-6.
46. Toustrup K, Sørensen BS, Alsner J, Overgaard J.
Hypoxia gene expression signatures as prognostic and predictive
markers in head and neck radiotherapy.
InSeminars in radiation oncology 2012 Apr 30 (Vol. 22, No. 2, pp.
119-127).
47. Rofstad EK.
Microenvironment-induced cancer metastasis.
International journal of radiation biology. 2000 Jan 1;76(5):589-605.
48. De Lima PO, Jorge CC, Oliveira DT, Pereira MC.
Hypoxic condition and prognosis in oral squamous cell carcinoma.
Anticancer research. 2014 Feb 1;34(2):605-12.
49. Massarelli E, Brown E, tran NK, Liu DD, Izzo JG, Lee JJ, E1-
Naggar AK, Hong WK, Papadimitrakopoulou VA
Loss of E-cadherin and p27 expression is associated with head and
neck squamous tumorigenesis
Cancer 2005; 103(5):952-9.
Bibliography
50. Pires FR, Ramos AB, Oliveira JB, Tavares AS, Luz PS, Santos TC.
Oral squamous cell carcinoma: clinicopathological features from 346
cases from a single Oral Pathology service during an 8-year period.
Journal of Applied Oral Science. 2013 Oct; 21(5):460-7.
51. Youssef HE, Abo-Azma NE, Megahed EM.
Correlation of hypoxia-inducible factor-1 alpha (HIF-1a) andVascular
endothelial growth factor (VEGF) expressions with
clinicopathologicalfeatures of oral squamous cell carcinoma (OSCC)
Tanta Dental Journal. 2015 Dec 31; 12: Supplement 1-14.
52. Maslov AY, Vijg J.
Genome instability, cancer and aging.
BiochimicaetBiophysicaActa (BBA)-General Subjects. 2009 Oct 31;
1790(10):963-9.
53. Lee CH, Ko YC, Huang HL, Chao YY, Tsai CC, Shieh TY, Lin
LM.
The precancer risk of betel quid chewing, tobacco use and alcohol
consumption in oral leukoplakia and oral submucous fibrosis in
southern Taiwan.
British Journal of Cancer. 2003 Feb 10;88(3):366-72.
54. Waris S, Nagi AH.
Epithelial dysplasia in oral mucosa and its association with betel quid
chewing.
Journal of Cytology and Histology. 2014 Jul 1;5(258):2.

Bibliography
55. Reibel J.
Prognosis of oral pre-malignant lesions: significance of clinical,
histopathological, and molecular biological characteristics.
Critical Reviews in Oral Biology & Medicine. 2003 Jan 1;14(1):47-62.
56. Jaber MA, Porter SR, Gilthorpe MS, Bedi R, Scully C.
Risk factors for oral epithelial dysplasia—the role of smoking and
alcohol.
Oral Oncology. 1999 Mar 31;35(2):151
57. Paymaster JC.
Cancer and its distribution in India.
Cancer. 1964 Aug 1;17(8):1026-34.
58. Squier CA.
Smokeless tobacco and oral cancer: A cause for concern.
Cancer Journal for Clinicians. 1984 Sep 1;34(5):242-7.
59. Shan Ho P, Chen PL, Warnakulasuriya S, Shieh TY, Chen YK,
Huang IY.
Malignant transformation of oral potentially malignant disorders in
males: a retrospective cohort study.
BMC cancer. 2009 Jul 30;9(1):260.
60. Schmidt BL, Dierks EJ, Homer L, Potter B.
Tobacco smoking history and presentation of oral squamous cell
carcinoma.
Journal of Oral and Maxillofacial surgery. 2004 Sep 30;62(9):1055-8.

Bibliography
61. George A, Sreenivasan BS, Sunil S, Varghese SS, Thomas J,
Gopakumar D, Mani V.
Potentially malignant disorders of oral cavity.
Oral & Maxillofacial Pathology Journal. 2011 Jan 1;2(1).
62. Schwimmer E.
Leukoplakia Buccalis
Arch dermatsyph1877;9:570-611.
63. Sutherland RM.
Tumor hypoxia and gene expression: implications for malignant
progression and therapy.
ActaOncologica. 1998;37(6):567-74.
64. Stroka DM, Burkhardt T, DesbailletsI, Wenger RH, Neil DA,
Bauer C, Gassmann M, CandinasD.
HIF-1 is expressed in normoxic tissue and displays an organ-specific
regulation under systemic hypoxia.
The FASEB Journal. 2001 Nov 1;15(13):2445-53.
65. Zhong H, De Marzo AM, Laughner E, Lim M, Hilton DA, Zagzag
D, Buechler P, Isaacs WB, Semenza GL, Simons JW.
Overexpression of hypoxia-inducible factor 1alpha in common human
cancers and their metastases.
Cancer research. 1999 Nov 15;59(22):5830-5.

Bibliography
66. Talks KL, Turley H, Gatter KC, Maxwell PH, Pugh CW, Ratcliffe
PJ, Harris AL.
The expression and distribution of the hypoxia-inducible factors HIF-1
alpha and HIF-2 alpha in normal human tissues, cancers, and tumor-
associated macrophages.
The American Journal of Pathology. 2000 Aug 31;157(2):411-21.
67. Kietzmann T, Cornesse Y, Brechtel K, Modaressi S, Jungermann
K.
Perivenous expression of the mRNA of the three hypoxia-inducible
factor α-subunits, HIF1α, HIF2α and HIF3α, in rat liver.
Biochem. J. 2001 Mar 15;354:531-7.
68. Kopfstein L, Christofori G.
Metastasis: cell-autonomous mechanisms versus contributions by the
tumor microenvironment.
Cellular and Molecular Life Sciences 2006 Feb 1;63(4):449-68.
69. Roh JL, Cho KJ, Kwon GY, Choi SH, Nam SY, Kim SY.
Prognostic values of pathologic findings and hypoxia markers in 21
patients with salivary duct carcinoma.
Journal of surgical oncology. 2008 Jun 1;97(7):596-600.
70. Costa AD, Araujo Junior RF, Ramos CC.
Correlation between TNM classification and malignancy histological
feature of oral squamous cell carcinoma.
RevistaBrasileira de Otorrinolaringologia. 2005 Apr;71(2):181-7.

Bibliography
71. Lee CH, Lee MK, Kang CD, Kim YD, Do Youn Park JY, Sol MY,
Suh KS.
Differential expression of hypoxia inducible factor-1 and tumor cell
proliferation between squamous cell carcinomas and adenocarcinomas
among operable non-small cell lung carcinomas.
Journal of Korean Medi Sci. 2003;18:196-203.

Annexures

Annexures
ANNEXURE I

Annexures
ANNEXURE II
DISSERTATION PROTOCOL
1. Title of the dissertation
To study of expression of HIF 1 alpha in the risk prediction of oral epithelial dysplasia and in
oral squamous cell carcinoma.
2. Name and designation of the principal investigator
Dr. K. Malarvizhi
II year postgraduate student
Department of Oral and Maxillofacial Pathology
3. Name of HOD and staff in charge
Dr. K.Ranganathan, MDS,MS (OHIO),Ph.D
Dr. Elizabeth Joshua, MDS
4. Department where the project is to be carried out
Study will be conducted in Department of Oral & Maxillofacial Pathology,
Ragas Dental College & Hospital
5. Duration of the project
1 year
6. Rationale
Carcinogenesis is a multistage process that occurs as a result of number of molecular events
which develop from combined effects of an individual, genetic predisposition and exposure to
environmental carcinogens. The presence of hypoxic microenvironment in solid tumors is caused
by the imbalance between oxygen demand and oxygen delivery. The rapidly proliferating tumour

Annexures
has insufficient vascularization which limits the oxygen diffusion, resulting in the development
of hypoxic region. This causes unregulated expression of a variety of oncogenes such as
hypoxia-inducible factor and vascular endothelial growth factor which enhance irregular vascular
endothelial cell proliferation and differentiation which enhance the growth of new blood
capillaries, leading to the development of neovascularized tumors in head and neck.
7. Hypothesis (null)
There is no difference in expression of HIF 1 alpha in oral epithelial dysplasia, oral squamous
cell carcinoma when compared to normal mucosa
AIM
To evaluate the expression HIF 1 alpha in the risk prediction of oral epithelial dysplasia and in
oral squamous cell carcinoma.
OBJECTIVES
1. To study the expression of HIF–1 alpha in paraffin embedded tissue specimen of mild
dysplasia by Immunohistochemistry.
2. To study the expression of HIF–1 alpha in paraffin embedded tissue specimen of
moderate and severe epithelial dysplasia by Immunohistochemistry.
3. To study the expression of HIF–1 alpha in paraffin embedded tissue specimen of Oral
Squamous Cell Carcinoma by Immunohistochemistry.
4. To study the expression of HIF–1 alpha in paraffin embedded tissue specimen of
normal mucosa by Immunohistochemistry
5. To compare the expression of HIF–1 alpha in mild, moderate, severe epithelial
dysplasia, OSCC and normal oral mucosa by Immunohistochemistry

Annexures
8. MATERIALS AND METHODS
Sample:
Group I: 15 normal oral mucosal tissue specimens.
Group II: 15 histopathologically confirmed mild epithelial dysplasia tissue specimens
Group III: 15 histopathologically confirmed moderate and severe epithelial dysplasia
tissue specimens
Group IV: 15 histopathologically confirmed OSCC tissue specimens
Procedure:
Immunohistochemistry (IHC)
Statistics to be used:
Chi-square test
Data analysis to be done using SPSS (Statistical Package of Social Science)
Version 20
Equipments and chemical reagents needed:
1. Microtome
2. Autoclave
3. Hot air oven
4. Slide warmer
5. Coupling jars
6. Measuring jar
Annexures
7. Weighing machine
8. APES coated slides
9. Slide carrier
10. Aluminium foil
11. Micro-pipettes
12. Toothed forceps
13. Electronic timer
14. Beakers
15. Rectangular steel tray with glass rods
16. Sterile gauze
17. Cover-slips
18. Light microscope
Reagents used:
1. Conc. HCl
2. APES (Amino propyl triethoxysilane)
3. Acetone
4. Citrate buffer
5. Phospho Buffer Saline (PBS)
6. 3% H2O2
7. Deionized distilled water
8. Hematoxylin
9. Absolute alcohol
10. Xylene

Annexures
Signature of principal investigator
Signature of Head of Department
Remarks of committee:
Permission granted YES/NO
Modifications / condition

ANNEXURE-III


Annexures
ANNEXURE IV

Annexures


Annexures
ANNEXURE VII
ABBREVIATIONS
1. HIF - Hypoxia Inducible Factor
2. OSCC - Oral squamous cell carcinoma
3. HNSCC - Head and neck squamous cell carcinoma
4. WHO - World Health Organisation
5. IHC - Immunohistochemistry
6. APES - Amino propyl triethoxysilane
7. H&E - Hematoxylin and Eosin
8. LM - Light Microscope
9. HCl - Hydrochloric acid
10. H2O2 - Hydrogen peroxide
11. DAB - Di amino benzidine
12. HRP - Horseradish Peroxidase
13. DPX - Dibutyl Phthalate in xylene
14. OED - Oral epithelial dysplasia
15. Ki67 - Kiel 67 protein
16. INK - Inhibitor Kinases
17. LOH - Loss of heterozygosity
18. DNA - Deoxy ribo nucleic acid
19. EGFR - Epidermal Growth Factor Receptor
20. erbB - 2 - Human epidermal growth factor

Annexures
21. TSG - Tumour suppressor gene
22. bcl2 - B cell lymphoma 2 gene
23. p53(or)TP53 - Protein 53 (or ) Tumour Protein 53
24. EPO - Erythropoietin
25. ARNT - Aryl hydrocarbon nuclear translocator
26. bHLH - Basic helix loop helix
27. ODDD - Oxygen dependent degradation domain
28. VEGF - Vascular endothelial growth factor
29. TCA - Tricarboxylic acid
30. ATP - Adenosine tri phosphate
31. GLUT 1 - Glucose transporter 1
32. IGF2 - Insulin like growth factor 2
33. MAPK - Mitogen activated protein kinases
34. TGF - Transforming growth factor
35. Bax - B cell lymphoma associated X protein
36. NOXA - BH3 only family
37. PUMA - p53 upregulated modulator of apoptosis
38. PERP - p53 apoptosis effector regulated PMP
39. LDH - Lactate dehydrogenase
40. PDH - Pyruvate dehydrogenase
41. COX - Cyclooxygenase
42. PCR - Polymerase chain reaction

Annexures
43. pFAK - Phosphorylated Focal adhesion Kinase
44. PBMCs - Peripheral blood mononuclear cells
45. MVD - Microvessel density
46. HPP - Hyperplastic polyps
47. LPS - Lipopolysaccharide
48. RCC - Renal cell carcinoma
49. p27 - Kinase Inhibitory Protein p27
50. CXCR3 - Chemokine ( C-X-C Motif) Receptor
51. CAIX - Carbonic anhydrases IX
52. SLUG - Zinc finger protein
53. HPV - Human papilloma virus
54. TNF - Tumour necrosis factor
55. VHL - Von Hippel–Lindau
56. ERK - Extracellular signal-regulated kinase
57. NF-𝜅B - Nuclear factor-𝜅B