
STUDY OF CONTROL SCHEMES FOR SERIES HYBRID-ELECTRIC ...
100
Louisiana State University Louisiana State University LSU Digital Commons LSU Digital Commons LSU Master's Theses Graduate School October 2020 STUDY OF CONTROL SCHEMES FOR SERIES HYBRID-ELECTRIC STUDY OF CONTROL SCHEMES FOR SERIES HYBRID-ELECTRIC POWERTRAIN FOR UNMANNED AERIAL SYSTEMS POWERTRAIN FOR UNMANNED AERIAL SYSTEMS Darren A. Dehesa Jr Louisiana State University at Baton Rouge Follow this and additional works at: https://digitalcommons.lsu.edu/gradschool_theses Part of the Propulsion and Power Commons, and the Systems Engineering and Multidisciplinary Design Optimization Commons Recommended Citation Recommended Citation Dehesa, Darren A. Jr, "STUDY OF CONTROL SCHEMES FOR SERIES HYBRID-ELECTRIC POWERTRAIN FOR UNMANNED AERIAL SYSTEMS" (2020). LSU Master's Theses. 5221. https://digitalcommons.lsu.edu/gradschool_theses/5221 This Thesis is brought to you for free and open access by the Graduate School at LSU Digital Commons. It has been accepted for inclusion in LSU Master's Theses by an authorized graduate school editor of LSU Digital Commons. For more information, please contact [email protected].
Transcript of STUDY OF CONTROL SCHEMES FOR SERIES HYBRID-ELECTRIC ...
Louisiana State University Louisiana State University
LSU Digital Commons LSU Digital Commons
LSU Master's Theses Graduate School
October 2020
STUDY OF CONTROL SCHEMES FOR SERIES HYBRID-ELECTRIC STUDY OF CONTROL SCHEMES FOR SERIES HYBRID-ELECTRIC
POWERTRAIN FOR UNMANNED AERIAL SYSTEMS POWERTRAIN FOR UNMANNED AERIAL SYSTEMS
Darren A. Dehesa Jr Louisiana State University at Baton Rouge
Follow this and additional works at: https://digitalcommons.lsu.edu/gradschool_theses
Part of the Propulsion and Power Commons, and the Systems Engineering and Multidisciplinary
Design Optimization Commons
Recommended Citation Recommended Citation Dehesa, Darren A. Jr, "STUDY OF CONTROL SCHEMES FOR SERIES HYBRID-ELECTRIC POWERTRAIN FOR UNMANNED AERIAL SYSTEMS" (2020). LSU Master's Theses. 5221. https://digitalcommons.lsu.edu/gradschool_theses/5221
This Thesis is brought to you for free and open access by the Graduate School at LSU Digital Commons. It has been accepted for inclusion in LSU Master's Theses by an authorized graduate school editor of LSU Digital Commons. For more information, please contact [email protected].

STUDY OF CONTROL SCHEMES FOR SERIES HYBRID-
ELECTRIC POWERTRAIN FOR UNMANNED AERIAL SYSTEMS
A Thesis
Submitted to the Graduate Faculty of the
Louisiana State University and
Agricultural and Mechanical College
in partial fulfillment of the
requirements for the degree of
Master of Science
in
The Department of Mechanical and Industrial Engineering
by
Darren Anthony Dehesa, Jr.
B.S.M.E., Louisiana State University, 2018
December 2020

ii
Acknowledgments
I would like to thank my major professor Dr. Shyam Menon and the rest of my committee,
Dr. Ram Devireddy and Dr. Wanjun Wang. As an undergraduate, the thought of going to graduate
school was full of uncertainty. However, after meeting with Dr. Menon and discussing the benefits
of graduate school, I was excited to be returning to LSU to be a part of a new project on hybrid
powertrains that he was beginning. Dr. Menon’s dedication to graduate studies and his knowledge
of hybrid powertrains was an invaluable quality that aided in completing my work. I would also
like to thank the collaborative effort with James Benbrook and Dr. Chris Hagen from the Oregon
State University as well as Kofi Agyemang Amankwah and Dr. Stephen Akwaboa from Southern
University – Baton Rouge. Further, I would like to acknowledge the inputs and advice from Chad
Miller, Dr. Michael Rottmayer, and Dr. Michael Rothenberger, and Dr. Thomas Howell at the Air
Force Research Laboratory. I will always appreciate the warm welcome extended to me by
everyone at AFRL during my stay over the summer.
Next, I would like to thank my fellow lab mates, who have been a tremendous help
throughout my graduate career: Wanjun Dang, James Leung, Mohana Gurunadhan, and Varun
Viswamithra. I will miss the conversation that we shared and the support that you gave. Also, I
would like to thank the undergraduate researcher who helped get the hybrid testbed up and running:
James Szeszycki and Matthew Monju. Your dedication and hard work with helping us assemble a
functioning series hybrid testbed was very appreciated.
Lastly, I would like to thank my family and friends. If not for my parents, encouraging me
to pursue my master’s, I would not be where I am now. Without their love and support finishing
these two years would have been difficult, and I’m grateful to have such a strong support group

iii
pushing me to be the best that I can be. I’m incredibly grateful for the opportunities, knowledge,
and experiences that I have gained over the years, and I will cherish them for times to come.
iv
Table of Contents
Acknowledgments........................................................................................................................... ii
List of Tables ................................................................................................................................. vi
List of Figures ............................................................................................................................... vii
Nomenclature .................................................................................................................................. x
Abstract ......................................................................................................................................... xii
Chapter 1. Introduction ............................................................................................................... 1 1.1. Motivation and Problem Statement .................................................................................... 1
1.2. Research Objectives ............................................................................................................ 6 1.3. Approach ............................................................................................................................. 6 1.4. Thesis Structure .................................................................................................................. 7
Chapter 2. Literature Review and Theory .................................................................................. 9 2.1. Introduction to UAS Hybrid Powertrains ........................................................................... 9
2.2. Issue with Current UAS Powertrains ................................................................................ 13 2.3. Challenges and Advantages for Hybridizing Aircraft ...................................................... 17 2.4. Hybrid Powertrain Control Methods ................................................................................ 21
Chapter 3. Integrated HEUAS Series Powertrain Model ......................................................... 25 3.1. System Model Description ................................................................................................ 25
3.2. Mission Simulation/Flight Profile .................................................................................... 45
Chapter 4. Series HEUAS Control Methods ............................................................................ 48
4.1. Baseline Control ............................................................................................................... 48 4.2. IOL Control ....................................................................................................................... 49 4.3. Fuzzy Logic Control ......................................................................................................... 51
Chapter 5. Results and Discussion ........................................................................................... 56 5.1. Mission Comparison ......................................................................................................... 56 5.2. Baseline Control Results ................................................................................................... 60 5.3. IOL Control Results .......................................................................................................... 63 5.4. Fuzzy Logic Control Results ............................................................................................ 66
5.5. Control Method Fuel Consumption Comparison .............................................................. 69
Chapter 6. Hardware Setup ....................................................................................................... 72
Chapter 7. Conclusions ............................................................................................................. 76 7.1. Concluding Remarks ......................................................................................................... 76
7.2. Future works ..................................................................................................................... 79
References ..................................................................................................................................... 80

v
Vita ................................................................................................................................................ 86

vi
List of Tables
Table 1. UAS group specifications ................................................................................................. 4
Table 2. AAI Aerosonde parameters ............................................................................................ 42
Table 3. Rule set for FLC1 ........................................................................................................... 54
Table 4. Rule set for FLC2 ........................................................................................................... 55
Table 5. Controller fuel economy comparison ............................................................................. 71

vii
List of Figures
Figure 1. Hybrid aircraft concepts .................................................................................................. 3
Figure 2. Existing hybrid aircrafts .................................................................................................. 4
Figure 3. Group 2 UAS aircrafts ..................................................................................................... 5
Figure 4. Series hybrid configuration ............................................................................................. 9
Figure 5. Parallel hybrid configuration ......................................................................................... 10
Figure 6. Power-Split hybrid configuration .................................................................................. 12
Figure 7. Scaling of overall efficiency with engine size .............................................................. 13
Figure 8. UAS endurance ............................................................................................................. 14
Figure 9. Pipistrel ALPHA ELECTRO ....................................................................................... 14
Figure 10. NASA X-57 ................................................................................................................ 15
Figure 11. HEV powertrain control space diagram ..................................................................... 22
Figure 12. System model for series hybrid-electric UAS ............................................................. 25
Figure 13. Series hybrid layout and signal flow ........................................................................... 26
Figure 14. Electric motor Simulink model ................................................................................... 27
Figure 15. Electrical machine classification ................................................................................ 28
Figure 16. DC motor equivalent circuit model ............................................................................ 28
Figure 17. Motor model response validation ................................................................................ 29
Figure 18. Generator Simulink model .......................................................................................... 30
Figure 19. Battery model classification ....................................................................................... 32
Figure 20. Equivalent circuit model diagram .............................................................................. 34
Figure 21. Battery Simulink model ............................................................................................... 35
Figure 22. Sony VTC6 charge/discharge data .............................................................................. 36
viii
Figure 23. Battery response curve ................................................................................................ 36
Figure 24. Battery model response 1C discharge cycle ................................................................ 37
Figure 25. Battery model response random charge/discharge profile .......................................... 37
Figure 26. Battery model parameters for charging data ............................................................... 38
Figure 27. Battery model parameters for discharge data .............................................................. 38
Figure 28. Battery model voltage parameters ............................................................................... 39
Figure 29. Battery model series resistance parameters ................................................................. 39
Figure 30. IC engine Simulink model ........................................................................................... 40
Figure 31. 3w-28i Performance Data ............................................................................................ 41
Figure 32. UAS aircraft Simulink model ...................................................................................... 42
Figure 33. Aircraft point mass model .......................................................................................... 43
Figure 34. Aircraft model lift/drag polar ...................................................................................... 43
Figure 35. Propeller Simulink model ............................................................................................ 44
Figure 36. Propeller model data .................................................................................................... 45
Figure 37. Simulation flight profiles ............................................................................................. 47
Figure 38. Charge enable control logic ......................................................................................... 48
Figure 39. IOL control scheme ..................................................................................................... 49
Figure 40. Engine efficiency contour map and ideal operating line ............................................. 50
Figure 41. Fuzzy logic control diagram ........................................................................................ 51
Figure 42. FLC1 input membership functions .............................................................................. 52
Figure 43. FLC2 input membership functions .............................................................................. 53
Figure 44. Output membership functions ..................................................................................... 54
Figure 45. Cruising mission propulsion motor simulation data .................................................... 57

ix
Figure 46. Maneuvering mission propulsion motor simulation data ............................................ 58
Figure 47. Surveillance mission propulsion motor simulation data ............................................. 60
Figure 48. Baseline controller generator current .......................................................................... 61
Figure 49. Baseline controller generator power ............................................................................ 62
Figure 50. Baseline controller battery SOC .................................................................................. 63
Figure 51. Baseline controller engine fuel consumption .............................................................. 63
Figure 52. IOL controller generator current ................................................................................. 64
Figure 53. IOL controller generator power ................................................................................... 65
Figure 54. IOL controller battery SOC ......................................................................................... 65
Figure 55. IOL controller engine fuel consumption ..................................................................... 66
Figure 56. FLC controller generator current ................................................................................. 67
Figure 57. FLC controller generator power .................................................................................. 67
Figure 58. FLC controller battery SOC ........................................................................................ 68
Figure 59. FLC controller engine fuel consumption ..................................................................... 68
Figure 60. Controller fuel consumption per flight mission........................................................... 70
Figure 61. Hardware setup diagram .............................................................................................. 72
Figure 62. Physical testbed image ................................................................................................ 74

x
Nomenclature
η = Efficiency
Q = Energy density
m = Mass
W = Weight
Ψ = Degree of hybridization
S = Power split
g = Acceleration due to gravity
L/D = Lift to drag ratio
Estart = Energy at takeoff
J = Motor inertia
Li = Armature inductance
R = Armature resistance
b = Viscous damping friction
Kb = Back EMF constant
Kt = Motor torque constant
�̇�
= Angular rotation
i = Current
V = Voltage
T = Torque
e = Back-EMF
C = C-Rate
OCV = Open circuit voltage

xi
t = Time
τ = Time constant
J = Advance ratio
Vc = Flight speed
CT = Thrust coefficient
CP = Power coefficient
CQ = Propeller torque coefficient
n = Rotational speed
Dp = Propeller diameter
Tr = Thrust
P = Power
D = Drag
L = Lift
ρ = Density
Sw = Wing wetted surface area
ℎ̇
= Rate of climb
θ = Angle of attack

xii
Abstract
Hybrid-Electric aircraft powertrain modeling for Unmanned Aerial Systems (UAS) is a
useful tool for predicting powertrain performance of the UAS aircraft. However, for small UAS,
potential gains in range and endurance can depend significantly on the aircraft flight profile and
powertrain control logic in addition to the subsequent impact on the performance of powertrain
components. Small UAS aircraft utilize small-displacement engines with poor thermal efficiency
and, therefore, could benefit from a hybridized powertrain by reducing fuel consumption. This
study uses a dynamic simulation of a UAS, representative flight profiles, and powertrain control
logic approaches to evaluate the performance of a series hybrid-electric powertrain. Hybrid
powertrain component models were developed using lookup tables of test data and model
parameterization approaches to generate a UAS dynamic system model. These models were then
used to test three different hybrid powertrain control strategies for their ability to provide efficient
IC engine operation during the charging process.
The baseline controller analyzed in this work does not focus on optimizing fuel efficiency.
In contrast, the other two controllers utilize engine fuel consumption data to develop a scheme to
reduce fuel consumption during the battery charging operation. The performance of the powertrain
controllers is evaluated for a UAS operating on three different representative mission profiles
relevant to cruising, maneuvering, and surveillance missions. Fuel consumption and battery state
of charge form two metrics that are used to evaluate the performance of each controller. The first
fuel efficiency-focused controller is the ideal operating line (IOL) strategy. The IOL strategy uses
performance maps obtained by engine characterization on a specialized dynamometer. The
simulations showed the IOL strategy produced average fuel economy improvements ranging from
12%-15% for a 30-minute mission profile compared to the baseline controller. The last controller

xiii
utilizes fuzzy logic to manage the charging operations while maintaining efficient fuel operation
where it produced similar fuel saving to the IOL method but were generally higher by 2-3%. The
importance of developing detailed dynamic system models to capture the power variations during
flight with fuel-efficient powertrain controllers is key to maximizing small UAS hybrid powertrain
performance in varying operating conditions.
1
Chapter 1. Introduction
1.1. Motivation and Problem Statement
The desire to reduce vehicle greenhouse gas emissions from fossil fuel-based propulsion
systems has created a growing interest in hybrid propulsion system. This reduction in fossil fuel
usage is mainly accomplished by introducing more electrified forms of propulsion into vehicles,
such as hybridized vehicles. In the automotive industry, various implementations of hybrid
powertrains combining internal combustion (IC) engine with an electric motor have been used to
reduce vehicle fuel consumption and emissions considerably. A hybrid vehicle is generally defined
as any vehicle that implements two distinct forms of power for propelling the vehicle. Different
forms of hybrid systems such as gasoline-hybrid powertrain vehicles or fuel cell-electric hybrid
systems have been developed and shown to be feasible. The interest in hybrid aircraft was sparked
when automobiles began to implement hybrid powertrain technology and successfully reduce
emissions. Numerous techniques have been utilized to reduce emissions, such as using smaller
displacement 4-cylinder engines, which use less fuel than typical engines that propel vehicles now.
Another method used is regenerative braking, where energy from decelerating the vehicle is
harvested and converted to electrical power. This method essentially reuses energy that would be
otherwise wasted, which can now, in the form of electrical power, be used to propel the vehicle
[1]. Likewise, next-generation aircraft seek to leverage hybrid electric powertrain technology to
reduce fuel consumption and emissions by using more electrified forms of propulsion, which also
have the added benefit of reduced noise. This increasing interest in hybrid technology has
obviously created new engineering challenges for the aviation industry. Challenges such as
designing a hybrid propulsion system without affecting the aircraft’s current performance in terms

2
of payload weight capacity, range, and endurance is of great importance, but being able to surpass
that performance mark is the ultimate goal.
Research and development into all-electric and hybrid-electric aircraft propulsion are
ongoing at leading aviation companies and national laboratories [2]. Airbus and Rolls Royce are
currently collaborating on a series hybrid aircraft concept called the E-Fan X. This aircraft uses
the BAe 146 regional plane as a testbed with one of the aircraft's four gas turbine engines replaced
by a 2 MW electric motor [3]. Other hybrid electric aircrafts concepts exist, as shown in Figure 1,
such as the CENTERLINE concept, which uses a propulsive fuselage concept that places a turbo-
electric propulsor in the tail of the aircraft. Another hybrid aircraft in development by Boeing
called SUGAR Freeze, utilizes a liquefied natural gas fuel cells to electric power motors. Lastly,
an all-electric aircraft being developed by NASA called the X-57 Maxwell utilizes 14 electric
motors to provide sufficient thrust. Its ultimate design goal is to achieve a 500 percent increase in
high-speed cruise efficiency [4].
(a) Bauhaus Luftfahrt CENTERLINE [5]
(b) Boeing SUGAR Freeze [6]
(fig. cont'd.)

3
(c) Airbus E-Fan X [3]
Figure 1. Hybrid aircraft concepts
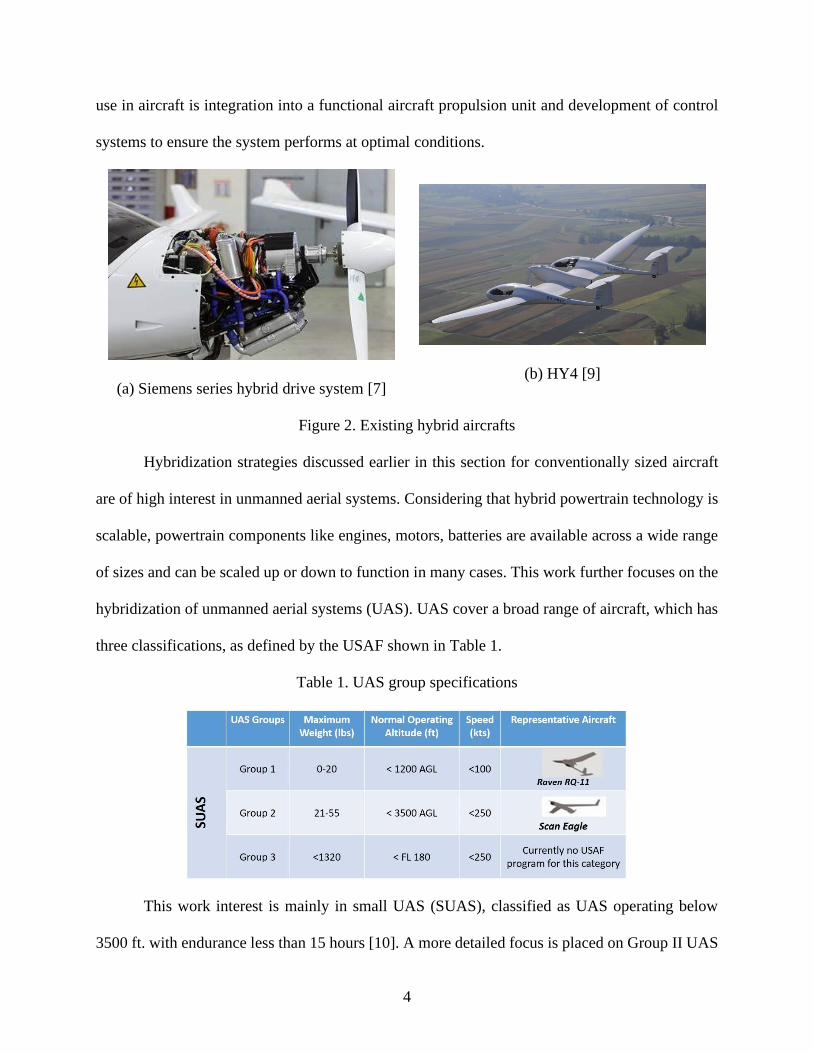
Some functioning prototypes for hybrid aircraft have been developed and tested. One
example of a functioning hybrid aircraft is shown in Figure 2 of the Siemen’s DA36 E-Star 2
aircraft, which utilizes a hybrid powertrain implemented in a series configuration. The Siemen’s
aircraft successfully completed a one-hour flight at the Paris Air Show in 2013 and claimed a 25%
reduction in fuel consumption and emissions [7]. The HY4 is another hybrid aircraft that first took
flight in 2016 and has a fuel cell hybrid powertrain. The HY4 claims to be able to achieve a range
of between 750-1500 km depending on flight conditions [8]. As one can see, many different forms
of hybrid powertrains are being explored and, more specifically, hybrid electric powertrains. A
hybrid vehicle is generally defined as any vehicle that implements two distinct forms of power for
propelling the vehicle. Different forms of hybrid systems such as fuel cell hybrid systems have
been developed and shown to be feasible. However, hybrid powertrains mainly considered
practical for use in transportation consist of petroleum-electric hybrid considering current
technology with fuel cell-electric hybrids becoming increasingly popular and may become feasible
powertrains in the near future. The hybrid-electric powertrain class that is the main focus of this
work because this hybrid technology is proven and mature. Thus, the only development needs for
4
use in aircraft is integration into a functional aircraft propulsion unit and development of control
systems to ensure the system performs at optimal conditions.
(a) Siemens series hybrid drive system [7] (b) HY4 [9]
Figure 2. Existing hybrid aircrafts
Hybridization strategies discussed earlier in this section for conventionally sized aircraft
are of high interest in unmanned aerial systems. Considering that hybrid powertrain technology is
scalable, powertrain components like engines, motors, batteries are available across a wide range
of sizes and can be scaled up or down to function in many cases. This work further focuses on the
hybridization of unmanned aerial systems (UAS). UAS cover a broad range of aircraft, which has
three classifications, as defined by the USAF shown in Table 1.
Table 1. UAS group specifications
This work interest is mainly in small UAS (SUAS), classified as UAS operating below
3500 ft. with endurance less than 15 hours [10]. A more detailed focus is placed on Group II UAS

5
because this class of aircraft is generally powered by small IC engines, which makes it a good
candidate for adopting a hybrid powertrain. While group 1 aircraft can be hybridized, they are
typically smaller, making it challenging to implement a full hybrid system. The smaller footprint
is also why group 1 aircraft are usually fully electric systems, which is more suited for the small
footprint of group 1 aircraft. The aircrafts shown in Figure 3 depict two examples of group 2 UAS,
which are the Boeing Insitu ScanEagle and the AAI Aerosonde. These are popular UAS platforms
used by various defense services that are powered by small IC engines and could show
performance benefits from powertrain hybridization, such as the benefits listed below:
• Reduced aircraft noise signature through utilizing all-electric propulsion.
• Dual power source capability providing redundancy in case of failure of either propulsion
motor.
• Reduced downtime for the aircraft because battery recharging is unnecessary when a
generator is on board the aircraft.
• Electric propulsion is unaffected by density altitude and allows for downsizing the ICE.
(a) Boeing Insitu ScanEagle UAV [11] (b) AAI Aerosonde [12]
Figure 3. Group 2 UAS aircrafts
However, the challenge of hybridizing an aircraft is the weight created by the batteries in
the powertrain electrification process. Aircraft design aspects such as payload weight, thrust, and

6
lift are all impacted by this increase in aircraft weight resulting from electrification. Therefore,
when introducing a hybrid powertrain configuration into an aircraft, the components must be
carefully selected for power, weight, and efficiency to have optimal performance. Also, a robust
and efficient energy management control strategy is needed so that the aircraft can perform the
same or better than a conventional aircraft. The efforts in this paper focus on exploring the effects
of hybridizing a group 2 UAS, where the primary goal is reducing fuel consumption, which is a
particular concern for UAS in group 2 because of the small, inefficient 2-stroke engines use in this
platform.
1.2. Research Objectives
1. Analyze series hybrid powertrain performance for representative UAS taking into account
detailed performance characteristics of individual components as well as dynamic effects
imposed by the aircraft mission profile.
2. Develop and evaluate control schemes for series hybrid powertrains and compare their
relative benefits or deficiencies.
1.3. Approach
• Develop a dynamic powertrain model simulation for a series hybrid powertrain for a
representative group 2 UAS aircraft.
• Incorporate detailed performance maps for individual powertrain components either from
models with tuned parameters or measured performance data through lookup tables.
• Develop different control approaches that aim to reduce fuel consumption and compare to
a baseline control scheme.
• Develop a hardware in the loop (HIL) testbed to validate the powertrain model, test the
various control schemes, and optimize or tune the model for accuracy.

7
1.4. Thesis Structure
This thesis is organized into seven chapters that detail the theory, modeling, and analysis
of a series hybrid electric powertrain for a UAS. Chapter 2 provides a literature review of hybrid
powertrains concepts where a review of the various powertrain configurations are explored in
addition to the number of design challenges of hybridizing a UAS. A review of the advantages and
disadvantages of conventional petroleum-powered aircraft and electric-powered aircraft is offered,
where an explanation of the benefits of combining these two forms of propulsion into a hybrid
system is discussed.
Chapter 3 provides a detailed explanation of the integrated HEUAS series powertrain
model. The various component models composing the hybrid system are discussed in terms of
their development, performance, and role in the system model. Also, a set of mission profiles are
presented and discussed, which serve as the test cases for the powertrain to simulate different flight
situations or missions that a UAS will typically perform.
Chapter 4 discusses the three different control approaches used in this analysis to determine
the fuel-efficient operation of the hybrid powertrain. This section will mainly focus on the Ideal
Operating Line (IOL) controller development and the fuzzy logic controller and its focus on fuel
efficiency.
Chapter 5 discusses the results of the three individual control strategies and their effect on
the performance of the hybrid powertrain for the three different mission profiles addressed in
chapter 3. A comparison of the three different control strategies is also discussed where the control
strategies are analyzed for their effectiveness to reduce fuel consumption over the 30 min mission
duration for the three different mission profiles.

8
Chapter 6 describes the hardware test stand developed for a series hybrid powertrain and
describes what instrumentation and components were used in its development. In this section, a
detailed explanation is given for how these various components interact and what information and
data are collected to aid in validating the powertrain model simulation.
The last chapter contains the concluding remarks, recommendations, and the next steps for
hybrid powertrain modeling, control, and testing.

9
Chapter 2. Literature Review and Theory
2.1. Introduction to UAS Hybrid Powertrains
2.1.1. Series Hybrid Configuration
Many hybrid propulsion systems are petroleum-electric based because of its simplicity and
ease of integration. Within this class of hybrid electric powertrains, three different powertrain
configurations are possible, which are series, parallel, and split power. Each of these configurations
have their pros and cons, such as increased packaging weight or reduced versatility.
Figure 4. Series hybrid configuration
The series configuration (Figure 4) is the simplest powertrain type consisting of electric
motors (EM), batteries, and internal combustion (IC) engine with a generator. The series hybrid
vehicle’s propulsion is purely derived from electric motors. An IC engine serves as an auxiliary
source of power for the electric motor when the batteries require charging. The IC engine during
charging periods operates at some optimum point to reduce fuel consumption. The series HEV is
advantageous in many aspects in comparison to other HEV architectures listed previously. For
example, no mechanical path exists between the engine and the propeller, enabling the ICE to
operate in a peak-efficiency zone and reduce fuel consumption. The absence of a mechanical
connection also reduces the space need for the powertrain. Also, when compared to parallel and
power-split configuration hybrid vehicles, the series HEV can be adequately managed using a
relatively simple control scheme [13]. However, some disadvantages exist for the series hybrid
powertrain as outlined in [13], which are:
10
• Multiple energy conversions are needed, which reduce the overall efficiency of series
HEV, especially when the vehicle is at high speed
• The propulsion motor is the only direct power source, which means the motor and its
supporting electronics should meet maximum power demand, thus requiring more robust
construction which increases cost, weight, and volume requirements
• The power of the engine is unable to be provided directly to the propeller if the propulsion
motor fails.
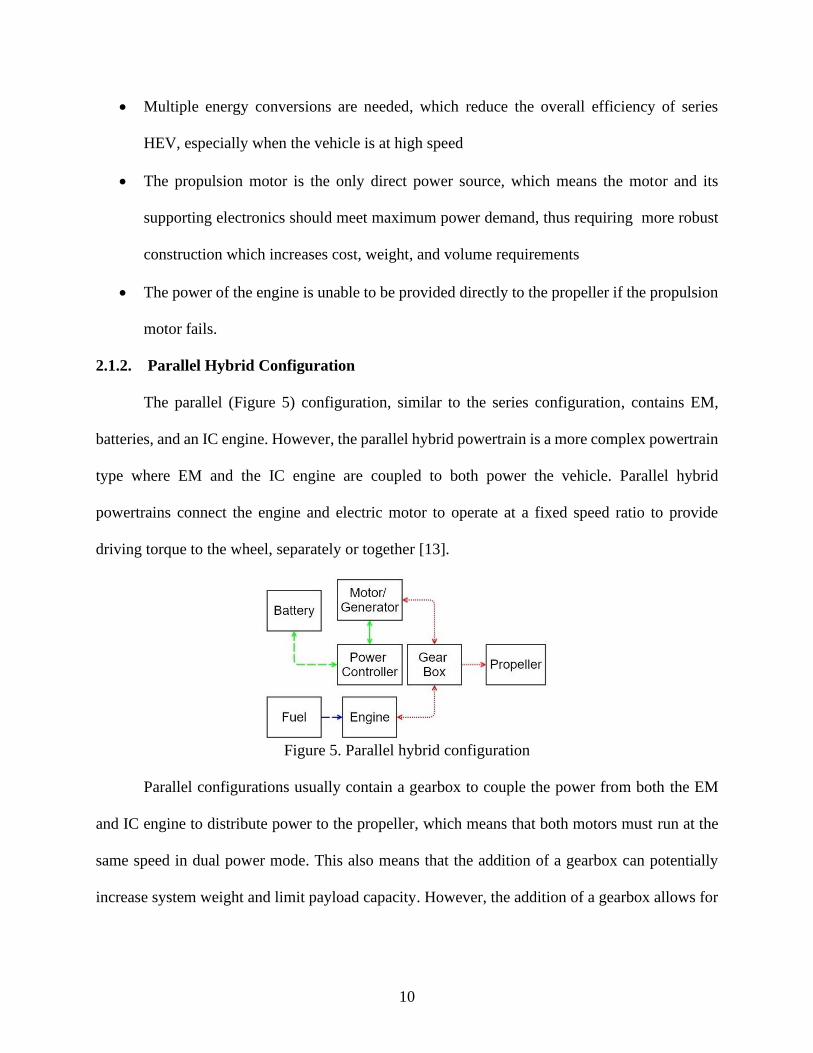
2.1.2. Parallel Hybrid Configuration
The parallel (Figure 5) configuration, similar to the series configuration, contains EM,
batteries, and an IC engine. However, the parallel hybrid powertrain is a more complex powertrain
type where EM and the IC engine are coupled to both power the vehicle. Parallel hybrid
powertrains connect the engine and electric motor to operate at a fixed speed ratio to provide
driving torque to the wheel, separately or together [13].
Figure 5. Parallel hybrid configuration
Parallel configurations usually contain a gearbox to couple the power from both the EM
and IC engine to distribute power to the propeller, which means that both motors must run at the
same speed in dual power mode. This also means that the addition of a gearbox can potentially
increase system weight and limit payload capacity. However, the addition of a gearbox allows for
11
better control of power flow as needed. This means that the EM can also work as an engine booster
or generator to optimize the efficiency of ICE, according to battery SOC and system load [13].
Moreover, the parallel system can generate power to charge the batteries like the series
configuration but because there is no second EM for dedicated power generation. The same EM
used for propulsion must also function as a generator during battery charging operations. This
implies that the EM is not able to provide propulsive power during the charging process, and
propulsion is purely supplied by the IC engine. Thus, if the aircraft undergoes a scenario where
the engine is not able to provide the necessary torque or power to meet the demand while the
battery SOC is low and charging is a high priority, the EM will not be able to assist the IC engine
in meeting the power demand. Most parallel hybrid systems seen in automobiles utilize other
methods to recharge the batteries, such as regenerative braking [14]. Unfortunately, in an aircraft,
this is not a concept that is always feasible. Some researchers have explored different techniques
to harvest energy, such as in [15], where thin-film photovoltaics are explored for range-extending
capabilities or a windmilling design explored in [16].
2.1.3. Series-Parallel Hybrid Configuration
Lastly, the power-split (Figure 6) or series-parallel configuration combines both aspects of
the series and parallel systems. Power-split powertrains are similar to the series configuration and
have a dedicated generator for supplemental power for charging batteries. Also, the energy from
the IC engine and EM can be coupled together via a gearbox to provide propulsion for the vehicle
similar to the parallel system. This gearbox is often called a power split device, which is usually a
single planetary gear set or a compound planetary gear set. This gear set is responsible for splitting
the engine torque into two parts delivered to the output shaft. The planetary gear set allows for the
rotational speeds of three individual gears (sun gear, ring gear, and carrier gear) to provide

12
independent rotation of ICE and thus enable the engine to be controlled to operate within a peak-
efficiency zone. Since this configuration allows the IC engine to operate efficiently, the power-
split design can achieve significant efficiency, and this configuration is very prevalent in the
automotive hybrid vehicle sector [13].
Figure 6. Power-Split hybrid configuration
An example of a successful and the most notable power split system currently in use is the
Toyota Prius. The Prius is a series-parallel system that utilizes a compound planetary gear set to
distribute the power from the IC engine to the generator and the wheels for propulsion. The system
also couples the electric traction motor to further distribute power for accelerating the vehicle. The
compound planetary gear system was implemented in later generations to extend the operating
range at higher speeds. With so many different hybrid electric configurations possible, it becomes
difficult to decide which system is best to use in an aircraft. Ultimately the use of a specific
configuration is dependent on vehicle usage and design requirements. These various
configurations allow for flexibility in designing a hybrid aircraft to fulfill numerous requirements
such as increased range or redundancy. For this work, the focus was placed on the series hybrid
configuration because it best fits the needs of the group 2 UAS. The series configuration was also
chosen for its simplicity in developing a control strategy and the relative ease of developing a
hardware test stand to test the control scheme.

13
2.2. Issue with Current UAS Powertrains
The benefits of hybridization are well known in terms of fuel efficiency and range-
extending in ground vehicles, and adaptation into aircraft is the next logical step. Consequently,
some challenges exist which are unique to aircraft, one of which is weight. Aircraft have strict
weight requirements, and all the powertrain components of the aircraft must be chosen such that
the performance of the aircraft is not hindered. Aircraft design aspects such as Gross Take-off
Weight (GTOW), payload weight, thrust, and lift are all essential parameters that are linked
together and affect performance.
Figure 7. Scaling of overall efficiency with engine size [17]
Therefore, when introducing a hybrid powertrain configuration into an aircraft, the
components must be carefully selected for power, weight, and efficient performance so that the
aircraft can perform the same or better than a conventional aircraft. This aspect of component
weight is underscored when you consider the batteries required in a hybrid powertrain. The
primary source of weight in hybrid vehicles is the battery due to their low specific energy, which
ranges from 100-200 Wh/kg (0.9 MJ/kg) [18]. When compared to gasoline, which has a specific
energy of ~45 MJ/kg, this energy density difference is nearly 50x greater for gasoline, and it is
14
apparent that more battery mass is needed to match the energy capacity of most petroleum-based
fuels, and this is the case for even the most advanced lithium-ion batteries.
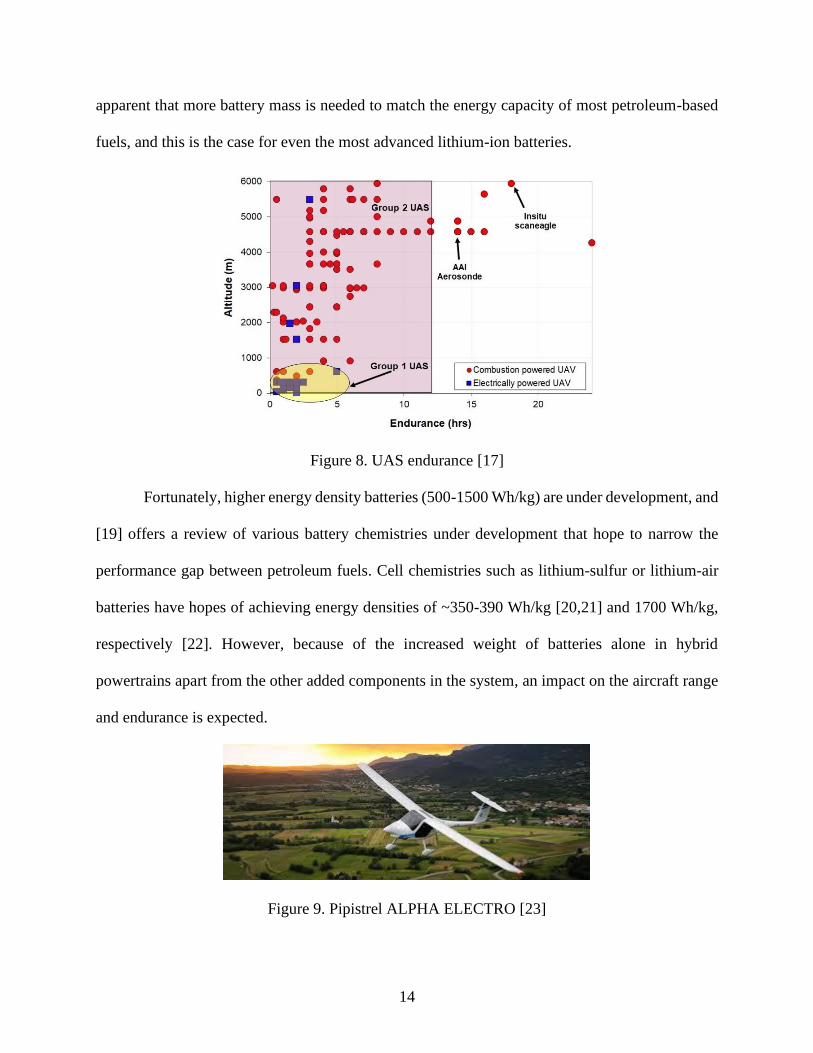
Figure 8. UAS endurance [17]
Fortunately, higher energy density batteries (500-1500 Wh/kg) are under development, and
[19] offers a review of various battery chemistries under development that hope to narrow the
performance gap between petroleum fuels. Cell chemistries such as lithium-sulfur or lithium-air
batteries have hopes of achieving energy densities of ~350-390 Wh/kg [20,21] and 1700 Wh/kg,
respectively [22]. However, because of the increased weight of batteries alone in hybrid
powertrains apart from the other added components in the system, an impact on the aircraft range
and endurance is expected.
Figure 9. Pipistrel ALPHA ELECTRO [23]
15
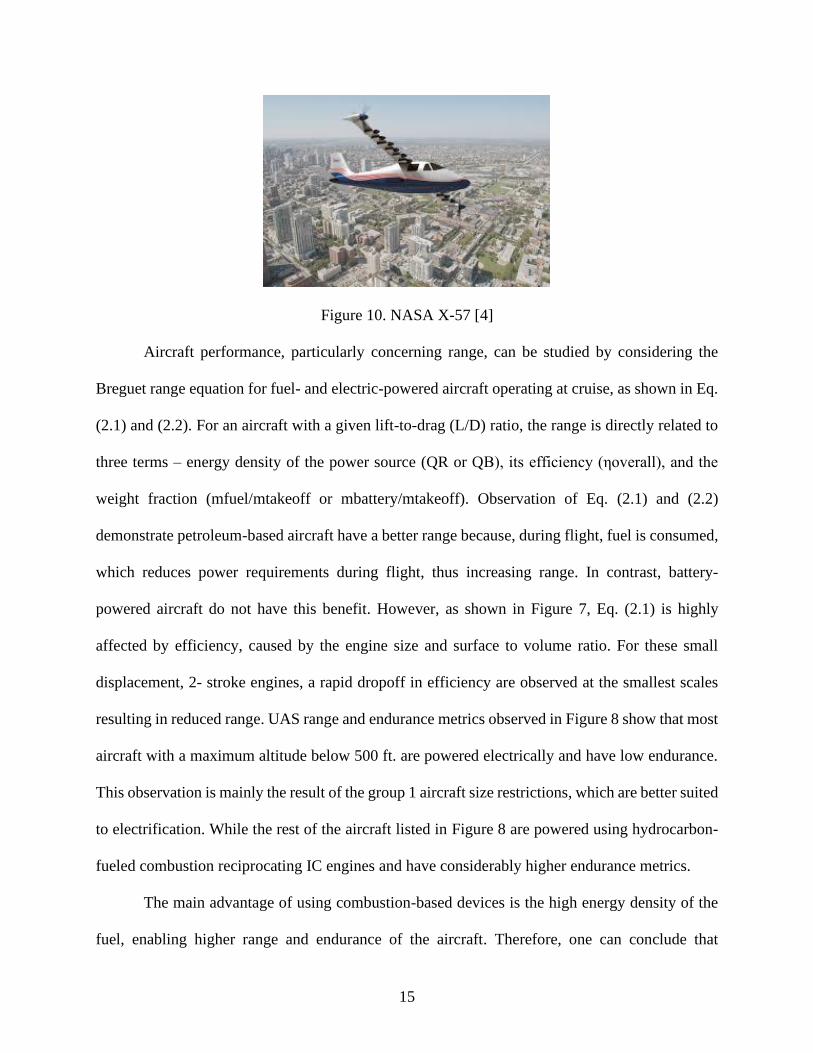
Figure 10. NASA X-57 [4]
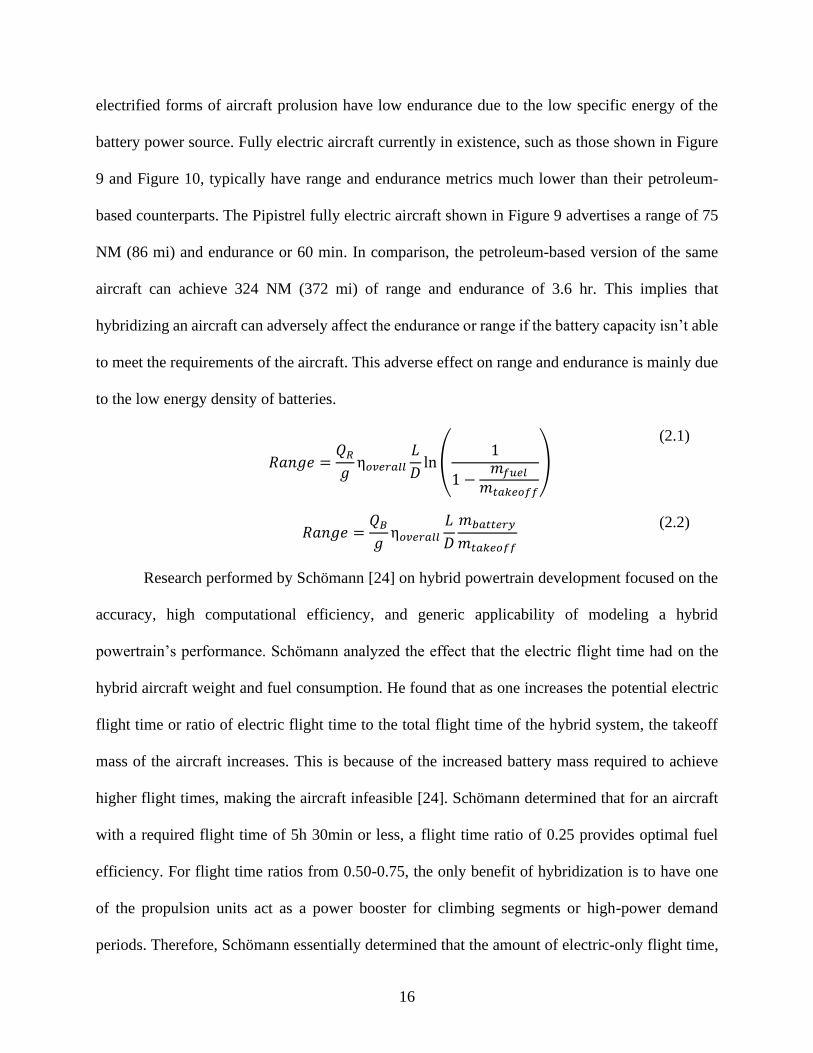
Aircraft performance, particularly concerning range, can be studied by considering the
Breguet range equation for fuel- and electric-powered aircraft operating at cruise, as shown in Eq.
(2.1) and (2.2). For an aircraft with a given lift-to-drag (L/D) ratio, the range is directly related to
three terms – energy density of the power source (QR or QB), its efficiency (ηoverall), and the
weight fraction (mfuel/mtakeoff or mbattery/mtakeoff). Observation of Eq. (2.1) and (2.2)
demonstrate petroleum-based aircraft have a better range because, during flight, fuel is consumed,
which reduces power requirements during flight, thus increasing range. In contrast, battery-
powered aircraft do not have this benefit. However, as shown in Figure 7, Eq. (2.1) is highly
affected by efficiency, caused by the engine size and surface to volume ratio. For these small
displacement, 2- stroke engines, a rapid dropoff in efficiency are observed at the smallest scales
resulting in reduced range. UAS range and endurance metrics observed in Figure 8 show that most
aircraft with a maximum altitude below 500 ft. are powered electrically and have low endurance.
This observation is mainly the result of the group 1 aircraft size restrictions, which are better suited
to electrification. While the rest of the aircraft listed in Figure 8 are powered using hydrocarbon-
fueled combustion reciprocating IC engines and have considerably higher endurance metrics.
The main advantage of using combustion-based devices is the high energy density of the
fuel, enabling higher range and endurance of the aircraft. Therefore, one can conclude that
16
electrified forms of aircraft prolusion have low endurance due to the low specific energy of the
battery power source. Fully electric aircraft currently in existence, such as those shown in Figure
9 and Figure 10, typically have range and endurance metrics much lower than their petroleum-
based counterparts. The Pipistrel fully electric aircraft shown in Figure 9 advertises a range of 75
NM (86 mi) and endurance or 60 min. In comparison, the petroleum-based version of the same
aircraft can achieve 324 NM (372 mi) of range and endurance of 3.6 hr. This implies that
hybridizing an aircraft can adversely affect the endurance or range if the battery capacity isn’t able
to meet the requirements of the aircraft. This adverse effect on range and endurance is mainly due
to the low energy density of batteries.
𝑅𝑎𝑛𝑔𝑒 =𝑄𝑅
𝑔η𝑜𝑣𝑒𝑟𝑎𝑙𝑙
𝐿
𝐷ln (
1
1 −𝑚𝑓𝑢𝑒𝑙
𝑚𝑡𝑎𝑘𝑒𝑜𝑓𝑓
)
(2.1)
𝑅𝑎𝑛𝑔𝑒 =
𝑄𝐵
𝑔η𝑜𝑣𝑒𝑟𝑎𝑙𝑙
𝐿
𝐷
𝑚𝑏𝑎𝑡𝑡𝑒𝑟𝑦
𝑚𝑡𝑎𝑘𝑒𝑜𝑓𝑓
(2.2)
Research performed by Schömann [24] on hybrid powertrain development focused on the
accuracy, high computational efficiency, and generic applicability of modeling a hybrid
powertrain’s performance. Schömann analyzed the effect that the electric flight time had on the
hybrid aircraft weight and fuel consumption. He found that as one increases the potential electric
flight time or ratio of electric flight time to the total flight time of the hybrid system, the takeoff
mass of the aircraft increases. This is because of the increased battery mass required to achieve
higher flight times, making the aircraft infeasible [24]. Schömann determined that for an aircraft
with a required flight time of 5h 30min or less, a flight time ratio of 0.25 provides optimal fuel
efficiency. For flight time ratios from 0.50-0.75, the only benefit of hybridization is to have one
of the propulsion units act as a power booster for climbing segments or high-power demand
periods. Therefore, Schömann essentially determined that the amount of electric-only flight time,
17
which is directly related to the battery capacity or battery mass, can have an adverse effect on the
efficiency of the hybrid powertrain. Meaning that once you add a certain amount of battery mass
such that you design your aircraft to be capable of providing more than 25% of electric-only flight
time, the fuel efficiency gains offered from the hybrid powertrain begin to diminish. These findings
are logical because it outlines the dilemma of hybridizing an aircraft, determining a balanced ratio
between the battery mass and fuel mass which provide the best efficiency and performance.
Moreover, group 2 UAS utilizes small-displacement engines with low thermal efficiencies
of 4-18% and high fuel consumption [25]. Due to this low efficiency, this class of aircraft could
benefit from a hybrid powertrain where propulsive power can be supplemented by electrical
energy. This also shows the importance of battery capacity sizing in terms of system efficiency.
The low efficiency of the IC engines used in this class of aircraft dictates that ample fuel is onboard
the hybrid aircraft. The engine is effective and does not run out of fuel quickly during a mission.
Therefore, the hybrid aircraft must be designed to have the proper battery capacity and fuel to
complete desired missions and be as efficient as possible.
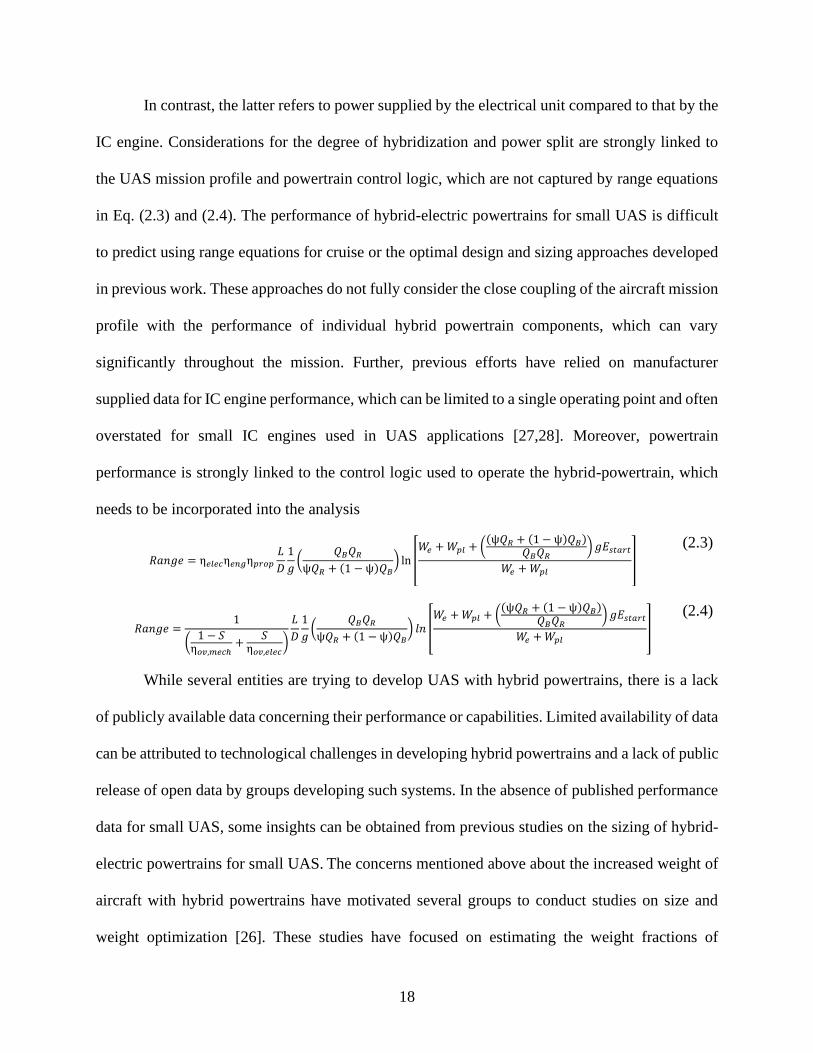
2.3. Challenges and Advantages for Hybridizing Aircraft
Range equations for series and parallel hybrid powertrains presented in Eq. (2.3) and (2.4),
respectively, were adapted from [26]. Slight modifications were made to Eq. (2.3) and (2.4) to
include additional efficiency terms for the IC engine and the electric motor to reflect the total
efficiency of the hybrid powertrain. Also, the lift-drag ratio term was changed to reflect in terms
of the total lift and drag rather than the lift-drag coefficients. These range equations presented some
challenges because they are not as straightforward to analyze since new terms such as the degree
of hybridization (Ψ) and power split (S) are introduced. The former refers to the relative amount
of energy stored in the battery vs. the fuel onboard the hybrid aircraft.
18
In contrast, the latter refers to power supplied by the electrical unit compared to that by the
IC engine. Considerations for the degree of hybridization and power split are strongly linked to
the UAS mission profile and powertrain control logic, which are not captured by range equations
in Eq. (2.3) and (2.4). The performance of hybrid-electric powertrains for small UAS is difficult
to predict using range equations for cruise or the optimal design and sizing approaches developed
in previous work. These approaches do not fully consider the close coupling of the aircraft mission
profile with the performance of individual hybrid powertrain components, which can vary
significantly throughout the mission. Further, previous efforts have relied on manufacturer
supplied data for IC engine performance, which can be limited to a single operating point and often
overstated for small IC engines used in UAS applications [27,28]. Moreover, powertrain
performance is strongly linked to the control logic used to operate the hybrid-powertrain, which
needs to be incorporated into the analysis
While several entities are trying to develop UAS with hybrid powertrains, there is a lack
of publicly available data concerning their performance or capabilities. Limited availability of data
can be attributed to technological challenges in developing hybrid powertrains and a lack of public
release of open data by groups developing such systems. In the absence of published performance
data for small UAS, some insights can be obtained from previous studies on the sizing of hybrid-
electric powertrains for small UAS. The concerns mentioned above about the increased weight of
aircraft with hybrid powertrains have motivated several groups to conduct studies on size and
weight optimization [26]. These studies have focused on estimating the weight fractions of
𝑅𝑎𝑛𝑔𝑒 = η𝑒𝑙𝑒𝑐η𝑒𝑛𝑔η𝑝𝑟𝑜𝑝
𝐿
𝐷
1
𝑔(
𝑄𝐵𝑄𝑅
ψ𝑄𝑅 + (1 − ψ)𝑄𝐵) ln [
𝑊𝑒 + 𝑊𝑝𝑙 + ((ψ𝑄𝑅 + (1 − ψ)𝑄𝐵)
𝑄𝐵𝑄𝑅) 𝑔𝐸𝑠𝑡𝑎𝑟𝑡
𝑊𝑒 + 𝑊𝑝𝑙]
(2.3)
𝑅𝑎𝑛𝑔𝑒 =
1
(1 − 𝑆
η𝑜𝑣,𝑚𝑒𝑐ℎ+
𝑆η𝑜𝑣,𝑒𝑙𝑒𝑐
)
𝐿
𝐷
1
𝑔(
𝑄𝐵𝑄𝑅
ψ𝑄𝑅 + (1 − ψ)𝑄𝐵) 𝑙𝑛 [
𝑊𝑒 + 𝑊𝑝𝑙 + ((ψ𝑄𝑅 + (1 − ψ)𝑄𝐵)
𝑄𝐵𝑄𝑅) 𝑔𝐸𝑠𝑡𝑎𝑟𝑡
𝑊𝑒 + 𝑊𝑝𝑙]
(2.4)

19
different hybrid powertrain configurations for use in a given unmanned aircraft with a fixed
mission profile [29]. The previous studies generally pursued an iterative design approach that
predicted sizes for the engine or the motor without particular regard to practically available
components [30]. Further, the component performance was generally obtained from manufacturer
specifications or scaling arguments.
Sizing is strongly affected by the powertrain mechanical configuration, such as series,
parallel, or power-split. A sizing analysis done in [31] utilized the Breguet range equation for fully
electric and petroleum-based powertrains (Eq. (2.1),(2.2)) described in the previous section to
provide range and endurance estimates for a retrofitted hybrid system. In their work, they
concluded that to have an equal hybrid electric range and endurance performance compared to
fuel-powered powertrains, the battery specific energy of current Li-Po would have to be increased
by 2.4 times the current energy density. Work conducted by Donateo et al. [32] focused on sizing
components such as the battery and electric motor for evaluating the endurance of a parallel hybrid-
electric aircraft. In their work, they discuss the effect of battery sizing and engine operating points
on fuel economy. They found that when batteries are appropriately sized for a 30 min flight time,
a 12% reduction in fuel consumption can be observed over a non-hybrid system. Another sizing
study performed by Hiserote in [33] conducted a conceptual design of three variations of a parallel
hybrid-electric propulsion system for a small UAS. In this study, the hybrid-electric system designs
were optimized and compared to determine the most suitable design for a typical UAS mission.
The work conducted by Hisrote was later continued by Rotmal in [34], where further optimization
for the sizing and optimization of the propeller and motor combination was done. Lastly, others
have employed more sophisticated forms of sizing techniques for hybrid powertrain components
using genetic algorithms in [35] or using a multidisciplinary coupled derivative approach in [36],

20
where more aspects and factors of hybrid powertrain performance and operation are integrated into
the sizing analysis.
The key aspect of these design and sizing studies was to find optimally sized components
for the hybrid-electric powertrain to achieve range/endurance improvements, primarily at cruise
conditions. However, little to no consideration was given to the significant variation in the
performance of individual components and the integrated hybrid powertrain resulting from
changing flight conditions, commonly observed in UAS operation. However, the benefits for
UAVs could offer a substantial number of benefits, especially for drones explicitly designated for
surveillance and reconnaissance. Benefits such as increased range, endurance, and reduced sound
signature can allow for more extended surveillance missions with lesser chances of detection. The
possibility of having a minimal sound signature is further realized when propeller design
optimization is coupled with hybrid powertrain development. Work conducted by [37] focused on
optimizing propeller geometry to reduce the noise production of propellers for small UAVs. The
increased range and endurance aspect for UAVs allows for possibilities to have long continuous
periods of flight. This gives a tactical advantage to operators because of the ability to gain more
information during a mission. For commercial aircraft, a hybrid powertrain could mean a
significant reduction in carbon emission and a reduction in fuel costs. With aircraft accounting for
9% of the total greenhouse gas emission in the transportation sector, according to the EPA, hybrid
propulsion could provide a significant emission reduction. Battery technology advancements are
trending in a direction to achieve higher energy density, thus narrowing the gap between fuels
making hybrid systems more viable. If one also considers future advancements of more efficient
forms of energy harvesting such as solar cells, then fossil fuel emission could reach a near net-zero
level where regional and international travel are all feasible without using fossil fuels. However,

21
until these advancements in battery and solar cell technology come into existence, work needs to
be done to make our current technology and systems more efficient. This leads to the next task,
which is being able to operate aircrafts engines in a very efficient manner or region of operation.
These efforts will increases system efficiency overall; however, this requires significant effort in
powertrain control systems development so that each component of the powertrain can operate
efficiently and achieve the best performance.
2.4. Hybrid Powertrain Control Methods
The main functions of a powertrain control system is to regulate power flow for optimal
performance of each component and the overall system. It also must ensure seamless operation
and communication of all powertrain components to allow for safe operation within defined limits.
When implementing a hybrid system for this class of UAS or any sized aircraft, careful
consideration of the control strategy is necessary. Powertrain performance is strongly linked to the
control logic used to operate the hybrid-powertrain, aiming to increase the overall powertrain
efficiency by minimizing fuel consumption or optimizing power usage.
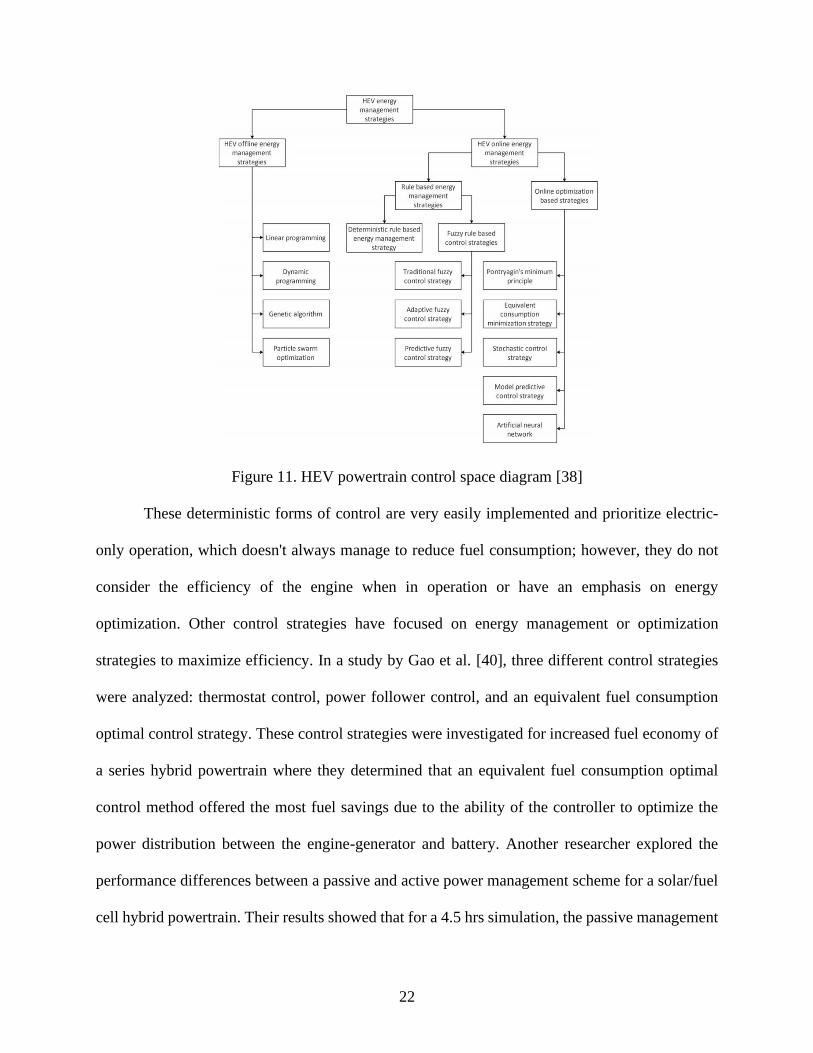
Many control methods have been implemented on hybrid power-trains, as depicted in
Figure 11, all ranging in complexity and form. A review conducted in [38] provides an overview
of various control methods implemented in the automotive industry for hybrid power-trains. Some
control strategies that have been implemented are more deterministic such as in [39]. In these more
deterministic control schemes, functional mapping is used to operate the hybrid powertrain in a
charge sustaining or charge depleting mode where the SOC is maintained at a set level.
22
Figure 11. HEV powertrain control space diagram [38]
These deterministic forms of control are very easily implemented and prioritize electric-
only operation, which doesn't always manage to reduce fuel consumption; however, they do not
consider the efficiency of the engine when in operation or have an emphasis on energy
optimization. Other control strategies have focused on energy management or optimization
strategies to maximize efficiency. In a study by Gao et al. [40], three different control strategies
were analyzed: thermostat control, power follower control, and an equivalent fuel consumption
optimal control strategy. These control strategies were investigated for increased fuel economy of
a series hybrid powertrain where they determined that an equivalent fuel consumption optimal
control method offered the most fuel savings due to the ability of the controller to optimize the
power distribution between the engine-generator and battery. Another researcher explored the
performance differences between a passive and active power management scheme for a solar/fuel
cell hybrid powertrain. Their results showed that for a 4.5 hrs simulation, the passive management

23
strategy operated reasonably well with the solar/fuel cell providing the majority of power with the
battery only functioning as supplemental power during peak power demands. However, the passive
nature of the schemes was not able to reserve power from either power source when solar power
was low or distribute power during times of peak power demand [41]. They also showed that the
active management strategy, which uses a thermostat control approach to distribute power, was
able to maintain a minimum level of SOC for the battery, resulting in efficient power distribution
and greater system safety.
Furthermore, numerous studies have been performed, which focus more on engine fuel
efficiency. One control strategy developed in [42] used an algorithm to minimize fuel consumption
for a series hybrid powertrain. Further research performed by [43–45] employed an Ideal operating
Line (IOL) control approach for a parallel hybrid powertrain configuration. In the IOL scheme, an
engine efficiency map is used to define a line of best efficiency, which traces the operation path
that the engine should follow. The goal of this method is to provide a simple deterministic approach
to operate the engine in an efficient manner that does not rely on non-linear forms of control. The
control methods presented thus far are all considered deterministic and rely on some prior
knowledge of the system, and generally will produce the same output for a given input. In contrast,
non-deterministic forms of control function more in terms of probabilistic outputs where given the
same input, at different points in time, a different output can be produced.
Other non-deterministic forms of control have also been analyzed, which are more
predictive in function and may utilize future information to influence the current output. These
forms of control typically are better suited to optimize the powertrain operation for the best fuel
economy. The optimal strategy present in [46] is an online optimization strategy where better
results were observed over the deterministic forms of control. A cerebellar model arithmetic
24
computer (CMAC) control approach was developed for a parallel hybrid in [47] based on a neural
network. This controller focused on optimizing the engine torque control surface to develop more
efficient battery charge-sustaining or charge- depletion control. This CMAC control was able to
reduce energy usage by 6.5% in comparison to a rule-based controller they also developed.
Another popular control commonly used in hybrid vehicle control is a model predictive controller
(MPC). An MPC controller presented in [48] developed a model predictive control with a torque-
split strategy to reduce fuel consumption for a parallel powertrain configuration. This MPC
strategy was designed to provide better operation during a transient process where it was able to
reduce fuel consumption by approximately 500 g in comparison to a typical PID-based SOC
regulation strategy.
However, developing online optimization control strategies may not be necessary if the
transient operation or the need to find optimality isn't a priority or the predictive ability of MPC’s
and neural networks are not needed. If accurate test data or information is available for modeling
system components such as the engine, then using a deterministic control strategy can be equally
capable of providing efficient engine operation. However, deterministic control methods do have
limitations in the degree of freedom of control, limiting the number of variables that can be
optimized [38]. Fuzzy logic controllers are one deterministic controller that allows for more
degrees of freedom and can allow for a number of variables to affect the control output. A fuzzy
logic control approach proposed in [49] analyzed the ability to reduce fuel consumption for a series
hybrid vehicle where it could effectively regulate the power flow of the powertrain while
maintaining the SOC of the batteries at a high level. Another series hybrid controller based on a
fuzzy logic fixed boundary-layer sliding mode controllers was able to gain a 3.73% increase in
fuel economy over the conventional power follower or thermostat forms of control [50].

25
Chapter 3. Integrated HEUAS Series Powertrain Model
3.1. System Model Description
The model represented in Figure 12 depicts the full system model of the HEUAS, including
the powertrain model, flight dynamics model, powertrain controller, and flight/mission profile
used in the simulation. The model uses a forward-facing approach where information on the flight
profile is passed to the powertrain controller, which produces commands to send to the powertrain
model [51]. The mission profile is in the form of the desired flight speed and altitude profile used
to simulate an operating scenario such as climbing, cruising, or loitering flight. This flight profile
is used as an input for the powertrain controller, which produces commands to send to the
powertrain model.
Figure 12. System model for series hybrid-electric UAS
The series powertrain model then uses those input commands for requested speed, torque,
or throttle and outputs values for the torque or speed response depending on the component model.
Those powertrain outputs are then passed to the aircraft model, which output the vehicle speed,
which is used as one of the feedback signals for the powertrain controller. The controller output
commands are then sent to the powertrain to ensure that the aircraft can maintain the flight profile
while maintaining the desired state of charge (SOC) in the batteries. The dynamic powertrain model
was developed using individual powertrain components, which were combined to create an
integrated model. The development of component models consists of incorporating performance
26
maps of different hardware components and model parameter estimation using component test
data. The model data and parameters were all vital for simulating the performance of the physical
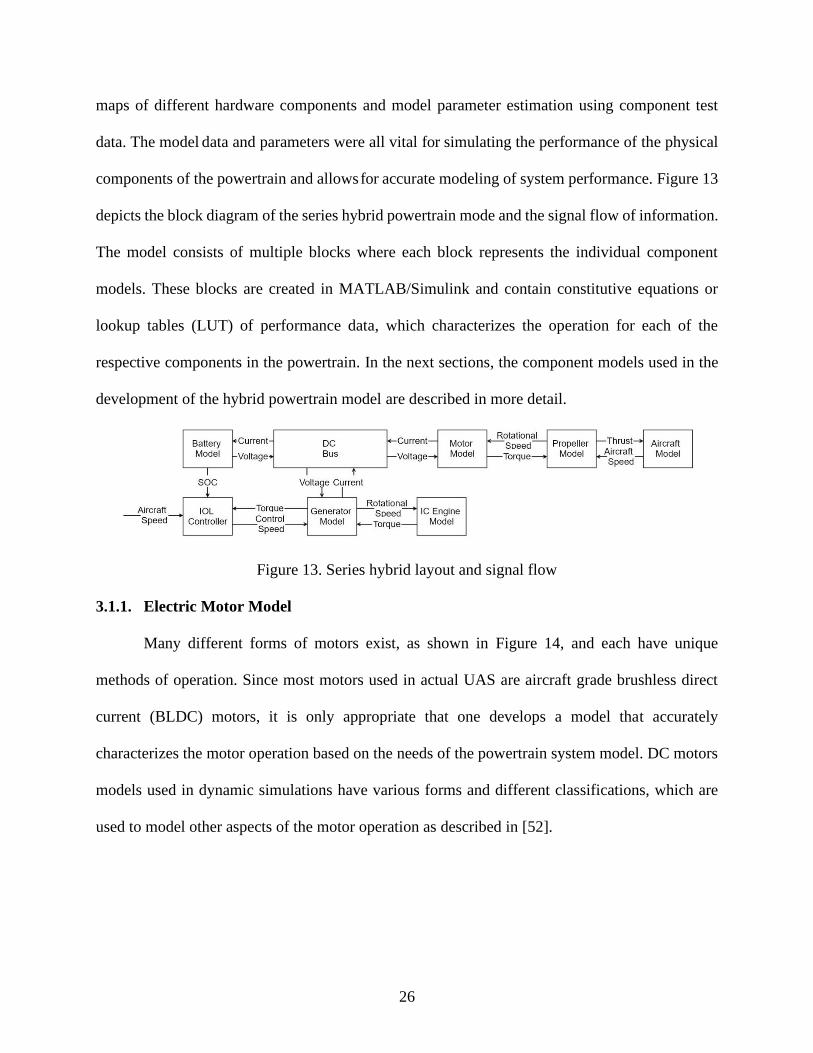
components of the powertrain and allows for accurate modeling of system performance. Figure 13
depicts the block diagram of the series hybrid powertrain mode and the signal flow of information.
The model consists of multiple blocks where each block represents the individual component
models. These blocks are created in MATLAB/Simulink and contain constitutive equations or
lookup tables (LUT) of performance data, which characterizes the operation for each of the
respective components in the powertrain. In the next sections, the component models used in the
development of the hybrid powertrain model are described in more detail.
Figure 13. Series hybrid layout and signal flow
3.1.1. Electric Motor Model
Many different forms of motors exist, as shown in Figure 14, and each have unique
methods of operation. Since most motors used in actual UAS are aircraft grade brushless direct
current (BLDC) motors, it is only appropriate that one develops a model that accurately
characterizes the motor operation based on the needs of the powertrain system model. DC motors
models used in dynamic simulations have various forms and different classifications, which are
used to model other aspects of the motor operation as described in [52].

27
Figure 14. Electric motor Simulink model
The model one chooses to use depends on which elements of the motor’s operation are
desired in the system model. For example, if the powertrain system model requires that one analyze
the power quality of each phase of a 3-phase motor, then one must use a model that can accurately
characterize the phase voltage and current of the motor. Therefore, if one desires to model the
BLDC motor to a high degree of accuracy, then it is necessary to use a mathematical model of a
synchronous machine that models the function of a permanent magnet BLDC motors. However,
this level of model is complex and not always necessary, especially if only a high-level system
model is being developed, such as the one used in this work. Simpler models such as the series dc
machine are much less complex and capture the necessary dynamics of motor operation if the
model is appropriately parametrized.
28
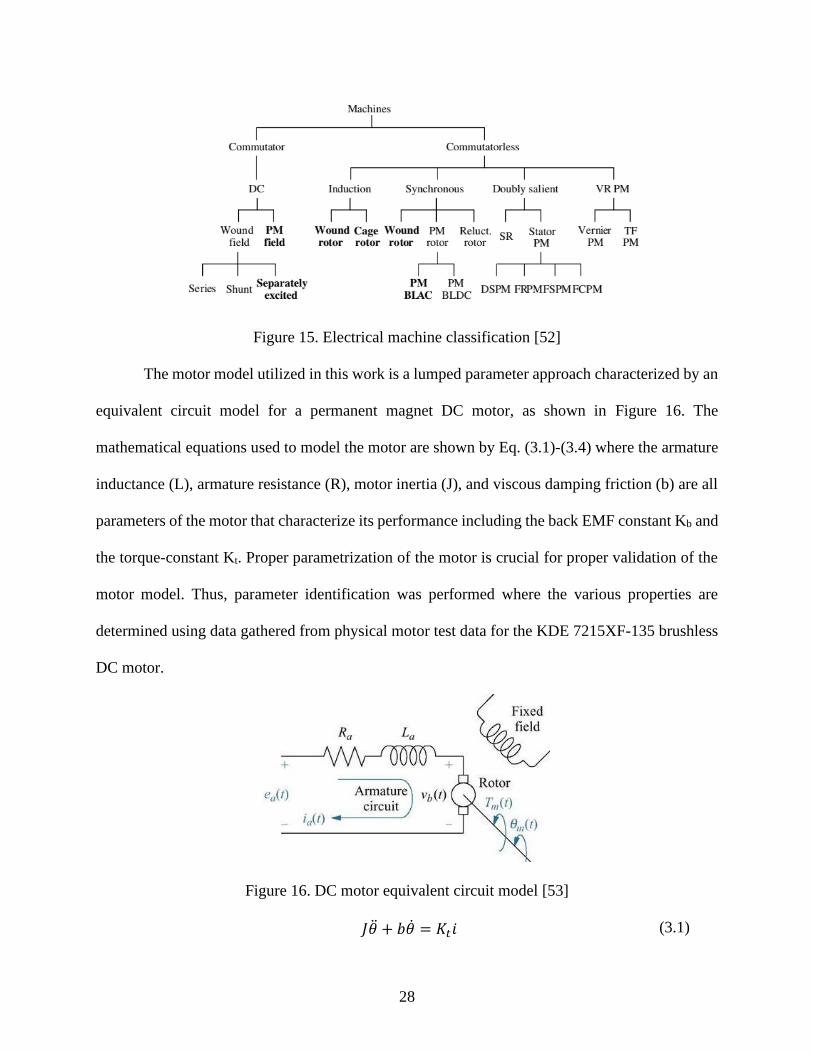
Figure 15. Electrical machine classification [52]
The motor model utilized in this work is a lumped parameter approach characterized by an
equivalent circuit model for a permanent magnet DC motor, as shown in Figure 16. The
mathematical equations used to model the motor are shown by Eq. (3.1)-(3.4) where the armature
inductance (L), armature resistance (R), motor inertia (J), and viscous damping friction (b) are all
parameters of the motor that characterize its performance including the back EMF constant Kb and
the torque-constant Kt. Proper parametrization of the motor is crucial for proper validation of the
motor model. Thus, parameter identification was performed where the various properties are
determined using data gathered from physical motor test data for the KDE 7215XF-135 brushless
DC motor.
Figure 16. DC motor equivalent circuit model [53]
𝐽�̈� + 𝑏�̇� = 𝐾𝑡𝑖 (3.1)

29
𝐿
𝑑𝑖
𝑑𝑡+ 𝑅𝑖 = 𝑉 − 𝐾𝑏�̇�
(3.2)
𝑇 = 𝐾𝑡𝑖 (3.3)
𝑒 = 𝐾𝑏�̇� (3.4)
Thus, data was collected for the KDE motor on speed, current, and voltage data for a
ramped test up to 2100 RPM using an RC Benchmark Series 1580 Thrust Stand and Dynamometer,
which will be discussed in detail later in chapter 6. This data was then used to estimate the model
parameters with Simulink Design Optimization, where the test data was used to tune the model
parameter until the model output matched the test data. Tuning results are shown in Figure 17,
displaying good agreement between model response and measured motor speed and current draw.
(a)
(b)
Figure 17. Motor model response validation
Lastly, the motor model uses a PWM speed controller model, which was created to control
the motors speed. The motor speed controller uses a cascade form of control composed of a motor
speed control outer loop and a motor current control inner loop adapted from [54]. The outer speed
control loop utilizes the speed command produced by the UAS pilot model, which produces an
acceleration command based upon the minimum and maximum motor speed. This motor speed
controller then attempts to reduce the error between the reference motor speed and the actual motor

30
speed feedback from the motor model. The motor speed control loop then creates a current
reference used by the inner current control loop, which controls the motor current production to
the reference value. The motor current controller also creates a reference voltage for use in the
PWM model signal model. The PWM model utilizes the voltage supplied by the battery model
and the reference voltage provided by the inner loop of the motor speed controller to give the
proper PWM pulse to supply the motor model with the appropriate voltage to produce the desired
motor speed.
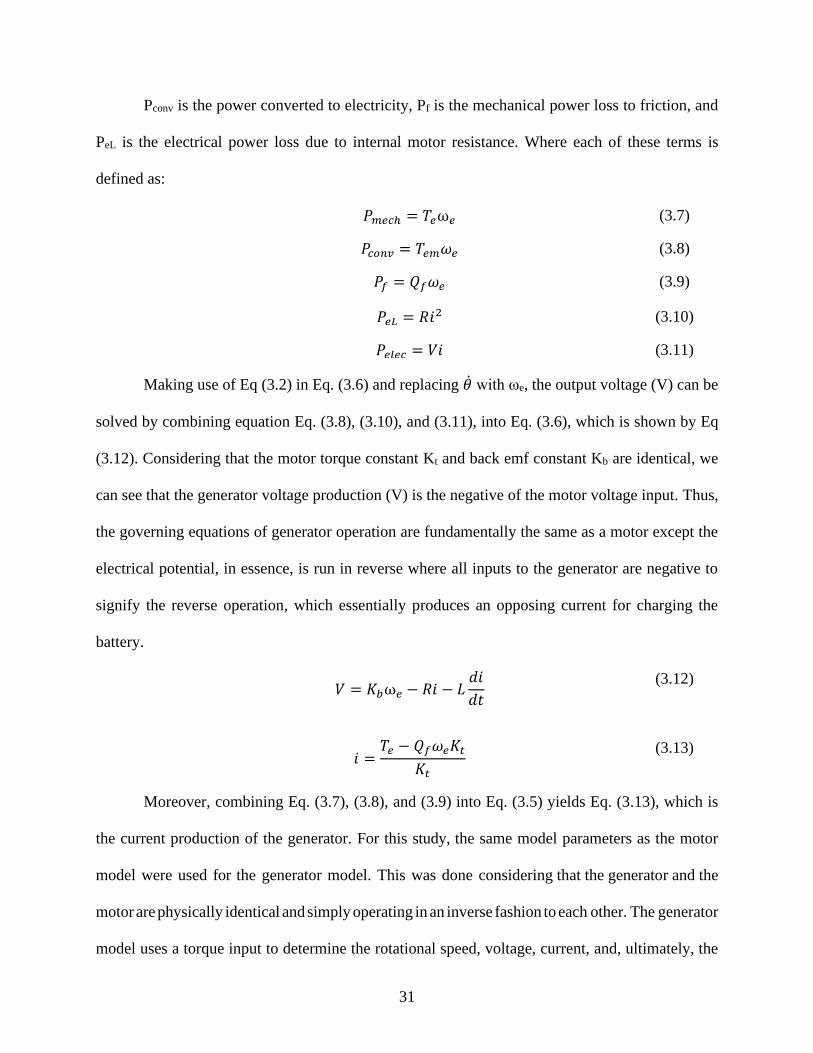
3.1.2. Generator Model
Figure 18. Generator Simulink model
The generator model (Figure 18) is fundamentally the same as the motor model, except the
function is reversed where mechanical power is converted to electrical power as denoted by (3.5)-
(3.6).
𝑃𝑚𝑒𝑐ℎ = 𝑃𝑐𝑜𝑛𝑣 − 𝑃𝑓 (3.5)
𝑃𝑒𝑙𝑒𝑐 = 𝑃𝑐𝑜𝑛𝑣 − 𝑃𝑒𝐿 (3.6)
31
Pconv is the power converted to electricity, Pf is the mechanical power loss to friction, and
PeL is the electrical power loss due to internal motor resistance. Where each of these terms is
defined as:
𝑃𝑚𝑒𝑐ℎ = 𝑇𝑒ω𝑒 (3.7)
𝑃𝑐𝑜𝑛𝑣 = 𝑇𝑒𝑚𝜔𝑒 (3.8)
𝑃𝑓 = 𝑄𝑓𝜔𝑒 (3.9)
𝑃𝑒𝐿 = 𝑅𝑖2 (3.10)
𝑃𝑒𝑙𝑒𝑐 = 𝑉𝑖 (3.11)
Making use of Eq (3.2) in Eq. (3.6) and replacing �̇� with ωe, the output voltage (V) can be
solved by combining equation Eq. (3.8), (3.10), and (3.11), into Eq. (3.6), which is shown by Eq
(3.12). Considering that the motor torque constant Kt and back emf constant Kb are identical, we
can see that the generator voltage production (V) is the negative of the motor voltage input. Thus,
the governing equations of generator operation are fundamentally the same as a motor except the
electrical potential, in essence, is run in reverse where all inputs to the generator are negative to
signify the reverse operation, which essentially produces an opposing current for charging the
battery.
𝑉 = 𝐾𝑏ω𝑒 − 𝑅𝑖 − 𝐿
𝑑𝑖
𝑑𝑡
(3.12)
𝑖 =
𝑇𝑒 − 𝑄𝑓𝜔𝑒𝐾𝑡
𝐾𝑡
(3.13)
Moreover, combining Eq. (3.7), (3.8), and (3.9) into Eq. (3.5) yields Eq. (3.13), which is
the current production of the generator. For this study, the same model parameters as the motor
model were used for the generator model. This was done considering that the generator and the
motor are physically identical and simply operating in an inverse fashion to each other. The generator
model uses a torque input to determine the rotational speed, voltage, current, and, ultimately, the
32
power output of the generator. Voltage and current are supplied to the battery model as inputs for
charging operations.
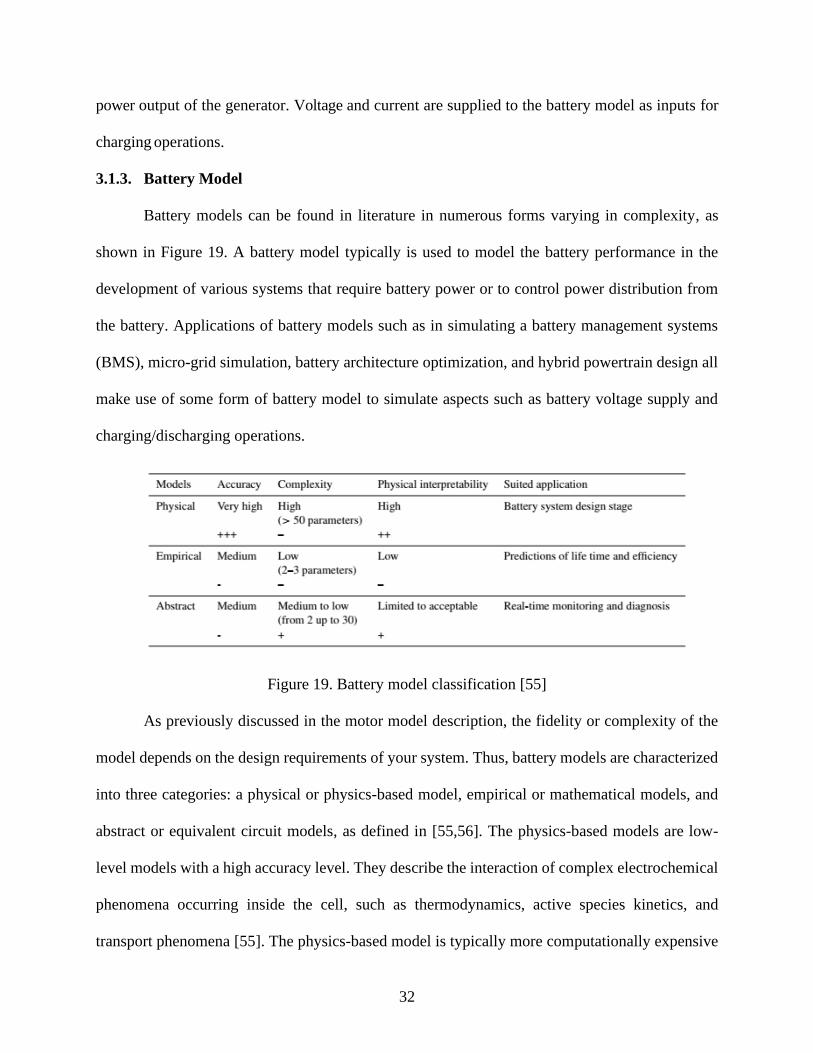
3.1.3. Battery Model
Battery models can be found in literature in numerous forms varying in complexity, as
shown in Figure 19. A battery model typically is used to model the battery performance in the
development of various systems that require battery power or to control power distribution from
the battery. Applications of battery models such as in simulating a battery management systems
(BMS), micro-grid simulation, battery architecture optimization, and hybrid powertrain design all
make use of some form of battery model to simulate aspects such as battery voltage supply and
charging/discharging operations.
Figure 19. Battery model classification [55]
As previously discussed in the motor model description, the fidelity or complexity of the
model depends on the design requirements of your system. Thus, battery models are characterized
into three categories: a physical or physics-based model, empirical or mathematical models, and
abstract or equivalent circuit models, as defined in [55,56]. The physics-based models are low-
level models with a high accuracy level. They describe the interaction of complex electrochemical
phenomena occurring inside the cell, such as thermodynamics, active species kinetics, and
transport phenomena [55]. The physics-based model is typically more computationally expensive

33
because it accurately models the electrochemical dynamics of the system using highly nonlinear
equations [56]. Thus, it is not suited for high-level simulation where speed and accuracy are
desired. The mathematical models can be classified into two different groups, which are analytical
and stochastic models [56]. These models, however, are limited in terms of accuracy if the model
is too simple but can be very accurate if a sufficiently complex model is chosen, unfortunately, at
the cost of computational speed [55]. Finally, the abstract model class, which commonly utilizes
the equivalent circuit model, is prevalent in the modeling community. Different equivalent circuit
forms are possible, therefore providing flexibility in model development to achieve varying levels
of model performance in terms of accuracy and speed. This is possible because circuit-based
models are simple and practical because they allow for the complex electrochemical process to be
replaced by a simple electrical circuit that preserves battery dynamics without degrading accuracy
[55]. These equivalent circuit models do require the use of experimental data to develop lookup
tables; however, the development effort is significantly less than the other two methods described.
For this reason, the equivalent circuit model was used to develop the battery model in this work.
However, the accuracy and speed of the model are dependent on the architecture of the equivalent
circuit model one chooses to model.
𝑉1̇ = −
𝑉1
𝑅1𝐶1−
1
𝐶1
(3.14)
𝑉2̇ = −
𝑉2
𝑅2𝐶2−
1
𝐶2
(3.15)
𝑆𝑂𝐶 = 𝑆𝑂𝐶0 + ∫
−𝐼
𝑄𝑐
(3.16)
𝑉𝑡 = 𝑂𝐶𝑉 + 𝑉1 + 𝑉2 − 𝐼𝑅𝑜 (3.17)

34
Figure 20. Equivalent circuit model diagram [57]
Within the equivalent circuit category of battery models, multiple forms of models exist,
as defined in [58,59]; however, each model uses a form of a resistor or a capacitor to describe the
dynamic behavior of the battery cell. The most common circuit mode is a resistor-capacitor
network (RC), where a resistor and capacitor are connected in a way that describes the battery
response curve. The order or the number of RC pairs can be manipulated in a way where the model
accuracy can be very acceptable. The method used in this work utilized a second-order RC (2 RC)
model shown in Figure 20, where two parallel RC networks are connected in series with a resistor
to characterize the battery response better. Moreover, the findings of [57] show that the 2 RC
model can better represent the battery response when compared to first-order models (1 RC), where
the 1 RC model produced residuals up to 4.5 mV.
In comparison, the 2 RC model achieved residuals of 2.0 mV. The 2 RC model, as shown
in [60], is just as accurate as higher 3 or 4 RC models, with the second-order model achieving
approximately 1-2.5 mV at a SOC of 60%. In contrast, the higher-order models achieve 1 mV or
less depending on the number of time constants or RC pairs. Thus, the 2 RC pair model was chosen
because it offers acceptable accuracy in replicating the battery response, and simulation speed is
reasonable because the model parameters are far less than those of higher-order models. The
reduced number of parameters offered by the 2 RC model is essential because, as discussed later

35
in this section, these parameters will be populated into a lookup table (LUT), which can cause
considerable increases in simulation time if populated with too many variables or too many LUTs
are used in general. Moreover, the use of the 2 RC model simplifies the parametrization process,
which is discussed later in this section. It also reduces the number of parameters that need to be
optimized to provide model accuracy and stability.
𝑉(𝑡) = 𝐼𝑅1 (1 − 𝑒
−𝑡𝑟𝜏1) + 𝐼𝑅2 (1 − 𝑒
−𝑡𝑝
𝜏2) (1 − 𝑒−
𝑡𝑟𝜏2)
(3.18)
min(𝑅1,𝑅2,𝜏1,𝜏2)
𝑓(𝑅1, 𝑅2, 𝜏1, 𝜏2) = ∑ (𝑉𝑖(𝑡) − {(𝑉}𝑑𝑎𝑡𝑎)𝑖)2
𝑁
𝑖=0
(3.19)
𝑅𝑜 =
△ 𝑂𝐶𝑉
𝐼
(3.20)
Figure 21. Battery Simulink model
The battery model (Figure 21) uses an input of current (as requested by the propulsion motor
and generated by the generator model) and outputs battery voltage and the corresponding SOC. This
model was developed using charge and discharge voltage and current data (Figure 22) for a Sony
VTC6 18650 lithium-ion cell with a nominal voltage of 3.6 V and a maximum capacity of 3 Ah.

36
The battery data contained charge and discharge rate for 0.5 C, 1 C, and 2 C and was provided by
researchers at the Air Force Research laboratory (AFRL). The model is characterized by Eq. (3.14)-
(3.17), representing the mathematical model for a 2 RC pair equivalent circuit model.
Figure 22. Sony VTC6 charge/discharge data
Figure 23. Battery response curve
Model parameters were calculated using Eq. (3.18), which was adapted from [61] and is
an approximate curve fit that represents the transient discharge or charge curves of a Li-Ion battery,
as shown in Figure 23. This equation is composed of 6 parameters that must be defined, which are
R1, R2, tr, tp,τ1, and τ2 where R1 and R2 are the resistance of the first and second RC pair,

37
respectively; tr and tp are the duration of the pulse and relaxation transient duration time; and τ1
and τ2 are the time constants for the pulse and relaxation transient phase, respectively. These
parameters define the shape of the transient response curve and must be optimized to provide the
proper fit for the test data. Thus, an offline optimization routine was developed to loop through the
discharge and charge curves shown in Figure 22, which each correspond to a different SOC. The
optimization routine created in MATLAB utilized the least-squares method (Eq. (3.18)). The
optimization parameters R1, R2, τ1, and τ2, were optimized to best fit the test data for the relaxation
curve or Long RC time constant transient of the battery. This optimization was then repeated for
each SOC curve and each C rate data set where a LUT of the model parameter R1, R2, C1, and C2
was then created, which was adapted from [62].
Figure 24. Battery model response 1C discharge cycle
Figure 25. Battery model response random charge/discharge profile

38
The optimization process requires initial guesses for R1, R2, tr, tp, τ1, and τ2 values, which
can affect the results of the optimization. This means that the accuracy of the model parameters is
very sensitive to these six parameters in Eq. (3.18). In a study on the global sensitivity of 2 RC
equivalent circuit model parameters [63], the sensitivity analysis demonstrated that the output of
the second-order RC model is most sensitive to the series resistance Rs in the model (Figure 20)
and the τ2 term in Eq. (3.18).
Figure 26. Battery model parameters for
charging data
Figure 27. Battery model parameters for
discharge data

39
Thus, the other terms in the Eq. (3.18) can be set as constants once suitable values are
determined. The optimization now relies only on varying the Rs and τ2 until optimal results are
achieved. However, the Rs values are directly determined from the response curve, as shown in
(Figure 23). The Rs values have less uncertainty than the τ2 value and, as a result, were not varied
in this analysis. Since the optimization is highly sensitive to the initial guess of the τ2 variable, the
routine could easily converge to a local minimum where sub-optimal solutions exist rather than a
global minimum. Therefore, the optimization was repeated, and then τ2 was tuned until model
parameters were found that provided good agreement of the battery model with the battery test
data. The model parameters calculated by the optimization for both the charge and discharge data
are shown in Figure 26 ─ Figure 29 for the RC pair parameters, OCV, and series resistance values.
The results of Figure 24 and Figure 25 shows the model response compared to the actual battery
discharge/charge data for a 1C discharge cycle as well as a random charge/discharge profile.
Figure 28. Battery model voltage parameters
Figure 29. Battery model series resistance
parameters
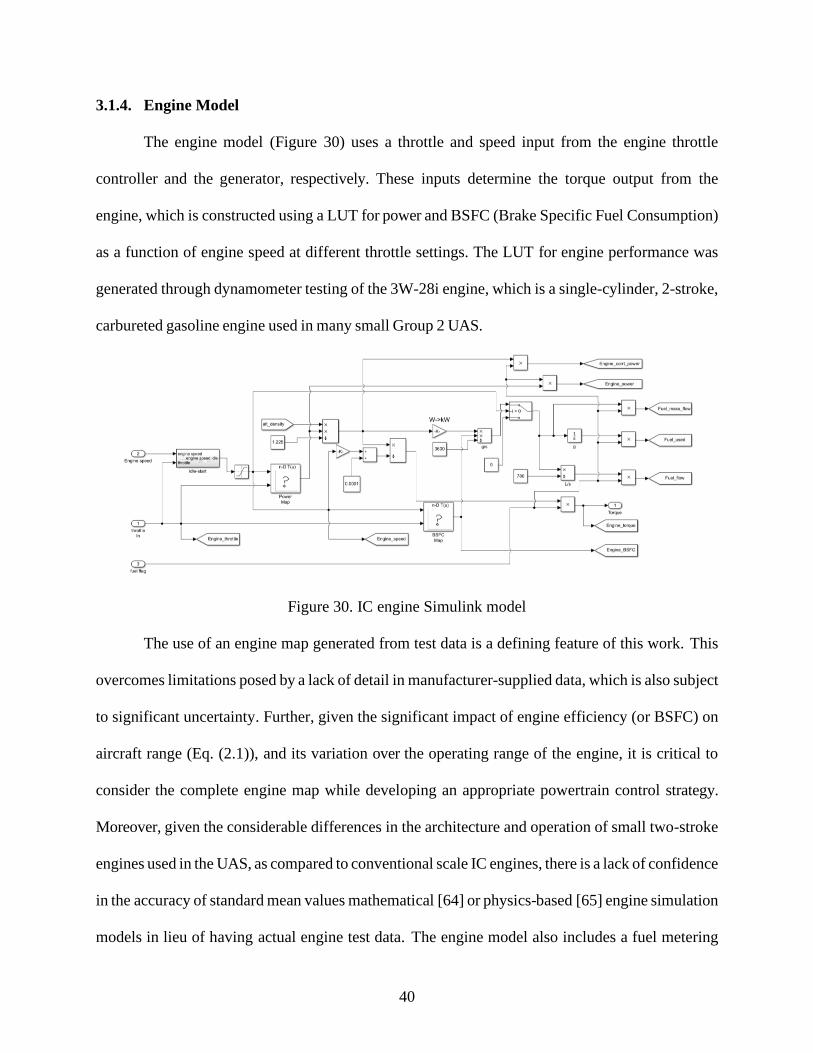
40
3.1.4. Engine Model
The engine model (Figure 30) uses a throttle and speed input from the engine throttle
controller and the generator, respectively. These inputs determine the torque output from the
engine, which is constructed using a LUT for power and BSFC (Brake Specific Fuel Consumption)
as a function of engine speed at different throttle settings. The LUT for engine performance was
generated through dynamometer testing of the 3W-28i engine, which is a single-cylinder, 2-stroke,
carbureted gasoline engine used in many small Group 2 UAS.
Figure 30. IC engine Simulink model
The use of an engine map generated from test data is a defining feature of this work. This
overcomes limitations posed by a lack of detail in manufacturer-supplied data, which is also subject
to significant uncertainty. Further, given the significant impact of engine efficiency (or BSFC) on
aircraft range (Eq. (2.1)), and its variation over the operating range of the engine, it is critical to
consider the complete engine map while developing an appropriate powertrain control strategy.
Moreover, given the considerable differences in the architecture and operation of small two-stroke
engines used in the UAS, as compared to conventional scale IC engines, there is a lack of confidence
in the accuracy of standard mean values mathematical [64] or physics-based [65] engine simulation
models in lieu of having actual engine test data. The engine model also includes a fuel metering

41
aspect or “fuel tank,” which is depleted during the mission, with the torque output forced to be zero
when the fuel tank is detected to be empty. The model includes a power correction factor based on
altitude air density provided by the mission profile block shown in Figure 30, which scales the
power output using the ratio of air density at altitude to the sea level air density. The power
correction factor is used to simulate the engine power reduction observed when combustion
engines operate at altitudes with lower air density.
Figure 31. 3w-28i Performance Data
3.1.5. UAS Aircraft Model
The aircraft dynamics model (Figure 32) used in this analysis is a simple point mass
approximation (Figure 33) that analyzes the sum of the forces acting on the aircraft. The model
uses the thrust input from the propeller model to calculate the airspeed of the aircraft. Eq. (3.21)
— (3.25) describe the vertical and horizontal forces on the aircraft used in the model.

42
Figure 32. UAS aircraft Simulink model
The model calculates the aircraft speed based on the thrust input. It then uses the speed and
altitude information from the flight profile to calculate the flight angle. The flight angle allows for
calculating the coefficient of lift, which is then used to determine the coefficient of drag using a
LUT for the lift-drag polar. The model in this simulation uses an aircraft weight of 18 kg, which
is equivalent to a group 2 UAS aircraft, and the data for the lift-drag polar (Figure 34) for the AAI
Aerosonde UAV. The parameters used in Table 2 were also used in the model to define geometric
parameters such as wing area to facilitate lift and drag calculations.
Table 2. AAI Aerosonde parameters
CD0 CLmin Oswald coefficient Wingspan Wing area
0.0434 0.23 0.75 2.89 0.55

43
Figure 33. Aircraft point mass model [66]
Figure 34. Aircraft model lift/drag
polar
𝑇𝑠𝑖𝑛𝜃 − 𝐷𝑠𝑖𝑛𝜃 + 𝐿𝑐𝑜𝑠𝜃 − 𝑊 = 𝑚
𝑑𝑉𝑣
𝑑𝑡
(3.21)
𝑇𝑐𝑜𝑠𝜃 − 𝐷𝑐𝑜𝑠𝜃 − 𝐿𝑠𝑖𝑛𝜃 = 𝑚
𝑑𝑉ℎ
𝑑𝑡
(3.22)
𝐶𝑙 =
𝐿
12 𝜌𝑆𝑤𝑉2
(3.23)
𝐶𝑑 =
𝐷
12 𝜌𝑆𝑤𝑉2
(3.24)
ℎ̇ = 𝑉𝑠𝑖𝑛𝜃 (3.25)
3.1.6. Propeller Model
The propeller model (Figure 35) uses inputs of motor speed and aircraft speed to calculate
the advance ratio J of the propeller (Eq. (3.26)), which is then used as input to a lookup table for
thrust and power coefficients. The data for thrust and power coefficients were obtained from the
APC propeller database for a 20x10 propeller [67].

44
Figure 35. Propeller Simulink model
These coefficients are then used in Eq. (3.27) — (3.30) to calculate the thrust, power, and
torque that the propeller requires for a given flight speed and torque input from the propulsive
motor. The output of the model is thrust, which is used later in the aircraft dynamics model to
determine the aircraft speed.
𝐽 =
𝑉
𝑛𝐷
(3.26)
𝐶𝑄 =
𝐶𝑝
2𝜋
(3.27)
𝐶𝑇 =
𝑇
𝜌𝑛2𝐷4
(3.28)
𝐶𝑃 =
𝑃
𝜌𝑛3𝐷5
(3.29)
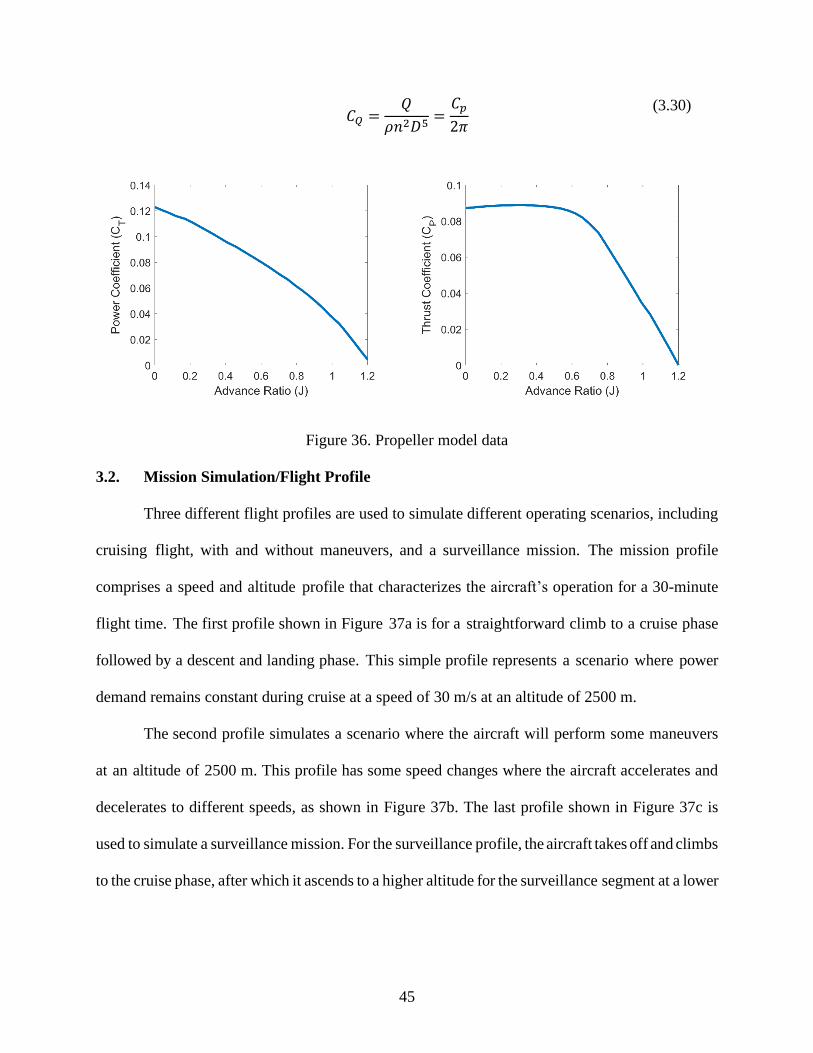
45
𝐶𝑄 =
𝑄
𝜌𝑛2𝐷5=
𝐶𝑝
2𝜋
(3.30)
Figure 36. Propeller model data
3.2. Mission Simulation/Flight Profile
Three different flight profiles are used to simulate different operating scenarios, including
cruising flight, with and without maneuvers, and a surveillance mission. The mission profile
comprises a speed and altitude profile that characterizes the aircraft’s operation for a 30-minute
flight time. The first profile shown in Figure 37a is for a straightforward climb to a cruise phase
followed by a descent and landing phase. This simple profile represents a scenario where power
demand remains constant during cruise at a speed of 30 m/s at an altitude of 2500 m.
The second profile simulates a scenario where the aircraft will perform some maneuvers
at an altitude of 2500 m. This profile has some speed changes where the aircraft accelerates and
decelerates to different speeds, as shown in Figure 37b. The last profile shown in Figure 37c is
used to simulate a surveillance mission. For the surveillance profile, the aircraft takes off and climbs
to the cruise phase, after which it ascends to a higher altitude for the surveillance segment at a lower
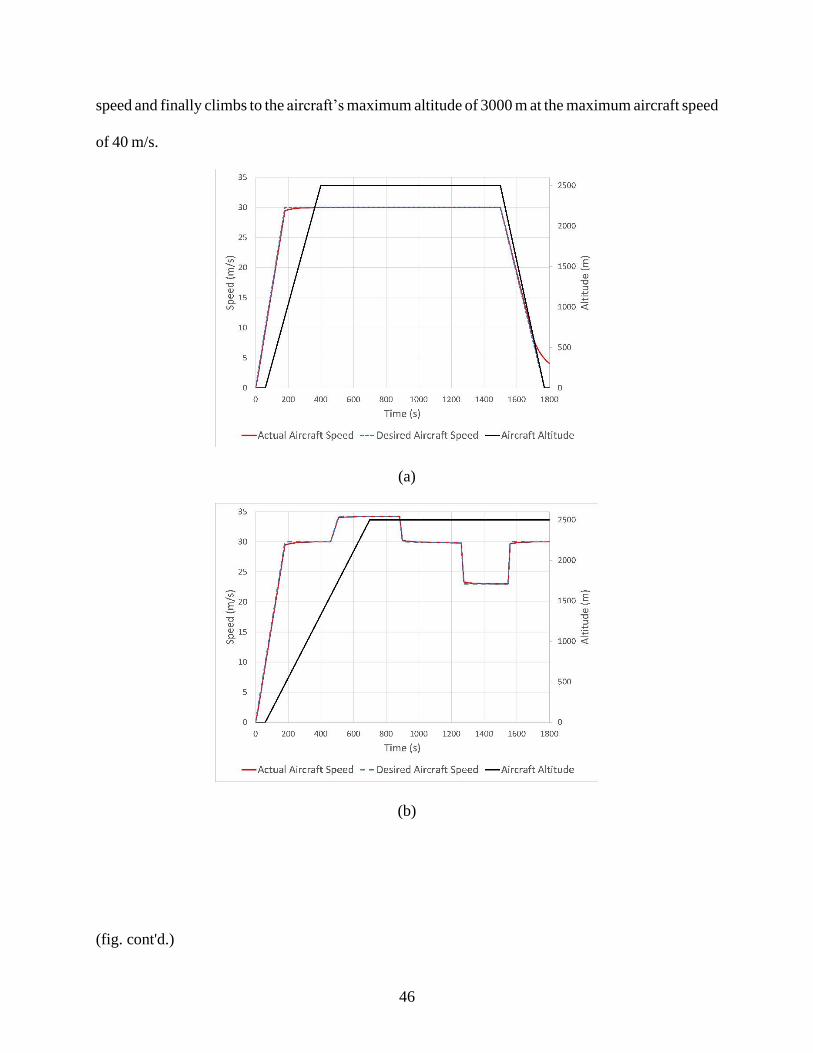
46
speed and finally climbs to the aircraft’s maximum altitude of 3000 m at the maximum aircraft speed
of 40 m/s.
(a)
(b)
(fig. cont'd.)
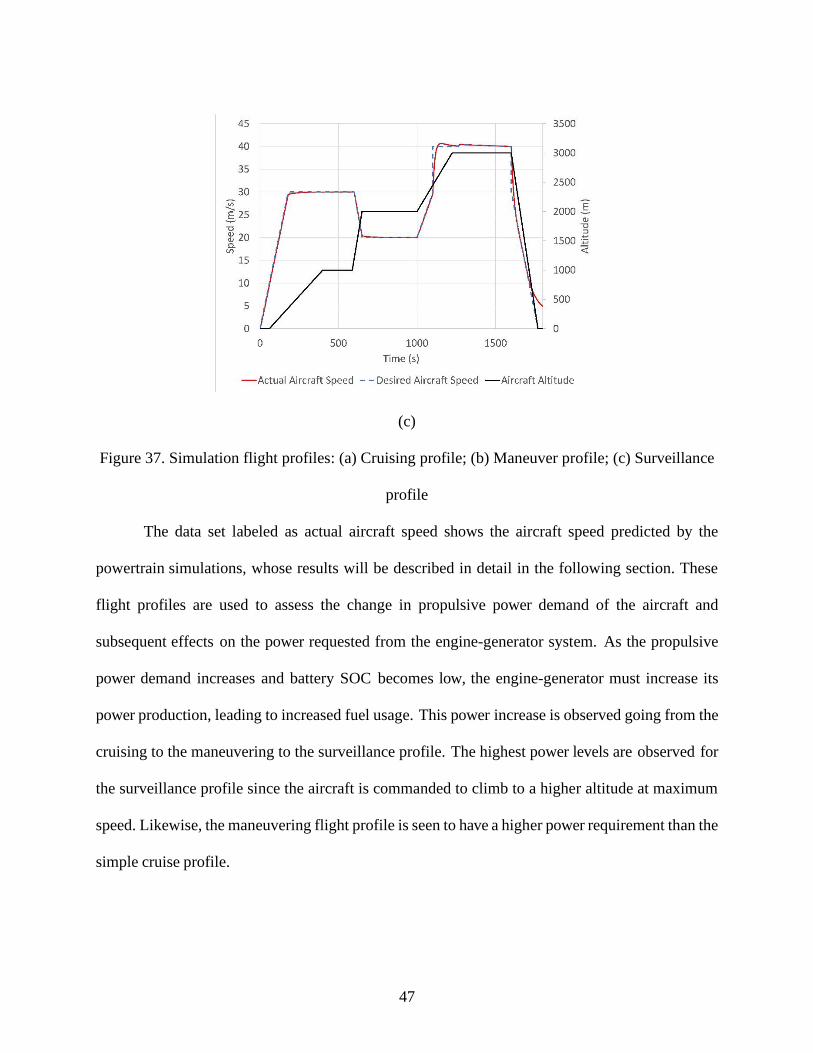
47
(c)
Figure 37. Simulation flight profiles: (a) Cruising profile; (b) Maneuver profile; (c) Surveillance
profile
The data set labeled as actual aircraft speed shows the aircraft speed predicted by the
powertrain simulations, whose results will be described in detail in the following section. These
flight profiles are used to assess the change in propulsive power demand of the aircraft and
subsequent effects on the power requested from the engine-generator system. As the propulsive
power demand increases and battery SOC becomes low, the engine-generator must increase its
power production, leading to increased fuel usage. This power increase is observed going from the
cruising to the maneuvering to the surveillance profile. The highest power levels are observed for
the surveillance profile since the aircraft is commanded to climb to a higher altitude at maximum
speed. Likewise, the maneuvering flight profile is seen to have a higher power requirement than the
simple cruise profile.

48
Chapter 4. Series HEUAS Control Methods
4.1. Baseline Control
The control logic is a key component of the HEUAS powertrain, whose goal is to supply
the required propulsive power during the mission profile for the UAS. Thus the function is to
provide electrical power to maintain the desired battery SOC while minimizing fuel usage to
maximize aircraft range and endurance. Three different control strategies are employed in this
work to analyze the effect on the fuel consumption of the hybrid powertrain.
Figure 38. Charge enable control logic
The first control scheme was a baseline power follower form of control adapted from [46],
which controlled the charging operation by maintaining the battery SOC within a 75-95% range
based upon the power requested for system operation and charging shown in Figure 38. Since the
power requested from the IC engine and generator can vary during flight, the power requirements
can change depending on the flight profile. The SOC range chosen in this scheme corresponds to
the range with the lowest ohmic resistance for the battery, which corresponds to the most efficient

49
range of operation of the battery. This control method served as a baseline because it is the simplest
method of control and because it is the least efficient method of controlling the ICE during
charging because the engine can possibly operate in an inefficient region while attempting to
maintain the battery SOC, thus increasing fuel consumption. This control scheme functions by
controlling the engine throttle to maintain the generator power output to provide sufficient
propulsive power for flight and excess power to charge the battery when its SOC falls below the
set threshold. Excess power corresponds to the power required to charge the battery at a 1C rate,
where the SOC is maintained within previously mentioned set bounds.
4.2. IOL Control
The Ideal Operation Line (IOL) control strategy, also known as the Optimal Operation Line
(OOL) approach, for the series hybrid system is depicted in Figure 39 and forms the second control
strategy used in this work. This control strategy prioritizes minimum fuel consumption from the
engine through a pre-determined operating line adapted from [68]. The IOL strategy functions by
tracking the minimum BSFC operation line shown in Figure 40. This line is obtained by finding
the maximum torque at the minimum BSFC on different constant power lines for steady-state
conditions. This method enables the engine to operate in its optimal efficiency region of maximum
torque at the lowest BSFC, thus minimizing fuel usage.
Figure 39. IOL control scheme
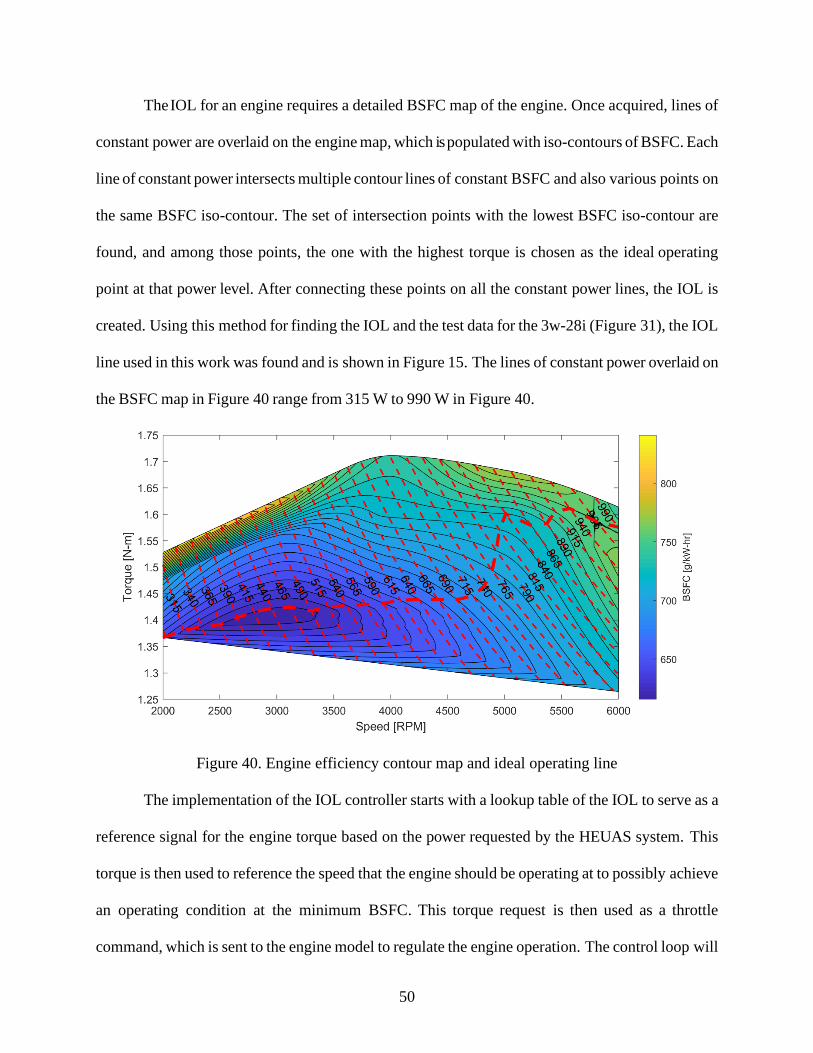
50
The IOL for an engine requires a detailed BSFC map of the engine. Once acquired, lines of
constant power are overlaid on the engine map, which is populated with iso-contours of BSFC. Each
line of constant power intersects multiple contour lines of constant BSFC and also various points on
the same BSFC iso-contour. The set of intersection points with the lowest BSFC iso-contour are
found, and among those points, the one with the highest torque is chosen as the ideal operating
point at that power level. After connecting these points on all the constant power lines, the IOL is
created. Using this method for finding the IOL and the test data for the 3w-28i (Figure 31), the IOL
line used in this work was found and is shown in Figure 15. The lines of constant power overlaid on
the BSFC map in Figure 40 range from 315 W to 990 W in Figure 40.
Figure 40. Engine efficiency contour map and ideal operating line
The implementation of the IOL controller starts with a lookup table of the IOL to serve as a
reference signal for the engine torque based on the power requested by the HEUAS system. This
torque is then used to reference the speed that the engine should be operating at to possibly achieve
an operating condition at the minimum BSFC. This torque request is then used as a throttle
command, which is sent to the engine model to regulate the engine operation. The control loop will
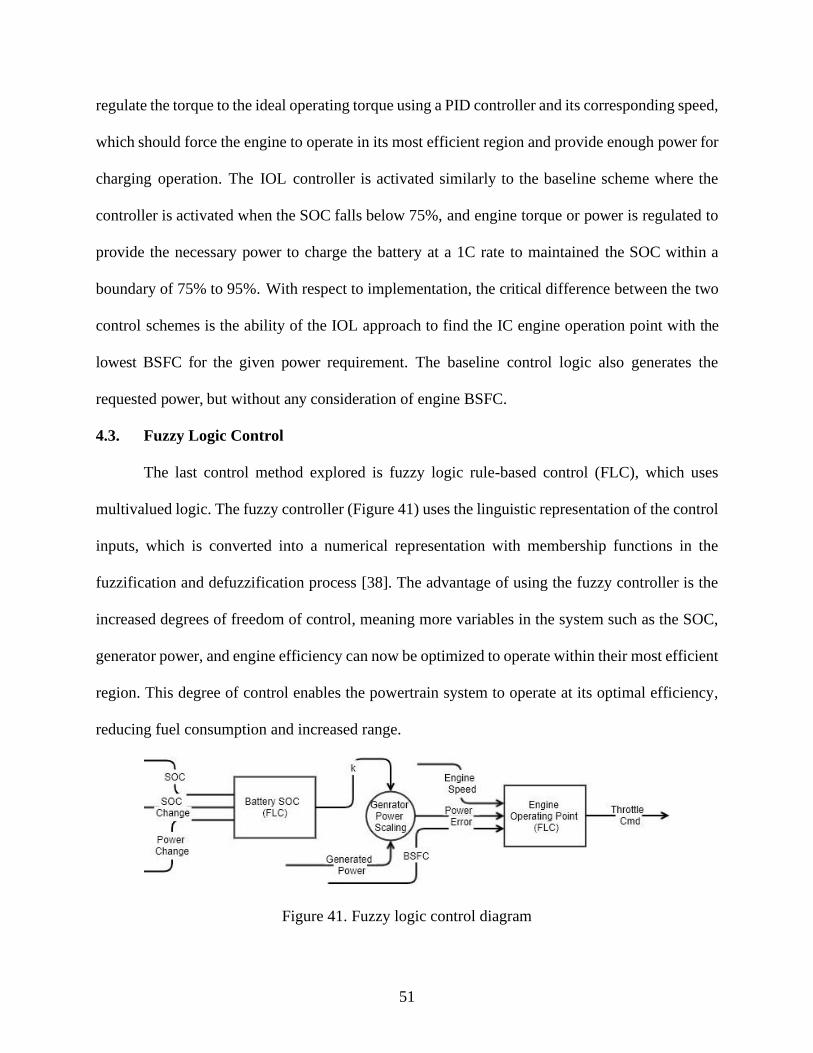
51
regulate the torque to the ideal operating torque using a PID controller and its corresponding speed,
which should force the engine to operate in its most efficient region and provide enough power for
charging operation. The IOL controller is activated similarly to the baseline scheme where the
controller is activated when the SOC falls below 75%, and engine torque or power is regulated to
provide the necessary power to charge the battery at a 1C rate to maintained the SOC within a
boundary of 75% to 95%. With respect to implementation, the critical difference between the two
control schemes is the ability of the IOL approach to find the IC engine operation point with the
lowest BSFC for the given power requirement. The baseline control logic also generates the
requested power, but without any consideration of engine BSFC.
4.3. Fuzzy Logic Control
The last control method explored is fuzzy logic rule-based control (FLC), which uses
multivalued logic. The fuzzy controller (Figure 41) uses the linguistic representation of the control
inputs, which is converted into a numerical representation with membership functions in the
fuzzification and defuzzification process [38]. The advantage of using the fuzzy controller is the
increased degrees of freedom of control, meaning more variables in the system such as the SOC,
generator power, and engine efficiency can now be optimized to operate within their most efficient
region. This degree of control enables the powertrain system to operate at its optimal efficiency,
reducing fuel consumption and increased range.
Figure 41. Fuzzy logic control diagram
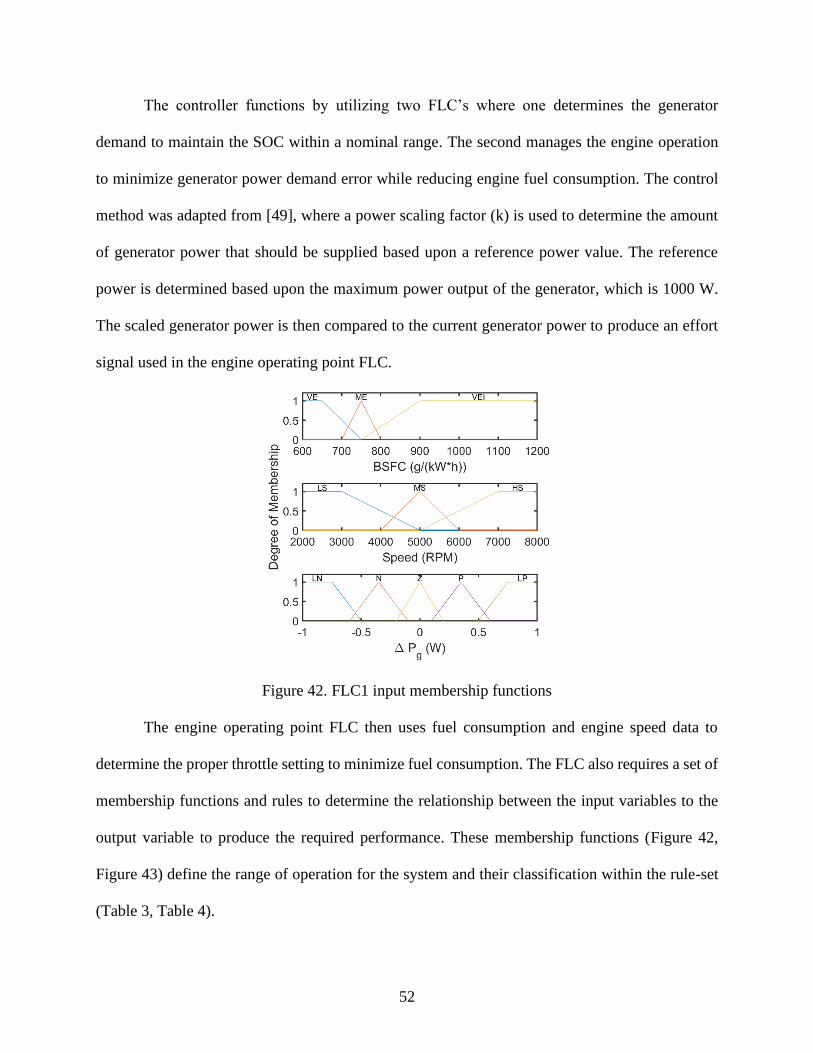
52
The controller functions by utilizing two FLC’s where one determines the generator
demand to maintain the SOC within a nominal range. The second manages the engine operation
to minimize generator power demand error while reducing engine fuel consumption. The control
method was adapted from [49], where a power scaling factor (k) is used to determine the amount
of generator power that should be supplied based upon a reference power value. The reference
power is determined based upon the maximum power output of the generator, which is 1000 W.
The scaled generator power is then compared to the current generator power to produce an effort
signal used in the engine operating point FLC.
Figure 42. FLC1 input membership functions
The engine operating point FLC then uses fuel consumption and engine speed data to
determine the proper throttle setting to minimize fuel consumption. The FLC also requires a set of
membership functions and rules to determine the relationship between the input variables to the
output variable to produce the required performance. These membership functions (Figure 42,
Figure 43) define the range of operation for the system and their classification within the rule-set
(Table 3, Table 4).
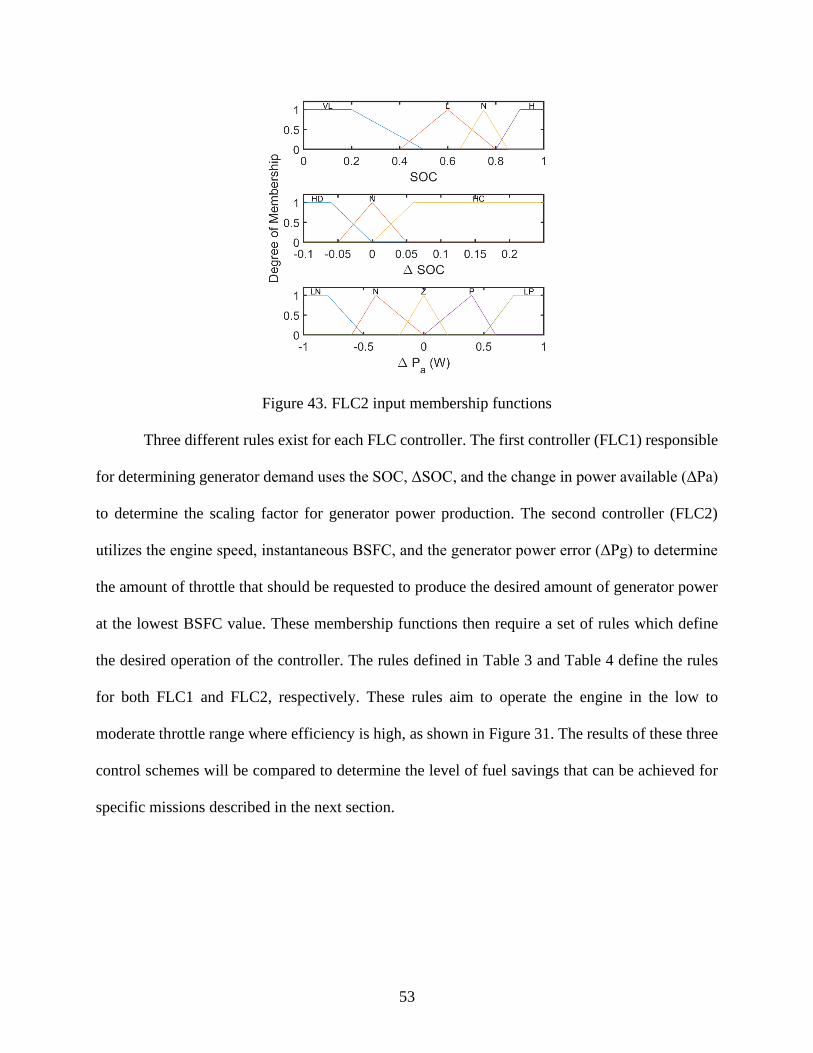
53
Figure 43. FLC2 input membership functions
Three different rules exist for each FLC controller. The first controller (FLC1) responsible
for determining generator demand uses the SOC, ΔSOC, and the change in power available (ΔPa)
to determine the scaling factor for generator power production. The second controller (FLC2)
utilizes the engine speed, instantaneous BSFC, and the generator power error (ΔPg) to determine
the amount of throttle that should be requested to produce the desired amount of generator power
at the lowest BSFC value. These membership functions then require a set of rules which define
the desired operation of the controller. The rules defined in Table 3 and Table 4 define the rules
for both FLC1 and FLC2, respectively. These rules aim to operate the engine in the low to
moderate throttle range where efficiency is high, as shown in Figure 31. The results of these three
control schemes will be compared to determine the level of fuel savings that can be achieved for
specific missions described in the next section.

54
Figure 44. Output membership functions
Table 3. Rule set for FLC1
Very low SOC
(∆SOC)/(∆Pa) LP P Z N LN
HD SP SP MP LP LP
N SP SP SP LP LP
HC SP SP SP LP LP
Low SOC
(∆SOC)/(∆Pa) LP P Z N LN
HD SP SP SP SP MP
N SP SP SP SP MP
HC SP SP SP SP SP
Nominal SOC
(∆SOC)/(∆Pa) LP P Z N LN
HD SN SN Z SP SP
N MN SN Z Z SP
HC MN SN Z Z SP
High SOC
(∆SOC)/(∆Pa) LP P Z N LN
HD LN MN MN MN MN
N LN MN MN MN MN
HC LN LN MN MN MN HD-High Discharge, N-Nominal, HC-High Charge
LP-Large positive, P-Positive, Z-Zero, N-Negative, LN-Large negative
MP-Moderately Positive, MN-Moderately Negative

55
Table 4. Rule set for FLC2
Low BSFC
(Speed)/(∆Pg) LP P Z N LN
LS MT MT MT LT LT
MS MT MT LT LT LT
HS MT MT LT LT LT
Moderate BSFC
(Speed)/(∆Pg) LP P Z N LN
LS HT MT MT LT LT
MS MT MT LT LT LT
HS MT LT LT LT LT
High BSFC
(Speed)/(∆Pg) LP P Z N LN
LS HT MT MT LT LT
MS HT MT MT LT LT
HS HT MT LT LT LT LS-Low speed, MS-Moderate speed, HS-High speed
LP-Large positive, P-Positive, Z-Zero, N-Negative, LN-Large negative LT-Large throttle, MT-Moderate throttle, HT-High throttle

56
Chapter 5. Results and Discussion
5.1. Mission Comparison
5.1.1. Cruising mission
The results of the simulation in terms of the propulsion motor response are relatively the
same for each controller in each mission scenario. This results from the series hybrid configuration
propulsion motor functioning independently from the engine-generator unit. Also, each control
strategy focuses on operating the engine and has no effect on the motor's performance except when
the battery SOC falls too low, and battery power capacity decreases and is not able to supply the
power required to maintain flight speed. Therefore the results for the motor will be analyzed by
mission rather than by control strategy.
For the cruising mission, the results in Figure 45 show the model response for the 30 min
mission. Figure 45a shows the voltage and currents data where the motor current draw reaches
nearly 40 A around the 400s range, which is when the aircraft is going through the climb phase of
flight. After that period, the aircraft begins the cruising phase at the 500s point, which lasts for
1000s. We also observe that during the climbing phase, the motor speed (Figure 45b) reaches 850
rad/s (8100 rpm), which is close to the maximum speed of the KDE motor modeled in this work.
In addition, the motor torque output reaches 2.8 Nm, which corresponds to the force required to
accelerate the propeller to a speed that produces the required thrust.
Lastly, Figure 45c shows the motor power, which peaked at 2500 W during the climbing
phase and then reduced to 500 W during the cruising phase. These results are representative of
what an aircraft would experience during flight, where high power would be experienced during a
climb. This same behavior is repeated for the other mission where power draw increases during
times where aircraft speeds are high and the aircraft is climbing.

57
(a)
(b)
(c)
Figure 45. Cruising mission propulsion motor simulation data
5.1.2. Maneuvering Mission
The maneuvering mission results in Figure 46 demonstrate a similar trend where the
climbing phase of flight has the highest voltage and current (Figure 46a) over the 30 min mission.
The simulation shows that the current draw reached less than 30 A, which is less than that of the
cruising mission. We also see that the response behavior closely matches the mission profile where
the propulsion motor and torque all correspond to the changes in aircraft speed, which are used to
simulate in air maneuvers where the aircraft changes speed while at cruise altitude.

58
The power profile in Figure 46c shows that the motor power peaked at 1600 W during the
climbing phase, where the aircraft speed increased to 35 m/s. after this climbing phase, the power
decreases to approximately 700 W at the 800-900s range where the aircraft is still traveling at 35
m/s. The power then further reduces to 500 W and then 300 W as the speed drops to 30 m/s and
23 m/s, respectively. These power variations are used to analyze the effect it would have on
charging operations during the flight.
(a)
(b)
(c)
Figure 46. Maneuvering mission propulsion motor simulation data
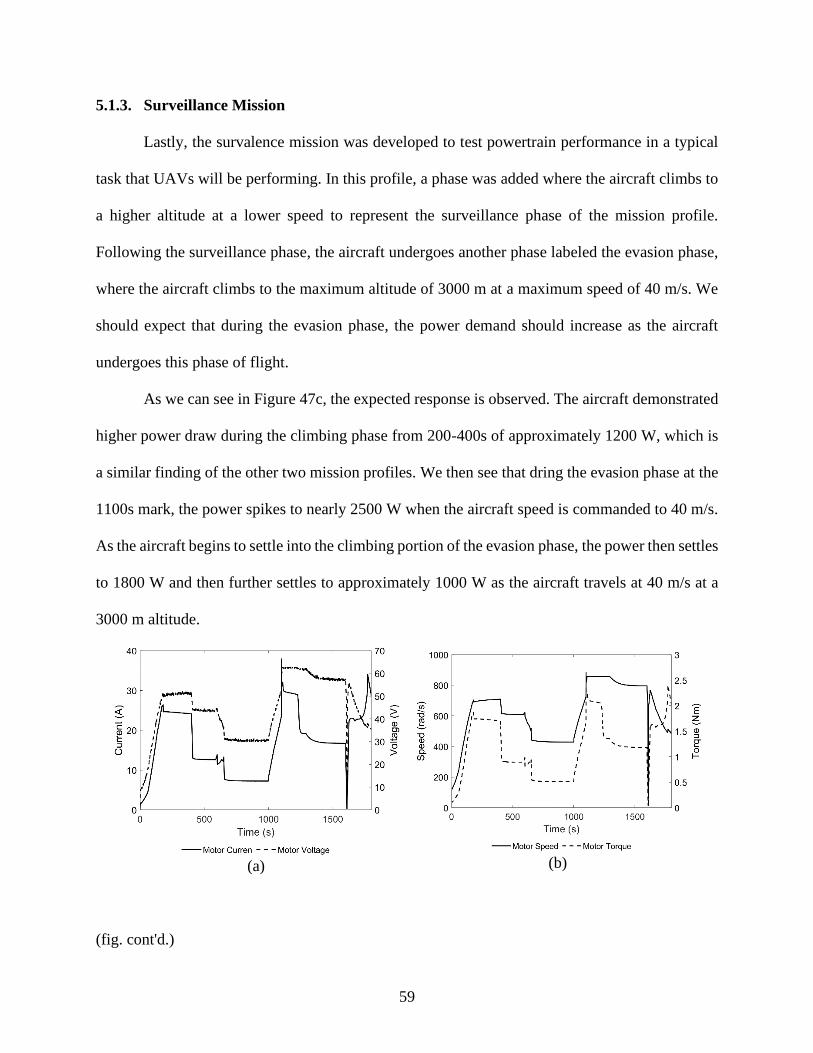
59
5.1.3. Surveillance Mission
Lastly, the survalence mission was developed to test powertrain performance in a typical
task that UAVs will be performing. In this profile, a phase was added where the aircraft climbs to
a higher altitude at a lower speed to represent the surveillance phase of the mission profile.
Following the surveillance phase, the aircraft undergoes another phase labeled the evasion phase,
where the aircraft climbs to the maximum altitude of 3000 m at a maximum speed of 40 m/s. We
should expect that during the evasion phase, the power demand should increase as the aircraft
undergoes this phase of flight.
As we can see in Figure 47c, the expected response is observed. The aircraft demonstrated
higher power draw during the climbing phase from 200-400s of approximately 1200 W, which is
a similar finding of the other two mission profiles. We then see that dring the evasion phase at the
1100s mark, the power spikes to nearly 2500 W when the aircraft speed is commanded to 40 m/s.
As the aircraft begins to settle into the climbing portion of the evasion phase, the power then settles
to 1800 W and then further settles to approximately 1000 W as the aircraft travels at 40 m/s at a
3000 m altitude.
(a)
(b)
(fig. cont'd.)

60
(c)
Figure 47. Surveillance mission propulsion motor simulation data
We can see that for each of these missions, the current draw never really exceeds 40 A.
However, the maximum power observed among all the missions was 2500 W in the cruising
mission. This result was not expected because the cruising profile was created to be the least
intensive profile in terms of power consumption. However, an aircraft experiences high power
may draw during climbing because the climbing segment is shorter than the other two missions,
and the altitude that it is climbing to is relatively high. Nevertheless, results during the climb as
expected, and the power draw did reduce drastically after the climbing phase in Figure 47c for the
cruising profile. However, these results do not give direct insight into the model variables affected
by the powertrain controller. These results merely give an insight into what power could be
demanded during power generation.
5.2. Baseline Control Results
As mentioned in the previous section, the results of the propulsion motor will be the same
for each mission, regardless of the control method used. However, the results of the SOC, fuel
usage, and generator power, and current production are not similar among the various profiles.
These aspects of the powertrain performance are directly affected by the three controllers

61
implemented in this analysis. Comparing the results for each mission profile based on the
performed of each controller, we can gain a better understanding of the performance of the
controllers.
The baseline controller produces roughly the same current during charging, as shown in
Figure 48, where the current varies between 37 A to 42 A. This behavior is observed because the
current drawn by the motor never really exceeds 40 A during each mission. However, we see that
the current response curves are out of sync because the point at which the SOC reaches the charge
sustaining mode of operation is achieved at different times because of how the motor current draw
occurs in each mission.
Figure 48. Baseline controller generator current
Moreover, we do see that for the maneuvering and surveillance profile, the points of peak
power production do occur when undergoing periods of high demand. These periods occur, as
previously discussed, during climbing for the maneuvering profile and during the evasion phase
of the surveillance profile, which occurs at 500-700s and 1100-1400s, respectively. This same
behavior is observed in Figure 49 for the power where maximum power production of 1000 W
occurs during peak power demand. We also make note that during the cruising profile, the charging
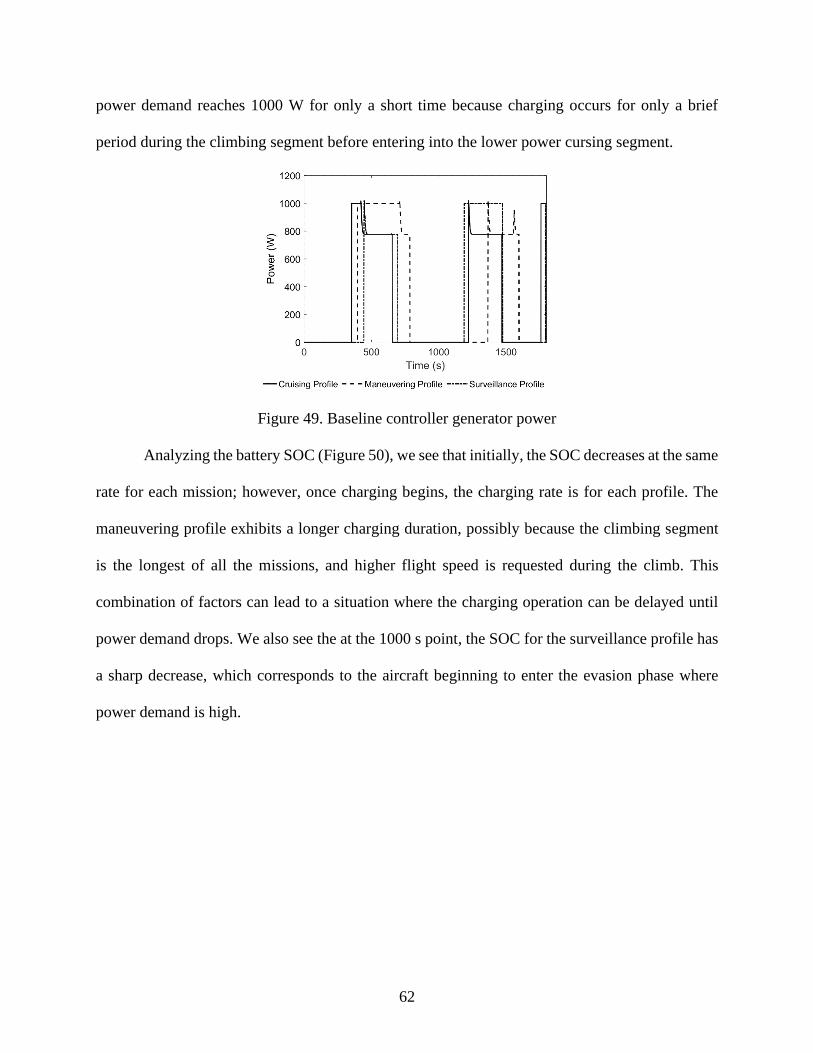
62
power demand reaches 1000 W for only a short time because charging occurs for only a brief
period during the climbing segment before entering into the lower power cursing segment.
Figure 49. Baseline controller generator power
Analyzing the battery SOC (Figure 50), we see that initially, the SOC decreases at the same
rate for each mission; however, once charging begins, the charging rate is for each profile. The
maneuvering profile exhibits a longer charging duration, possibly because the climbing segment
is the longest of all the missions, and higher flight speed is requested during the climb. This
combination of factors can lead to a situation where the charging operation can be delayed until
power demand drops. We also see the at the 1000 s point, the SOC for the surveillance profile has
a sharp decrease, which corresponds to the aircraft beginning to enter the evasion phase where
power demand is high.

63
Figure 50. Baseline controller battery SOC
More importantly, the fuel consumption of the hybrid powertrain is one of the most critical
aspects of the powertrain performance and is the main focus of each controller analyzed in this
work. As shown in Figure 51, the baseline controller used 123 g to 90 g of fuel, with the
maneuvering profile using the most fuel. The maneuvering profile possibly uses more fuel because
of the extended climbing phase, which results in more fuel being used in the first 800s of flight.
Figure 51. Baseline controller engine fuel consumption
5.3. IOL Control Results
The IOL controller produces roughly the same current as the baseline controller during
charging, as shown in Figure 52. The current varies between 37 A to 42 A. However, we see that

64
at the 700s point, some oscillations exist, which are a result of the controller attempting to operate
at the specified ideal operating line profile. These oscillations could be a direct result of the IOL
line construction where the power or torque needed to generate power occurs in a range where the
IOL line has sharp changes causing issues with the look-up tables used to define the line.
Figure 52. IOL controller generator current
The power profile for the maneuvering and surveillance profile has roughly the same levels
of peak power production as observed for the baseline controller. However, one notable
observation is that the IOL controller has more transient operation for the maneuvering profile
around the 1300-1500s range (Figure 53). This range corresponds directly to a phase where the
aircraft accelerates to a higher speed before entering into the last cursing segment of the mission.
Thus these transient spikes correspond to the period where the aircraft is undergoing acceleration
from 23 m/s to 30 m/s, thus causing power spikes in the generator power demand.

65
Figure 53. IOL controller generator power
For the IOL battery SOC (Figure 54), we see again that initially, the SOC decreases at the
same rate for each mission; however, once charging beings, the profiles begin to diverge. This
profile looks nearly identical to that of the baseline controller, where the maneuvering profile
exhibits a longer charging because the climbing segment and the SOC for the surveillance profile
have a sharp decrease at the 1000s point, which corresponds to the aircraft beginning to enter the
evasion phase.
Figure 54. IOL controller battery SOC
Although the performance shown in Figure 52 -Figure 54 might seem very similar to what
was observed in the baseline controller, slight differences exist. The most notable difference is

66
shown in Figure 55 of the fuel usage for the IOL controller. The IOL scheme used 82 g to 109 g
of fuel across the three different missions, with the maneuvering profile using the most fuel. This
higher fuel consumption for the maneuvering profile is again because of the more prolonged
climbing phase used in the first 800s of flight resulting in more fuel consumption. We see that the
IOL controller was able to reduce fuel consumption considerably when compared to the baseline
controller. This shows the effectiveness of the IOL controller simply through the addition of the
IOL line, which defines the most efficient line or region of operation.
Figure 55. IOL controller engine fuel consumption
5.4. Fuzzy Logic Control Results
The FLC controller is able to consistently produce 40 A of current for each of the missions,
which in comparison to the baseline and the IOL current generally was less for the cruising and
surveillance profile at certain times. These results are possible due to the control having the ability
to control more aspects of the powertrain function, thus controlling the generator power production
better. However, we see a couple of current spikes occurring at the 700s and the 1500s point, which
again are a result of transient behavior associated with the transition from charge sustaining to
charge depletion mode, as shown in Figure 58, where the maximum SOC is reached.

67
Figure 56. FLC controller generator current
Figure 57. FLC controller generator power
The power profile for the fuzzy logic controller (Figure 57) is much lower than the IOL or
the baseline controller. The FLC operates the engine at 888 W compared to the 956 W and 1000
W of power for the IOL and baseline controller, respectively. The FLC, because of its ability to
use multi-valued logic and multiple input variables, can control the power production of the
generator better.

68
Figure 58. FLC controller battery SOC
Figure 59. FLC controller engine fuel consumption
The battery SOC (Figure 58) for the fuzzy logic controller demonstrates again that initially,
the SOC decreases at the same rate for each mission and then begin to diverge. This profile look
shape is nearly identical to the results of the other previously mentioned controller; however, it is
noticeable that the charging duration for the maneuvering and survalence mission is longer than
the IOL and the baseline controller. This is due to the lower power production of the fuzzy logic
controller compared to the IOL and the baseline controller.
The FLC scheme used 91 g to 111 g of fuel (Figure 59) among the three missions again
with the maneuvering profile using the most fuel. The fuzzy logic controller manages to more
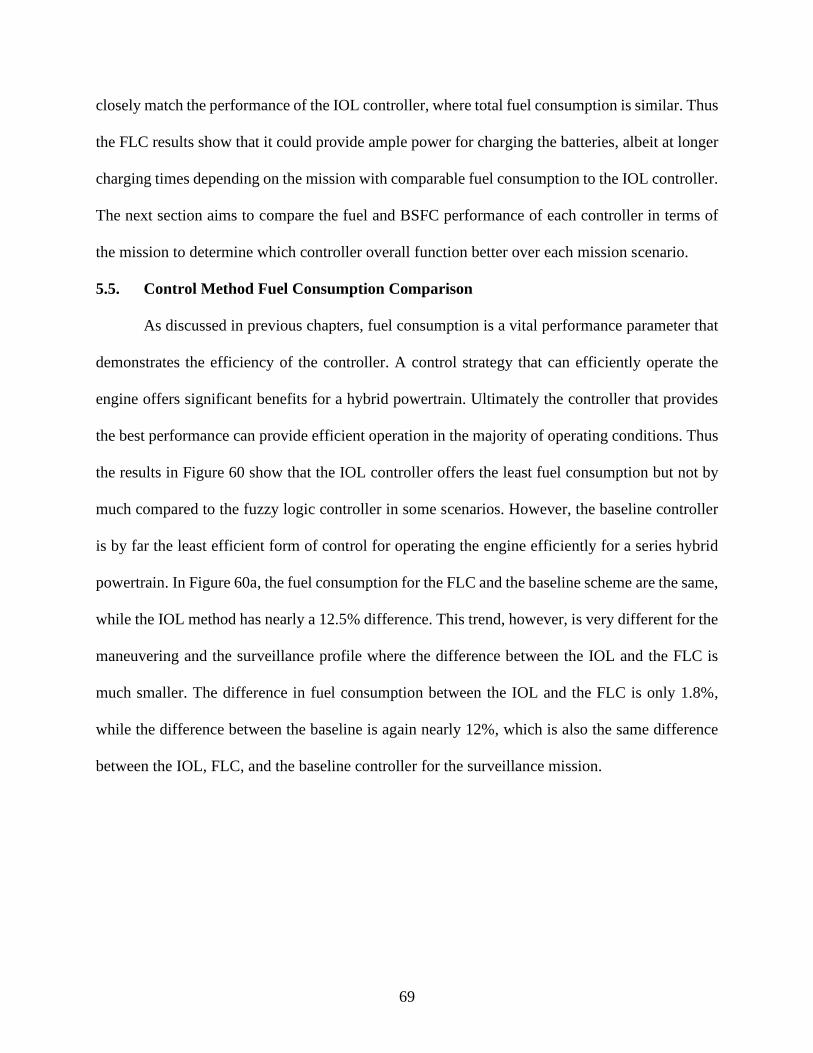
69
closely match the performance of the IOL controller, where total fuel consumption is similar. Thus
the FLC results show that it could provide ample power for charging the batteries, albeit at longer
charging times depending on the mission with comparable fuel consumption to the IOL controller.
The next section aims to compare the fuel and BSFC performance of each controller in terms of
the mission to determine which controller overall function better over each mission scenario.
5.5. Control Method Fuel Consumption Comparison
As discussed in previous chapters, fuel consumption is a vital performance parameter that
demonstrates the efficiency of the controller. A control strategy that can efficiently operate the
engine offers significant benefits for a hybrid powertrain. Ultimately the controller that provides
the best performance can provide efficient operation in the majority of operating conditions. Thus
the results in Figure 60 show that the IOL controller offers the least fuel consumption but not by
much compared to the fuzzy logic controller in some scenarios. However, the baseline controller
is by far the least efficient form of control for operating the engine efficiently for a series hybrid
powertrain. In Figure 60a, the fuel consumption for the FLC and the baseline scheme are the same,
while the IOL method has nearly a 12.5% difference. This trend, however, is very different for the
maneuvering and the surveillance profile where the difference between the IOL and the FLC is
much smaller. The difference in fuel consumption between the IOL and the FLC is only 1.8%,
while the difference between the baseline is again nearly 12%, which is also the same difference
between the IOL, FLC, and the baseline controller for the surveillance mission.

70
(a) Cruising mission
(b) Maneuvering mission
(c) Survalence Mission
Figure 60. Controller fuel consumption per flight mission
Thus one can conclude that the baseline controller uses approximately 12% more fuel than
a controller that is more oriented in providing efficient engine operation. This is further shown in
Table 5, where the fuel economy for each mission and each controller is shown. As shown in Table
5, the IOL method is generally more efficient. However, this efficiency results from the IOL and
the results that one achieves are highly dependant on the accuracy of the data used to construct the
IOL. Moreover, it might not be possible for the aircraft to achieve operation near the IOL because
of environmental effects or other external factors that lower the engine efficiency.
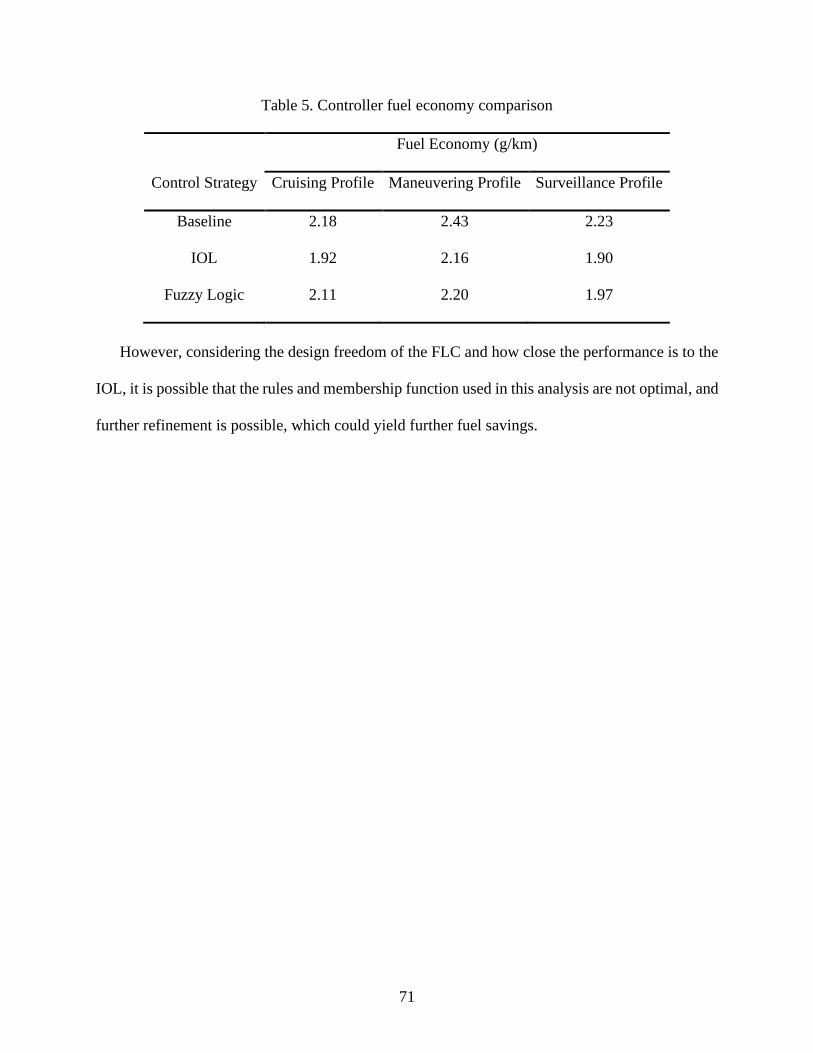
71
Table 5. Controller fuel economy comparison
Fuel Economy (g/km)
Control Strategy Cruising Profile Maneuvering Profile Surveillance Profile
Baseline 2.18 2.43 2.23
IOL 1.92 2.16 1.90
Fuzzy Logic 2.11 2.20 1.97
However, considering the design freedom of the FLC and how close the performance is to the
IOL, it is possible that the rules and membership function used in this analysis are not optimal, and
further refinement is possible, which could yield further fuel savings.

72
Chapter 6. Hardware Setup
To validate the performance results achieved in the powertrain system simulation, a
physical hybrid powertrain testbed was constructed to test the control schemes. The physical
system is composed of many of the same components in the powertrain model. However, to
simplify the model, the actual components were not modeled identically to the physical system.
The prop motor and generator are the same KDE 7215XF-135 BLDC motor, which is controlled
by the KDE-UAS95HVC ESC, where the ESC for the generator functions as an inverter converting
3 phase AC power into DC power.
Figure 61. Hardware setup diagram
The prop motor is attached to an RC Benchmark series 1580 thrust stand and dynamometer,
which uses load cells to measure the torque generated by the motor. The trust stand is capable of
measuring thrust up to 1.5 kgf and 1.5 Nm of torque. An 18x6 Aerostar propeller connected to the
prop motor generates the thrust for the system. The RC Benchmark testing program allows for
logging of data such as prop motor torque, power, voltage, current, and speed in addition to
propeller thrust generated. The ICE engine used is the 3W-28i, which is a carbureted 2-stroke
73
engine with a displacement of 28cc. Engine ignition is controlled by the 3W ignition control
module, which uses the crank position signal to determine spark timing. The crank position sensor
is composed of two magnets strategically placed on the engine crank snout, which is read by a
magnetic pickup. The engine throttle is controlled via a small servo motor, and feedback control
can be implemented to control the engine speed through the crank speed sensor and the throttle
actuator. Engine starting is achieved using a nose cone adaptor connected to the rear of the
generator and a common nose cone electric starter motor. However, in the future, engine starting
can be accomplished directly using the generator as a motor to rotate the engine when requested.
Lastly, the engine is connected to the generator motor via a flexible shaft coupler to form the gen-
set.
The charging operation is triggered by the powertrain control when the SOC falls below
the set value. The battery used in this system is a small hobby aircraft-grade Turnigy Graphene
Panther 6s 22.2 V, 5 Ah LiPo battery, which is connected to a Roboteq 1040A BMS that manages
the battery charging operations by balancing the voltage to each cell in addition to delivering power
to the prop motor. This BMS unit also allows for the measurement of the charging and discharging
current, battery load voltage, and the battery SOC. The powertrain components communicate
through a National Instruments DAQ and a Labview interface. The LabVIEW interface also serves
as the communication link between the powertrain controller in the Simulink environment. This
allows for the necessary communication channels from the component and the powertrain
controller to send information feedback between the components and the controller. The
information is then processed by the controller to determine the necessary control actions.
A Labview interface was created to log and view powertrain performance data during the
real-time simulation. This interface allows for viewing data for physical components: the motor,

74
engine, generator, propeller, and battery data, and displays data such as rotational speed, electrical
power, thrust, motor torque, voltage, current, and battery SOC. The interface allows for viewing
data for simulated components such as the aircraft, where data for flight speed, flight angle, and
flight altitude. The LabVIEW application will also allow for direct control of the powertrain so
that malfunctions and errors can be resolved or halted before damage to the hardware can occur
and also allows for automatic limits to be set to protect the components.
Figure 62. Physical testbed image
The series hybrid test stand (Figure 62) is necessary to validate all modeling aspects such
as model accuracy, controller performance, and the development of new control schemes. This test
stand can be used to verify model parameters to ensure that the model performance closely matches
the physical hardware. This aspect of model accuracy is especially essential if higher fidelity
models are implemented for the powertrain components by allowing for the use of physical test
data to tune the component model performance. Controller performance tuning and validation is
another important use for the testbed. The controllers developed in this work, such as the IOL and
the fuzzy logic controller, can be refined for accuracy and efficacy. For example, the fuzzy logic
controller implementation could be refined based upon which information is gathered from the

75
initial test of the controller performance. This information can then be used to modify the
membership functions and rules to achieve the desired performance that is observed in the physical
hardware test. The central goal of the physical testbed is to confirm that the controllers and models
are accurately predicting the system performance and that the fuel consumption savings observed
for the various mission simulations between the different controllers are possible.

76
Chapter 7. Conclusions
7.1. Concluding Remarks
Hybrid powertrains offer potential improvement in range and endurance performance, in
addition to noise, fuel cost savings, and engine emissions in propulsion systems for unmanned
aircraft. Unfortunately, the current understanding of the performance benefits specific to different
hybrid powertrain configurations is lacking. Furthermore, the current understanding of benefits
from powertrain hybridization for small unmanned aerial systems is lacking. This is primarily due
to a lack of adequate consideration of the performance of individual powertrain components, with
sufficient attention to a robust control strategy for the powertrain operation. This work aims to use
a high-level powertrain system model for unmanned air systems to perform comparative
performance analysis for different powertrain controllers tested using different mission profiles.
The objective is to study integrated powertrain performance and evaluate the significance of
utilizing an appropriate control strategy to minimize overall fuel consumption.
A system model of a series hybrid electric UAS was constructed, which incorporated detailed
models of the powertrain components. Component models included measured performance maps
such as those for the IC engine and models incorporating tuned input parameters obtained from
hardware test data such as those for the battery, motor, and generator. Three different powertrain
control strategies were employed, where two focused on efficient engine operation. The first
controller named the baseline strategy, functioned as a power-follower form of control, generating
the requested power without considering engine fuel consumption. Next, an ideal operating line
(IOL) controller that optimizes engine fuel consumption is used to control the hybrid powertrain
operation. The controller attempted to optimize engine fuel consumption by choosing engine
operating points corresponding to generator power demand with the lowest brake specific fuel

77
consumption(BSFC). The IOL controller was aided in this process by a detailed engine map
providing torque, power, and fuel consumption values measured for a typical engine used in
unmanned air system. Lastly, a fuel efficiency-focused fuzzy logic controller was implemented to
examine if further gains in fuel efficiency could be achieved by factoring in more variables of the
powertrain operation.
Overall, the IOL strategy was shown to increase fuel efficiency over the baseline and fuzzy
logic control strategy for a series hybrid powertrain configuration for all three mission profiles
studied in this work. The IOL fuel savings were shown to range from 14 g to 16 g for a 30-minute
duration mission profile when compared to the baseline controller. Also, the IOL generally has a
2g to 3g advantage over the fuzzy logic method with one exception where FLC used 10g more
fuel for the cruising mission profile. These resulting fuel consumption values give an average
improvement in fuel economy ranging from 12%-15% for the IOL and fuzzy logic scheme when
compared to the baseline controller for specific missions. The results of this study show that the
IOL configuration provides more fuel-efficient operation even over the FLC method. However,
because of the flexibility of the FLC controller, further gains are possible. These further gains are
apparent, considering that the performance is very close in two out of the three missions analyzed.
The results produced by the FLC could see improvement through the refinement of both the
membership functions used and the ruleset developed for the controller.
Aircraft hybrid powertrains are an emerging technology in the aerospace industry. In the
scope of this work, hybrid UAVs could offer a tactical advantage for the armed forces in all uses
cases such as surveillance, tactical, or strategic situations. Benefits such as increased range allow
for the extension of the target region and the surveillance zone or increased endurance, allowing
for a longer flight, thus increasing the effectiveness of UAV to complete a mission or multiple

78
mission before requiring refueling. Lastly, the rate of charging, which differs from one control
scheme to another, as shown by the results, can affect mission readiness for the UAS. The mission
for a UAS could be altered mid-flight due to unforeseen circumstances. The ability of the controller
to charge the batteries to a point where the UAS system is prepared to accomplish any task
presented is crucial. For the commercial industry, these same befits in increased range, and
endurance could translate into reduced fuel cost leading to reduced air travel fees. Also, it is
possible that hybrid aircraft could aid in reducing noise pollution from airports and during the
flight, which makes the experience of air travel more tolerable. Considering that hybrid
powertrains can operate in electric-only mode, commercial aircraft could reduce the noise created
by jet engines during take-off and landing.
Design challenges do exist, and research and development continue in all aspects of the
hybrid powertrain. Considering that this design problem is a multidisciplinary effort, significant
work needs to be performed in developing more advanced designs ranging from motor technology
to aircraft material. The main advancement needed is higher energy density batteries to increase
the battery energy capacity so that battery weight can be reduced. The reduction of battery weight
can alone provide significant gains in hybrid powertrain effectiveness. Also, current off-the-shelf
small displacement engine could improve in fuel-efficiency through the use of fuel injection,
which is better at controlling fuel usages in comparison to a carburetor. In addition, the
development of higher efficiency engines at this scale could result in less fuel consumed during
flight, and thus, less fuel is needed to travel the same distance. Lastly, improvements in aircraft
materials could benefit hybrid and conventional aircraft. A lighter aircraft structure would benefit
a hybrid powertrain because it would allow for the added weight of the hybrid powertrain to be

79
offset by the reduced weight of the airframe. Hybrid aircraft are still in the infancy stages; however,
the future of hybrid electric flight is promising where a new age of flight is possible.
7.2. Future works
Future efforts focus on improvements in the controller logic and engine performance maps
with higher resolution to ensure an optimal ideal operating line is found. Other tasks include the
modeling of the more complex parallel and split power configurations and exploring other possible
control methods for these powertrain configurations. Considering that literature has done ample
research on parallel hybrid powertrain control, this is the next logical step. Moreover, further
improvements in model accuracy could be gained by incorporating higher fidelity models for the
aircraft, motors, and possibly the battery.
Furthermore, efforts in developing a hardware platform for testing hybrid powertrains will
continue where the models and the control schemes can be tested for accuracy and effectiveness.
This hardware testbed will allow for the continued improvement of the model accuracy and control
development.
Lastly, work is currently in progress to incorporate a higher fidelity 3 degree of freedom (3
DOF) aircraft model developed by our collaborators at Southern University – Baton Rouge. This
model will be used to analyze the effect of a more accurate aircraft model on the powertrain
controller and overall model performance. Environmental wind effects will also be incorporated
in this analysis to observe the effects on the power consumption of small aircraft.

80
References
[1] Sabri, M. F. ., Danapalasingam, K. A., and Rahmat, M. F. “A Review on Hybrid Electric
Vehicles Architecture and Energy Management Strategies.” Renewable and Sustainable
Energy Reviews, Vol. 53, 2016, pp. 1433–1442.
https://doi.org/10.1016/j.rser.2015.09.036.
[2] Brelje, B. J., and Martins, J. R. R. A. “Electric, Hybrid, and Turboelectric Fixed-Wing
Aircraft: A Review of Concepts, Models, and Design Approaches.” Progress in
Aerospace Sciences, Vol. 104, 2019, pp. 1–19.
https://doi.org/10.1016/j.paerosci.2018.06.004.
[3] Topham, G. Rolls-Royce Joins Race to Develop Electric Passenger Jets. Guardian News
and Media. https://www.theguardian.com/business/2017/nov/28/rolls-royce-electric-
passenger-jets-airbus-siemens-e-fan-x-hybrid-electric-plane-2020. Accessed Oct. 19,
2020.
[4] NASA Armstrong Fact Sheet: NASA X-57 Maxwell. NASA.
https://www.nasa.gov/centers/armstrong/news/FactSheets/FS-109.html. Accessed Oct. 19,
2020.
[5] Project Kick-off Meeting of EU H2020 CENTRELINE Hosted by Bauhaus Luftfahrt.
Bauhaus Luftfahrt. https://www.bauhaus-luftfahrt.net/en/press-media/news/project-kick-
off-meeting-of-eu-h2020-centreline-hosted-by-bauhaus-luftfahrt/. Accessed Oct. 19, 2020.
[6] Future Flight-Boeing: 2014 Environment Report. Boeing.
http://www.boeing.com/aboutus/environment/environment_report_14/2.3_future_flight.ht
ml. Accessed Oct. 19, 2020.
[7] Siemens. Electric Hybrid Drives for Aircraft. Phys.org. https://phys.org/news/2013-07-
electric-hybrid-aircraft.html. Accessed Oct. 19, 2020.
[8] Zero-Emission Air Transport – First Flight of Four-Seat Passenger Aircraft HY4. HY4.
http://hy4.org/zero-emission-air-transport-first-flight-of-four-seat-passenger-aircraft-hy4.
Accessed Oct. 19, 2020.
[9] Morlin-Yron, S. The Plane That Runs on Hydrogen and Emits Only Water. CNN.
https://www.cnn.com/travel/article/hy4-fuel-cell-plane/index.html. Accessed Oct. 19,
2020.
[10] Fahlstrom, P., and Gleason, T. Classes and Missions of UAVs. In Introduction to UAV
systems, John Wiley & Sons, Chichester, 2012, pp. 17–31.
[11] Boeing Insitu ScanEagle Drones Sold to Malaysia, Indonesia, Philippines, Vietnam. The
Defense Post. https://www.thedefensepost.com/2019/06/01/boeing-insitu-scaneagle-
drones-malaysia-indonesia-philippines-vietnam/. Accessed Oct. 19, 2020.
81
[12] Thurber, M. Lycoming Engines Sees New Markets In UAS Segment. Aviation
International News. https://www.ainonline.com/aviation-news/defense/2014-07-
16/lycoming-engines-sees-new-markets-uas-segment. Accessed Oct. 19, 2020.
[13] Wu, G., Zhang, X., and Dong, Z. “Powertrain Architectures of Electrified Vehicles:
Review, Classification and Comparison.” Journal of the Franklin Institute, Vol. 352, No.
2, 2015, pp. 425–448. https://doi.org/10.1016/j.jfranklin.2014.04.018.
[14] Singh, K. V., Bansal, H. O., and Singh, D. “A Comprehensive Review on Hybrid Electric
Vehicles: Architectures and Components.” Journal of Modern Transportation, Vol. 27,
No. 2, 2019, pp. 77–107. https://doi.org/10.1007/s40534-019-0184-3.
[15] Carey, S. B. Increasing the Endurance and Payload Capacity of Unmanned Serial
Vehicles with Thin-Film Photovoltaics. Thesis. Naval Postgraduate School: Monterey,
California:, 2014.
[16] Olsen, J., and Page, J. R. “Hybrid Powertrain for Light Aircraft.” International Journal of
Sustainable Aviation, Vol. 1, No. 1, 2014, p. 85.
https://doi.org/10.1504/IJSA.2014.062871.
[17] Menon, S. K. Performance Measurement and Scaling in Small Internal Combustion
Engines. Dissertation. University of Maryland, College Park, 2006.
[18] Gong, Z., and Yang, Y. “Recent Advances in the Research of Polyanion-Type Cathode
Materials for Li-Ion Batteries.” Energy & Environmental Science, Vol. 4, No. 9, 2011, p.
3223. https://doi.org/10.1039/c0ee00713g.
[19] Soloveichik, G. L. “Battery Technologies for Large-Scale Stationary Energy Storage.”
Annual Review of Chemical and Biomolecular Engineering, Vol. 2, No. 1, 2011, pp. 503–
527. https://doi.org/10.1146/annurev-chembioeng-061010-114116.
[20] Nazar, L. F., Cuisinier, M., and Pang, Q. “Lithium-Sulfur Batteries.” Materials Research
Society Bulletin, Vol. 39, No. 5, 2014, pp. 436–442. https://doi.org/10.1557/mrs.2014.86.
[21] Mikhaylik, Y., Kovalev, I., Xu, J., and Schock, R. “Rechargeable Li-S Battery with
Specific Energy 350 Wh/Kg and Specific Power 3000 W/Kg.” Electrochemical Society
Meeting Abstracts, 2008, pp. 1–2. https://doi.org/10.1149/MA2008-01/5/112.
[22] Girishkumar, G., McCloskey, B., Luntz, A. C., Swanson, S., and Wilcke, W. “Lithium-Air
Battery: Promise and Challenges.” Journal of Physical Chemistry Letters, Vol. 1, No. 14,
2010, pp. 2193–2203. https://doi.org/10.1021/jz1005384.
[23] Pipistrel ALPHA Electro - The First LSA Certified Electric Aircraft. Pipistrel USA.
Pipistrel. https://www.pipistrel-usa.com/alpha-electro/. Accessed Oct. 19, 2020.
[24] Schömann, J. Hybrid-Electric Propulsion Systems for Small Unmanned Aircraft.
Dissertation. Technical University of Munich, 2014.

82
[25] Brown, S. P. Design and Optimization of a 1 KW Hybrid Powertrain for Unmanned
Aerial Vehicles. Thesis. Oregon State University, 2017.
[26] Voskuijl, M., van Bogaert, J., and Rao, A. G. “Analysis and Design of Hybrid Electric
Regional Turboprop Aircraft.” Council of European Aerospace Societies Aeronautical
Journal, Vol. 9, No. 1, 2017, pp. 15–25. https://doi.org/10.1007/s13272-017-0272-1.
[27] Menon, S., and Cadou, C. P. “Scaling of Miniature Piston-Engine Performance, Part 1:
Overall Engine Performance.” Journal of Propulsion and Power, Vol. 29, No. 4, 2013, pp.
774–787. https://doi.org/10.2514/1.B34638.
[28] Rowton, A. K. Measuring Scaling Effects in Small Two-Stroke Internal Combustion
Engines. Thesis. Air Force Institute of Technology, 2014.
[29] Silva, H. L. Hybrid-Electric Aircraft: Conceptual Design, Structural and Aeroelastic
Analyses. Thesis. Federal University of Uberlândia, 2017.
[30] Isikveren, A. T., Kaiser, S., Pornet, C., and Vratny, P. C. “Pre-Design Strategies and
Sizing Techniques for Dual-Energy Aircraft.” Aircraft Engineering and Aerospace
Technology, Vol. 86, No. 6, 2014, pp. 525–542. https://doi.org/10.1108/AEAT-08-2014-
0122.
[31] Sliwinski, J., Gardi, A., Marino, M., and Sabatini, R. “Hybrid-Electric Propulsion
Integration in Unmanned Aircraft.” Energy, Vol. 140, No. July, 2017, pp. 1407–1416.
https://doi.org/10.1016/j.energy.2017.05.183.
[32] Donateo, T., and Ficarella, A. “Designing a Hybrid Electric Powertrain for an Unmanned
Aircraft with a Commercial Optimization Software.” Society of Automotive Engineers
International Journal of Aerospace, Vol. 10, No. 1, 2017. https://doi.org/10.4271/2017-
01-9000.
[33] Hiserote, R. M. Analysis of Hybrid-Electric Propulsion System Designs for Small
Unmanned Aircraft Systems. Thesis. Air force institute of technology. Wright-patterson air
force Base, Ohio, 2010.
[34] Rotramel, T. A. Optimization of Hybrid-Electric Propulsion Systems for Small Remotely-
Piloted Aircraft. Thesis. Air force institute of technology. Wright-patterson air force Base,
Ohio, 2011.
[35] Xie, Y., Savvaris, A., and Tsourdos, A. “Sizing of Hybrid Electric Propulsion System for
Retrofitting a Mid-Scale Aircraft Using Non-Dominated Sorting Genetic Algorithm.”
Aerospace Science and Technology, Vols. 82–83, 2018, pp. 323–333.
https://doi.org/10.1016/j.ast.2018.09.022.
[36] Sgueglia, A., Schmollgruber, P., Bartoli, N., Benard, E., Morlier, J., Jasa, J., Martins, J. R.
R. A., Hwang, J. T., and Gray, J. S. “Multidisciplinary Design Optimization Framework
with Coupled Derivative Computation for Hybrid Aircraft.” Journal of Aircraft, Vol. 57,
No. 4, 2020, pp. 715–729. https://doi.org/10.2514/1.C035509.

83
[37] Sinibaldi, G., and Marino, L. “Experimental Analysis on the Noise of Propellers for Small
UAV.” Applied Acoustics, Vol. 74, No. 1, 2013, pp. 79–88.
https://doi.org/10.1016/j.apacoust.2012.06.011.
[38] Enang, W., and Bannister, C. “Modelling and Control of Hybrid Electric Vehicles (A
Comprehensive Review).” Renewable and Sustainable Energy Reviews, Vol. 74, 2017, pp.
1210–1239. https://doi.org/10.1016/j.rser.2017.01.075.
[39] Meisel, J., Shabbir, W., and Evangelou, S. A. “A Practical Control Methodology for
Parallel Plug-in Hybrid Electric Vehicle Powertrains.” 2013 9th IEEE Vehicle Power and
Propulsion Conference, 2013. https://doi.org/10.1109/VPPC.2013.6671659.
[40] Gao, J., Sun, F., He, H., Zhu, G. G., and Strangas, E. G. “A Comparative Study of
Supervisory Control Strategies for a Series Hybrid Electric Vehicle.” Asia-Pacific Power
and Energy Engineering Conference, 2009.
https://doi.org/10.1109/APPEEC.2009.4918038.
[41] Lee, B., Park, P., Kim, C., Yang, S., and Ahn, S. “Power Managements of a Hybrid
Electric Propulsion System for UAVs.” Journal of Mechanical Science and Technology,
Vol. 26, No. 8, 2012, pp. 2291–2299. https://doi.org/10.1007/s12206-012-0601-6.
[42] Barsali, S., Miulli, C., and Possenti, A. “A Control Strategy to Minimize Fuel
Consumption of Series Hybrid Electric Vehicles.” IEEE Transactions on Energy
Conversion, Vol. 19, No. 1, 2004, pp. 187–195.
https://doi.org/10.1109/TEC.2003.821862.
[43] Machado, L., Matlock, J., and Suleman, A. “Experimental Evaluation of a Hybrid Electric
Propulsion System for Small UAVs.” Aircraft Engineering and Aerospace Technology,
Vol. 92, No. 5, 2019, pp. 727–736. https://doi.org/10.1108/AEAT-06-2019-0120.
[44] Hung, J. Y. C., and Gonzalez, L. F. “Design, Simulation and Analysis of a Parallel Hybrid
Electric Propulsion System for Unmanned Aerial Vehicles.” 28th Congress of the
International Council of the Aeronautical Sciences 2012, ICAS 2012, Vol. 4, 2012, pp.
2655–2661.
[45] Xie, Y., Savvaris, A., Tsourdos, A., Laycock, J., and Farmer, A. “Modelling and Control
of a Hybrid Electric Propulsion System for Unmanned Aerial Vehicles.” IEEE Aerospace
Conference Proceedings, 2018. https://doi.org/10.1109/AERO.2018.8396436.
[46] Gao, J. P., Zhu, G. M. G., Strangas, E. G., and Sun, F. C. “Equivalent Fuel Consumption
Optimal Control of a Series Hybrid Electric Vehicle.” Proceedings of the Institution of
Mechanical Engineers, Part D: Journal of Automobile Engineering, Vol. 223, No. 8,
2009, pp. 1003–1018. https://doi.org/10.1243/09544070JAUTO1074.
[47] Harmon, F. G., Frank, A. A., and Joshi, S. S. “The Control of a Parallel Hybrid-Electric
Propulsion System for a Small Unmanned Aerial Vehicle Using a CMAC Neural
Network.” Neural Networks, Vol. 18, Nos. 5–6, 2005, pp. 772–780.
https://doi.org/10.1016/j.neunet.2005.06.030.
84
[48] Yan, F., Wang, J., and Huang, K. “Hybrid Electric Vehicle Model Predictive Control
Torque-Split Strategy Incorporating Engine Transient Characteristics.” IEEE Transactions
on Vehicular Technology, Vol. 61, No. 6, 2012, pp. 2458–2467.
https://doi.org/10.1109/TVT.2012.2197767.
[49] Liu, X., Wu, Y., and Duan, J. “Power Split Control Strategy for a Series Hybrid Electric
Vehicle Using Fuzzy Logic.” International Conference on Automation and Logistics,
2008, pp. 481–486. https://doi.org/10.1109/ICAL.2008.4636199.
[50] Chen, Z., Zhang, X., and Mi, C. C. “Slide Mode and Fuzzy Logic Based Powertrain
Controller for the Energy Management and Battery Lifetime Extension of Series Hybrid
Electric Vehicles.” Journal of Asian Electric Vehicles, Vol. 8, No. 2, 2010, pp. 1425–
1432. https://doi.org/10.4130/jaev.8.1425.
[51] Assadian, F., Mohan, G., and Longo, S. “Comparative Analysis of Forward-Facing
Models vs Backward-Facing Models in Powertrain Component Sizing.” Hybrid and
Electric Vehicles Conference 2013, 2013. https://doi.org/10.1049/cp.2013.1920.
[52] Chau, K. T., Li, W. L., and Lee, C. H. T. “Challenges and Opportunities of Electric
Machines for Renewable Energy (Invited Paper).” Progress In Electromagnetics Research
B, No. 42, 2012, pp. 45–74. https://doi.org/10.2528/PIERB12052001.
[53] Nise, N. S. Modeling in the Frequency Domain. In Control Systems Engineering, John
Wiley & Sons, New York, 2015, p. 78.
[54] Baldursson, S. BLDC Motor Modelling and Control – A Matlab®/Simulink®
Implementation. Thesis. Chalmers University of Technology, 2005.
[55] Saidani, F., Hutter, F. X., Scurtu, R.-G., Braunwarth, W., and Burghartz, J. N. “Lithium-
Ion Battery Models: A Comparative Study and a Model-Based Powerline
Communication.” Advances in Radio Science, Vol. 15, 2017, pp. 83–91.
https://doi.org/10.5194/ars-15-83-2017.
[56] Barcellona, S., and Piegari, L. “Lithium Ion Battery Models and Parameter Identification
Techniques.” Energies, Vol. 10, No. 12, 2017. https://doi.org/10.3390/en10122007.
[57] Si Li, and Ximing Cheng. “A Comparative Study on RC Models of Lithium-Ion Battery.”
2014 IEEE Conference and Expo Transportation Electrification Asia-Pacific, 2014.
https://doi.org/10.1109/ITEC-AP.2014.6940818.
[58] He, H., Xiong, R., and Fan, J. “Evaluation of Lithium-Ion Battery Equivalent Circuit
Models for State of Charge Estimation by an Experimental Approach.” Energies, Vol. 4,
No. 4, 2011, pp. 582–598. https://doi.org/10.3390/en4040582.
[59] Liu, G., Lu, L., Fu, H., Hua, J., Li, J., Ouyang, M., Wang, Y., Xue, S., and Chen, P. “A
Comparative Study of Equivalent Circuit Models and Enhanced Equivalent Circuit
Models of Lithium-Ion Batteries with Different Model Structures.” 2014 IEEE Conference

85
and Expo Transportation Electrification Asia-Pacific, 2014. https://doi.org/10.1109/ITEC-
AP.2014.6940946.
[60] Ahmed, R., Gazzarri, J., Onori, S., Habibi, S., Jackey, R., Rzemien, K., Tjong, J., and
Lesage, J. “Model-Based Parameter Identification of Healthy and Aged Li-Ion Batteries
for Electric Vehicle Applications.” SAE International Journal of Alternative Powertrains,
Vol. 4, No. 2, 2015, pp. 233–247. https://doi.org/10.4271/2015-01-0252.
[61] Liao, C., Li, H., and Wang, L. “A Dynamic Equivalent Circuit Model of LiFePO4
Cathode Material for Lithium Ion Batteries on Hybrid Electric Vehicles.” 5th IEEE
Vehicle Power and Propulsion Conference, 2009.
https://doi.org/10.1109/VPPC.2009.5289681.
[62] Yao, L. W., Aziz, J. A., Kong, P. Y., and Idris, N. R. N. “Modeling of Lithium-Ion Battery
Using MATLAB/Simulink.” IECON 2013 - 39th Annual Conference of the IEEE
Industrial Electronics Society, 2013. https://doi.org/10.1109/IECON.2013.6699393.
[63] Zhao, S., and Howey, D. A. “Global Sensitivity Analysis of Battery Equivalent Circuit
Model Parameters.” 2016 IEEE Vehicle Power and Propulsion Conference, 2016.
https://doi.org/10.1109/VPPC.2016.7791696.
[64] Meng, H., Wang, L., Han, Z., and Lei, S. “Simulation of Engine Power Based on Mean
Value Model.” International Organization of Scientific Research Journal of Engineering,
Vol. 3, No. 10, 2013, pp. 24–27. https://doi.org/10.9790/3021-031022427.
[65] Powell, J. D. “A Review of IC Engine Models for Control System Design.” International
Federation of Automatic Control Proceedings Volumes, Vol. 20, No. 5, 1987, pp. 235–
240. https://doi.org/10.1016/s1474-6670(17)55378-1.
[66] Roskam, J., and Lan, C.-T. E. Equations of Motion. In Airplane aerodynamics and
performance, DARcorporation, Lawrence, 1997, p. 374.
[67] Performance Data. APC Propeller. https://www.apcprop.com/technical-
information/performance-data/. Accessed Oct. 19, 2020.
[68] Hung, J. Y., and Gonzalez, L. F. “On Parallel Hybrid-Electric Propulsion System for
Unmanned Aerial Vehicles.” Progress in Aerospace Sciences, Vol. 51, 2012, pp. 1–17.
https://doi.org/10.1016/j.paerosci.2011.12.001.

86
Vita
Darren was born and raised in New Orleans, Louisiana, and later went on to receive his
Bachelor of Science in Mechanical Engineering with a Minor in Aerospace Engineering from LSU
in May 2018. Following graduation, he returned to. LSU to pursue his Master’s Degree in
Mechanical Engineering in August 2018. He began his graduate studies under the guidance of Dr.
Shyam Menon in the Energy and Propulsion Laboratory on a new project focusing on hybrid-
electric powertrains for unmanned aerial systems. Following his graduation in December 2020,
Darren hopes to pursue a career in the aerospace industry where he can use his knowledge gained
on hybrid aircraft technology to aid in developing future aircraft powertrains.