Study conducted by Mongolian Energy Economics Institute ...
100
Study conducted by Mongolian Energy Economics Institute Supported by Economic Research Institute for ASEAN and East Asia
Transcript of Study conducted by Mongolian Energy Economics Institute ...

Study conducted by
Mongolian Energy Economics Institute
Supported by
Economic Research Institute for ASEAN and East Asia
Mongolia’s Energy Efficiency Indicators 2019 Economic Research Institute for ASEAN and East Asia (ERIA)
Sentral Senayan II 6th Floor
Jalan Asia Afrika no.8, Gelora Bung Karno
Senayan, Jakarta Pusat 10270
Indonesia
©Economic Research Institute for ASEAN and East Asia, 2021
ERIA Research Project FY2020 No. 17
Published in January 2021
All rights reserved. No part of this publication may be reproduced, stored in a retrieval
system, or transmitted in any form by any means electronic or mechanical without prior
written notice to and permission from ERIA. The findings, interpretations, and conclusions
expressed herein do not necessarily reflect the views and policies of the Economic Research
Institute for ASEAN and East Asia, its Governing Board, Academic Advisory Council, or the
institutions and governments they represent.
The findings, interpretations, conclusions, and views expressed in their respective chapters
are entirely those of the author/s and do not reflect the views and policies of the Economic
Research Institute for ASEAN and East Asia, its Governing Board, Academic Advisory Council,
or the institutions and governments they represent. Any error in content or citation in the
respective chapters is the sole responsibility of the author/s.
Material in this publication may be freely quoted or reprinted with proper acknowledgement.

iii
Preface
Mongolia has achieved remarkably high economic growth. Its average gross domestic product
(GDP) growth rate was 7.2% during the period 2008–2018, the second-fastest amongst East
Asian countries over that period. In 2018, Mongolia’s real GDP per capita amounted to
US$4,017. This strong economic growth from 2008–2018 was accompanied by an increase in
energy consumption in all sectors. With its promising long-term development prospects, the
rise of the country’s energy consumption should continue into the future.
Mongolia has set its Nationally Determined Contribution (NDC) to reduce its total national
greenhouse gas emissions – excluding land use, land use change, and forestry – by 14% by
2030, compared with the projected emissions under the business-as-usual scenario.
Reaching this NDC target would not be possible without improvements in energy efficiency
in all sectors, especially in residential, commercial, industrial, transport, and power
generation.
The Economic Research Institute for ASEAN and East Asia (ERIA) was honoured by the
request to conduct this study on Mongolia’s energy efficiency indicators 2019, which
establishes a solid starting point for further policy measures to improve energy efficiency in
Mongolia. The study has compiled and collected data on energy consumption and sectoral
activities, and defined and estimated energy indicators for the first time. The report shows
that energy efficiency should be a high priority issue on the political agenda.
Mongolia has abundant natural and mineral resources. To efficiently meet most of its daily
energy needs these resources need to be properly developed and managed. Its energy policy
aims to ensure access of its citizens to modern energy services developed on the basis of its
important and high potential renewable energy sources. At the same time, it is developing
infrastructures to optimise the use of its mineral deposits as energy feedstock. Mongolia also
recognises electricity as the main source driving economic development and addresses the
need to generate and distribute more power in terms of greater volume, density, and
reliability.
The increase of energy demand puts pressure on the government to take energy conservation
seriously. Energy efficiency figures prominently in Mongolia’s National Green Development
Plan approved by Parliament in June 2014. For example, the government aims to reduce
greenhouse gas emissions in the energy sector through an increase in energy efficiency of
20% by 2030, whilst seeking to reduce building heat losses by 20% and 40% by 2020 and
2030, respectively.
In the ‘State Policy on Energy 2015–2030’, energy efficiency was one of the three major policy
principles approved by the Government of Mongolia. On 26 November 2015, the Parliament
ratified the Energy Conservation Law, which requires a subset of Mongolia’s electricity and
heat consumers (referred to as ‘designated entities’) to implement activities aimed at
improving energy efficiency.

iv
Energy efficiency indicators are widely considered an important tool for supporting energy
efficiency and conservation policymaking, to design effective policies, and to monitor
progress towards policy objectives.
On behalf of the Ministry of Energy of Mongolia, I would like to thank ERIA for the technical
and financial support for this study on Mongolia’s Energy Efficiency Indicators 2019 Project.
We will continue to work together to build the energy data to support energy policies and
planning in Mongolia.
H.E. N. Tavinbekh Prof. Hidetoshi Nishimura
Minister of Energy Mongolia President
Economic Research
Institute for ASEAN and
East Asia

v
Acknowledgements
We would like to acknowledge with much appreciation the valuable contributions of Shigeru
Kimura, special advisor on energy affairs; Leong Siew Meng, energy efficiency expert for
buildings; Cecilya Malik, energy efficiency expert for industry; Alloysius Joko Purwanto,
energy efficiency expert for transport; and Dewi Anggraini, Wuri Wulandari and Risa Annisa,
assistants from the Economic Research Institute for ASEAN and East Asia (ERIA).
We would also like to thank the head of the energy conservation department, Ts. Atarjargal
from the Energy Regulatory Commission of Mongolia; researcher Sanj Sainzorig of the
Mongolian Energy Economics Institute; the Ministry of Energy of Mongolia; the Energy
Regulatory Commission of Mongolia; the National Statistical Office; Western Electric Power
System; Dornod Electric Power System; Altai-Uliastai Electric Power System; and the
Mongolian Association of Certified Consulting Engineers for their contributions.
Makhbal Tumenjargal
Director, Mongolian Energy Economics Institute (MEEI)

vi
Project Members
Mongolian Energy Economics Institute
• Tumenjargal M., Director of Mongolian Energy Economics Institute
• Enkhtuvshin R., Scientific secretary, Mongolian Energy Economics Institute
• Erdenebat D., Senior of sector, Scientific research, policy and planning department
• Tumurbaatar Sh., Research officer, Mongolian Energy Economics Institute
• Chinsetgel B., Research officer, Mongolian Energy Economics Institute
• Myagmarbaatar D., Research officer, Mongolian Energy Economics Institute
• Sainzorig S., Research officer, Mongolian Energy Economics Institute
Ministry of Energy
• Myagmarsuren M., Adviser to the Minister of Ministry of Energy
• Enkhtaivan G., Head of policy and planning department, Ministry of Energy
• Enkhtuvshin G., Senior specialist at policy and planning department, Ministry of
Energy
Energy Regulatory Commission
• Atarjargal Ts., Head of energy conservation department, Energy regulatory
commission
• Khiimorisaikhan P., Energy conservation specialist, Energy regulatory commission
Mongolian Association of Specialized Consulting Engineers
• Ganchimeg J., Director of training research institute, Mongolian Association of
specialized Consulting Engineers
ERIA Working Team
• Shigeru Kimura, Special Adviser to the President on Energy Affairs, Economic
Research Institute for ASEAN and East Asia (ERIA)
• Dr Alloysius Joko Purwanto, Energy Economist, ERIA
• Ir. Leong Siew Meng, Energy Efficiency and Conservation Expert, Malaysia
• Cecilya Malik, ASEAN Energy Expert, Indonesia

vii
Contents
List of Tables viii
List of Figures x
List of Abbreviations xii
Executive Summary xiii
Chapter 1 Introduction 1
Chapter 2 Outline of Energy Consumption Survey in Mongolia 6
Chapter 3 Residential Sector 19
Chapter 4 Transport Sector 30
Chapter 5 Commercial Sector 45
Chapter 6 Industrial Sector 57
Chapter 7 Electricity, Thermal Energy, and Water Supply Sector 69
Chapter 8 Conclusions 73
References 75
Appendix 77

viii
List of Tables
Table 1-1 Quantity of Mongolia’s Power Generation and Imports₮ 3
Table 2-1 Number of Households in Mongolia’s Provinces 6
Table 2-2 Registered Entities in the Business Register Database, by International Standard Industrial Classification 8
Table 2-3 Cars Included in the Survey, by Engine Displacement 14
Table 2-4 Cars Included in the Survey, by Fuel Type 14
Table 2-5 Types of Industries and Number of Samples Included in the Industry Sector Survey (Energy-Consuming Entities) 16
Table 2-6
Types of Industries and Number of Samples included in the Electricity, Thermal Energy, and Water Supply Sub-sector of the industry Sector Survey (Energy-Transforming Entities) 18
Table 3-1 Number of Households and Type of Dwelling 20
Table 3-2 Household Fuel Consumption 20
Table 3-3 Average Annual Electricity Consumption of Households (kWh/year) 21
Table 3-4 Average Electricity Consumption per Household 22
Table 3-5 Average Total Energy Consumption of Each Urban Household 27
Table 3-6 Average Total Energy Consumption of Each Rural Household 27
Table 3-7 Average Annual Energy Consumption of Each Typical Urban Household in Ulaanbaatar, per household and per floor area comparisons 28
Table 3-8 Average Annual Energy Consumption of Each Typical Rural Household, per household and floor area comparisons 29
Table 3-9 Average Annual Energy Consumption of Herder Households, Intensity per Year 29
Table 4-1 Total Number of Registered Road Vehicles and Those that Passed through Governmental Technical Inspection (2018) 33
Table 4-2 Types of Vehicles that Passed through Technical Inspection (2018) 33
Table 4-3 Main Indicators of Auto Transport 35
Table 4-4 Fuel are Fuel Types in Relation to Road Vehicle Types 36
Table 4-5 Energy Content of Each Fuel Type 36
Table 4-6 Calculated Average Fuel Economies (Fuel Consumption Factors) 36
Table 4-7 Average Trip Distance of Vehicles based on MEEI Survey 37
Table 4-8 Annual Average Mileage for Road Vehicles 37
Table 4-9 Assumed Road Vehicle Fleet Utilisation Rates 38
Table 4-10 Results of Vehicles Survey (Average Value) 39
Table 4-11 Average Aircraft Fuel Consumption Factors 40
Table 4-12 Calculation Results of Road Passenger Mode 41
Table 4-13 Calculation Results of Road Freight Mode (Trucks) 41
Table 4-14 Calculation Results of Rail Passenger Mode 42
Table 4-15 Calculation Results of Rail Freight Mode 42
Table 4-16 Calculation Results of Air Passenger Mode 42
Table 4-17 Comparison of Energy Efficiency of the Transport Sector 43
Table 4-18 Estimated Energy Consumption of the Transport Sector 43
Table 5-1 Energy Consumption of Each Sub-sector (kWh) 46
Table 5-2 Percentage Share of Energy Sources, by Subsector 47
Table 5-3 Average Building Energy Intensity 52

ix
Table 6-1 Energy Consumption in the Industry Sector 60
Table 6-2 Energy Consumption in the Industry Sector (%) 61
Table 6-3 Energy Consumption in the Manufacturing Sector (toe) 62
Table 6-4 Energy Consumption in the Manufacturing Sector (%) 62
Table 6-5 Energy Consumption of the Manufacturing Sector (%) 63
Table 6-6 Energy Intensity 64
Table 6-7 Sales of Manufacturing Sector (million tugrik [₮]) 65
Table 6-8 Energy Consumption in Mining and Quarrying Sub-sector (toe) 65
Table 6-9 Energy Consumption Shares of the Mining and Quarrying Sub-sector (%) 66
Table 6-10 Energy Consumption in Mining and Quarrying Sector, by Sub-sector (%) 66
Table 6-11 Energy Intensity 67
Table 6-12 Mining and Quarrying Sales (million tugrik [₮]) 68
Table 7-1 Energy Consumption in the ETEWS Sector (toe) 70
Table 7-2 Share of Fuel of Energy Consumption in the ETEWS Sector (%) 70
Table 7-3 Share of Energy Consumption by ETEWS Sub-sector (%) 70
Table 7-4 Energy Intensity 71
Table 7-5 Sales of ETEWS Sector (million ₮) 72
Disclaimer: Unless otherwise specified, data from tables are from the results of the survey

x
List of Figures
Figure 1-1 GDP at Current Prices (million tugrik [₮]) 1
Figure 1-2 Historical Trend of Power Generation in Mongolia, by Year 3
Figure 1-3 Mongolia’s Electric Power Systems 5
Figure 2-1 Statistics on Registered Entities in Mongolia 9
Figure 2-2 Share of Sub-sectors in the Industry Sector, by the Number of Entities 10
Figure 2-3 Share of Residential Sector Samples Taken from Ulaanbaatar 13
Figure 2-4 Number and Share of Residential Sector Samples, by Type of Location 14
Figure 2-5 Share of Commercial Sector Samples, by Type of Building 16
Figure 2-6 Share of the Number of Samples in Each Sub-sector in the Industry Sector Survey (Energy-Consuming Entities) 18
Figure 3-1 Pyramid of Residential Indicators 20
Figure 3-2 Average Annual Electricity Consumption of Households (kWh/hh/year) 23
Figure 3-3 Average Annual Electricity Consumption of Appliances in Ulaanbaatar, per Apartment (kWh/year) 23
Figure 3-4 Share of Electricity Usage in a Typical Urban Apartment, by Appliances (%) 24
Figure 3-5 Average Annual Electricity Consumption of Appliances in Ulaanbaatar, per House (kWh/year) 25
Figure 3-6 Share of Electricity Usage in a Typical Urban House, by Appliance (%) 26
Figure 3-7 Average Annual Electricity Consumption of Appliances in Urban Areas, per Ger (kWh/year) 27
Figure 3-8 Share of Electricity Usage in a Typical Urban Ger, by Appliance 28
Figure 3-9 Comparison of Total Average Annual Energy Consumption per Household between Urban and Rural Areasa (KWh/hh/year) 29
Figure 4-1 Pyramid of Passenger Transport Indicators 33
Figure 4-2 Pyramid of Freight Transport Indicators 33
Figure 4-3 Share of Fuel Type Used by Road Vehicles (%) 35
Figure 5-1 Share of Generator Set Installations as the Commercial Sector’s Backup Energy Source 47
Figure 5-2 Restaurants, by Size 49
Figure 5-3 Percentage Share of LPG vs Other Energy Sources Used in Restaurants 49
Figure 5-4 Percentage Breakdowns of Hotel Ratings 50
Figure 5-5 Use of Power Source 50
Figure 5-6 Percentage Share of Electricity Consumption vs Fuel Energy Source Used in Office Buildings 51
Figure 5-7 Use of Backup Gensets in Retail Stores and Shopping Centres 52
Figure 5-8 Hospitals Covered by the Survey 53
Figure 5-9 Percentage Share of Electricity Usage vs Fuel Usage 53
Figure 5-10 Average Building Energy Intensity of Each Sub-sector (kWh/m2/year) 55
Figure 5-11 Average Building Energy Intensity of hotels (kWh/m2/year) 56
Figure 5-12 Average Building Energy Intensity of Shopping Centres and Stores (kWh/m2/year) 56
Figure 5-13 Average Building Energy Intensity of Office Buildings (kWh/m2/year) 57
Figure 5-14 Average Building Energy Intensity of Hospitals (kWh/m2/year) 57
Figure 5-15 Average Building Energy Intensity of Restaurants (kWh/m2/year) 58
Figure 6-1 Pyramid of Industry Indicators 59

xi
Figure 6-2 Pyramid of Freight Transport Indicators 60
Figure 6-3 Industrial Energy Consumption , by Sector 63
Figure 6-4 Consumption of Manufacturing Sector, by Sub-sector 65
Figure 6-5 Consumption of Manufacturing sector, by Fuel Type 65
Figure 6-6 Energy intensity of the Manufacturing Sector (toe/million tugrik [₮]) 66
Figure 6-7 Type of Energy Consumption of the Mining and Quarrying Sector 68
Figure 6-8 Energy Consumption for Mining and Quarrying, by Sub-sector 68
Figure 6-9 Energy Intensity of the Mining and Quarrying Sector, by Sub-sector (toe/million tugrik [₮]) 69
Figure 7-1 Energy Consumption in the ETEWS Sector, by Energy Type and Sub-sector 71
Figure 7-2 Energy Intensity (toe/million ₮) 72
Disclaimer: Unless otherwise specified, data from figures are from the results of the survey

xii
List of Abbreviations and Acronyms
AUEPS Altai-Uliastai Electric Power System
BEI building energy intensity
CHP combined heat and power
EEC
EEI
energy efficiency and conservation
energy efficiency indicator
EPS electric power system
ERC Energy Regulatory Commission
ERIA
ETE
Economic Research Institute for ASEAN and East Asia
electricity and thermal energy
ETEWS electricity, thermal energy, and water supply
GCal gigacalorie
GDP gross domestic product
MEEI Mongolian Energy Economics Institute
PPS
₮
photovoltaic power station
‘Tugrik’: Mongolian currency
toe tonne of oil equivalent
TPP thermal power plant
xiii
Executive Summary
Mongolia achieved high and stable economic growth from 2008–2018. Energy consumption,
especially of conventional energy – such as coal, oil, and electricity – increased significantly as a result.
The Government of Mongolia recognises the importance of an energy efficiency and conservation
(EEC) policy for the future. As it does not have benchmarks for the current energy efficiency level in
the country, the Mongolian Energy Economics Institute (MEEI), a member of the Energy Research
Institute Network (ERIN) of the East Asia Summit, requested the support of the Economic Research
Institute for ASEAN and East Asia (ERIA) to produce energy efficiency indicators (EEIs). These are to
serve as benchmarks in Mongolia’s final energy consumption sectors comprising industry (production
of industrial products), transport (transport of passengers or freight from point A to point B),
commercial buildings and the residential sector.
Phase 1 involved ERIA inviting several MEEI staff members to the ERIA office for capacity building
training on basic EEI concepts in June 2018. Lecturers were experts from ERIA, Indonesia, Malaysia,
and Thailand. ERIA emphasised that when the MEEI produces EEIs – not energy intensity – a detailed
energy consumption survey of each final energy sector is needed. ERIA committed financial and
technical assistance to the MEEI in the understanding that the latter will produce the country’s EEIs
during phase 2.
Phase 2 started in July 2019. The ERIA team, comprising four energy efficiency experts on the
residential and commercial, transport, and industry sectors and on EEIs, visited the MEEI office in
Ulaanbaatar, Mongolia for detailed discussions with MEEI staff on sampling methodology,
questionnaires, expected EEI for each final sector, etc. Following this meeting, MEEI staff conducted
a survey on actual energy consumption with remote technical support from the ERIA team. This report
mainly described the survey results. Despite the lack of experience of MEEI staff to conduct energy
consumption surveys (this being the first time for the institute) and limited sample numbers, the MEEI
obtained several significant results from the survey.
The residential sector has two types of energy use: (i) space heating and cooking, and (ii) electricity
such as for lighting, TV, and refrigeration. For space heating and cooking, coal and biomass are the
main fuel in rural and herder areas. Households in urban areas use less coal and biomass compared
with rural and herder areas. Stand-alone houses consume most electricity followed by apartments
and gers (Mongolia’s traditional dwellings). End-use of electricity in urban areas depends on the type
of house. Many stand-alone houses in urban areas consume electricity for space heating, followed by
cooking, refrigerator, and water heating. Apartments in urban areas consume electricity for cooking,
refrigeration, and water heating. Gers in urban areas show an end-use pattern of electricity
consumption similar to that of apartments. Urban households are shifting from coal and biomass to
electricity, including for space heating. On the other hand, rural and herder areas still depend on
traditional fuels, such as coal and biomass. Looking at the EEI in the residential sector, defined as
energy consumption per floor area (kWh/m2/year), stand-alone houses are most efficient (201.4
kWh/m2/year), followed by apartments (278.7), and gers (313) in urban areas. Other areas show the
same trend. This indicator consists of electricity and heat from coal and biomass, and heat demand is
much higher than that for electricity. Heat demand is around two to four times higher than that for
electricity, and it depends on the type of house. If we compare the indicators for urban and rural areas,
those for rural areas tend to be higher.

xiv
This survey covers only the road transport sector, i.e. cars, buses, taxis, and trucks. In terms of fuel
consumption, taxis are most efficient at 8.0 litre/100 km, followed by cars (10.3) and buses (35.4).
Regarding travel distance, buses are highest at 241 km/day, followed by taxis (234), and cars (49.4).
Comparing efficiency of rail and road using tonne of oil equivalent (toe)/passenger and tonne km, that
of rail is much higher than road and is consistent globally.
The industry sector uses both coal and electricity for its energy needs, but coal is dominant. The sector
is made up mostly of the manufacturing and the mining sectors. The energy indicators of the
manufacturing sector are larger than those of the mining sector, 275.31 toe/million US$ and 11.02
toe/million US$, respectively. The manufacturing sector mainly consists of food, construction
materials such as cement, basic metals, and others. Metal and cement consume a lot of coal for
heating – their energy indicators are 172.9 toe/million U$ and 98.03 toe/million U$, respectively,
which is much higher than for food and others.
The commercial sector consists of five building types – hotels, offices, restaurant, shopping malls, and
hospitals. From the survey results the MEEI obtained the following energy indicators: 865
kWh/m2/year for hotels, 495 for offices, 808 for restaurants, 591 for shopping malls, and 682 for
hospitals. The order of the energy indicators by building type is appropriate but the absolute values
of energy indicators are much higher than for ASEAN countries. Despite the difference in climate and
environment between Mongolia and the ASEAN region – heating energy demand is dominant in
Mongolia but cooling demand is in the ASEAN region – the values of energy indicators by building type
are too high. Appropriate and implementable energy efficiency policies and action plans will be
needed, therefore, to mitigate energy consumption in the commercial sector, especially electricity
consumption.
The detailed energy consumption survey for Mongolia, implemented by the MEEI with the support of
ERIA, has been successful as several meaningful EEIs were extracted from it. But the MEEI needs to
improve its capacities to be able to better analyse the sample data generated through the survey. Such
analysis would include an assessment of possible bias that may be present in the sampled data
(overestimation or underestimation), finding outliers to produce more appropriate EEIs, gaining a
correct understanding of actual energy usage in the final sectors, and gaining an exact understanding
of the meaning of EEIs. The MEEI’s capacities will be upgraded through repeatedly undertaking energy
consumption surveys and through training to be provided by the countries of the Organisation for
Economic Co-operation and Development, such as Japan, and international organisations such as the
Asian Development Bank and ERIA.
Finally, ERIA suggests that the MEEI repeats this survey every 3 or 5 years and analyses the historical
trend of the EEIs for each final sector. Regularly repeating the survey is essential for promoting
appropriate energy efficiency and conservation polices to mitigate energy consumption in Mongolia
– especially of coal, oil, and electricity.

1
Chapter 1
Introduction
1. Mongolia’s Current Socioeconomic Situation
By administrative division, Mongolia is divided into 21 aimags (or provinces), 330 soums,
1,618 baghs (aimags consist of soums, soums consist of baghs), and a capital city which has 9
districts and 152 khoroos (districts consist of khoroos).
Mongolia has an area of 15,641,000 square kilometres. In 2018, the population density was
2.1 persons per square kilometre (km2) nationwide, whilst it was 317.3 persons/km2 in
Ulaanbaatar city.
The total population of Mongolia in 2018 was 3.2 million, increased by 0.8 million or 34.8%
from 2000. Average annual population growth was 1.9% for the period 2000–2018.
In 2018, there were 8.945 million households in Mongolia, which was an increase by 89,000
households or 1% compared to the previous year; 43.3% of these households lived in
Ulaanbaatar city. Each household has an average of 3.6 persons.
Mongolia’s gross domestic product (GDP) reached 32.3 trillion tugrik (₮) in 2018, which
constituted an increase of 15.9% from the previous year (Figure 1-1). The industry sector’s
share in GDP was 41.9%; agriculture, 10.7%; and service sector’s share, 47.4%.
Figure 1-1 GDP at Current Prices (million tugrik [₮])
Source: National statistical office of Mongolia (2018b).
Mongolia’s mining and quarrying sub-sector’s share in total exports is about 80%. In 2018,
51.4 million tonnes of coal were extracted, of which 36.3 million tonnes were exported; 20.7
tonnes of gold were extracted, of which 3.4 tonnes were exported; and 1.3 million tonnes of
copper ore were extracted, and 1.4 million tonnes were exported. Compared to 2000, the
1.2
24
.06
2,1
1.3
91
.87
8,2
1.5
50
.60
9,9
1.8
29
.07
2,2
2.3
61
.15
6,9
3.0
41
.40
5,7
4.0
27
.55
8,6
4.9
56
.64
7,2
6.5
55
.56
9,4
6.5
90
.63
7,1
9.7
56
.58
8,4
13
.17
3.7
63
,4
16
.68
8.4
19
,6
19
.17
4.2
42
,6
22
.22
7.0
54
,3
23
.15
0.3
85
,6
23
.94
2.8
66
,4
27
.87
6.2
97
,2
32
.30
7.3
29
,5
2 0 0 0 2 0 0 1 2 0 0 2 2 0 0 3 2 0 0 4 2 0 0 5 2 0 0 6 2 0 0 7 2 0 0 8 2 0 0 9 2 0 1 0 2 0 1 1 2 0 1 2 2 0 1 3 2 0 1 4 2 0 1 5 2 0 1 6 2 0 1 7 2 0 1 8

2
quantity of extracted coal had risen twice; copper ore, by 2.5 times; gold, by 3.4; and oil, by
2.9 times in 2018.
The share of sub-sectors in the service sector by contribution to GDP was: trade, 34.5%; real
estate activities, 11.8%; finance and insurance, 11%; transport, 9.8%; public administration,
7.9%; education, 7.7%; information and communications, 4.6%; health, 3.4%; other services,
9.4%.
In 2018, 69.9 million tonnes of goods were transported by all types of transport, which was
an increase of 15.9 tonnes or 29.5% from 2017. Goods transported by road increased by 12.9
tonnes or 41.4% compared to the previous year. This increase was largely due to the increase
in mining products. Road transport accounted for 63.1% of all goods transported, whilst rail
transport accounted for 36.9%. In 2018, 200.4 million people were transported – 98.2% by
road, 1.3% by rail, and 0.5% by air.
In 2018, the revenues of Mongolia’s transport sector were ₮1,686.4 billion, of which 37.2%
were from road transport; 36.5%, from rail transport; and 26.2%, from air transport.
2. Energy Consumption Trend
Out of 330 soums in Mongolia, 329 soums are connected to the electrical grid, and 1 soum is
being supplied by electric power from a combined renewable energy and diesel source. Also,
81.2% of herder families use electric power from their portable solar PV systems. Currently,
97% of all consumers have uninterrupted power source.
In recent years, the share of renewable energy in Mongolia’s energy mix has increased (in
2019 total installed capacity of renewable energy sources was 238 MW), which is in line with
the world’s energy development trend.
Mongolia’s total installed capacity (not including diesel generators) is 1,328.8 MW. In 2018,
electric power generation was 6,624.8 million kWh, which was an increase of 8.8% from
2017. Thermal energy production was 94.251 million gigacalorie (GCal), which was an
increase of 4.485 million GCal or 5% from the previous year. Domestic power generation
accounted for 80% of total consumption, whilst 20% or 1,683.6 million kWh were imported
from the neighbouring countries.

3
Figure 1-2. Historical Trend of Power Generation in Mongolia, by Year
Source: Energy regulatory commission (2018).
Table 1-1 shows electric power generated and imported in Mongolia in the 2014 – 2018
period. It illustrates that the total generation of electric power had increased every year as
the country developed and the economy and population grew.
Table 1-1. Quantity of Mongolia’s Power Generation and Imports Indicators Unit 2014 2015 2016 2017 2018
Total consumption million kWh 6,788.9 6,935.5 7,221.4 7,611.6 8,308.3
From domestic generation million kWh 5,392 5,541.7 5,802.4 6,089.1 6,624.8
From imported EP million kWh 1,396.9 1,393.8 1,419.1 1,522.5 1,683.6
Share of imports percent 25.91 20.10 19.65 20 20.26
Source: Energy Regulatory Commission (2018).
3. About Mongolia’s Energy Conservation and Efficiency Policy
Energy consumption of Mongolia significantly grew in 2000–2018. To mitigate the
consumption, Mongolia must start and implement an energy efficiency and conservation
(EEC) policy. In this regard, the Mongolian Energy Economics Institute (MEEI), with the
support of ERIA, started producing the EEIs by sector as benchmarks.
Mongolia’s energy law was first approved in 2001 and amended in 2015.
Mongolia’s State Great Khural (Parliament) approved a renewable energy law in 2007, which
was amended in 2015 and 2019. This law provided Mongolia with a legal framework to create
a competitive market of renewable energy.
0
1.000
2.000
3.000
4.000
5.000
6.000
7.000
2000200120022003200420052006200720082009201020112012201320142015201620172018
Mill
ion
, kW
h

4
The State Great Khural, in 2015, adopted Resolution Number 63, ‘The State Policy on Energy
Sector for 2015–-2030. In 2018, it also approved the ‘Medium-term Programme for
Implementing the State Policy on the Energy Sector’ to ensure the realisation of the policy.
The energy conservation law of 2015, intended to regulate activities related to energy
conservation and efficient use, has provided a legal framework to implement a policy aimed
at improving the efficiency of energy use; creating a culture of energy conservation; and
introducing technologies that are highly productive, environment friendly, and efficient.
The government’s action plan for 2016–2020, sub-clause number 2.108, states: ‘Certain
measures, projects and programmes aimed at improving energy conservation and efficiency,
reducing transmission losses, and introducing innovation level new technologies and
equipment will be implemented’. Based on this plan and with a goal to accelerate the
implementation of the energy conservation law, the parliament approved in 2017 the
‘National Energy Conservation Programme for 2018–2022’ by its Resolution number 247.
Works are being done according to this programme.
4. Mongolia’s Electricity Consumption, by Province
Mongolia has four independent electric power systems (EPSs): Western EPS, Altai-Uliastai
EPS (AUEPS), Western EPS, and Central EPS. Also, it has diesel generator plants and
renewable energy sources that are not connected to any of these systems.

5
Figure 1-3 Mongolia’s Electric Power Systems
Source: Gansukh (2015).
Uvs, Khovd, and Bayan-Ulgii provinces are connected to the Western EPS, which annually
consumes 162 million KWh with a load of 32 BW. Western EPS operates based on imports
from the connection with Krasnoyarskaya EPS of Russia and 12 MW capacity of Durgun
Hydropower Plant.
Zavkhan and Gobi-Altai provinces are connected to the AUEPS, which has an annual
consumption of 75.7 million KWh with a load of 15 BW. The AUEPS operates on 12 MW
capacity of the Taishir Hydropower Plant and the diesel generator plants of Uliastai and
Yesunbulag.
Fourteen provinces of Khangai, Central and Southern region are connected to the Central
EPS, which has an annual consumption of 6.3 billion kWh with a peak load of 1,117 MW (+150
MW of Oyu Tolgoi). Ulaanbaatar city’s second, third, and fourth combined heat and power
(CHP) thermal power plants (TPPs), Darkhan city’s CHP TPP, Erdenet city’s CHP TPP,
Dalanzadgad’s condensing power plant (CPP), Ukhaakhudag’s CPP, Salkhit wind farm, Tsetsii
wind farm, Sainshand wind farm, Nar Photovoltaic Power Station (PPS), Monnar PPS,
Naranteeg PPS, Khushig PPS, and Sumber PPS operate in the Central EPS with a combined
capacity of 1,281.8 MW. The Central EPS is connected to the Buryatia EPS of Russia via a 220
kV line, importing and exporting power as needed.
Oyu Tolgoi mine’s electric power consumption is being supplied by electric power imported
from China.
Dornod and Sukhbaatar provinces are connected to the Eastern EPS, which annually
consumes 199.4 million kWh with a load of 36 MW. The Eastern EPS operates based on 36
MW capacity of the Dornod CHP TPP.
Western EPS Central EPS Eastern EPS
Altai-Uliastai EPS

6
Chapter 2
Outline of Energy Consumption Survey in Mongolia
1. Current Situation of Each Sector
1.1. Residential sector
In terms of the highest level of administrative division unit, Mongolia is divided into 21
provinces and the capital city Ulaanbaatar. In 2018, Mongolia had 894,496 households, of
whom 44% or 387,453 households lived in Ulaanbaatar city and 56% or 507,043 households
lived in the rest of the country. A total of 605,796 households (or 67.7% of the country’s
total) lived in permanent dwellings, whilst 288,700 households (or 32.3% of the country’s
total) were herder families with portable homes. These portable homes are Mongolian
traditional dwellings called ger. Gers use a stove, which burns wood, coal, dry dung fuel, etc.,
for space heating and cooking. They are also used as permanent dwellings by some residents
of the cities who are not herders. Moreover, many residents of the cities live in standalone
houses with a stove as a means of space heating. Other types of space heating are district
heating, low-pressure boilers, and electric heaters. In terms of type of space heating, 69.9%
of Mongolia’s total households live in gers and houses with stove heating; 27.5% live in
houses and apartments with district heating; 2% live in houses and apartments with a low-
pressure boiler heating; and 0.6% live in dwellings with electric heating systems. Table 2-1
shows the number of households in each province and in Ulaanbaatar city.
Table 2-1. Number of Households in Mongolia’s Provinces and Ulaanbaatar Provinces/Capital 2000 2005 2010 2015 2018 Percentage
Total 553,990 611,026 742,274 859,106 894,496 100 Western region
Bayan-Ulgii 20,805 21,328 20,696 23,082 24,306 Uvs 20,713 19,800 19,732 21,212 22,047 Khovd 18,505 19,478 20,299 21,706 22,863 69,216 7.73
Altai-Uliastai region Gobi-Altai 15,351 15,473 15,683 16,072 16,711 Zavkhan 21,992 19,929 20,079 20,695 21,785 38,586 4.31
Khangai region Bayankhongor 20,909 20,935 23,157 24,821 26,643 Arkhangai 25,612 24,276 26,452 26,727 27,912 Uvurkhangai 29,489 28,793 32,646 33,438 34,652
89,207 9.97
Central region Khuvsgul 29,595 29,655 35,105 37,773 39,449 Selenge 21,757 22,193 28,416 29,316 30,123 Darkhan-Uul 18,500 22,238 28,340 29,971 30,503 Orkhon 17,315 20,870 24,334 28,089 28,959 Bulgan 15,931 15,016 16,786 18,479 19,072 Tuv 23,678 23,309 26,635 28,622 30,509 17,8615 19.9
Eastern region
7
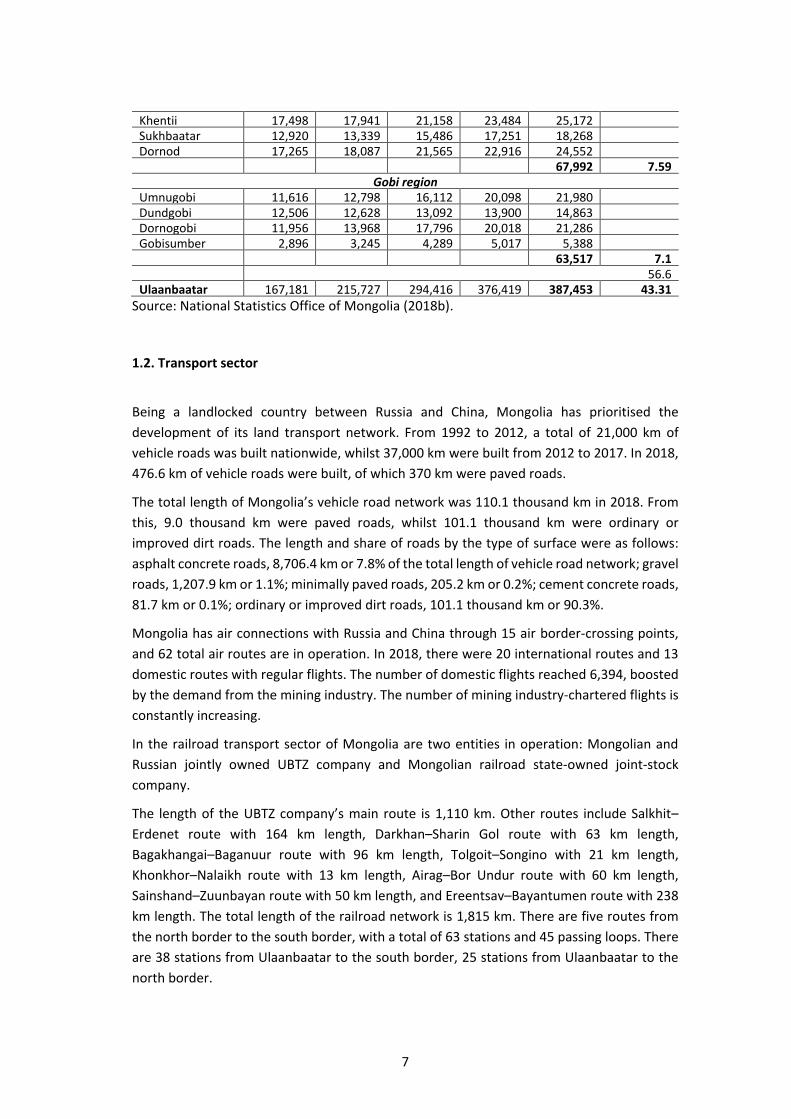
Khentii 17,498 17,941 21,158 23,484 25,172 Sukhbaatar 12,920 13,339 15,486 17,251 18,268 Dornod 17,265 18,087 21,565 22,916 24,552 67,992 7.59
Gobi region Umnugobi 11,616 12,798 16,112 20,098 21,980 Dundgobi 12,506 12,628 13,092 13,900 14,863 Dornogobi 11,956 13,968 17,796 20,018 21,286 Gobisumber 2,896 3,245 4,289 5,017 5,388 63,517 7.1 56.6 Ulaanbaatar 167,181 215,727 294,416 376,419 387,453 43.31
Source: National Statistics Office of Mongolia (2018b).
1.2. Transport sector
Being a landlocked country between Russia and China, Mongolia has prioritised the
development of its land transport network. From 1992 to 2012, a total of 21,000 km of
vehicle roads was built nationwide, whilst 37,000 km were built from 2012 to 2017. In 2018,
476.6 km of vehicle roads were built, of which 370 km were paved roads.
The total length of Mongolia’s vehicle road network was 110.1 thousand km in 2018. From
this, 9.0 thousand km were paved roads, whilst 101.1 thousand km were ordinary or
improved dirt roads. The length and share of roads by the type of surface were as follows:
asphalt concrete roads, 8,706.4 km or 7.8% of the total length of vehicle road network; gravel
roads, 1,207.9 km or 1.1%; minimally paved roads, 205.2 km or 0.2%; cement concrete roads,
81.7 km or 0.1%; ordinary or improved dirt roads, 101.1 thousand km or 90.3%.
Mongolia has air connections with Russia and China through 15 air border-crossing points,
and 62 total air routes are in operation. In 2018, there were 20 international routes and 13
domestic routes with regular flights. The number of domestic flights reached 6,394, boosted
by the demand from the mining industry. The number of mining industry-chartered flights is
constantly increasing.
In the railroad transport sector of Mongolia are two entities in operation: Mongolian and
Russian jointly owned UBTZ company and Mongolian railroad state-owned joint-stock
company.
The length of the UBTZ company’s main route is 1,110 km. Other routes include Salkhit–
Erdenet route with 164 km length, Darkhan–Sharin Gol route with 63 km length,
Bagakhangai–Baganuur route with 96 km length, Tolgoit–Songino with 21 km length,
Khonkhor–Nalaikh route with 13 km length, Airag–Bor Undur route with 60 km length,
Sainshand–Zuunbayan route with 50 km length, and Ereentsav–Bayantumen route with 238
km length. The total length of the railroad network is 1,815 km. There are five routes from
the north border to the south border, with a total of 63 stations and 45 passing loops. There
are 38 stations from Ulaanbaatar to the south border, 25 stations from Ulaanbaatar to the
north border.
8
1.3. Commercial sector
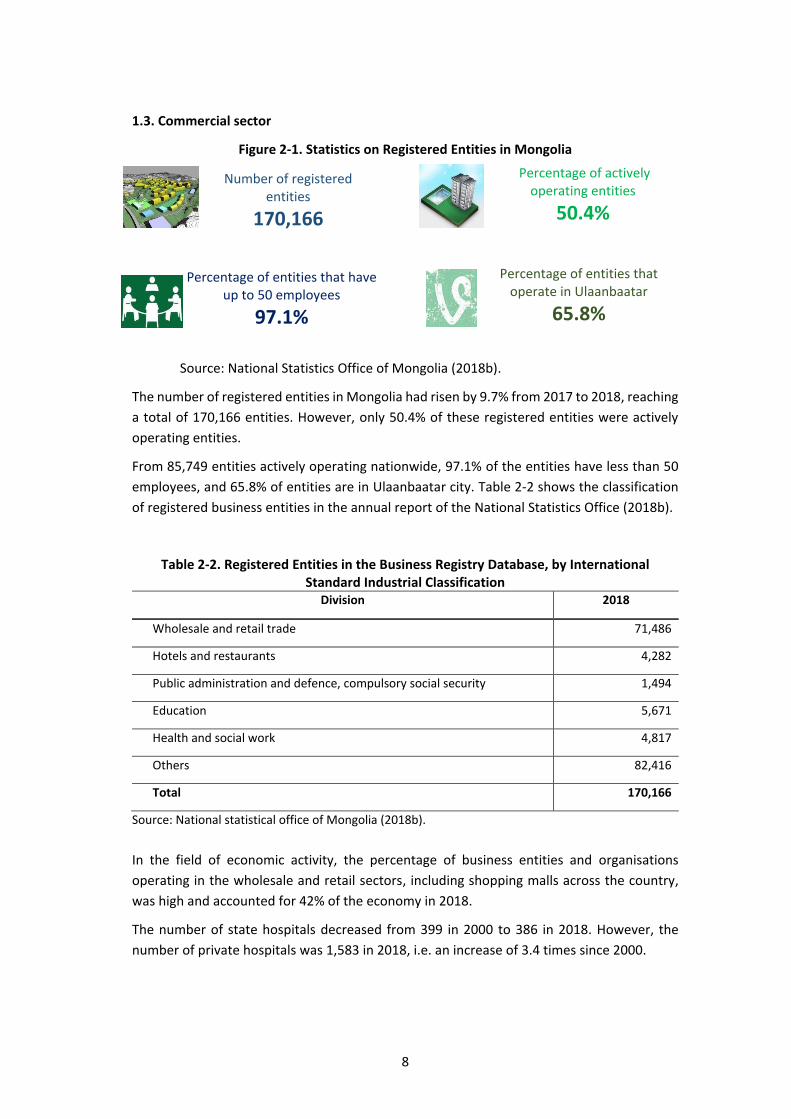
Figure 2-1. Statistics on Registered Entities in Mongolia
Source: National Statistics Office of Mongolia (2018b).
The number of registered entities in Mongolia had risen by 9.7% from 2017 to 2018, reaching
a total of 170,166 entities. However, only 50.4% of these registered entities were actively
operating entities.
From 85,749 entities actively operating nationwide, 97.1% of the entities have less than 50
employees, and 65.8% of entities are in Ulaanbaatar city. Table 2-2 shows the classification
of registered business entities in the annual report of the National Statistics Office (2018b).
Table 2-2. Registered Entities in the Business Registry Database, by International Standard Industrial Classification
Division 2018
Wholesale and retail trade 71,486
Hotels and restaurants 4,282
Public administration and defence, compulsory social security 1,494
Education 5,671
Health and social work 4,817
Others 82,416
Total 170,166
Source: National statistical office of Mongolia (2018b).
In the field of economic activity, the percentage of business entities and organisations
operating in the wholesale and retail sectors, including shopping malls across the country,
was high and accounted for 42% of the economy in 2018.
The number of state hospitals decreased from 399 in 2000 to 386 in 2018. However, the
number of private hospitals was 1,583 in 2018, i.e. an increase of 3.4 times since 2000.
Number of registered entities
170,166
Percentage of entities that have up to 50 employees
97.1%
Percentage of actively operating entities
50.4%
Percentage of entities that operate in Ulaanbaatar
65.8%
9
In 2018, 803 secondary schools were active: 80 (10%) elementary schools, 115 (14.3%)
secondary schools, 563 (70.1%) high schools, and 45 (5.6%) comprehensive schools. State-
owned schools total 81.7% and 18.3% are private schools.
As of 2018, 85,749 entities were actively operating according to the Statistical Business
Registry database (National Statistics Office of Mongolia, 2018b); 2,410 or 2.8% were actively
operating in the hotel, accommodation, and catering services.
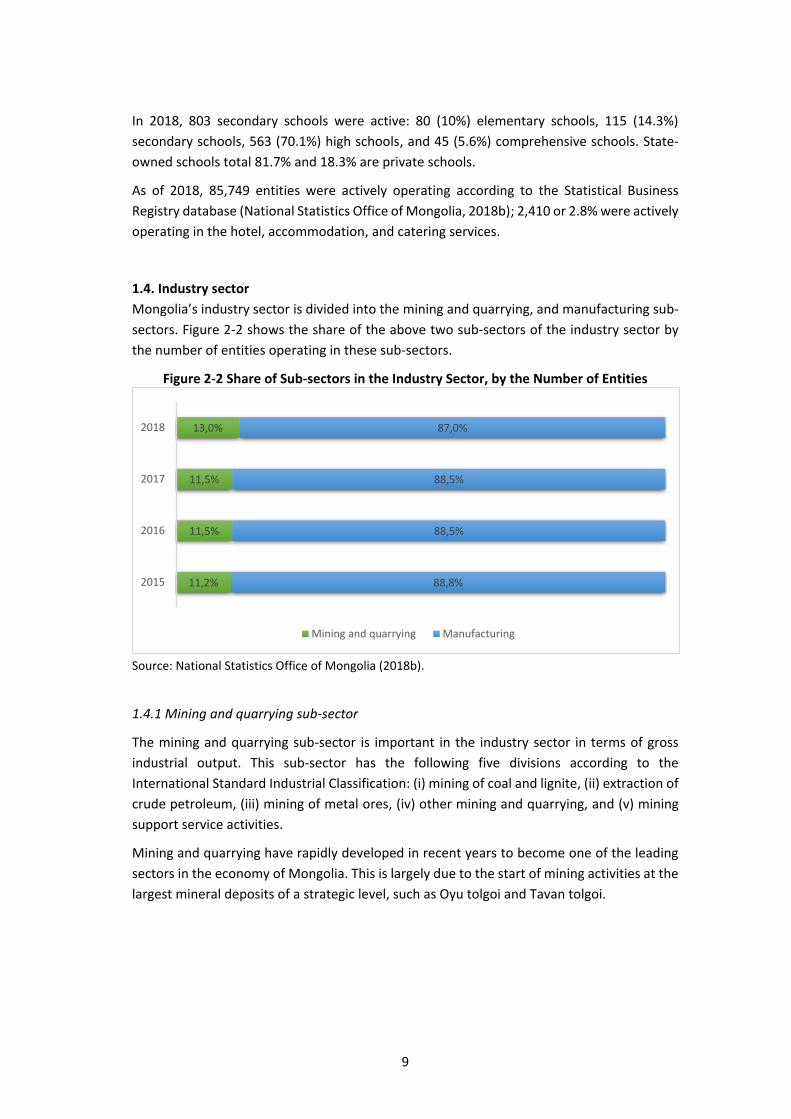
1.4. Industry sector
Mongolia’s industry sector is divided into the mining and quarrying, and manufacturing sub-
sectors. Figure 2-2 shows the share of the above two sub-sectors of the industry sector by
the number of entities operating in these sub-sectors.
Figure 2-2 Share of Sub-sectors in the Industry Sector, by the Number of Entities
Source: National Statistics Office of Mongolia (2018b).
1.4.1 Mining and quarrying sub-sector
The mining and quarrying sub-sector is important in the industry sector in terms of gross
industrial output. This sub-sector has the following five divisions according to the
International Standard Industrial Classification: (i) mining of coal and lignite, (ii) extraction of
crude petroleum, (iii) mining of metal ores, (iv) other mining and quarrying, and (v) mining
support service activities.
Mining and quarrying have rapidly developed in recent years to become one of the leading
sectors in the economy of Mongolia. This is largely due to the start of mining activities at the
largest mineral deposits of a strategic level, such as Oyu tolgoi and Tavan tolgoi.
11,2%
11,5%
11,5%
13,0%
88,8%
88,5%
88,5%
87,0%
2015
2016
2017
2018
Mining and quarrying Manufacturing

10
1.4.2 Manufacturing sub-sector
The country’s manufacturing sub-sector is divided into the following:
• Manufacture of food products
• Manufacture of beverages
• Manufacture of tobacco products
• Manufacture of textiles
• Manufacture of wearing apparel
• Manufacture of leather and related products
• Manufacture of wood and cork products, except furniture
• Manufacture of paper and paper products
• Manufacture of printing and reproduction of recorded media
• Manufacture of coke and refined petroleum products
• Manufacture of chemicals and chemical products
• Manufacture of pharmaceuticals, medicinal chemical and botanical products
• Manufacture of rubber and plastics products
• Manufacture of other non-metallic mineral products
• Manufacture of basic metals
• Manufacture of fabricated metal products, except machinery and equipment
• Manufacture of computer, electronic and optical products
• Manufacture of electrical equipment
• Manufacture of machinery and equipment n.e.c.
• Manufacture of motor vehicles, trailers and semi-trailers
• Manufacture of other transport equipment
• Manufacture of furniture
• Other manufacturing
• Repair and installation of machinery and equipment
2.1.5 Electricity, thermal energy, and water supply (ETEWS) sector
This sub-sector has the following divisions:
• Electric power generation
• Thermal energy generation
• Water supply activities

11
In 2018, 8.2 billion kWh of electric power was consumed, of which 6.5 billion kWh (or 79.7%
of total) was generated domestically and 1.7 billion kWh (or 20.3% of total) was imported
from China and Russia.
From the total number of electric power consumers, 52,200 (or 7.6%) are entities and
633,100 (or 92.4%) are households. A total of 41,300 entities (79.2% from total entities that
consume electric power) get their electric power from the Central Electric Power System
(EPS), 4,600 (or 8.8%) from the WEPS, 2,200 (or 4.2%) from the Eastern EPS, 1,900 (or 3.7%)
from the Southern EPS, and 2,100 (or 4.1%) from the Altai-Uliastai EPS (AUEPS).
In 2018, a total of 12.5 million gigacalorie (GCal) of thermal energy was generated, which was
an increase of 1.2 million GCal or 10.7% from 2017. Entities and households consumed 10.6
million GCal (85.1% from total) produced in 2018 were consumed by entities and households,
whilst 1.38 million GCal (or 11.0% from total) were consumed by CHP thermal power plants
(TPPs) for internal use and 0.5 million GCal (or 3.9%) were lost in transmission and
distribution.
From the total number of consumers of thermal energy from CHP TTPs, 25,200 (or 7.7%) are
entities and 300,300 (or 92.3%) are households. From the total number of entities that get
their thermal energy from CHP TPPs, 14,800 (or 58.7%) are in Ulaanbaatar city; 1,800 (or
7.1%) are in Darkhan-Uul province; 1,400 (or 5.5%) are situated in Orkhon province; 1,000
(or 4.0%) are in Dornogobi province; 800 (or 3.2%) are in Dornod province; the remaining
5,400 (or 21.5%) are situated elsewhere.
In 2018, gross industrial output of water supply and sewerage and waste management
remediation activities amounted to ₮0.4 trillion.
In terms of the share of sub-activities by their gross industrial output, in 2018, water
accumulation, purification, and supply activities had a share of 63.8%; waste collection and
processing activities had a share of 35.3%; wastewater collection and treatment activities
had a share of 0.5%; and other waste management activities and remediation activities had
a share of 0.4%.
2. Implementation of the Survey by Each Sector
To determine Mongolia’s energy efficiency indicators (EEIs), an energy consumption survey
covering the whole country was conducted in 2018–2019 with the technical assistance of the
Economic Research Institute for ASEAN and East Asia (ERIA). Through this survey, the actual
energy consumption in each final energy consumption sector – consisting of industry,
transport especially road, and the residential and commercial sectors – is extracted. Based
on the survey results, the country’s EEIs are estimated as benchmarking numbers of each
sector. The major points of this survey focused on how and how much each sector used
energy, i.e. the end-use energy consumption amounts.

12
A total of 800 samples were taken from four sectors: residential (400), commercial (200),
industry (100), and transport (200).
The survey was conducted by the employees of MEEI, as well as some contractor
organisations: Western EPS, AUEPS, Eastern EPS, and Mongolian association of specialised
consulting engineers. The MEEI employees travelled to Darkhan, Erdenet cities and locations
in 14 different provinces, in addition to conducting a survey in Ulaanbaatar.
2.1. Residential sector sample survey
From a total of 400 samples taken from the residential sector, as shown in Figure 2-3, 140
samples (or 35% from total) were taken from Ulaanbaatar and 260 samples (or 65%) were
taken from the rest of the country.
Figure 2-3 Share of Residential Sector Samples Taken from Ulaanbaatar
Source: MEEI’s survey.
Based on energy consumption characteristics, Mongolia’s total territory was divided into the
following six regions:
• Western region (which included Bayanulgii, Uvs, Khovd provinces)
• Altai-Uliastai region (which included Gobi-Altai, Zavkhan provinces)
• Khangai region (which included Bayankhongor, Uvurkhangai, Arkhangai provinces)
• Central and northern region (which included Khuvsgul, Bulgan, Orkhon, Selenge,
Darkhan-Uul, Tuv provinces)
• Eastern region (which included Khentii, Dornod, Sukhbaatar provinces)
• Gobi region (which included Umnugobi, Dornogobi, Dundgobi, Gobisumber provinces)
By type of location, the households were divided into three categories: urban, rural, and
herder. Urban households are located in Ulaanbaatar city. Rural households are in provincial

13
and soum centres. Urban and rural households have permanent dwellings. Herder
households are located in pasturelands of various provinces. They do not have a permanent
place of living. They move their mobile homes (ger) with their livestock whenever there is a
need to move to another pastureland.
The survey conducted was on electricity, heat, and other fuel consumption such as wood, dry
dung, coal, etc. The survey also included information on electric appliances of houses,
apartments and gers.
As shown in the Figure 2-4, on the number of samples, 140 samples were from urban
households; 200, from rural households; and 60, from herder households.
Figure 2-4 Number and Share of Residential Sector Samples, by Type of Location
Source: MEEI.
2.2. Transport sector sample survey
The sample survey was conducted on 170 road vehicles, 20 locomotives, 11 aircraft, and 2
ships. Questionnaires asked information on vehicle model, engine capacity, age, standard
fuel consumption, winter and summer fuel consumption, unloaded fuel consumption, daily
and monthly travel distance, etc.
Road vehicles were divided into the following three categories:
• Cars (with 55 samples)
• Buses (with 45 samples)
• Trucks (with 70 samples)
The 55 car samples were manufactured in Russia, Republic of Korea (henceforth Korea), and
Japan, with vehicles aged 4–30 years.
14
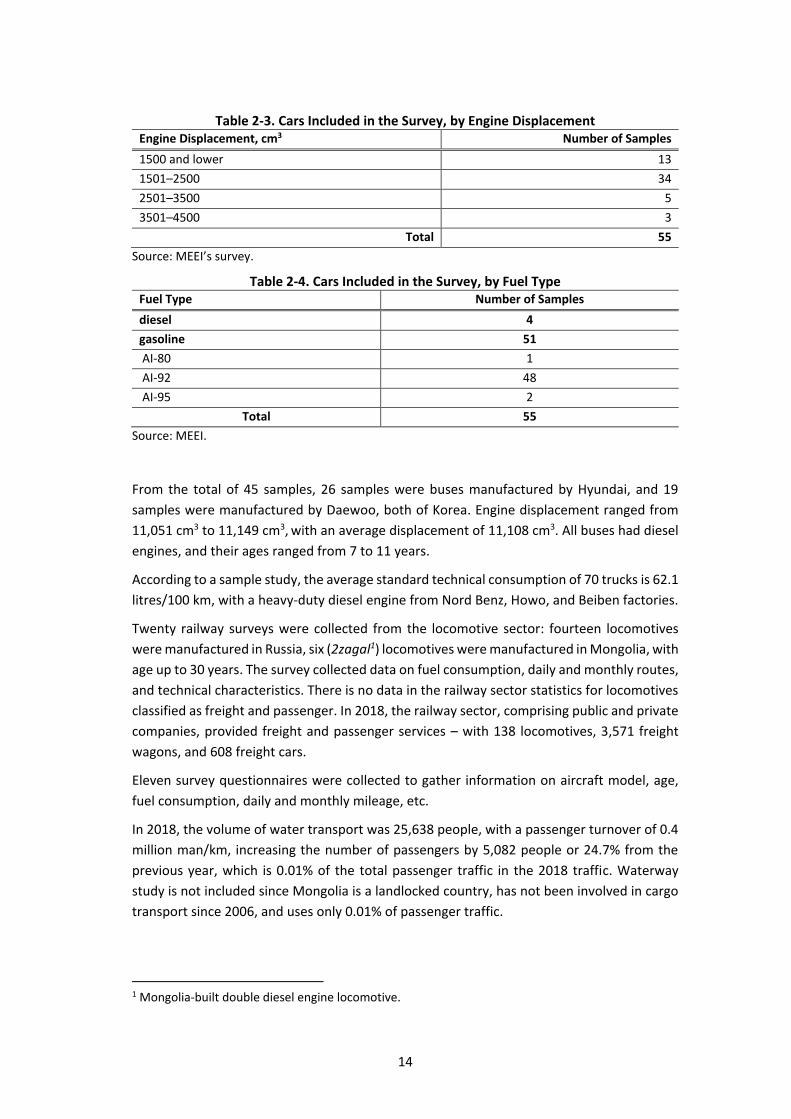
Table 2-3. Cars Included in the Survey, by Engine Displacement Engine Displacement, cm3 Number of Samples
1500 and lower 13
1501–2500 34
2501–3500 5
3501–4500 3
Total 55
Source: MEEI’s survey.
Table 2-4. Cars Included in the Survey, by Fuel Type Fuel Type Number of Samples
diesel 4
gasoline 51
AI-80 1
AI-92 48
AI-95 2
Total 55
Source: MEEI.
From the total of 45 samples, 26 samples were buses manufactured by Hyundai, and 19
samples were manufactured by Daewoo, both of Korea. Engine displacement ranged from
11,051 cm3 to 11,149 cm3, with an average displacement of 11,108 cm3. All buses had diesel
engines, and their ages ranged from 7 to 11 years.
According to a sample study, the average standard technical consumption of 70 trucks is 62.1
litres/100 km, with a heavy-duty diesel engine from Nord Benz, Howo, and Beiben factories.
Twenty railway surveys were collected from the locomotive sector: fourteen locomotives
were manufactured in Russia, six (2zagal1) locomotives were manufactured in Mongolia, with
age up to 30 years. The survey collected data on fuel consumption, daily and monthly routes,
and technical characteristics. There is no data in the railway sector statistics for locomotives
classified as freight and passenger. In 2018, the railway sector, comprising public and private
companies, provided freight and passenger services – with 138 locomotives, 3,571 freight
wagons, and 608 freight cars.
Eleven survey questionnaires were collected to gather information on aircraft model, age,
fuel consumption, daily and monthly mileage, etc.
In 2018, the volume of water transport was 25,638 people, with a passenger turnover of 0.4
million man/km, increasing the number of passengers by 5,082 people or 24.7% from the
previous year, which is 0.01% of the total passenger traffic in the 2018 traffic. Waterway
study is not included since Mongolia is a landlocked country, has not been involved in cargo
transport since 2006, and uses only 0.01% of passenger traffic.
1 Mongolia-built double diesel engine locomotive.
15
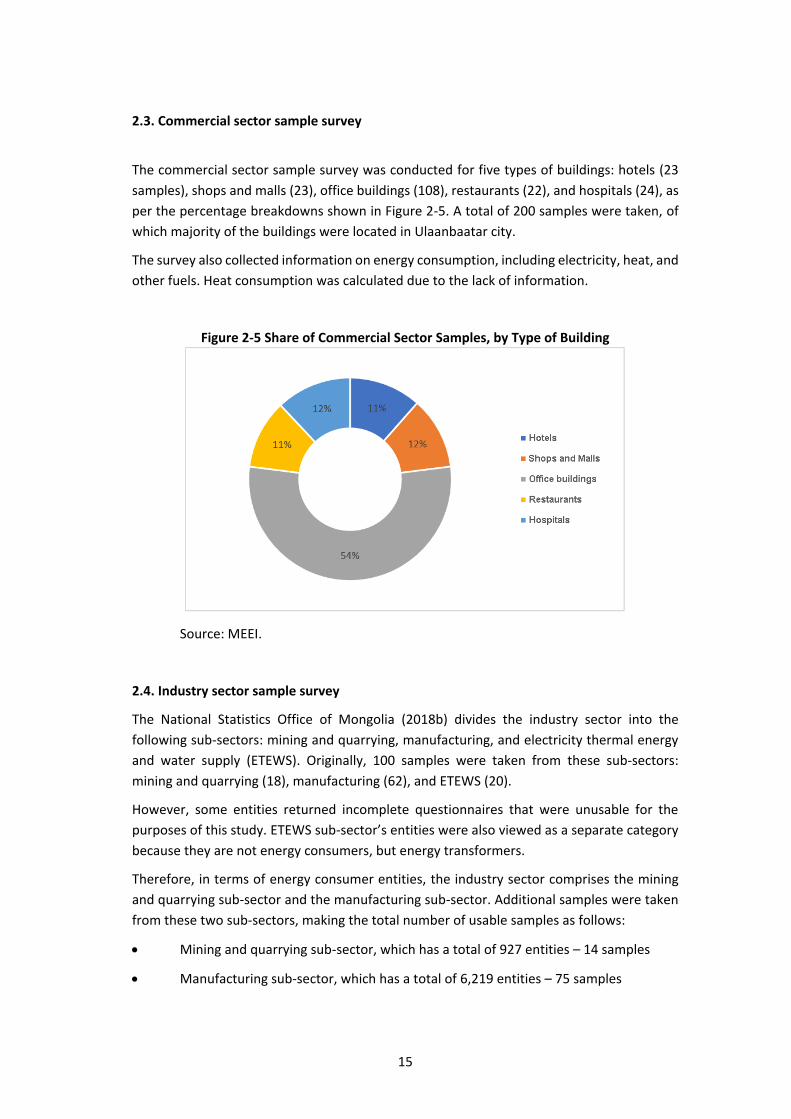
2.3. Commercial sector sample survey
The commercial sector sample survey was conducted for five types of buildings: hotels (23
samples), shops and malls (23), office buildings (108), restaurants (22), and hospitals (24), as
per the percentage breakdowns shown in Figure 2-5. A total of 200 samples were taken, of
which majority of the buildings were located in Ulaanbaatar city.
The survey also collected information on energy consumption, including electricity, heat, and
other fuels. Heat consumption was calculated due to the lack of information.
Figure 2-5 Share of Commercial Sector Samples, by Type of Building
Source: MEEI.
2.4. Industry sector sample survey
The National Statistics Office of Mongolia (2018b) divides the industry sector into the
following sub-sectors: mining and quarrying, manufacturing, and electricity thermal energy
and water supply (ETEWS). Originally, 100 samples were taken from these sub-sectors:
mining and quarrying (18), manufacturing (62), and ETEWS (20).
However, some entities returned incomplete questionnaires that were unusable for the
purposes of this study. ETEWS sub-sector’s entities were also viewed as a separate category
because they are not energy consumers, but energy transformers.
Therefore, in terms of energy consumer entities, the industry sector comprises the mining
and quarrying sub-sector and the manufacturing sub-sector. Additional samples were taken
from these two sub-sectors, making the total number of usable samples as follows:
• Mining and quarrying sub-sector, which has a total of 927 entities – 14 samples
• Manufacturing sub-sector, which has a total of 6,219 entities – 75 samples

16
Samples from the manufacturing sub-sector amounted to 78% of the total sample, whilst
those from the mining and quarrying sub-sector amounted to 22% of the total sample. Table
2-5 gives the number of samples included in each types of industry whilst Figure 2-6 shows
the share of the number of samples in each Sub-sector in the industry sector survey.
Table 2-5. Types of Industries and Number of Samples Included in the Industry Sector Survey (Energy-Consuming Entities)
Types of Industries Number of Samples
Mining and quarrying 14
Coal 9
Other 5
Manufacturing 75
Food 31
Building materials 13
Metals 5
Other 26
TOTAL 89
Source: MEEI.
Figure 2-6 Share of the Number of Samples in Each Sub-sector in the Industry Sector Survey (Energy-Consuming Entities)
Coal64%
Other36%
Mining and quarrying

17
Source: MEEI.
The sample survey questionnaire for industry included:
• Name, address, year of establishment, number of employees, and direction of activities in
the organisation's description
• Construction information that includes information on the year of construction, purpose,
size, operation status, total area, and heating area
• Production summary information such as product name, production volume, and price.
Power source and consumption data include data on electricity and heat sources, annual
electricity consumption, heat consumption, price and consumption, price of fuel, and fuel
and lubricants.
Two questionnaires were developed for the industry sector survey: (i) industrial and mining,
geological exploration, and farming companies; and (i) a sample survey randomly conducted
from urban and rural industrial enterprises.
Within the framework of the research work, we concluded agreements with the energy
companies of the western sector of the energy system (Western EPS), Altai-Uliastai power
system (UAEPS), the Eastern region (Eastern EPS) energy system companies, and industry
consultants for conducting sample surveys.
2.5 Electricity, heat, and water supply sector sample survey
Two questionnaires were developed for the electricity, heat, and water supply sector survey.
Within the framework of the research work, we concluded agreements with the energy
companies of the western sector of the energy system, Altai-Uliastai power system, the
Eastern region energy system companies, and industry consultants for conducting sample
surveys.
Food41%
Building material17%
Metals7%
Other35%
Manufacturing
18
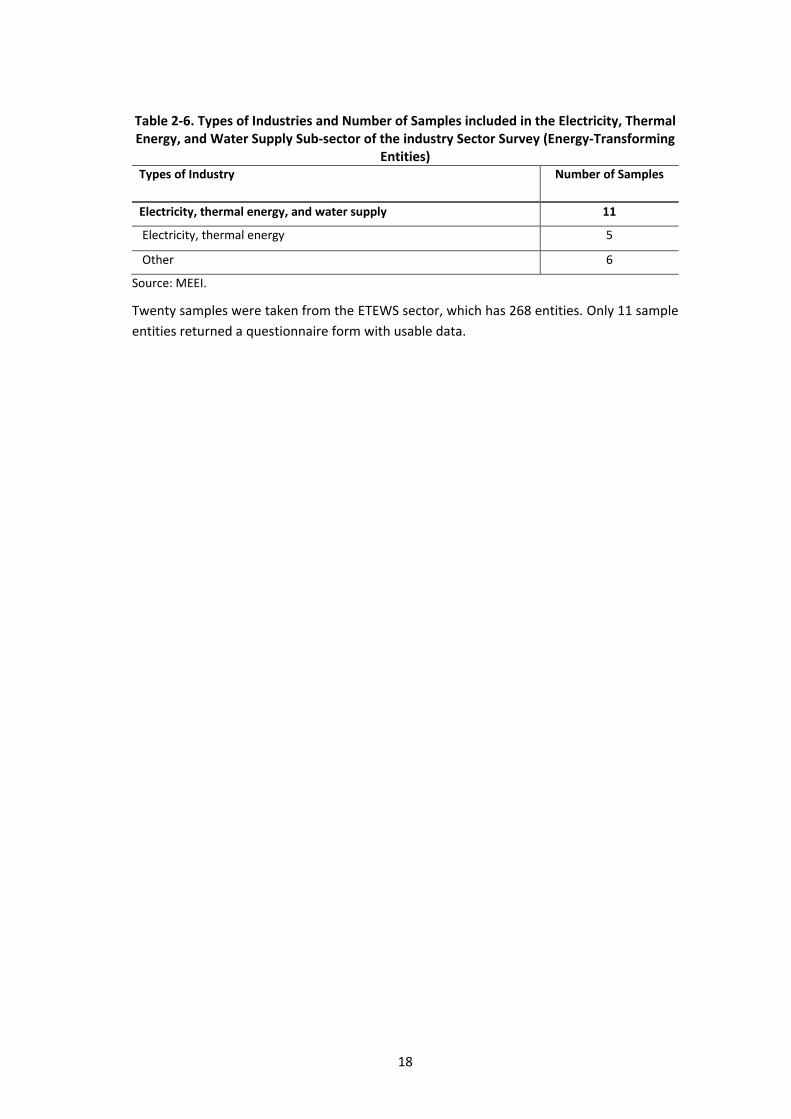
Table 2-6. Types of Industries and Number of Samples included in the Electricity, Thermal Energy, and Water Supply Sub-sector of the industry Sector Survey (Energy-Transforming
Entities) Types of Industry Number of Samples
Electricity, thermal energy, and water supply 11
Electricity, thermal energy 5
Other 6
Source: MEEI.
Twenty samples were taken from the ETEWS sector, which has 268 entities. Only 11 sample
entities returned a questionnaire form with usable data.

19
Chapter 3
Residential Sector
1. Energy Efficiency Indicators in the Residential Sector
Based on the International Energy Agency’s concept of energy efficiency indicators (EEIs)
(Figure 3-1, the simplest indicator is level 1, which is the overall consumption of energy for
the residential sector expressed either in absolute value or in percentage of the country’s
total final consumption. The second indicator of level 1 is the share of each energy source in
the total residential consumption mix (R1b) as reported in section 3.4. However, the focus of
this survey is the energy consumption in households and end-use of energy. Therefore, this
chapter reports mainly on the total energy consumption per dwelling (R2b), total energy
consumption per floor area (R2c), and share of end-use consumption by appliance (R3a).
Figure 3-1 Pyramid of Residential Indicators
TFC = total final consumption.
Source: International Energy Agency (2014a).
2. Effective Samples
A total of 430 survey samples were taken from six regions of Mongolia. However, 30 survey
samples were excluded due to inadequately filling out of questionnaires. Considered in
data analysis were 400 survey samples.

20
Table 3-1. Number of Households and Type of Dwelling Type Urban Rural Herder
Type of
dwelling Apartment House Ger Apartment House Ger House Ger
Number of
households 70 63 7 43 110 47 4 56
Source: MEEI.
3. Characteristics of Households
Energy consumption is caused by extraterritorial, climatic conditions, and ethnic customs.
The majority of urban households are relatively energy efficient, and have access to the
centralised energy system, whilst the decentralised individual houses and gers are relatively
energy-inefficient due to the lack of infrastructure facilities connecting to the centralised
heating system. Depending on the location of the dwellings and type of houses, large heat
losses are common. The heat losses in homes are substantial and can be equivalent to large
consumption of fuel, coal, and wood.
The average area of houses is 35–70 m2, whilst that of gers is 27– 34 m2.
Most of the herder households are not connected to the electricity system, but generate
electricity from small-scale power generation systems such as diesel generators and solar PV
systems, as well as burning natural wood, dung, khurzun (which is dung- and animal-derived
fuel) for space heating.
4. Fuel Consumption of the Residential Sector
Table 3-2 shows the average annual consumption of fuel used in heating and cooking in
households.
Table 3-2. Household Fuel Consumption
Coal
(ton)
Wood
(m3)
Dung
(m3)
Khurzun
(m3)
Number of
Households Surveyed
Herder
Fuel consumption 0.76 1.25 8.3 8.3
60 Number of households
consumed
48
80%
22
36.6%
52
86.6
%
46
76.6%
Rural
The amount of fuel
used 45.9 50.1 8.7 7
200 Number of households
consumed
120
60%
121
60,5%
41.2
20,6
%
38
19%

21
Source: MEEI.
Households use coal, wood, dung, and briquettes for heating and cooking. Most herders
use 0.76 tonnes of coal and 8–12 m3 of dung annually, whilst Ulaanbaatar and rural area
use 4.5–5.5 tonnes of coal, 3–7m3 of wood and dung.
Households are divided into three sections: connected to centralised (district) heating
system, decentralised heating system, and ger. House- heating consumption is expressed in
terms of gigacalorie (Gcal) and megawatt based on field and volume methodology. Those
living in houses use electric heaters and most of them use natural wood and coal, whilst
herder households use wood and dung.
Gases and other types of fuels are used in small quantities and, therefore, are not included
in the survey analysis.
3.5. Residential Sector Energy End-Use
Table 3-3, Table 3-4 and Figure 3-2 show the annual average consumption of households and
the average annual energy consumption per household.
Table 3-3. Average Annual Electricity Consumption of Households (kWh/year) Type Urban Rural Herder
Type of dwelling Apartme
nt House Ger
Apartment
House Ger Hous
e Ger
Surveyed households 70 63 7 43 110 47 4 56
Total electricity consumption kWh/y
225,973 272,2
12 16,97
2 121,284
719,996
104,960
1,88
5
17,93
2
Source: MEEI.
Urban
The amount of fuel
used 4.56 3.3 6.4 3
140 Number of households
consumed
67
47.8%
43
30.7%
9
45%
8
4%

22
Table 3-4. Average Electricity Consumption per Household Type Urban Rural Herder
Type of
dwelling Apartment House Ger Apartment House Ger House Ger
One household
per year
(kWh/y)
3,228
4,321
2,425
2,821
6,545
2,233
471
320
One household
per month
(kWh/month)
269 360 202 235 545 186 39 27
%
Lighting 13 10 11 10 5 9 12 14
Refrigerator 16 12 20 16 8 20 0 15
Freezer 7 5 2 14 6 11 63 35
Washing
machine 2 1 2 2 1 1 1 1
TV 7 5 9 8 4 12 25 34
Rice cooker 3 3 4 4 2 3 0 1
Computer 2 1 2 1 1 1 0 0
Electric stove 32 21 37 27 13 19 0 0
Iron 3 2 3 3 2 4 0 1
Electric kettle 14 9 10 14 5 10 0 0
Water heater 0 1 0 2 0 0 0
Electric heater 0 28 0 16 9 0 0
Fan 1 0 0 0 0 0
Vacuum cleaner 1 1 2 1 0 0 0
Source: MEEI.
23
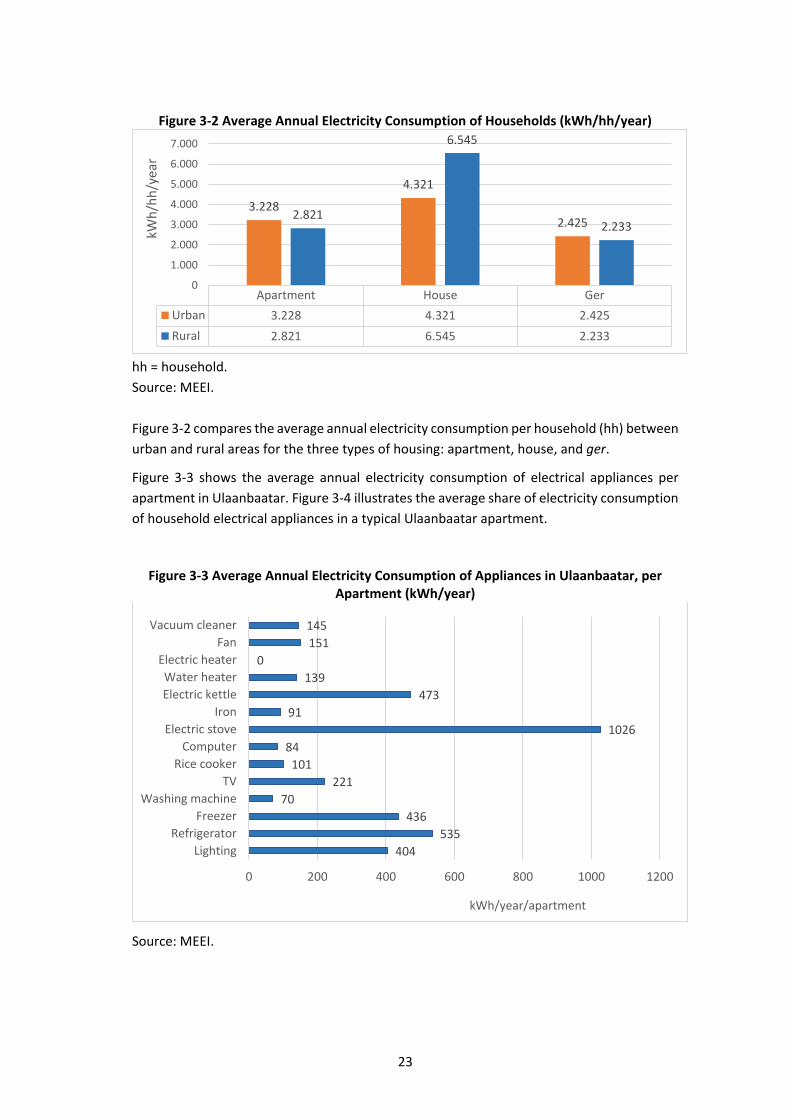
Figure 3-2 Average Annual Electricity Consumption of Households (kWh/hh/year)
hh = household.
Source: MEEI.
Figure 3-2 compares the average annual electricity consumption per household (hh) between
urban and rural areas for the three types of housing: apartment, house, and ger.
Figure 3-3 shows the average annual electricity consumption of electrical appliances per
apartment in Ulaanbaatar. Figure 3-4 illustrates the average share of electricity consumption
of household electrical appliances in a typical Ulaanbaatar apartment.
Figure 3-3 Average Annual Electricity Consumption of Appliances in Ulaanbaatar, per Apartment (kWh/year)
Source: MEEI.
Apartment House Ger
Urban 3.228 4.321 2.425
Rural 2.821 6.545 2.233
3.228
4.321
2.4252.821
6.545
2.233
0
1.000
2.000
3.000
4.000
5.000
6.000
7.000kW
h/h
h/y
ear
404
535
436
70
221
101
84
1026
91
473
139
0
151
145
0 200 400 600 800 1000 1200
Lighting
Refrigerator
Freezer
Washing machine
TV
Rice cooker
Computer
Electric stove
Iron
Electric kettle
Water heater
Electric heater
Fan
Vacuum cleaner
kWh/year/apartment

24
Annual household electricity consumption in Ulaanbaatar apartments shows that 32% of
the total electricity comes from electric stoves; 16%, from refrigerators; 7%, from freezers;
13%, from lighting; 14%, from electric kettle;, and the remaining 18%, from other electric
appliances.
Figure 3-4. Share of Electricity Usage in a Typical Urban Apartment, by Appliances (%)
Source: Author based on MEEI’s data.
Figure 3-5 Average Annual Electricity Consumption of Appliances in Ulaanbaatar, per House (kWh/year)
Source: MEEI.
13%
16%
7%
2%7%3%
2%
32%
3%
14%
0%1% 1%
Lighting
Refrigerator
Freezer
Washing machine
TV
Rice cooker
Computer
Electric stove
Iron
Electric kettle
Water heater
Fan
Vacuum cleaner
442520
44143
195125133
983107
437131
75780
276
0 1000 2000 3000 4000 5000 6000 7000 8000
Lighting
Freezer
TV
Computer
Iron
Water heater
Fan
kWh/year/house

25
Figure 3-6 Share of Electricity Usage in a Typical Urban House, by Appliance (%)
Source: Author based on MEEI’s data.
Figure 3-7 Average Annual Electricity Consumption of Appliances in Urban Areas, per Ger (kWh/year)
10%
12%
5%
1%5%
3%
1%21%
2%
9%
1%
28%
1%Lighting
Refrigerator
Freezer
Washing machine
TV
Rice cooker
Computer
Electric stove
Iron
Electric kettle
Water heater
Electric heater
Vacuum cleaner
270
482
394
39
221
106
66
1267
78
287
0 200 400 600 800 1000 1200 1400
Lighting
Refrigerator
Freezer
Washing machine
TV
Rice cooker
Computer
Electric stove
Iron
Electric kettle
kWh/year/ger

26
Figure 3-8 Share of Electricity Usage in a Typical Urban Ger, by Appliance
Source: Author based on MEEI’s data.
The survey results show that all households use lights, refrigerators, washing machines,
televisions, irons, electric tiles, rice cookers, water boilers, freezers, and vacuum cleaners.
Few households use electric heaters, boilers, fans, and computers. Figure 3-3, , Figure 3-5,
and ). In urban households, electric stoves and heaters consume the majority share of the
household energy usage. Other significant energy users are refrigerators, freezers, lighting,
and electric kettles. Urban houses mainly use electric heaters for heating instead of electric
stoves as in urban apartments and gers.
Herder households not connected to the central energy system use 150–158 kW of electricity
per year from their own power using solar panels, small wind turbines, and electric
generators. Electricity consumption is very low compared to settled households; electricity
is used only for lighting, TV, and space antenna feed. On average, one household uses solar
panels with 100–130 watts, which are typically used in herder areas. Heat energy
consumption is almost the same with urban and rural households.
Figure 3-9 compares the total average annual consumption of electricity and heat energy
consumed by each surveyed household, expressed in KWh per household per year. Table
3-5 and Table 3-9, respectively, show the average total energy consumption of each
household in urban and rural areas.
11%
20%
2%
2%9%
4%
2%
37%
3%
10%Lighting
Refrigerator
Freezer
Washing machine
TV
Rice cooker
Computer
Electric stove
Iron
Electric kettle

27
Figure 3-9. Comparison of Total Average Annual Energy Consumption per Household between Urban and Rural Areasa (KWh/hh/year)
a Includes electricity and heat energy.
Source: Author based on MEEI’s data.
Table 3-5. Average Total Energy Consumption of Each Urban Household
(kWh/hh/year and Percentage Share of Energy Source) Type of Dwelling Total Electricity Heat
Apartment 15,202 3,228 21% 11,974 79%
House 13,492 4,321 32% 9,171 68%
Ger 9,636 2,425 25% 7,211 75%
Source: Author based on MEEI’s data.
Table 3-6. Average Total Energy Consumption of Each Rural Household
(kWh/hh/year and Percentage Share of Energy Source) Type of Dwelling Total Electricity Heat
Apartment 14,462 2,821 20% 11,641 80%
House 15,872 6,545 41% 9,327 59%
Ger 13,576 2,233 16% 11,343 84%
Source: Author based on MEEI’s data.
5. Energy Intensity
The average annual consumption of combined electricity and heat energy in the surveyed
households and dwellings, calculated per household and per square meter floor area, is
shown in Table 3-7 to Table 3-9. Unlike the commercial sector, where the EEI is based on
energy intensity defined as building energy intensity (BEI) (which is a ratio of energy
15.20214.462
13.492
15.872
9.636
13.576
0
2.000
4.000
6.000
8.000
10.000
12.000
14.000
16.000
18.000
Urban Rural Urban Rural Urban Rural
Apartment House Ger
AV
ERA
GE
AN
NU
AL
ENER
GY
CO
NSU
MP
TIO
N
PER
HO
USE
HO
LD (
KW
H/H
H/Y
)

28
consumption to gross floor area), energy intensity for the residential sector is more
appropriate if based on average annual energy consumption per household because more
appliances are used in dwellings. Appliances such as refrigerators, freezers, washing
machines, TV sets, rice cookers, etc. are used only in certain parts of a dwelling. Unlike in the
commercial sector, the energy usage in commercial buildings is more evenly distributed.
Therefore, it is more accurate to compare the values of energy intensity based on the average
annual energy consumption per household to determine energy efficiency in the residential
sector. However, for practical purposes in terms of feedback to household residents, average
monthly energy consumption per household would provide more realistic comparison of
energy intensities to household owners, who can relate them to their monthly energy bills.
In addition, household composition data are found in the national statistics. Therefore, it will
be useful to establish energy intensity in terms of annual energy consumption per household,
which can facilitate the compilation of energy statistics for the residential sector. To promote
energy efficiency in the residential sector, it would be useful to establish the monthly energy
intensity based on the monthly energy consumption per household for residents to more
easily understand and monitor their respective monthly energy usage.
Table 3-7. Average Annual Energy Consumption of Each Typical Urban Household in Ulaanbaatar, per household and per floor area comparisons
Type of
Dwelling
Description Electricity Heat Total Energy
Apartment
Average area:
54.5 m2
Average annual energy
consumption per household
(kWh/hh/y)
3,228
11,974 15,202
Average annual energy
consumption per floor area
(kWh/m2/y)
58 220 278
House
Average area:
65.5 m2
Average annual energy
consumption per household
(kWh/hh/y)
4,297 9,171 13,195
Average annual energy
consumption per floor area
(kWh/m2/y)
65 140 201
Ger
Average area:
34.4 m2
Average annual energy
consumption per household
(kWh/hh/year)
2,352 7,211 9,564
Average annual energy
consumption per floor area
(kWh/m2/y)
77 236 313
Source: MEEI.

29
Table 3-8. Average Annual Energy Consumption of Each Typical Rural Household, per household and floor area comparisons
Type of Dwelling Description Electricity Heat Total Energy
Apartment
Average area:48.1 m2
Average annual energy
consumption per household
(kWh/y)
2,828
11,641 14,607
Average annual energy
consumption per floor area
(kWh/m2/y)
58 242 303
House
Average area:59.2 m2
Average annual energy
consumption per household
(kWh/hh/y)
4,294 9,327 13,185
Average annual energy
consumption per floor area
(kWh/m2/y)
72 157 222
Ger
Average area: 30.5 m2
Average annual energy
consumption per household
(kWh/hh/y)
2,210 11,343 13,553
Average annual energy
consumption per floor
area(kWh/m2/y)
72 371 444
Source: MEEI.
Table 3-9. Average Annual Energy Consumption of Herder Households, Intensity per Year Type of Dwelling Description Electricity Heat Total Energy
Consumption
House
Average area: 70.2 m2
Average annual energy
consumption per household
(kWh/hh/y)
150
10,670 10,820
Intensity
(kWh/m2/y)
2 152 154
Ger
Average area: 30.5 m2
Average annual energy
consumption per household
(kWh/hh/y)
158 13,631 13,789
Average annual energy
consumption per floor
(kWh/m2/y)
5 451 456
30
Chapter 4
Transport Sector
1. Energy Efficiency Indicators in the Transport Sector
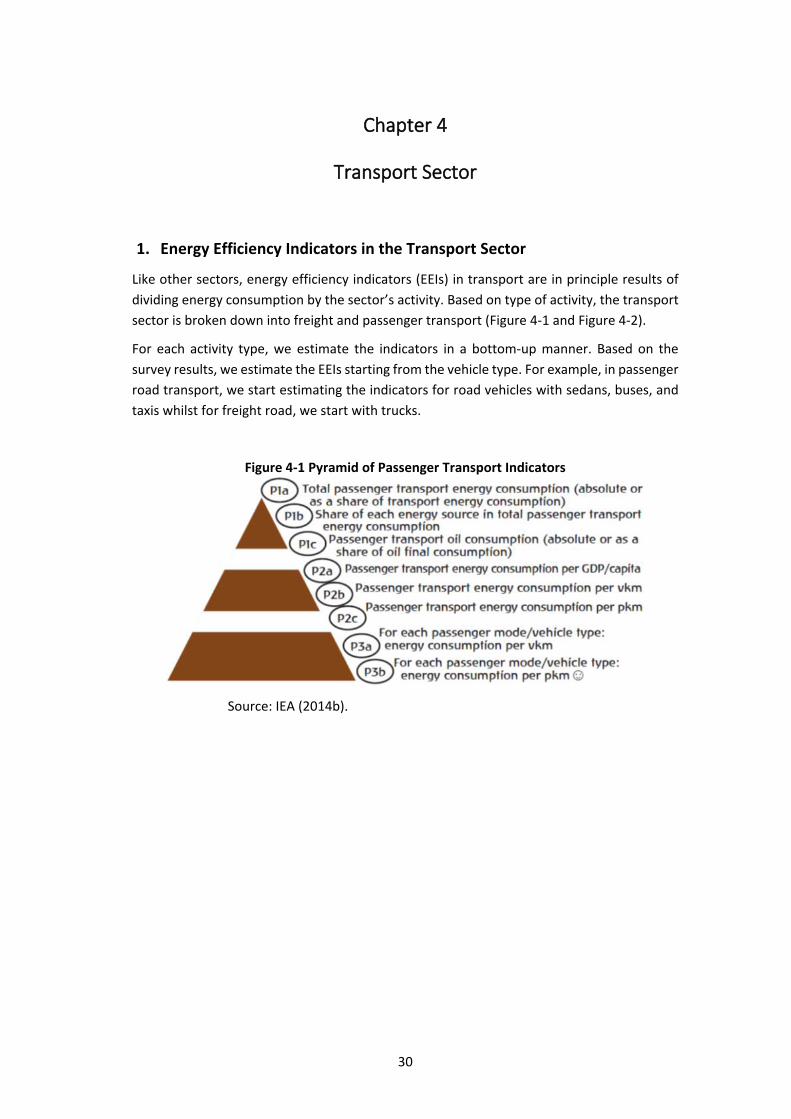
Like other sectors, energy efficiency indicators (EEIs) in transport are in principle results of
dividing energy consumption by the sector’s activity. Based on type of activity, the transport
sector is broken down into freight and passenger transport (Figure 4-1 and Figure 4-2).
For each activity type, we estimate the indicators in a bottom-up manner. Based on the
survey results, we estimate the EEIs starting from the vehicle type. For example, in passenger
road transport, we start estimating the indicators for road vehicles with sedans, buses, and
taxis whilst for freight road, we start with trucks.
Figure 4-1 Pyramid of Passenger Transport Indicators
Source: IEA (2014b).
31
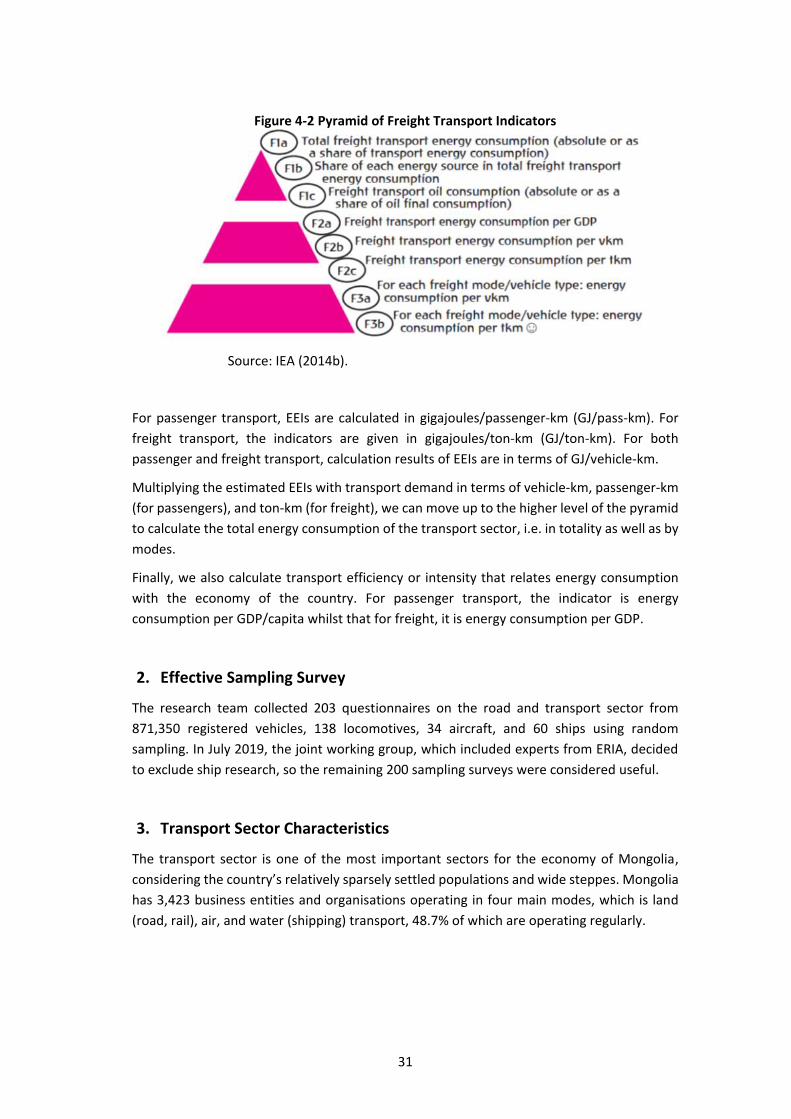
Figure 4-2 Pyramid of Freight Transport Indicators
Source: IEA (2014b).
For passenger transport, EEIs are calculated in gigajoules/passenger-km (GJ/pass-km). For
freight transport, the indicators are given in gigajoules/ton-km (GJ/ton-km). For both
passenger and freight transport, calculation results of EEIs are in terms of GJ/vehicle-km.
Multiplying the estimated EEIs with transport demand in terms of vehicle-km, passenger-km
(for passengers), and ton-km (for freight), we can move up to the higher level of the pyramid
to calculate the total energy consumption of the transport sector, i.e. in totality as well as by
modes.
Finally, we also calculate transport efficiency or intensity that relates energy consumption
with the economy of the country. For passenger transport, the indicator is energy
consumption per GDP/capita whilst that for freight, it is energy consumption per GDP.
2. Effective Sampling Survey
The research team collected 203 questionnaires on the road and transport sector from
871,350 registered vehicles, 138 locomotives, 34 aircraft, and 60 ships using random
sampling. In July 2019, the joint working group, which included experts from ERIA, decided
to exclude ship research, so the remaining 200 sampling surveys were considered useful.
3. Transport Sector Characteristics
The transport sector is one of the most important sectors for the economy of Mongolia,
considering the country’s relatively sparsely settled populations and wide steppes. Mongolia
has 3,423 business entities and organisations operating in four main modes, which is land
(road, rail), air, and water (shipping) transport, 48.7% of which are operating regularly.

32
3.1. Road transport mode statistics
Road transport in Mongolia consists of sedans, taxis, trucks, buses, and special purpose
vehicles. In 2018, the total number of registered road vehicles was 871.3 thousand, an
increase of 56.3 thousand or 6.9% from 2017.
Of those registered in Mongolia, 53.2% are right-hand drive vehicles (i.e. the steering wheel
is on the right side) and 46.8% are left-hand driven. Road vehicles aged 10+ years comprise
75.9%; those aged 7–9 years, 14.03%; those aged 4–6 years, 6.3%; and those aged 0–3 years,
3.74%. In terms of engine capacity, 32.77% have up to 1,500 cm3; 38.04% have 1,501–2,500
cm3; 14.16% have 2,501–3,500 cm3; 4,18% have 3,501–4,500 cm3; and 10.85% have 4,501
cm3 and above.
Road transport vehicles run on the following types of fuel: 31.86%, on AI-92 gasoline; 9.89%,
on AI-95; 2.67%, onAI-80; 7,34%, on A-76; 27.36%, on diesel fuel; 2.34%, on gas; and 0.02%,
on electricity.
Figure 4-3. Share of Fuel Type Used by Road Vehicles (%)
Source: MEEI.
Of the total registered road vehicles in Mongolia, 67.2% passed through governmental
technical inspection in 2018. Cars that did not pass through governmental technical
inspection were not excluded from the state registration database.
Table 4-1 shows the total number of registered and those that passed through governmental
technical inspection vehicles in provinces, in the capital, and in regions. Ulaanbaatar has the
highest number of road vehicles; it comprises more than 57% of the total registered road
vehicles in Mongolia and around 68% road vehicles that passed through technical inspection.
Amongst the road vehicles that passed through technical inspection in Ulaanbaatar in 2018,
72.8% or 309.8 thousand are passenger cars (sedans); 57.2% or 75.3 thousand are trucks;
55.5% or 10.3 thousand are buses; and 69.4% or 6.4 thousand are special purpose
vehicles.
Gasoline AI-9510%
Gasoline AI-9251%
Gasoline AI-803%
Gasoline AI-767%
Diesel27%
Gas2%

33
Table 4-1. Total Number of Registered Road Vehicles and Those that Passed through Governmental Technical Inspection (2018)
Provinces/Capital Registered
Passed through
Governmental Technical
Inspection
Western region 75,935 44,988
Bayan-Ulgii 17,501 17,941
Gobi-Altai 12,557 4,545
Zavkhan 14,424 5,037
Uvs 13,958 9,452
Khovd 17,495 8,013
Khangai region 122,062 54,783
Arkhangai 14,717 6,135
Bayankhongor 19,969 4,986
Bulgan 12,743 7,896
Orkhon 25,994 19,226
Uvurkhangai 23,917 5,346
Khuvsgul 24,722 11,194
Central region 129,450 67,905
Gobisumber 3,557 2,311
Darkhan-Uul 24,133 8,941
Dornogobi 19,554 11,909
Dundgobi 10,829 2,818
Umnugobi 28,521 22,700
Selenge 25,038 11,219
Central region 17,818 8,007
Eastern region 41,969 15,962
Dornod 15,565 6,121
Sukhbaatar 12,052 6,083
Khentii 14,352 3,758
Ulaanbaatar 501,934 401,725
Total 871,350 585,363
Source: National Statistics Office of Mongolia (2018a).
Table 4-2. Types of Vehicles that Passed through Technical Inspection (2018)
Types 2016 2017 2018
Bus 18,912 18,550 18,570
Truck 111,431 120,751 131,573
Car 360,513 388,448 426,065
Special 8,296 8,650 9,155
Total 499 152 536 399 585,363
Source: National Statistics Office of Mongolia (2018a).
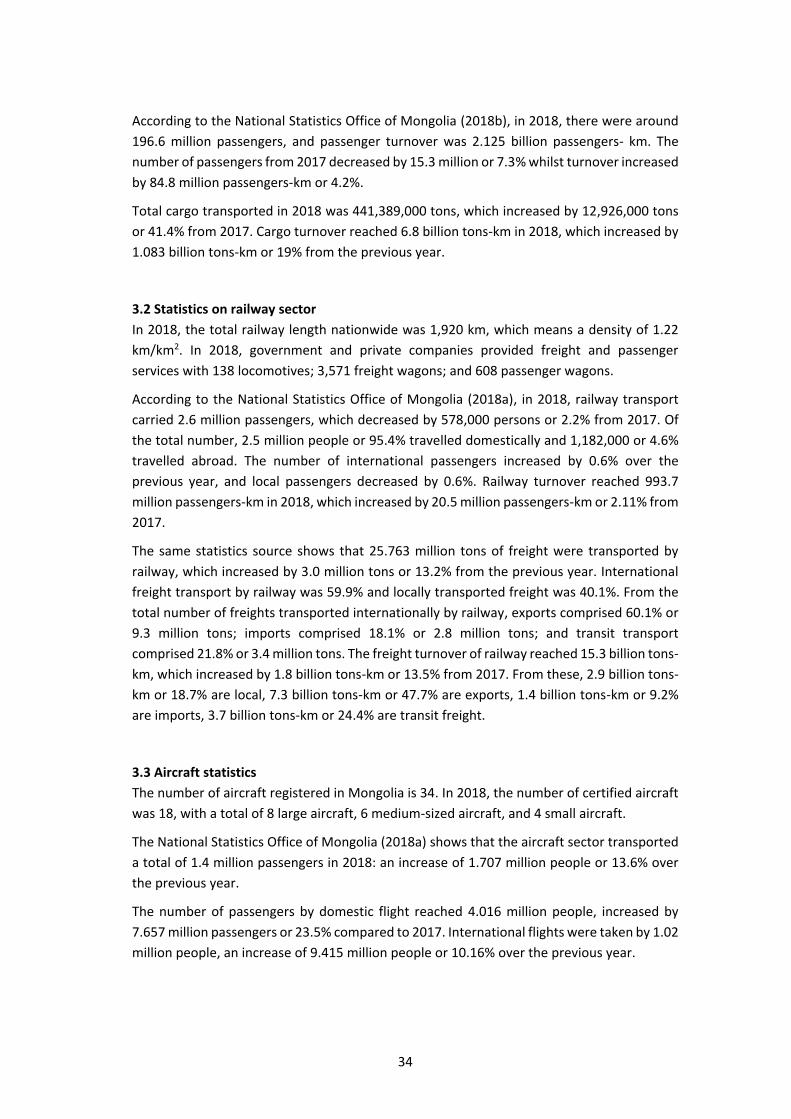
34
According to the National Statistics Office of Mongolia (2018b), in 2018, there were around
196.6 million passengers, and passenger turnover was 2.125 billion passengers- km. The
number of passengers from 2017 decreased by 15.3 million or 7.3% whilst turnover increased
by 84.8 million passengers-km or 4.2%.
Total cargo transported in 2018 was 441,389,000 tons, which increased by 12,926,000 tons
or 41.4% from 2017. Cargo turnover reached 6.8 billion tons-km in 2018, which increased by
1.083 billion tons-km or 19% from the previous year.
3.2 Statistics on railway sector
In 2018, the total railway length nationwide was 1,920 km, which means a density of 1.22
km/km2. In 2018, government and private companies provided freight and passenger
services with 138 locomotives; 3,571 freight wagons; and 608 passenger wagons.
According to the National Statistics Office of Mongolia (2018a), in 2018, railway transport
carried 2.6 million passengers, which decreased by 578,000 persons or 2.2% from 2017. Of
the total number, 2.5 million people or 95.4% travelled domestically and 1,182,000 or 4.6%
travelled abroad. The number of international passengers increased by 0.6% over the
previous year, and local passengers decreased by 0.6%. Railway turnover reached 993.7
million passengers-km in 2018, which increased by 20.5 million passengers-km or 2.11% from
2017.
The same statistics source shows that 25.763 million tons of freight were transported by
railway, which increased by 3.0 million tons or 13.2% from the previous year. International
freight transport by railway was 59.9% and locally transported freight was 40.1%. From the
total number of freights transported internationally by railway, exports comprised 60.1% or
9.3 million tons; imports comprised 18.1% or 2.8 million tons; and transit transport
comprised 21.8% or 3.4 million tons. The freight turnover of railway reached 15.3 billion tons-
km, which increased by 1.8 billion tons-km or 13.5% from 2017. From these, 2.9 billion tons-
km or 18.7% are local, 7.3 billion tons-km or 47.7% are exports, 1.4 billion tons-km or 9.2%
are imports, 3.7 billion tons-km or 24.4% are transit freight.
3.3 Aircraft statistics
The number of aircraft registered in Mongolia is 34. In 2018, the number of certified aircraft
was 18, with a total of 8 large aircraft, 6 medium-sized aircraft, and 4 small aircraft.
The National Statistics Office of Mongolia (2018a) shows that the aircraft sector transported
a total of 1.4 million passengers in 2018: an increase of 1.707 million people or 13.6% over
the previous year.
The number of passengers by domestic flight reached 4.016 million people, increased by
7.657 million passengers or 23.5% compared to 2017. International flights were taken by 1.02
million people, an increase of 9.415 million people or 10.16% over the previous year.
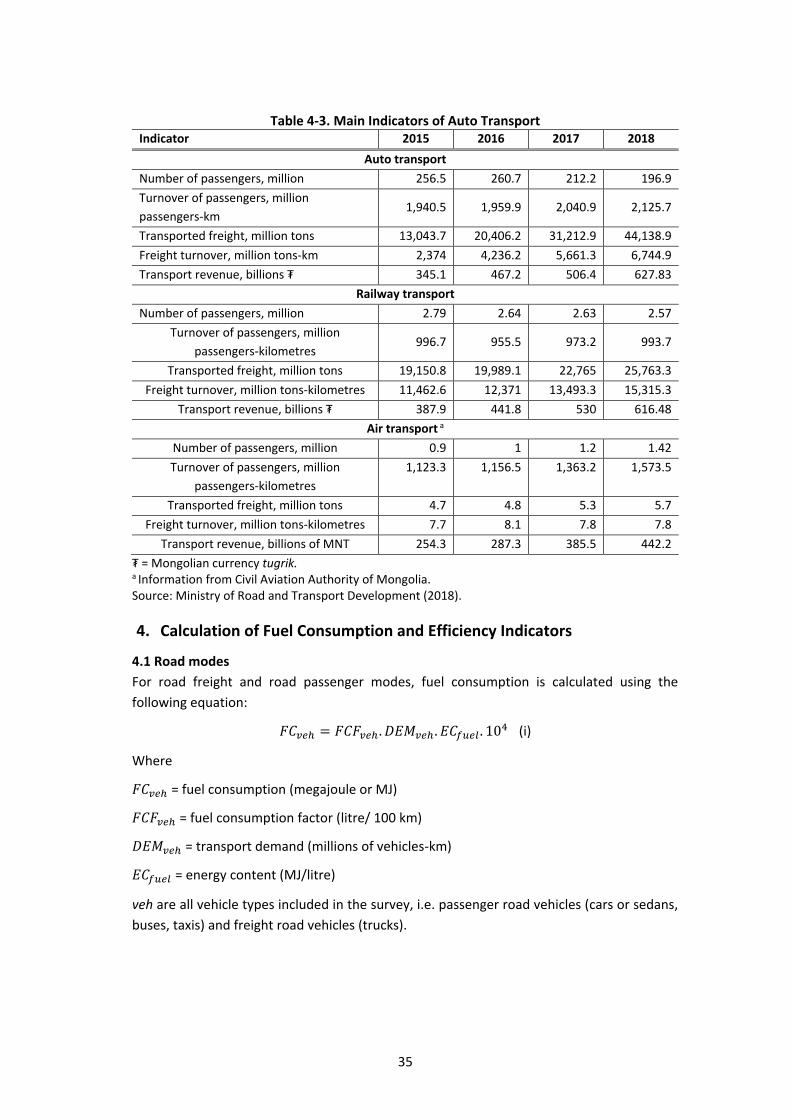
35
Table 4-3. Main Indicators of Auto Transport Indicator 2015 2016 2017 2018
Auto transport
Number of passengers, million 256.5 260.7 212.2 196.9
Turnover of passengers, million
passengers-km 1,940.5 1,959.9 2,040.9 2,125.7
Transported freight, million tons 13,043.7 20,406.2 31,212.9 44,138.9
Freight turnover, million tons-km 2,374 4,236.2 5,661.3 6,744.9
Transport revenue, billions ₮ 345.1 467.2 506.4 627.83
Railway transport
Number of passengers, million 2.79 2.64 2.63 2.57
Turnover of passengers, million
passengers-kilometres 996.7 955.5 973.2 993.7
Transported freight, million tons 19,150.8 19,989.1 22,765 25,763.3
Freight turnover, million tons-kilometres 11,462.6 12,371 13,493.3 15,315.3
Transport revenue, billions ₮ 387.9 441.8 530 616.48
Air transport a
Number of passengers, million 0.9 1 1.2 1.42
Turnover of passengers, million
passengers-kilometres
1,123.3 1,156.5 1,363.2 1,573.5
Transported freight, million tons 4.7 4.8 5.3 5.7
Freight turnover, million tons-kilometres 7.7 8.1 7.8 7.8
Transport revenue, billions of MNT 254.3 287.3 385.5 442.2
₮ = Mongolian currency tugrik. a Information from Civil Aviation Authority of Mongolia. Source: Ministry of Road and Transport Development (2018).
4. Calculation of Fuel Consumption and Efficiency Indicators
4.1 Road modes
For road freight and road passenger modes, fuel consumption is calculated using the
following equation:
𝐹𝐶𝑣𝑒ℎ = 𝐹𝐶𝐹𝑣𝑒ℎ . 𝐷𝐸𝑀𝑣𝑒ℎ . 𝐸𝐶𝑓𝑢𝑒𝑙 . 104 (i)
Where
𝐹𝐶𝑣𝑒ℎ = fuel consumption (megajoule or MJ)
𝐹𝐶𝐹𝑣𝑒ℎ = fuel consumption factor (litre/ 100 km)
𝐷𝐸𝑀𝑣𝑒ℎ = transport demand (millions of vehicles-km)
𝐸𝐶𝑓𝑢𝑒𝑙 = energy content (MJ/litre)
veh are all vehicle types included in the survey, i.e. passenger road vehicles (cars or sedans,
buses, taxis) and freight road vehicles (trucks).

36
Table 4-4. Fuel Types in Relation to Road Vehicle Types Fuel Type Vehicle Type
Gasoline Cars (sedans), taxi
Diesel Buses, trucks, rail passenger, rail freight
Source: Authors’ elaboration.
Table 4-5. Energy Content of Each Fuel Type Fuel Type Energy Content (MJ/litre)
Gasoline 35.2
Diesel 37.3
Source: Authors’ elaboration.
The fuel consumption factor (𝐹𝐶𝐹𝑣𝑒ℎ) is calculated based on the vehicle survey results of the
Mongolian Energy Economics Institute (MEEI) ( Table 4-6).
The average technical norm consumption of gasoline of cars (sedans) is 10.3 litres/ 100 km
whilst that of buses is 35.4 litres/100 km. For trucks, the sample survey was taken from 70
trucks, of heavy-carrying capacity diesel engines, from Nord Benz, Howo and Beiben of China,
which are widely used in Mongolia. Trucks included in the survey have an average technical
norm consumption of 62.1 litres/100 km, and aged 0–15 years.
Table 4-6. Calculated Average Fuel Economies (Fuel Consumption Factors) Mode Vehicle Type Fuel Consumption Factor
(litres/100 km)
Road passenger Cars 10.3
Buses 35.4
Taxis 8.0
Road freight Trucks 62.1
Source: Authors’ calculation.
Road transport demand ( 𝐷𝐸𝑀𝑣𝑒ℎ ) in millions of vehicles-km is calculated by the following equation. 𝐷𝐸𝑀𝑣𝑒ℎ = 𝑁𝐵𝑣𝑒ℎ . 𝐷𝐼𝑆𝑇𝑣𝑒ℎ . 𝑈𝑅𝑣𝑒ℎ . 10−6 (ii) 𝑁𝐵𝑣𝑒ℎ = number of vehicles which is taken from data (Table 4-2) 𝐷𝐼𝑆𝑇𝑣𝑒ℎ = average yearly distance (km/vehicle) 𝑈𝑅𝑣𝑒ℎ = average fleet utilisation rate

37
The survey conducted by the MEEI gives some information on the average annual distance
travelled by each vehicle type (𝐷𝐼𝑆𝑇𝑣𝑒ℎ) (Table 4-7). A study conducted by Batjargal and
Matsumoto (2017) also provide information on the average annual distance of some vehicle
types in Mongolia. Each information shows some differences.
For passenger cars, the MEEI survey shows an average mileage of nearly 23,700 km/year
whilst Batjargal and Matsumoto’s (2017) value is 12,000 km. The latter value was selected as
the study focused on road emission in Ulaanbaatar and should give more precise estimate of
the annual distance (in kilometres) than the MEEI survey.
Table 4-7. Average Trip Distance of Vehicles based on MEEI Survey
Vehicle Type Assumed Fuel Average Distance of Trip (km/vehicle)
Per day Per month Per year
Cars (sedans) Gasoline 49 1,974 23,690
Buses diesel 241 5,712 68,545
Taxis Gasoline 234 7,450 89,400
Trucks diesel 292 3,288 39,458
Source: Authors’ calculation.
Furthermore Amarsaikhan (2016) stated that around 60% of all motor vehicles were
registered in Ulaanbaatar, which confirmed statistics shown in the section 0.
For taxis, the values of both sources do not differ much. For the same reason as for passenger
cars, the value of Batjargal and Matsumoto (2017), i.e. 73,000 km, was selected.
The two resources show different values for trucks’ yearly distance travelled. Calculating
transport demand and using Batjargal and Matsumoto’s (2017) value of 12,000 km and
comparing it to the transport demand data – i.e. 6.775 billion tons-km (section 0) – would
give an average carried load of 10.7 tons per truck. MEEI survey results would give an average
carried load of 1.8 tons per truck, which is relatively too low. Herewith, 12,000 km was
selected as the average yearly distance travelled (in kilometres) of trucks.
For buses, the values from both sources differ quite a lot: 39,458 km per MEEI survey and
6,000–12,000 km per Batjargal and Matsumoto (2017). An old study from JICA (1994)
mentioned that in the early 1990s, buses’ average mileage in Mongolia was around 317
km/day or around 116,000 km/year. Using that information, the value of MEEI results, i.e.
86,546 km, was chosen.
Table 4-8. Annual Average Mileage for Road Vehicles Vehicle Type Annual Distance per Vehicle (km)
MEEI survey (2019)
Batjargal and Matsumoto (2017) Selected value
Cars 23,690 12,000 12,000
Taxis 89,400 73,000 73,000
Trucks 39,458 6,000–12,000 12,000
Buses 68,546 6,000–15,900 68,546
Source: Authors’ elaboration.

38
The average utilisation rate (𝑈𝑅𝑣𝑒ℎ) is the ratio of vehicles in active operation to the total
number of vehicles in the fleet. There is no data on Mongolian utilisation rates of road
transport modes. Even if this aspect is understudied in Asia, this study tried to look for some
available references to be used as inputs for Mongolia.
The World Bank (2005) estimated that between 2000 and 2003, the utilisation rates of buses
in Chennai, India are 78%–81% whilst for Bangalore the rates are 95%–96%. Karali et al.
(2019) concluded that in India, the utilisation rates of buses nationwide are about 90% for
the last decade whilst for trucks, the rates are much lower, 55%– 70%.
For passenger road modes, we assume that utilisation rates in Mongolia are significantly
lower than those of India. Departing from that assumption, we used the total road passenger
transport turnover of 2,126 passengers-km (see section 0) as the benchmark to calculate a
reasonable road passenger transport demand ( 𝐷𝐸𝑀𝑣𝑒ℎ ) in millions of vehicles-km and
found the following utilisation rates reported in Table 4-9.
Table 4-9. Assumed Road Vehicle Fleet Utilisation Rates Vehicle Type Fleet Utilisation Rate
Cars 0.1
Buses 0.3
Taxis 0.3
Trucks 0.4
Source: Authors’ elaboration.
Finally, the total energy efficiency for road passenger modes (road pass) in terms of
MJ/passenger-km is calculated as follows:
𝐸𝐸𝑟𝑜𝑎𝑑𝑝𝑎𝑠𝑠 = (𝐹𝐶𝑠𝑒𝑑𝑎𝑛𝑠 + 𝐹𝐶𝑏𝑢𝑠𝑒𝑠 + 𝐹𝐶𝑡𝑎𝑥𝑖𝑠). 10−6/𝑇𝑂𝑟𝑜𝑎𝑑𝑝𝑎𝑠𝑠 (iii)
Where 𝑇𝑂𝑟𝑜𝑎𝑑𝑝𝑎𝑠𝑠 is road passenger transport turn-over (million passengers-km) from
section 0 .
For trucks, the calculation is as follows:
𝐸𝐸𝑟𝑜𝑎𝑑𝑓𝑟𝑒𝑖𝑔ℎ𝑡 = (𝐹𝐶𝑡𝑟𝑢𝑐𝑘𝑠). 10−6/𝑇𝑂𝑟𝑜𝑎𝑑𝑝𝑎𝑠𝑠 (iv)
4.4.2 Rail modes
For road freight and road passenger modes, fuel consumption is calculated using the
following equation:
𝐹𝐶𝑣𝑒ℎ = 𝐹𝐶𝐹𝑣𝑒ℎ . 𝐷𝐸𝑀𝑣𝑒ℎ . 𝐸𝐶𝑓𝑢𝑒𝑙 . 10−2 (v)
Where
𝐹𝐶𝑣𝑒ℎ = fuel consumption (megajoule or MJ)
𝐹𝐶𝐹𝑣𝑒ℎ = fuel consumption factor (litre per 100 km)
𝐷𝐸𝑀𝑣𝑒ℎ = transport demand (vehicles-km)
𝐸𝐶𝑓𝑢𝑒𝑙 = energy content (MJ/litre) of diesel fuel, i.e. 37.3

39
veh or vehicle in rail transport in this study is in fact the sets of trains consisting of locomotive
and their tracked wagons. veh consists of two modes, i.e. rail freight and rail passenger.
Transport demand 𝐷𝐸𝑀𝑣𝑒ℎ is calculated by multiplying the number of vehicles, the average
yearly kilometre, and the fuel consumption.
𝐷𝐸𝑀𝑣𝑒ℎ = 𝑁𝐵𝑣𝑒ℎ . (𝑅𝐴𝐼𝐿𝐶𝐴𝑅𝑣𝑒ℎ
∑ 𝑅𝐴𝐼𝐿𝐶𝐴𝑅𝑣𝑒ℎ𝑣𝑒ℎ)𝐷𝐼𝑆𝑇𝑣𝑒ℎ . 𝑈𝑅𝑣𝑒ℎ (vi)
Where
𝑅𝐴𝐼𝐿𝐶𝐴𝑅𝑣𝑒ℎ = the number of railcars for each used, i.e. freight and passenger.
Table 4-10. Results of Vehicles Survey (Average Value)
Vehicle Type Assumed Fuel Norm
l/100 km
Distance of Trip/Km
Per day Per month Per year
Railway
locomotives diesel 2,125 336 3,583 42,990
Source: MEEI.
We assume a value of 0.9 as the utilisation rate of both rail freight and rail passenger modes.
EEIs are calculated the same way as in the road modes (section 0).
4.3 Air passenger modes
For air passenger mode, fuel consumption is calculated using the following equation:
𝐹𝐶𝑣𝑒ℎ = 𝐹𝐶𝐹𝑣𝑒ℎ . 𝐷𝐸𝑀𝑣𝑒ℎ . 𝐸𝐶𝑓𝑢𝑒𝑙 . 104 (vii)
Where
𝐹𝐶𝑣𝑒ℎ = fuel consumption (megajoule or MJ)
𝐹𝐶𝐹𝑣𝑒ℎ = fuel consumption factor (kg per vehicle-km)
𝐷𝐸𝑀𝑣𝑒ℎ = transport demand (millions of vehicles-km)
𝐸𝐶𝑓𝑢𝑒𝑙 = energy content which is assumed to be 43 MJ/kg jet fuel.
Passenger air transport demand ( 𝐷𝐸𝑀𝑣𝑒ℎ ) in vehicles-km is calculated in the same way as
in the road modes, i.e. multiplying the number of aircraft with the average annual distance
(kilometres per aircraft) and the assumed utilisation rate of the fleet (assumed to be 0.95).
The fuel consumption factor ( 𝐹𝐶𝐹𝑣𝑒ℎ ) in terms of kilogram of fuel per vehicle-km is
calculated as the fuel consumption weighted average of the aircraft types included in the
survey performed by the MEEI. However, as we used external sources of information on
aircraft fuel consumption and cruising speed, i.e. Purwanto et al. (2017), the MEEI results
show some inconsistencies.

40
Table 4-11. Average Aircraft Fuel Consumption Factors Type of Aircrafts Surveyed Average Fuel Consumption
(kg/hour)
Average Cruising Speed (km/h)
B737 3,340 605
B767 6,449 639
B767 6,449 639
B737 3,340 605
F-50 1,011 321
10-360L2A 916 271
ERJ-145 2,360 444
B767-300 6,449 639
Forcer-50 1,011 321
B767-300 6,449 639
B767-300 6,449 639
Source: Purwanto et al. (2017).
5. Calculation Results
5.1 Energy efficiency
Table 4-12 to Table 4-16 show the results of transport sector EEIs. For passenger transport,
the EEIs are calculated in gigajoules/passenger-km (GJ/pass-km); for freight transport, the
indicators are given in gigajoules/ton-km (GJ/ton-km).
For both passenger and freight transport, the calculation results of EEIs in terms of
GJ/vehicle-km are given (Table 4-12).

41
Table 4-12. Calculation Results of Road Passenger Mode
Vehicle Type Number of
Vehicles
Ave
rage
ye
arly
(km
)
Ave
rage
Fu
el C
on
sum
pti
on
Fac
tors
(lit
re/1
00
km
)
Ass
um
ed
Uti
lisat
ion
Rat
e
Tran
spo
rt V
olu
me
(m
illio
n v
eh
icle
s-km
)
Ass
um
ed
Fu
el T
ype
Ass
um
ed
En
erg
y C
on
ten
t (M
J/lit
re)
Fue
l Co
nsu
mp
tio
n (
GJ)
Ro
ad P
asse
nge
r T
urn
ove
r (m
illio
n
pas
sen
gers
-km
)
Ene
rgy
Effi
cie
ncy
(G
J/p
asse
nge
rs-k
m)
ind
icat
ors
(G
J/p
ass-
km)
Ene
rgy
Effi
cie
ncy
In
dic
ato
rs (
GJ/
veh
icle
-
km)
(GJ/
veh
-km
)
Sedans 426,065 12,000 10.3 0.1 511.278 gasoline 35.2 1,852,875 0.0036
Buses 18,570 16,000 35.4 0.3 89.136 diesel 37.3 1,177,720 0.0132
Taxis 800 73,000 8.0 0.3 17.52 gasoline 35.2 49,585 0.0028
Road Passenger
617.934 3,080,180 2,125.70 0.0014 0.0050
Source: Authors’ calculation.
Table 4-13. Calculation Results of Roadc Freight Mode (Trucks)
Vehicle Type
No. of Vehicles
Average Yearly Distance
(km)
Average Fuel Consumption
(litre/100 km)
Assumed Utilisation
Rate
Transport Volume
(vehicles-km)
Assumed Fuel
Assumed Energy
Content (MJ/litre)
Fuel Consumption
(GJ)
Freight Turnover (million
tons-km)
Energy Efficiency Indicators (GJ/ton-
km)
Energy Efficiency Indicators
(GJ/vehicle-km)
Trucks 13,1573 12,000 12.0 0.4 631,550,400 diesel 37.3 14,625,887 6,744.9 0.0021 0.0231
Source: Authors’ calculation.

42
Table 4-14. Calculation Results of Rail Passenger Mode
Vehicle Type Total no. of
Locomotives No
. of
Pas
sen
ger
Wag
on
s
Ave
rage
An
nu
al
Dis
tan
ce (
km)
Uti
lisat
ion
rat
e
Ave
rage
Fu
el
Co
nsu
mp
tio
n
Fact
or
(lit
re/1
00
km
)
Tran
spo
rt
Vo
lum
e
(lo
com
oti
ves-
km)
Ass
um
ed
Fu
el
Ass
um
ed
Ene
rgy
Co
nte
nt
(MJ/
litre
)
Fue
l
Co
nsu
mp
tio
n
(GJ)
Pas
sen
ger
Turn
ove
r
(mill
ion
pas
sen
gers
-km
)
Ene
rgy
Effi
cie
ncy
In
dic
ato
rs
(GJ/
pas
sen
gers
-
km)
Locomotives 138 608 42,990 0.9 2,215 776,820 diesel 37.3 641,775 993.70 0.00065
Source: Authors’ calculation.
Table 4-15. Calculation Results of Rail Freight Mode
Vehicle Type Total no. of
Locomotives
No. of Freight Wagons
Average Annual
Distance (km)
Utilisation Rate
Average Fuel Consumption
Factor (litre/100 km)
Transport Volume
(Locomotives-km)
Assumed Fuel
Assumed Energy
Content (MJ/litre)
Fuel Consumption
(GJ)
Freight Turnover (million
tons-km)
Energy Efficiency Indicators (GJ/tons-
km)
Locomotives 138 3,571 42,990 0.9 2,215 4,562,538 diesel 37.3 3,769,374 15,315.30 0.00025
Source: Authors’ calculation.
Table 4-16. Calculation Results of Air Passenger Mode
Vehicle Type
No. of Vehicles
Average Annual
Distance (km)
Average Fuel Consumption Factor
(kg fuel/vehicle hour)
Assumed Utilisation Rate (kg
fuel/vehicle-km)
Transport Volume
(vehicles-km)
Assumed Fuel
Assumed Energy
Content (MJ/kg
fuel)
Fuel Consumption
(MJ)
Fuel Consumption
(GJ)
Passenger Turnover (million
passengers-km)
Energy Efficiency Indicators
(GJ/passengers-km)
Air passenger
18 510,327.27 5,022 8.16 0.95 8,726,596 jet fuel 43 3,062,454,294 3,062,454 1,573.50 0.0019
Source: Authors’ calculation.
Table 4-17 compares the results of the international study on energy efficiency in the transport sector.
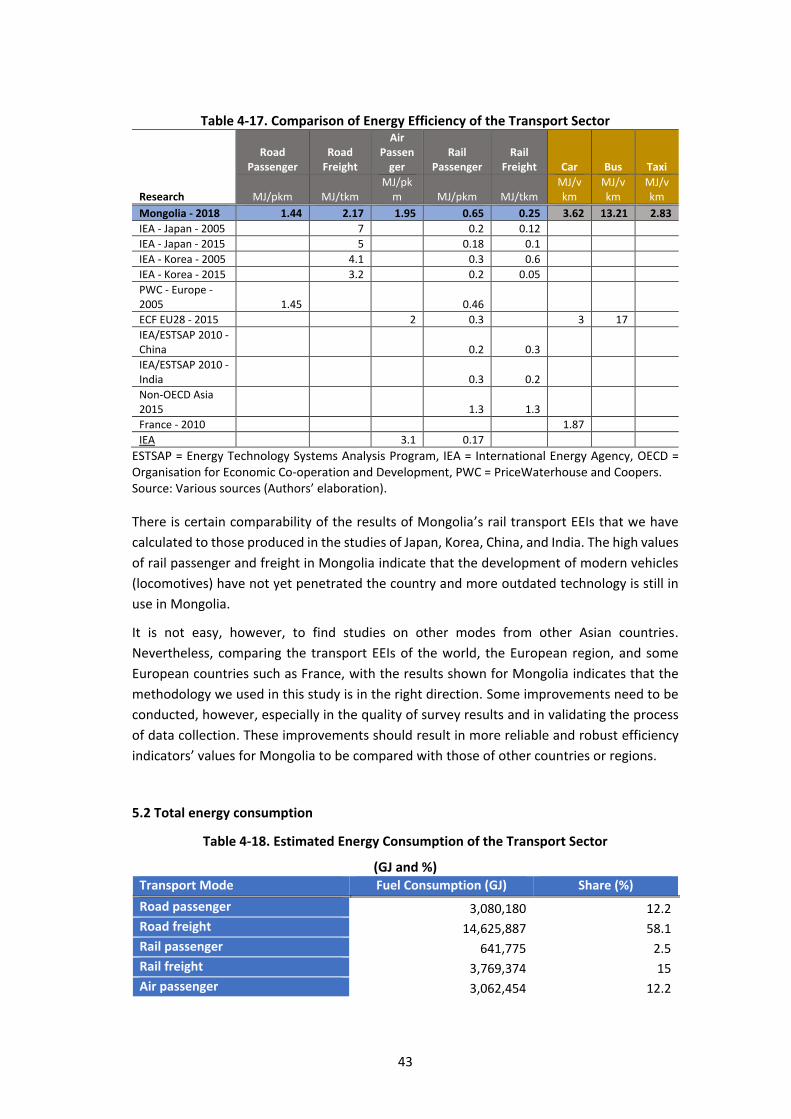
43
Table 4-17. Comparison of Energy Efficiency of the Transport Sector
Research
Road Passenger
Road Freight
Air Passen
ger Rail
Passenger Rail
Freight Car Bus Taxi
MJ/pkm MJ/tkm MJ/pk
m MJ/pkm MJ/tkm MJ/vkm
MJ/vkm
MJ/vkm
Mongolia - 2018 1.44 2.17 1.95 0.65 0.25 3.62 13.21 2.83
IEA - Japan - 2005 7 0.2 0.12 IEA - Japan - 2015 5 0.18 0.1 IEA - Korea - 2005 4.1 0.3 0.6 IEA - Korea - 2015 3.2 0.2 0.05 PWC - Europe - 2005 1.45 0.46 ECF EU28 - 2015 2 0.3 3 17 IEA/ESTSAP 2010 - China 0.2 0.3 IEA/ESTSAP 2010 - India 0.3 0.2 Non-OECD Asia 2015 1.3 1.3 France - 2010 1.87 IEA 3.1 0.17
ESTSAP = Energy Technology Systems Analysis Program, IEA = International Energy Agency, OECD = Organisation for Economic Co-operation and Development, PWC = PriceWaterhouse and Coopers. Source: Various sources (Authors’ elaboration).
There is certain comparability of the results of Mongolia’s rail transport EEIs that we have
calculated to those produced in the studies of Japan, Korea, China, and India. The high values
of rail passenger and freight in Mongolia indicate that the development of modern vehicles
(locomotives) have not yet penetrated the country and more outdated technology is still in
use in Mongolia.
It is not easy, however, to find studies on other modes from other Asian countries.
Nevertheless, comparing the transport EEIs of the world, the European region, and some
European countries such as France, with the results shown for Mongolia indicates that the
methodology we used in this study is in the right direction. Some improvements need to be
conducted, however, especially in the quality of survey results and in validating the process
of data collection. These improvements should result in more reliable and robust efficiency
indicators’ values for Mongolia to be compared with those of other countries or regions.
5.2 Total energy consumption
Table 4-18. Estimated Energy Consumption of the Transport Sector
(GJ and %) Transport Mode Fuel Consumption (GJ) Share (%)
Road passenger 3,080,180 12.2
Road freight 14,625,887 58.1
Rail passenger 641,775 2.5
Rail freight 3,769,374 15
Air passenger 3,062,454 12.2

44
Total transport 25,179,671 100
Source: Authors’ calculation.
According to the estimation results (Table 4-18), 58% of the total fuel consumption in the
transport sector goes to road freight mode, i.e. trucks, and 15% goes to rail freight modes.
Air and road passenger modes consume around 12% each, and rail passenger mode
consumes around 2.5%.
5.3 Energy intensity: relating energy consumption to the economy
Based on IEA (2014b) using the nominal GDP per capita 2018 data for Mongolia of 4,122
US$/capita and the calculated total energy consumption in passenger transport of 6,784,409
GJ, the passenger transport energy intensity in Mongolia is calculated at 1,646 GJ/US$ per
capita. This means that for each US dollar per capita, Mongolia needs to consume energy in
terms of its passenger transport activity of around 1,646 GJ or about 39 tonnes of oil
equivalent (toe) by.
For freight transport, Brunel (2005) and IEA (2014b) define transport intensity as the ratio
between the number of tons-km realised in a country by freight vehicles and the value of the
GDP of this country. It represents the number of transport units (ton-km) made by freight
vehicles necessary to produce one unit of output, i.e. GDP (US$1.00).
For Mongolia, with the 2018 industry GDP of about US$4,970 and a total freight transport
turnover of 22,060 million ton-km, the freight transport intensity is around 0.004 ton-
km/US$. This means that in 2018 Mongolia needed 4 kg-km of goods to be transported by
freight vehicles to produce US$1.00 of GDP.
As the total freight transport in Mongolia consumed about 18.4 million GJ in 2018, then the
freight transport energy intensity of Mongolia was estimated at 3.7 kJ/US$ or around 0.103
litre of diesel fuel/US$. This signifies that, in 2018, Mongolia’s freight transport needed to
consume around 0.103 litres of diesel fuel to produce US$1.00 of GDP.
45
Chapter 5
Commercial Sector
1. Energy Efficiency Indicators in the Commercial Sector
Energy efficiency indicators (EEIs) in the commercial sector are intensities, presented as a
ratio between yearly energy consumption (measured in energy unit, kWh) and gross floor
area (measured in square metre). This ratio is referred to as building energy intensity (BEI) in
this chapter. For meaningful comparison, the BEI values are compared only amongst the
same building sub-sector or building category. In other words, the BEIs of office buildings,
retail buildings, hotels, hospitals, etc. are compared within the same category or type of
building. Therefore, BEIs are computed at the sub-sectoral level and are computed as follows:
𝐵𝑢𝑖𝑙𝑑𝑖𝑛𝑔 𝐸𝑛𝑒𝑟𝑔𝑦 𝐼𝑛𝑡𝑒𝑛𝑠𝑖𝑡𝑦 =𝑌𝑒𝑎𝑟𝑙𝑦 𝑒𝑛𝑒𝑟𝑔𝑦 𝑐𝑜𝑛𝑠𝑢𝑚𝑝𝑡𝑖𝑜𝑛
𝐺𝑟𝑜𝑠𝑠 𝑓𝑙𝑜𝑜𝑟 𝑎𝑟𝑒𝑎
Where:
1) Yearly energy consumption is the total energy usage in a building in one year.
2) Gross floor area is the gross build-up area of a building including common areas such as
reception area, corridors inside buildings, etc. but excludes any covered carpark area.
2. Effective Samples
Amongst the 200 survey data collected from the commercial sector, four survey s
questionnaire had insufficient data. The remaining 196 survey questionnaires were
considered valid samples for analysis. The heat energy usage was estimated using a
calculation method. The segregation of electricity usage by appliance was not considered in
this study.
3. End-Use of Energy of Sub-sectors
All business entities involved in the survey are mainly connected to the central power grid
and most entities use backup power from gensets, which use diesel fuel.

46
Figure 5-1 Share of Generator Set Installations as the Commercial Sector’s Backup Energy Source
Source: MEEI.
In total, 59% of the entities used a backup power source, and only 41% entirely relied on
electricity from the centralised network.
Table 5-1 shows the consumption of different types of energy – electricity, heat, diesel, and
gas – used in the commercial sector (Table 5-1).
Table 5-1. Energy Consumption of Each Sub-sector (kWh) Type of Energy Restaurant Hotel Office Shopping
Mall
Hospital
Electricity 2,296,885 23,929,114 43,241,914 75,633,432 14,656,147
Diesel generator - 303,610 269,660 122,899 793,363
LPG 7,379,789 - - - -
Heat 8,801,068 43,645,983 359,783,676 79,467,285 30,774,046
Total energy consumption 18,477,743 67,878,708 403,295,251 155,223,616 46,223,557
LPG = liquefied petroleum gas. Source: MEEI.
The percentage breakdown of energy sources for each sub-sector is shown in Table 5-2. It
should be highlighted that liquefied petroleum gas (LPG), which takes up about 40% of the
total energy consumption in this sub-sector, is mainly used in restaurants for cooking.
Without genset
41%
Using backup genset
59%
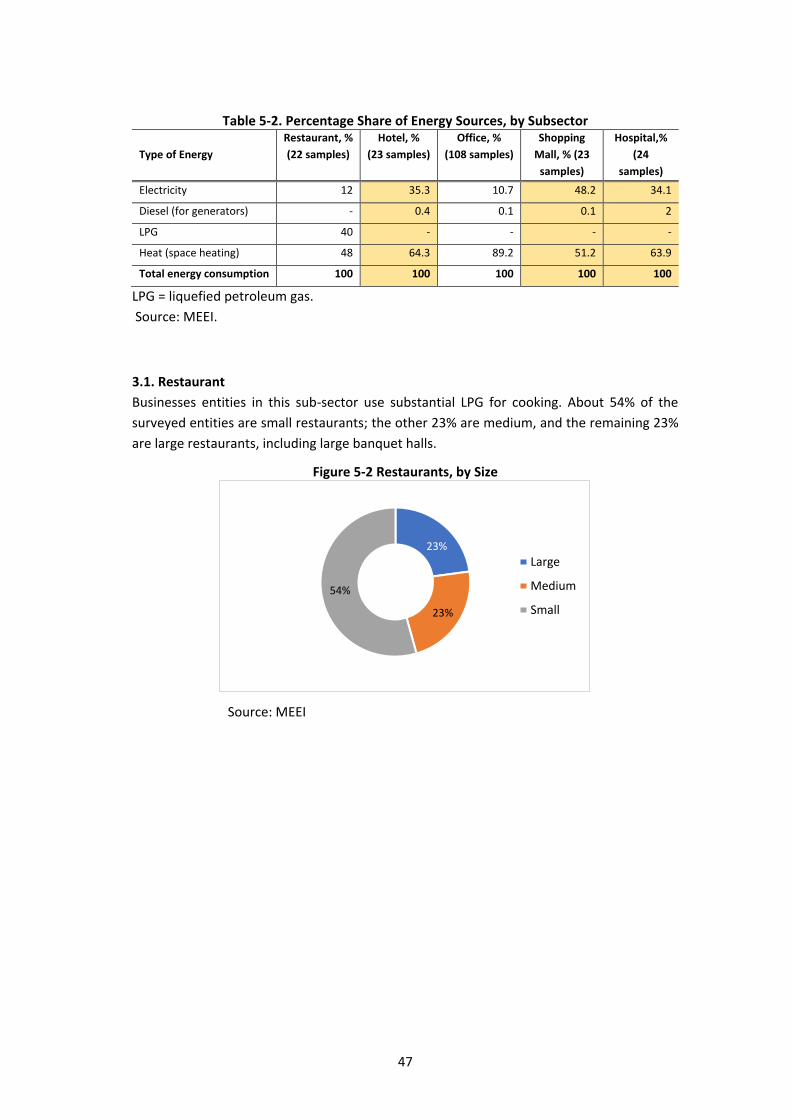
47
Table 5-2. Percentage Share of Energy Sources, by Subsector
Type of Energy
Restaurant, %
(22 samples)
Hotel, %
(23 samples)
Office, %
(108 samples)
Shopping
Mall, % (23
samples)
Hospital,%
(24
samples)
Electricity 12 35.3 10.7 48.2 34.1
Diesel (for generators) - 0.4 0.1 0.1 2
LPG 40 - - - -
Heat (space heating) 48 64.3 89.2 51.2 63.9
Total energy consumption 100 100 100 100 100
LPG = liquefied petroleum gas.
Source: MEEI.
3.1. Restaurant
Businesses entities in this sub-sector use substantial LPG for cooking. About 54% of the
surveyed entities are small restaurants; the other 23% are medium, and the remaining 23%
are large restaurants, including large banquet halls.
Figure 5-2 Restaurants, by Size
Source: MEEI
23%
23%
54%
Large
Medium
Small

48
Figure 5-3 Percentage Share of LPG vs Other Energy Sources Used in Restaurants
LPG = liquefied petroleum gas.
Source: MEEI.
According to the survey, 40% of the energy consumption of restaurants and banquet halls
come from LPG (Table 5-2 and Figure 5-3).
3.2 Hotel
The majority of hotels are three stars or above, and the remaining 30% are smaller hotels. All
these smaller hotels operate in the countryside and do not use any power source and LPG.
Large hotels use backup energy sources and most of them operate in Ulaanbaatar Figure 5-4).
0%
10%
20%
30%
40%
50%
60%
70%
80%
90%
100%
40%LPG

49
Figure 5-4 Percentage Breakdowns of Hotel Ratings
Source: MEEI.
3.3 Office
Most of the surveyed entities do not use any additional backup power source; only 14% use
an additional backup source of energy.
Figure 5-5 Use of Power Source
Source: MEEI.
26%
22%22%
30%
5 star
4 star
3 star
Below 3
86%
14%
Standby generator Without standby generator

50
Companies use backup energy generators for an average of only 10% per year ().
Figure 5-6 Percentage Share of Electricity Consumption vs Fuel Energy Source Used in Office Buildings
Source: MEEI.
3.4 Shopping mall
About 26% of the shopping malls involved in the survey use backup diesel generators
Figure 5-7 Use of Backup Gensets in Retail Stores and Shopping Centres
Source: MEEI.
0%
10%
20%
30%
40%
50%
60%
70%
80%
90%
100%
Total fuel consumption of standby generator set Total Electricity Consumption (kWh / year)
Using backup genset
26%
without backup genset
74%

51
3.5 Hospital
Sixty-one percent of the sample survey was obtained from large hospitals, and all hospitals
involved in the survey use backup power sources, as illustrated in Figure 5-8.
Figure 5-8 Hospitals Covered by the Survey
Source: MEEI.
Figure 5-9shows that hospitals covered in the survey had 5% of the total electricity
consumption relying on a backup power source.
Figure 5-9 Percentage Share of Electricity Usage vs Fuel Usage
Source: MEEI.
Large61%
medium22%
small17%
75%
80%
85%
90%
95%
100%
1 2 3 4 5 6 7 8 9 1011121314151617181920212223
Generated by backup genset
Generating
electricity using a
backup generator 5%

52
4. Building Energy Intensity
Calculation of the BEI of the commercial sector is based on total yearly energy consumption
divided by gross floor area, which is expressed in kWh/m2/year. The average energy intensity
of each sub-sector calculated from the survey data is shown in Table 5-3. It should be
highlighted that the values of the average BEIs derived from this survey for the various sub-
sectors are only indicative. For more accurate establishment of BEI values, continuous effort
to collect quality data is necessary. A larger pool of data with updated review and analyses
would improve the accuracy of BEI values that would provide more accurate information on
the energy performance of the respective sub-sectors.
Table 5-3. Average Building Energy Intensity
Sector Average BEI (kWh/m2/year)
Hotel 865
Restaurant 808
Office 495
Shopping mall 591
Hospital 682
Source: MEEI.
Figure 5-10 Average Building Energy Intensity of Each Sub-sector (kWh/m2/year)
Source: MEEI.
682
591
495
808
865
0 100 200 300 400 500 600 700 800 900 1000
Hospital
Shopping mall
Office
Restaurant
Hotel
53
The survey found that the average BEI of hotels is the highest whilst the office sub-sector has
the lowest level of energy intensity at 495 kWh/m2/y. However, it is not correct to compare
the BEI of hotels and offices because they are different sub-sectors and their functions are
different. First, the operating hours are different: hotels operate 24 hours per day throughout
the year compared with 8–10 hours per day during working days for office buildings. Second,
hotels have more energy-intensive facilities and services than office buildings. In other
words, the comparison of BEIs should be confined to buildings within the same sub-sector or
building category.
It is interesting to note that the average BEI for restaurants at 808 kWh/m2/y is higher than
that of shopping malls at 591 kWh/m2/y although both sub-sectors are expected to have
similar operating hours. The difference in this case is possibly due to the large consumption
of LPG reported in the restaurant sub-sector. However, more data are required in the future
for further validation and verification.
The average BEI of each sub-sector in Ulaanbaatar and rural areas was analysed. Companies
operating in Ulaanbaatar consume more energy than rural entities. Comparing the EEIs in
both urban and rural areas (Figure 5-11 to Figure 5-15, the average BEI for hotels, offices,
hospitals, and restaurants in urban (Ulaanbaatar) areas are generally higher than their
respective sub-sectors in rural areas.

54
Figure 5-11 Average Building Energy Intensity of hotels (kWh/m2/year)
Source: MEEI.
Figure 5-15 5-11shows that hotels in urban areas generally consume more energy than that
of rural areas. This is expected because hotels in urban areas are usually equipped with more
energy-intensive facilities and services. Figure 5-12 shows the comparison of the average BEI
of large, medium, and small retail buildings. In general, large retail buildings are more energy
intensive, compared with medium and small retail buildings. It should be noted that the
sampling size of the survey of medium-sized retail buildings is insufficient to make a
conclusive statement about their energy performnce. However, based on the data available,
the their average energy intensity seems to be marginally higher than that of small retail
buildings.
0
200
400
600
800
1.000
1.200
1.400
1.600
1.800
2.000
Ulaanbaatar
912.81
0
200
400
600
800
1.000
1.200
1.400
Rural
727.61

55
Figure 5-12 Average Building Energy Intensity of Shopping Centres and Stores (kWh/m2/year)
Source: MEEI.
Figure 5-13compares office energy performance between urban and rural areas. The average
BEI of urban office buildings is higher than rural office buildings. Similarly, the average BEI of
hospitals in urban areas is much higher than that in rural areas, as shown in Figure 5-14. This
is likely due to the difference in the range of hospital services in urban areas, compared with
that of rural area hospitals. Figure 5-15compares the average BEIs of restaurants in urban
and rural areas.
0
200
400
600
800
1.000
1.200
1.400
Large
0
100
200
300
400
500
600
700
Medium
0
100
200
300
400
500
600
700
800
Small

56
Figure 5-13 Average Building Energy Intensity of Office Buildings (kWh/m2/year)
Source: MEEI.
Figure 5-14 Average Building Energy Intensity of Hospitals (kWh/m2/year)
Source: MEEI.
Figure 5-15 Average Building Energy Intensity of Restaurants (kWh/m2/year)
Source: MEEI.
0
500
1.000
1.500
2.000
2.500
3.000
3.500
4.000
Ulaanbaatar
575.7
0
100
200
300
400
500
600
700
Rural
429.6
0
200
400
600
800
1.000
1.200
1.400
1.600
Ulaanbaatar
830.90
0
100
200
300
400
500
600
700
800
Rural
478.18
0
200
400
600
800
1.000
1.200
1.400
892.41
Ulaanbaatar
0
100
200
300
400
500
600
700
800
900
1.000
737.27
Rural

57
Chapter 6
Industry Sector
1. Energy Efficiency Indicators in the Industry Sector
In principle, energy efficiency indicator (EEI) is the ratio of energy consumption per activity.
In other words, it is the amount of energy required to conduct an activity. In the industry
sector, activity is the process of producing an output. Thus, it can be measured in quantity
produced or its value. Since the industry sector is very complex, a detailed understanding of
the various processes or product types would be necessary to monitor energy efficiency.
The Manual on Energy Efficiency Indicators (IEA, 2014b) of the International Energy Agency
differentiates the aggregate indicators and the disaggregate indicators. The aggregate
indicators (Figure 6-1) refer to the overall energy consumption of industry expressed either
in absolute terms or as the share in total final consumption and to the share of each energy
source in the total industry consumption mix. These two indicators are enough to provide a
high-level picture of the sectoral consumption and allow a first comparison across countries,
as well as a preliminary assessment of the importance of the various sub-sectors and energy
sources.
Figure 6-1 Pyramid of Industry Indicators
Note: TFC = total final consumption. Source: IEA (2014b).
Another indicator at the aggregate level refers to intensity, which is the total industry energy
consumption divided by total industry value added. This indicator provides a first assessment
of the overall intensity of the sector and its trends. The total output of the sector at the
overall industry level is represented by the sector's value added because the physical output
across the subsectors is not homogeneous. The value added should be in constant currency
to avoid bias induced by fluctuations in the monetary market.

58
The last level of the pyramid refers to the energy consumption of each sub-sector, as a total
or as a share of industry consumption. This level corresponds to the top level of the sub-
sectoral pyramid (Figure 6-2).
Figure 6-2 Pyramid of Freight Transport Indicators
Source: IEA (2014b).
As in the aggregate pyramid, the next level refers to the intensity of the sub-sectors. These
can be consumption per unit of physical output or consumption per value added. The first
indicator is meaningful only when the output is homogeneous, such as crude steel or cement.
If the output is heterogeneous production output, such as in textile or petrochemical facility,
the latter indicator, which is the intensity per value added, can be used or moved to the next
level of disaggregation with data per individual type of product.
At the last level, the indicators refer to a specific production process or product type, instead
of the sub-sector as a whole. These will either be the consumption per unit of physical output
or per value added for each sub-sectoral process or product type. The difficulty for the energy
efficiency analysis at this level is the lack of availability of data or the difficulties in allocating
energy consumption to specific physical output values when outputs are heterogeneous in
the same establishment.
Conducting the survey on the energy consumption of the industry sector is an attempt to
obtain the energy consumption data at the sub-sector level. The result of the industry survey
will describe how energy is being consumed by the sub-sectors surveyed. The unit
consumption per product output or value can be derived from the survey result.
The accuracy of the sub-sector energy intensity is limited to the samples. In this regard,
preparation of the industry sector EEI of Mongolia will require larger samples of the different
sub-sectors and must be inflated to the national level using the national statistics on
industrial production output in physical unit or monetary value.

59
2. Effective Samples
The Mongolian industry sector is divided into three main sub-sectors: (i) mining and
quarrying; (ii) manufacturing; and (iii) electricity, thermal energy, and water supply (ETEWS).
During the research work, 120 sample surveys were conducted from the industry sector. The
collected data was summarised and 89 of them were counted as useful samples.
3. Main Indicators of the Industry Sector
The industry sector survey collected the energy consumption of the sector from six different
areas of the country. Fuel consumption was classified as coal, diesel, wood, liquefied
petroleum gas (LPG), lubricants, and motor gasoline.
Although the industries provided detailed information on their electricity
consumption, they provided limited information on their thermal power consumption. Thus,
thermal energy consumption cannot be calculated.
3.1. Mining and quarrying Sector
The mining and quarrying sector plays a major role in Mongolia’s industry sector. The study
classified this as the coal and others sub-sector.
The coal sub-sector covers nine mining factories located in the western, eastern, southern,
and northern regions of Mongolia. Information on energy consumption, sources, and fuel
consumption was collected and analysed.
Samples for the energy consumption survey of this sector were taken from factories such as
zinc, tungsten, iron, and copper concentrate. The LPG factory of Oyu-tolgoi was not included
in this sector because its energy consumption was too high for the energy consumption
structure (outlier).
3.2. Manufacturing sector
The manufacturing sector covers the factories in Ulaanbaatar, eastern, southern, western,
and northern Mongolia. The study analysed the energy consumption data by fuel source of
75 entities as follows:
• Food – 31
• Construction materials – 13
• Basic metals – 5
• Other – 26
•
During the survey, detailed information on electricity and fuel consumption was collected;
however, information on heat energy consumption was insufficient. The energy consumption
of the subsector was calculated for three fuel types: coal, electricity, and wood. Fuel used in
vehicles was excluded from the survey.
The food sub-sector included meat products, flour, fresh water, beverage, and candy
companies; the units are in cube, cubic metre, and so on. The energy intensities, defined as

60
consumption per output, were calculated based on the sales revenue rather than the physical
quantities.
The construction sub-sector included windows, bricks, blocks, and wood production
companies with outputs measured in metre, cubic metre, ton, etc. The energy intensities
were calculated by comparing sales with physical quantities.
Copper, cathode copper, iron-enriched steel products, and steel ball bearers were included
in the basic metals sub-sector. Although it was possible to quantify the intensities by
quantity, these could not be accounted for in the manufacturing sector compared to sales
revenue.
Other sub-sector includes a wide variety of business entities, such as clothing, textile
products, leather products, shoes, and furniture, and are measured in terms of unit
quantities, such as set, unit, and bill because they are calculated based on sales rather than
physical quantities.
4. Energy Consumption in the Manufacturing and Mining and Quarrying
Sectors
Industry sector energy consumption was estimated for four types of fuels – coal, electricity,
diesel, and wood – for both the mining and quarrying and manufacturing plants (Table 6-1).
Table 6-1. Energy Consumption in the Industry Sector (toe) Energy Type Manufacturing Mining and Quarrying Total
Coal 19,358.42 27,304.81 46,663.24
Electricity 8,668.75 13,194.61 21,863.36
Diesel (for generators) 0.00 86.47 86.47
Wood 12.16 7.93 20.09
Total 28,039.33 40,593.82 68,633.15
Source: Elaboration and calculation of MEEI authors.
The energy consumption of manufacturing plants was 28,039 toe whilst that of mining and
quarrying was almost 40,600 toe. The main fuel used in both sectors was coal. Coal share in
the total energy consumption of the manufacturing sector was 69% whilst for mining and
quarrying, the share was 67.3% (Table 6-2). The electricity share was 30.9% in the
manufacturing sector and 32.5% in the mining and quarrying sector. Diesel was only
consumed by the mining and quarrying sector for generators. The share in the total mining
and quarrying consumption was 0.21%. Only a small amount of wood is consumed by the
manufacturing and mining and quarrying sectors, 0.04% and 0.02%, respectively.
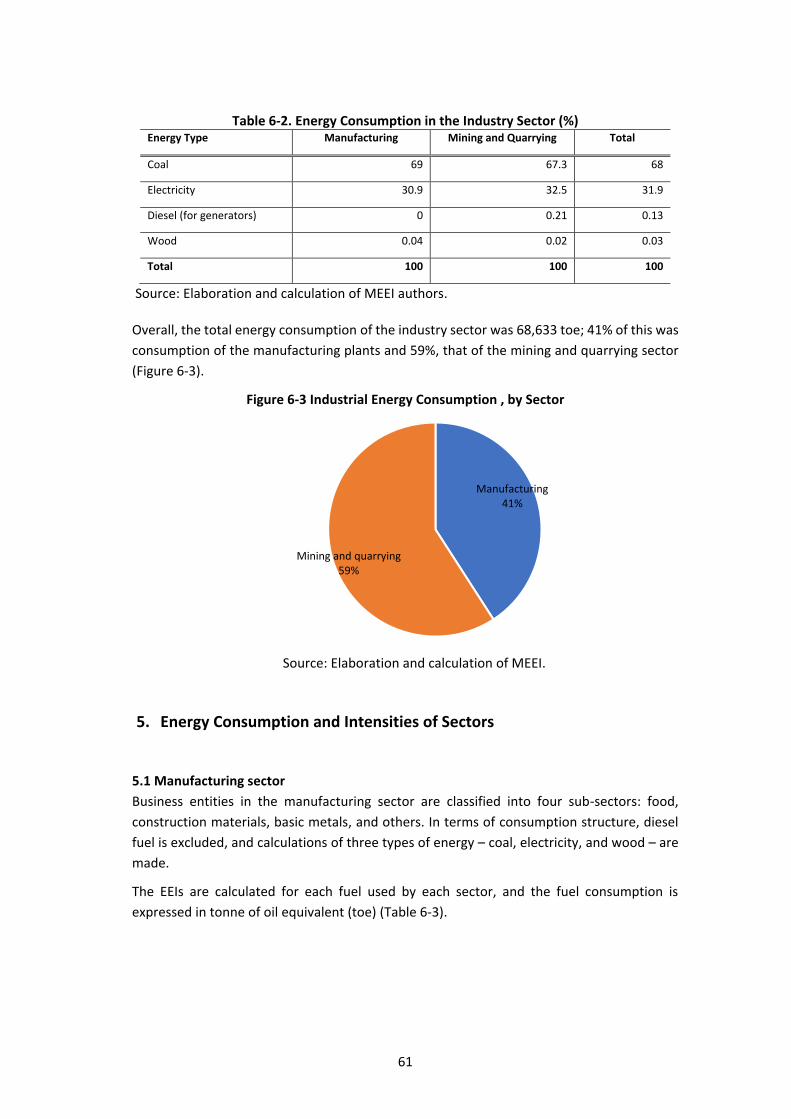
61
Table 6-2. Energy Consumption in the Industry Sector (%) Energy Type Manufacturing Mining and Quarrying Total
Coal 69 67.3 68
Electricity 30.9 32.5 31.9
Diesel (for generators) 0 0.21 0.13
Wood 0.04 0.02 0.03
Total 100 100 100
Source: Elaboration and calculation of MEEI authors.
Overall, the total energy consumption of the industry sector was 68,633 toe; 41% of this was
consumption of the manufacturing plants and 59%, that of the mining and quarrying sector
(Figure 6-3).
Figure 6-3 Industrial Energy Consumption , by Sector
Source: Elaboration and calculation of MEEI.
5. Energy Consumption and Intensities of Sectors
5.1 Manufacturing sector
Business entities in the manufacturing sector are classified into four sub-sectors: food,
construction materials, basic metals, and others. In terms of consumption structure, diesel
fuel is excluded, and calculations of three types of energy – coal, electricity, and wood – are
made.
The EEIs are calculated for each fuel used by each sector, and the fuel consumption is
expressed in tonne of oil equivalent (toe) (Table 6-3).
Manufacturing41%
Mining and quarrying59%
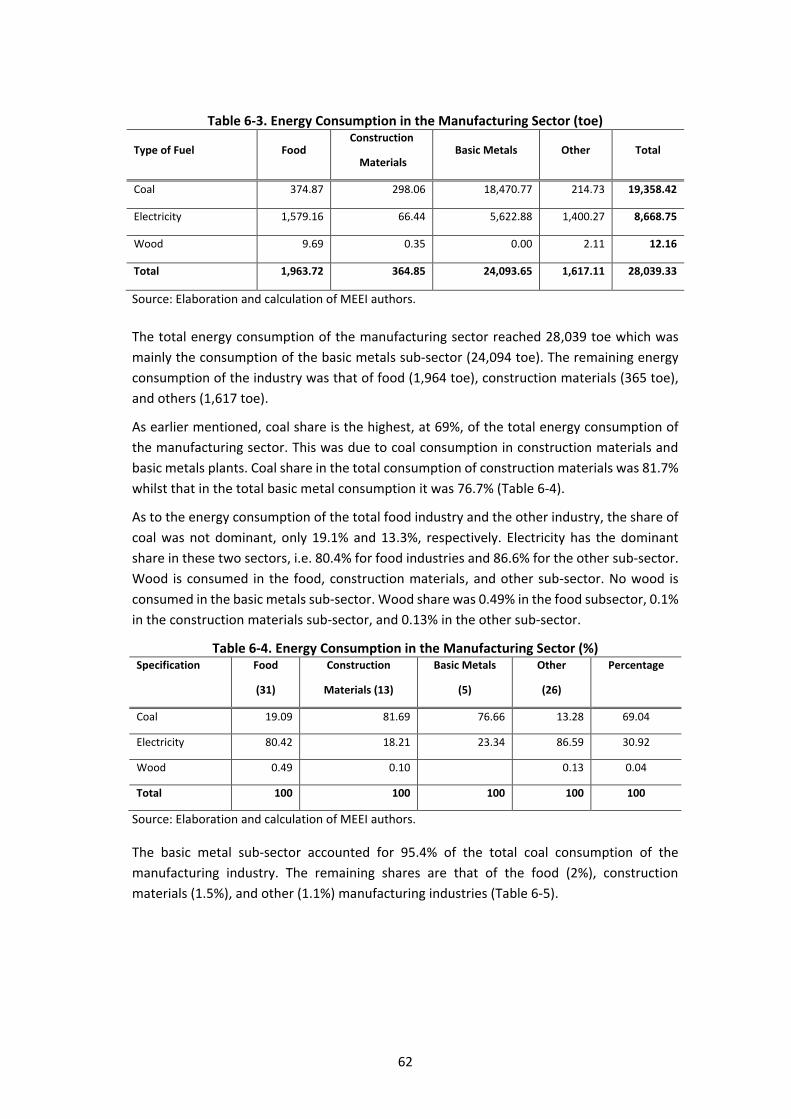
62
Table 6-3. Energy Consumption in the Manufacturing Sector (toe)
Type of Fuel Food
Construction
Materials Basic Metals
Other
Total
Coal 374.87 298.06 18,470.77 214.73 19,358.42
Electricity 1,579.16 66.44 5,622.88 1,400.27 8,668.75
Wood 9.69 0.35 0.00 2.11 12.16
Total 1,963.72 364.85 24,093.65 1,617.11 28,039.33
Source: Elaboration and calculation of MEEI authors.
The total energy consumption of the manufacturing sector reached 28,039 toe which was
mainly the consumption of the basic metals sub-sector (24,094 toe). The remaining energy
consumption of the industry was that of food (1,964 toe), construction materials (365 toe),
and others (1,617 toe).
As earlier mentioned, coal share is the highest, at 69%, of the total energy consumption of
the manufacturing sector. This was due to coal consumption in construction materials and
basic metals plants. Coal share in the total consumption of construction materials was 81.7%
whilst that in the total basic metal consumption it was 76.7% (Table 6-4).
As to the energy consumption of the total food industry and the other industry, the share of
coal was not dominant, only 19.1% and 13.3%, respectively. Electricity has the dominant
share in these two sectors, i.e. 80.4% for food industries and 86.6% for the other sub-sector.
Wood is consumed in the food, construction materials, and other sub-sector. No wood is
consumed in the basic metals sub-sector. Wood share was 0.49% in the food subsector, 0.1%
in the construction materials sub-sector, and 0.13% in the other sub-sector.
Table 6-4. Energy Consumption in the Manufacturing Sector (%) Specification Food
(31)
Construction
Materials (13)
Basic Metals
(5)
Other
(26)
Percentage
Coal 19.09 81.69 76.66 13.28 69.04
Electricity 80.42 18.21 23.34 86.59 30.92
Wood 0.49 0.10 0.13 0.04
Total 100 100 100 100 100
Source: Elaboration and calculation of MEEI authors.
The basic metal sub-sector accounted for 95.4% of the total coal consumption of the
manufacturing industry. The remaining shares are that of the food (2%), construction
materials (1.5%), and other (1.1%) manufacturing industries (Table 6-5).
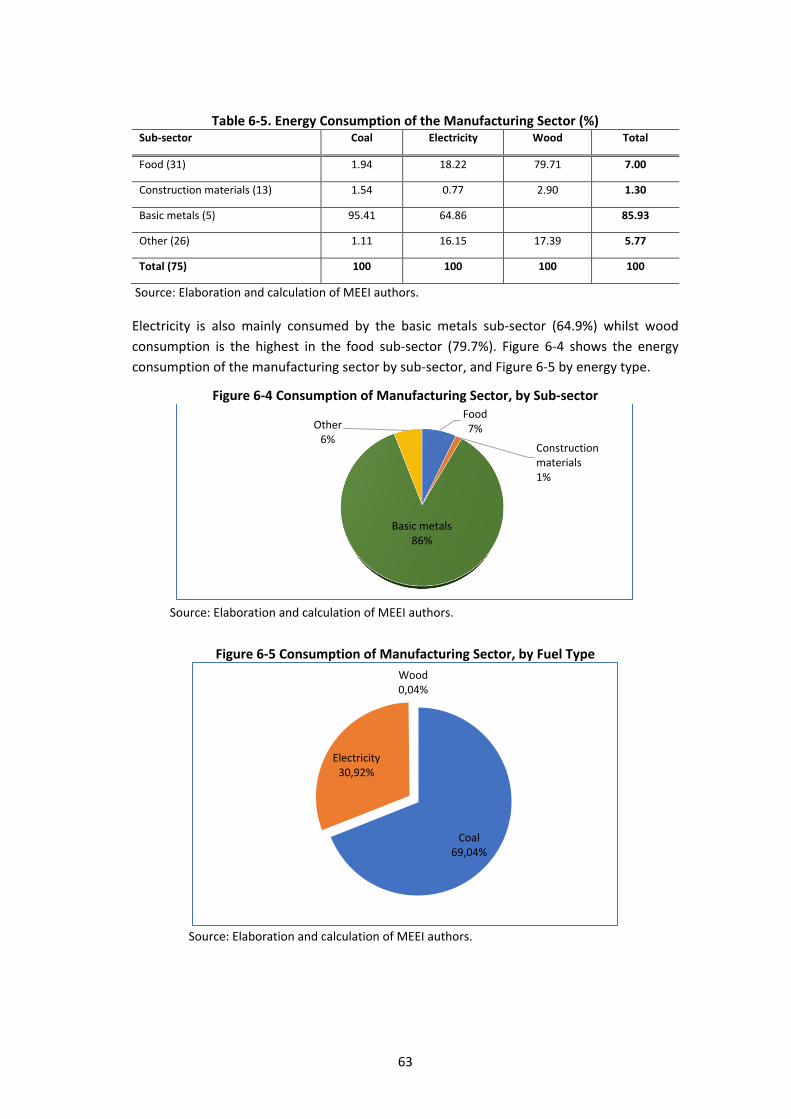
63
Table 6-5. Energy Consumption of the Manufacturing Sector (%) Sub-sector Coal Electricity Wood Total
Food (31) 1.94 18.22 79.71 7.00
Construction materials (13) 1.54 0.77 2.90 1.30
Basic metals (5) 95.41 64.86 85.93
Other (26) 1.11 16.15 17.39 5.77
Total (75) 100 100 100 100
Source: Elaboration and calculation of MEEI authors.
Electricity is also mainly consumed by the basic metals sub-sector (64.9%) whilst wood
consumption is the highest in the food sub-sector (79.7%). Figure 6-4 shows the energy
consumption of the manufacturing sector by sub-sector, and Figure 6-5 by energy type.
Figure 6-4 Consumption of Manufacturing Sector, by Sub-sector
Source: Elaboration and calculation of MEEI authors.
Figure 6-5 Consumption of Manufacturing Sector, by Fuel Type
Source: Elaboration and calculation of MEEI authors.
Food7%
Constructionmaterials1%
Basic metals86%
Other6%
Coal69,04%
Electricity30,92%
Wood0,04%

64
Energy intensity of the manufacturing sector is determined by comparing the total energy
consumed to the size of the sales revenue. The result is shown in Table 6-6 with different
units. Per ₮1 million output, the average energy intensity of the manufacturing sector was
0.0096 toe. By sub-sector, the energy intensity was 0.0007 toe for the food industries; 0.065
toe for the basic metal industries; 0.037 for the building materials; and 0.00097 for the other
manufacturing industries. These results indicate that for the manufacturing sector, more
energy efficiency measures will be needed on the construction materials and basic metals
sub-sectors.
Table 6-6. Energy Intensity Energy Type Unit Food Building Materials Metals Other Total
Energy intensity
toe/million tugrik (₮) 0.00067 0.03708 0.06542 0.00097 0.00959
toe/’000 US$ 0.00178 0.09803 0.17294 0.00256 0.27531
kWh/million ₮ 7.8 431.3 760.8 11.3 111.5
kWh/thousand US$ 20.6 1,140.1 2,011.3 29.8 3,201.8
Source: Elaboration and calculation of MEEI authors.
Figure 6-6 is the graphic form of energy intensity of the manufacturing sector in toe/ million
₮.
Figure 6-6 Energy intensity of the Manufacturing Sector (toe/million tugrik [₮])
Source: Elaboration and calculation of MEEI authors.
Table 6-7 shows the total sales of the various manufacturing sub-sectors – food, construction
materials, basic metals, and other sub-sectors.
-0,0100
0,0000
0,0100
0,0200
0,0300
0,0400
0,0500
0,0600
0,0700
Food – 31 Construction materials – 13
Basic metals – 5 Other – 26 By result of sectoraltotal

65
Table 6-7. Sales of Manufacturing Sector (million tugrik [₮]) Specification Food Construction Materials Basic Metals Other Total
Sales revenue 876,806.4 9,839.2 368,318.7 1,669,082.5 2,924,046.7
Source: Elaboration and calculation of MEEI authors.
5.2 Mining and quarrying sub-sector
The business entities of the mining and quarrying sector are classified into coal and other. In
terms of consumption structure, the types of energy considered are diesel, coal, electricity,
and wood. Diesel is basically for generators.
Similar to the manufacturing sector, this sector's EEIs are calculated for each sub-sector by
fuel usage in tonne of oil equivalent (toe). The resulting energy consumption of the mining
and quarrying sector is shown in Table 6-8.
Table 6-8. Energy Consumption in Mining and Quarrying Sub-sector (toe) Type of Fuel Coal-9 Other-5 Total
Coal 1,108.60 26,196.22 27,304.81
Electricity 2,417.62 10,776.99 13,194.61
Diesel generator 71.34 15.13 86.47
Wood 0.00 7.93 7.93
Total 3,597.55 36,996.27 40,593.82
Source: Elaboration and calculation of MEEI authors.
The sector’s total energy consumption was almost 40,600 toe; the consumption was mainly
that of the other mining and quarrying sub-sector (around 37,000 toe). The energy consumed
by this sub-sector is mainly coal (70.8%) and electricity (29.1%). The remaining fuel consumed
is diesel for generators and wood.
In the coal mining and quarrying sub-sector, the main fuel is electricity, not coal, with share
accounting for 67.2% of the total sub-sector consumption. The other fuel share is that of coal
(30.82%) and diesel generator (1.98%). The energy consumption share of the sub-sector is
shown in Table 6-9.

66
Table 6-9. Energy Consumption Shares of the Mining and Quarrying Sub-sector (%) Type of Energy Coal-9 Other-5 Total Amount
Coal 30.82 70.81 67.26
Electricity 67.20 29.13 32.50
Diesel generator 1.98 0.04 0.21
Wood 0.00 0.02 0.02
Total 100 100 100
Source: Elaboration and calculation of MEEI authors.
In terms of energy type consumed by the mining and quarrying sector, coal consumption in
the other sub-sector accounted for 95.9% of the total coal consumption of the mining and
quarrying sub-sector (Table 6-10). The other sub-sector also consumed most of the electricity
(81.7%) and wood (100%) used by the mining and quarrying sector. In terms of diesel for
generator, the coal sub-sector consumption represented 82.5% of the total sector
consumption.
Table 6-10. Energy Consumption in Mining and Quarrying Sector, by Sub-sector (%) Specification Coal Electricity Diesel, Generator Wood Total
Coal-9 4.1 18.3 82.5 0.0 8.9
Other-5 95.9 81.7 17.5 100.0 91.1
Total-14 100 100 100 100 100
Source: Elaboration and calculation of MEEI authors.
Figure 6-7 shows the total mining and quarrying energy consumption by fuel type whilst
Figure 6-8 by sub-sector.
Figure 6-7 Type of Energy Consumption of the Mining and Quarrying Sector
Source: Elaboration and calculation of MEEI authors.
Coal67,26%
Electricity32,50%
Diesel, generator
0,21%
Wood0,02%
Other0,23%
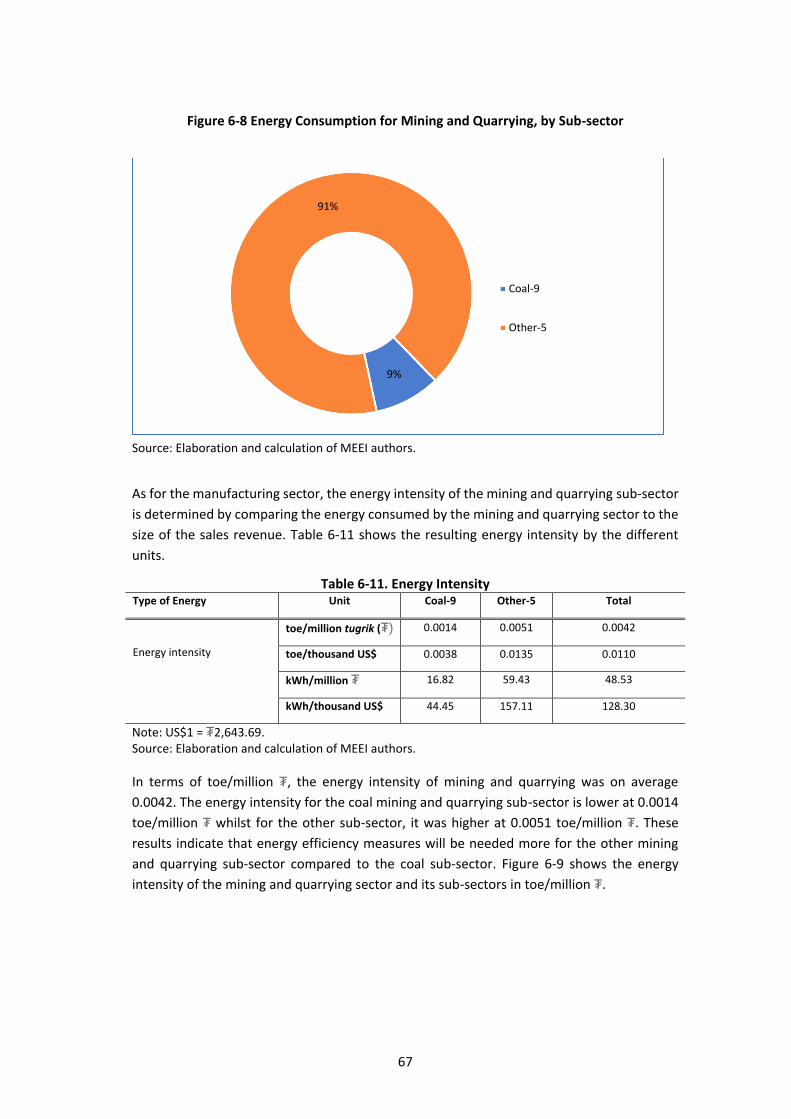
67
Figure 6-8 Energy Consumption for Mining and Quarrying, by Sub-sector
Source: Elaboration and calculation of MEEI authors.
As for the manufacturing sector, the energy intensity of the mining and quarrying sub-sector
is determined by comparing the energy consumed by the mining and quarrying sector to the
size of the sales revenue. Table 6-11 shows the resulting energy intensity by the different
units.
Table 6-11. Energy Intensity Type of Energy Unit Coal-9 Other-5 Total
Energy intensity
toe/million tugrik (₮) 0.0014 0.0051 0.0042
toe/thousand US$ 0.0038 0.0135 0.0110
kWh/million ₮ 16.82 59.43 48.53
kWh/thousand US$ 44.45 157.11 128.30
Note: US$1 = ₮2,643.69. Source: Elaboration and calculation of MEEI authors.
In terms of toe/million ₮, the energy intensity of mining and quarrying was on average
0.0042. The energy intensity for the coal mining and quarrying sub-sector is lower at 0.0014
toe/million ₮ whilst for the other sub-sector, it was higher at 0.0051 toe/million ₮. These
results indicate that energy efficiency measures will be needed more for the other mining
and quarrying sub-sector compared to the coal sub-sector. Figure 6-9 shows the energy
intensity of the mining and quarrying sector and its sub-sectors in toe/million ₮.
9%
91%
Coal-9
Other-5
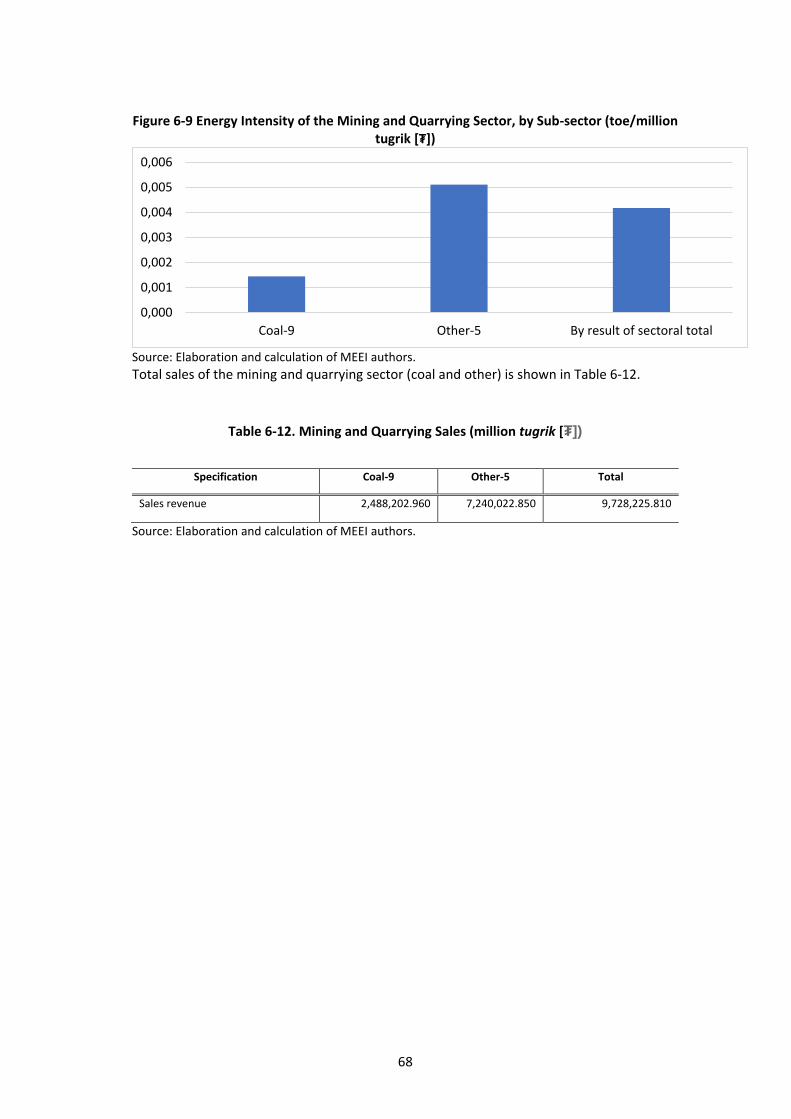
68
Figure 6-9 Energy Intensity of the Mining and Quarrying Sector, by Sub-sector (toe/million tugrik [₮])
Source: Elaboration and calculation of MEEI authors.
Total sales of the mining and quarrying sector (coal and other) is shown in Table 6-12.
Table 6-12. Mining and Quarrying Sales (million tugrik [₮])
Specification Coal-9 Other-5 Total
Sales revenue 2,488,202.960 7,240,022.850 9,728,225.810
Source: Elaboration and calculation of MEEI authors.
0,000
0,001
0,002
0,003
0,004
0,005
0,006
Coal-9 Other-5 By result of sectoral total

69
Chapter 7
Electricity, Thermal Energy, and Water Supply Sector
1. Effective Samples
Twenty sample surveys were conducted for the electricity, thermal energy and water supply
(ETEWS) sector Eleven of them were studied separately from the industry sector because the
production volume was not fully included, the differences in fuel and energy consumption
were high, and the relevant sources were unclear.
2. Electricity, Thermal Energy, and Water Supply Sector
The following sub-sector survey reports were prepared for the ETEWS sector:
• Electricity and thermal energy (ETE)
• Other
The energy consumption and resource/generation data from five different combined heat
and power (CHP) plants was analysed for the ETE sub-sector study. The power plants were in
the central and southern regions of Mongolia. The plants provided detailed data on fuel
consumption including that of coal, diesel, wood, liquefied petroleum gas (LPG), lubricants,
and motor gasoline. Note that some power plants collected the heating consumption data
from the coal consumption amount and the billing payment.
The other sub-sector includes heating boilers, power plants, heating distribution companies.
3. Energy Consumption in the Electricity, Thermal Energy, and Water
Supply Sector
The estimation of the energy consumption of the ETEWS sector includes power and heat
plants. In terms of consumption structures, the following three types of energy were
considered: coal, electricity, and other (lubricants, heavy fuel oils/mazut/and diesel).
The energy efficiency (conservation) in the sector is calculated by the fuel usage by each sub-
sector, and the fuel unit is in tonne of oil equivalent (toe). Table 7-1 shows the results of the
energy consumption in the ETEWS sector.
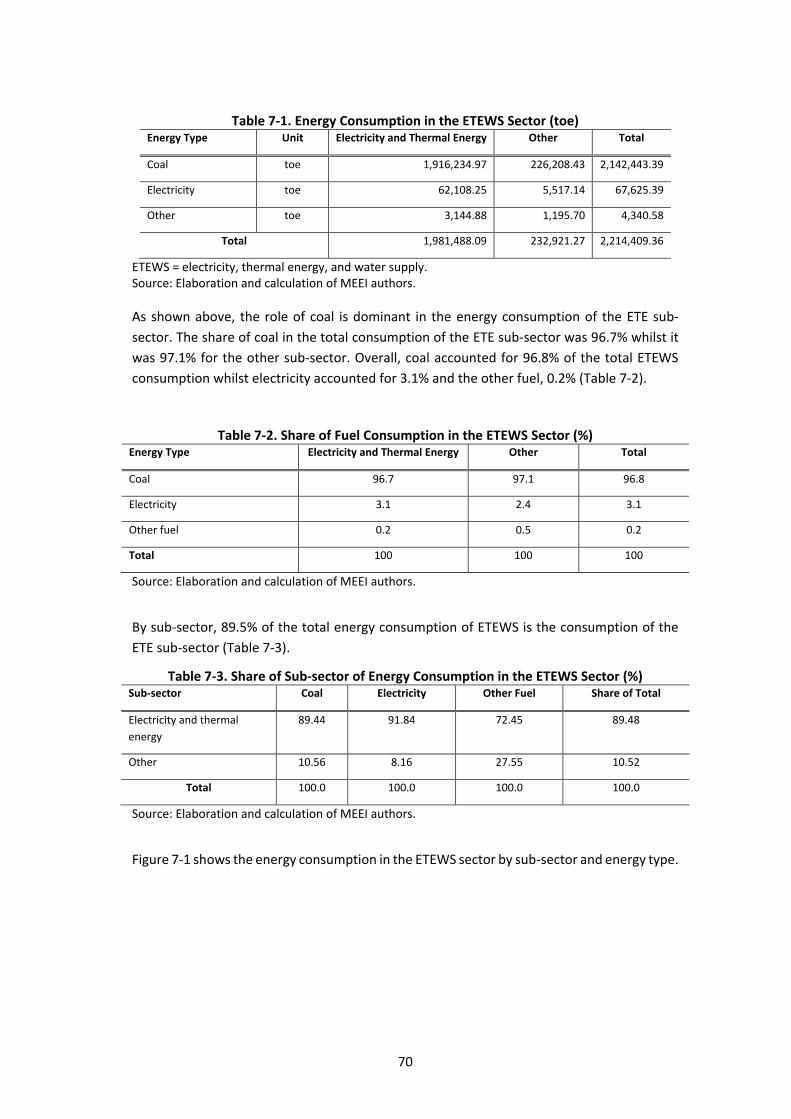
70
Table 7-1. Energy Consumption in the ETEWS Sector (toe) Energy Type Unit Electricity and Thermal Energy Other Total
Coal toe 1,916,234.97 226,208.43 2,142,443.39
Electricity toe 62,108.25 5,517.14 67,625.39
Other toe 3,144.88 1,195.70 4,340.58
Total 1,981,488.09 232,921.27 2,214,409.36
ETEWS = electricity, thermal energy, and water supply. Source: Elaboration and calculation of MEEI authors.
As shown above, the role of coal is dominant in the energy consumption of the ETE sub-
sector. The share of coal in the total consumption of the ETE sub-sector was 96.7% whilst it
was 97.1% for the other sub-sector. Overall, coal accounted for 96.8% of the total ETEWS
consumption whilst electricity accounted for 3.1% and the other fuel, 0.2% (Table 7-2).
Table 7-2. Share of Fuel Consumption in the ETEWS Sector (%) Energy Type Electricity and Thermal Energy Other Total
Coal 96.7 97.1 96.8
Electricity 3.1 2.4 3.1
Other fuel 0.2 0.5 0.2
Total 100 100 100
Source: Elaboration and calculation of MEEI authors.
By sub-sector, 89.5% of the total energy consumption of ETEWS is the consumption of the
ETE sub-sector (Table 7-3).
Table 7-3. Share of Sub-sector of Energy Consumption in the ETEWS Sector (%) Sub-sector Coal Electricity Other Fuel Share of Total
Electricity and thermal
energy
89.44 91.84 72.45 89.48
Other 10.56 8.16 27.55 10.52
Total 100.0 100.0 100.0 100.0
Source: Elaboration and calculation of MEEI authors.
Figure 7-1 shows the energy consumption in the ETEWS sector by sub-sector and energy type.

71
Figure 7-1 Energy Consumption in the ETEWS Sector, by Energy Type and Sub-sector
Source: Elaboration and calculation of MEEI authors.
Energy intensity of the ETEWS sector is determined by comparing its consumption with the
size of the sales revenue. Total intensity of the sector is shown in Table 7-4 in different units.
Table 7-4. Energy Intensity Energy Type Unit Electricity and Thermal Energy Other Total
Energy intensity toe/million tugrik (₮) 5.76 3.44 5.38
toe/thousand US$ 15.24 9.11 14.23
kWh/million ₮ 67,043.22 40,064.30 62,608.64
kWh/thousand US$ 177,241.48 105,917.58 165,517.82
Source: Elaboration and calculation of MEEI authors.
In terms of toe/million ₮, the energy intensity of the ETEWS sector was 5.38. The ETE sub-
sector had an energy intensity of 5.76 toe/mil ₮ which is 0.07% more than in the sector total.
The energy intensity of the other sub-sectors was 3.44 toe/mil ₮ or 0.56% less in the sector
total. This indicates the significant impact of the ETE sub-sector on the energy consumption
of the ETEWS sector. Figure 7-2 shows the energy intensity of the ETEWS sector in toe/million
₮.
Coal96.7%
Electricity3.1%
Other0.2%
By energy type
Electricty and thermal
energy 89%
Other11%
By sub-sector
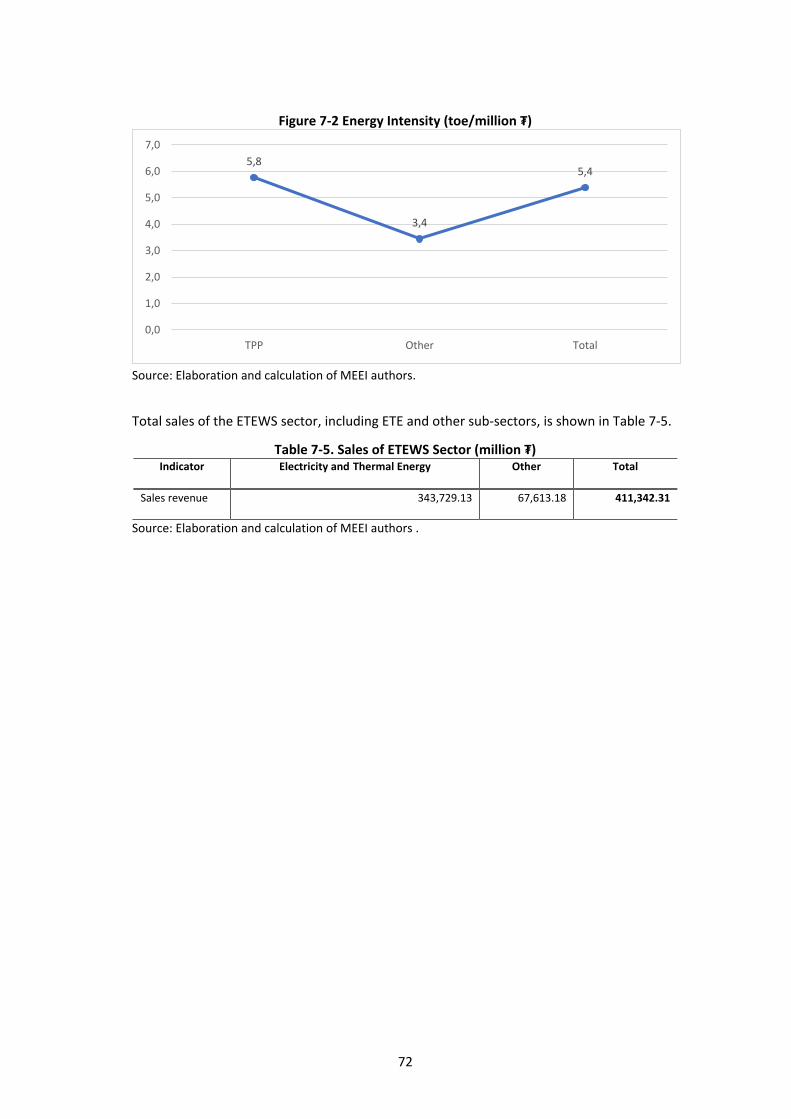
72
Figure 7-2 Energy Intensity (toe/million ₮)
Source: Elaboration and calculation of MEEI authors.
Total sales of the ETEWS sector, including ETE and other sub-sectors, is shown in Table 7-5.
Table 7-5. Sales of ETEWS Sector (million ₮) Indicator Electricity and Thermal Energy Other Total
Sales revenue 343,729.13 67,613.18 411,342.31
Source: Elaboration and calculation of MEEI authors .
5,8
3,4
5,4
0,0
1,0
2,0
3,0
4,0
5,0
6,0
7,0
TPP Other Total

73
Chapter 8
Conclusion
Energy efficiency indicators (EEIs) are different from energy intensities defined by energy
consumption per gross domestic product (GDP). Usually energy intensity is calculated as TPES
(total primary energy supply (TPES)/GDP or TFEC (total final energy consumption)/GDP; it
basically shows the energy performance nationwide and the result of socio- economic
activities in a year. The energy intensities never suggest appropriate energy efficiency policies
and action plans. Thus, we need EEIs to plan appropriate energy efficiency and conservation
(EEC) activities.
All energy is finally consumed by final users – industry, transport, commercial, and residential
sectors. The agriculture, forest, and fishery sector consumes energy for its production
activities but its energy consumption is very small compared to the four sectors mentioned
above. In addition, an electricity-generation sector as a typical transformation sector
consumes fossil fuels, such as coal, to generate electricity. The energy performance of this
sector is gauged by thermal efficiency which depends on power generation technologies such
as clean coal technologies (CCT) and combined cycle gas turbine (CCGT), etc. Similarly, we
need EEIs to gauge the energy performance of each final sector and, based on these EEIs, the
government can plan and set up appropriate and implementable EEC activities and action
plans. If we want to get EEI benchmarking by each final sector, we must conduct a detailed
energy consumption survey in the respective sectors.
The industry sector consists of several sub-industry sectors. We obtained the EEI of each sub-
sector defined as energy consumption (tonne of oil equivalent [toe]) per main production
amount (tonne) or sectoral GDP (monetary unit). If the EEI is very high, we classify this sub-
sector as energy intensive and need to apply EEC action plans to mitigate its energy
consumption.
For transport, generally since the road transport sector is dominant in terms of fuel
consumption, such as gasoline and diesel oil, we get the overall or national average of fuel
economy defined as litre/100 km by each type of vehicle – car (mainly sedan), bus, and truck
– as the EEI of the road transport sector. If we increase the number of more efficient cars,
such as those with small internal combustion engines, and hybrid cars, the EEI of the road
sector surely improves. Also, idling stop technology is another option to mitigate transport
fuel consumption. Based on the EEI of the road sector, government can apply appropriate
and effective policies and action plans to mitigate transport fuel consumption.
The EEIs of the residential and commercial sectors are defined as energy consumption (toe
or kWh) per floor area (m2). In addition, what kinds of energy are consumed for what
purpose, and how electricity is consumed for what purpose (heating space, lighting,
refrigerator, etc.) are important feedback from the survey. Space heating is the main energy
used in Mongolia and its energy consumption depends on attributes of houses and buildings.
Thus, we get the EEI by types of house (standalone, apartment, and ger) and building types
74
(hotel, office, restaurant, shopping mall, and hospital). Based on the EEIs of both sectors,
government can apply various EEC policies and action plans to mitigate energy consumption,
especially electricity consumption, including the Minimum Energy Performance System for
appliances and Building Energy Code, such as Green Building Index for commercial buildings.
In order to get indicative EEIs of each final sector, the Mongolian Energy Economics Institute
(MMEI), with support of the Economic Research Institute for ASEAN and East Asia (ERIA)
conducted a detailed energy consumption survey in whole of Mongolia in 2019. The sample
size of each final sector is as follows: 88 samples from the industry sector (14 samples for
mining and 75 for manufacturing); 203 samples from the transport sector including rail, air,
and ship but mainly from the road sector (170 samples); 400 samples from the residential
sector (140 samples in Ulaanbaatar as an urban area, 260 from the rest of the country as
rural and herder areas); and 200 from the commercial sector (108 samples for offices, 23 for
hotels, 23 for shopping malls, 22 for restaurants, and 24 for hospitals). The sample sizes are
not significant but, of course, not too small. The MEEI, with some local consultants,
conducted the survey in significant parts of Mongolia, so that experience and skill on the
energy consumption survey would remain with MEEI staff. In case of sample surveys,
minimising bias is very important. Consequently, random sampling is usually applied in the
sample survey. But the limited population of the industry and the commercial sectors makes
random sampling unavailable to these sectors.
The energy consumption survey usually uses a specific questionnaire for each sector, and
ERIA provided the MEEI four questionnaires for the four final sectors. The questionnaires
consist of mainly two parts: (i) fact sheet and (ii) energy consumption sheet. The fact sheet
contains attributes of each four sectors – International Standard Industry Classification
number of employees; production amount of main product or gross revenue in the industry
sector; vehicle type, engine capacity, and driving distance in the road transport sector; house
type, family size, and floor area in the residential sector; and type of building and floor area
in the commercial sector. On the other hand, the energy sheet contains the kind of energy,
energy consumption, and its usage. These questionnaires from ERIA were accepted by the
MEEI and used for the energy consumption survey in Mongolia.
After collection of the questionnaires, all collected data from the survey were entered in an
Excel file for validation and analysis. Through validation, outliers are removed through
statistical application, with charts. Basically, outliers are due to mistyping, misunderstanding
of units, etc. After validation, the EEIs are calculated based on the screened sample data.
After this calculation, we evaluated the indicators. But for this evaluation, we needed overall
knowledge to cover energy consumption, economic growth, industrial transition, and change
of lifestyle. In addition, an international comparison of the EEIs is also a good way to evaluate
them. But these EEIs are not well produced globally and can refer only to indicators of the
Organisation for Economic Co-operation and Development.
Through this project, the MEEI obtained lots of experience on the EEIs and the technical skill
in producing and assessing the EEIs. The EEIs will be changed year by year due to changes in
social behaviour, economic growth, lifestyle, and technology development. In this regard, the
MEEI should continue to produce EEIs every 3 to 5 years to reflect or improve current EEC

75
policies and action plans with greater effectiveness and economic benefits. ERIA would like
to support the MEEI continuously and technically in terms of promoting EEC in Mongolia.
References
Amarsaikhan, B. (2016), ‘60 Percent of All Motor Vehicles Registered in UB’, Mongolian News Agency (Montsame), https://montsame.mn/en/read/3589 (accessed 12 November 2019).
Batjargal, B. and T. Matsumoto (2017), ’Estimation and Prediction of Road Traffic Emissions in Ulaanbaatar’, Inventory of Traffic Emission Project, January, https://www.researchgate.net/publication/319734514_Estimation_and_Prediction_of_Road_Traffic_Emissions_in_Ulaanbaatar (accessed 24 June 2020)
Brunel, J. (2005), Freight Transport and Economic Growth: An Empirical Explanation of the Coupling in the EU Using Panel Data. https://halshs.archives-ouvertes.fr/halshs-00004826/document (accessed 22 September 2020)
Energy Regulatory Commission (2018), Energy Statistics. Ulaanbaatar: Energy Regulatory Commission.
Gansukh, M. (2015), Current Situation and future planning of Mongolian Energy Sector, The Government of Mongolia, Ministry of Energy, August https://eneken.ieej.or.jp/data/6234.pdf (accessed 22 September 2020)
International Energy Agency (IEA) (2014a), Energy Efficiency Indicators: Essentials for Policy Making. Paris: IEA.
International Energy Agency (IEA) (2014b), Energy Efficiency Indicators: Fundamentals on Statistics. Paris: IEA.
JICA (1994), Untitled, Open JICA Report, https://openjicareport.jica.go.jp/pdf/11281748_02.pdf (accessed 24 June 2020)
Karali, N., N. Abhyankar, B. Sharpe, A. Bandivadekar (2019), Improving Fuel Efficiency for Heavy-Duty Vehicles of 3.5–12 Tonnes in India: Benefits, Costs, and Environmental Impacts, Energy Analysis and Environmental Impacts Division, Lawrence Berkeley National Laboratory, February.
Ministry of Road and Transport Development (2018), Statistics of Road and Transport Sector. Ulaanbaatar: Ministry of Road and Transport Development.
National Statistics Office of Mongolia (2018a), Mongolian Statistical Information Service. Available at https://www.1212.mn (accessed 1 March 2020).
National Statistics Office of Mongolia (2018b), Statistical Yearbook of Mongolia 2018. Ulaanbaatar: National Statistics Office of Mongolia
ODYSSEE-MURE (2018), Energy Efficiency Indicators at Sub-sector End-Use Level, Regional Training on Indicators, May 2018.

76
Purwanto, A.J., G. De Ceuster, K. Vanherle (2017), ‘Mobility, Vehicle Fleet, Energy Use, and Emission Forecast Tool (MOVEET)’, Transportation Research Procedia (2017) 25, pp.3421–34.
World Bank (2005), Towards a Discussion of Support to Urban Transport Development in India, Energy & Infrastructure Unit South Asia Region. Washington, DC: World Bank.

77
Appendix – Questionnaire
Appendix 1. Residential Sector
General
Urban/ Rural
How many
persons are there
in your househol
d (including
you)? (person)
Type of Dwellin
g
What is your
monthly househol
d income? (Tugrik
[₮])
Do you have a
household- based income-
generating activity?
What is the floor area of
your house/dwelling
? (m2)
Number of
Rooms
How much approximately do you spend for electricity
at your house/dwellin
g per year? (₮/year)
How much approximatel
y do you spend for
space heating?
(for apartment
users)
₮/year)
How much approximately do you spend
for other energy
sources at your
house/dwelling per year?
(₮/year)
How frequently
do you experience outages
in a month?
How long on averag
e do the
outages last in
a month
?
Urban
Other Fuels
Coal LPG Wood Dry Dung Fuel Pellets Khurzun Others
Do you use any othe
r fuel type
?
Use of
Fuel
How much is your
consumption
(tons/year)
Use of
Fuel
How much is your
consumption?
(litre/year)
Use of
Fuel
How much is your
consumption?
(m3/year)
Use of
Fuel
How much is your
consumption?
m3/year
Use of
Fuel
How much is your
consumption?
kg/year
Use of
Fuel
How much is your
consumption
m3/year
Use of
Fuel
How much is your
consumption?
litre/year
Yes
Lighting
Type of Lamp Average Hours of Daily Usage
hour/day Average Power Rating
watts/lamp Annual Consumption
kWh/year
LED CFL Fluorescent
lamp Incandescent
bulb LED CFL
Fluorescent lamp
Incandescent bulb
LED CFL Fluorescent
lamp Incandescent
bulb

78
Refrigerator
Type of Equipment No. of Years in Use Manufacturer or Brand Power Rating (watts) Load Factor Annual Consumption
kWh
Refrigerator
Freezer
Washing machine
Kind of Equipment
No. of Years In
Use
Capacity (kg)
Manufacturer or Brand
Power Rating (watts)
Frequency of Washing/day
Number of Days/week
Hours of Usage Per
Week Load Factor
Annual Consumption
(kWh)
TV
Type of Equipment
No. of Years In
Use
Manufacturer or Brand
Model Size
(inch) Power Rating
(watts) Hours of Daily
Usage Days of Weekly
Usage Annual Consumption
(kWh)
Rice cooker
Manufacturer or Brand No. of Years in Use Power Rating (watts) Frequency of Cooking/day
Days of Daily Usage/week
Annual Consumption (kWh)
Computer
Type of Equipment No. of Years in
Use Manufacturer or
Brand Model
Power Rating (watts)
Hours of Daily Usage
Days of Daily Usage
Annual Consumption
(kWh)
Personal computer
Laptop
Electric stove
Type
No. of Years in Use
Manufacturer pr Brand Power Rating
(watts) Hours of Daily Usage Days of Daily Usage
Annual Consumption (kWh)
Electric stove

79
Iron
Manufacturer or Brand No. of Years in Use Power Rating (watts) Hours of Daily Usage Days of Daily Usage Annual Consumption
(kWh)
Russian
Electric kettle
Manufacturer or Brand No. of Years in
Use Model
Power Rating (watts)
Hours of Daily Usage
Days of Daily Usage
Annual Consumption (kWh)
Akira
Electric heater
Type
No. of Years in Use
Manufacturer or Brand
Power Rating (watts)
Hours of Daily Usage Days of Daily
Usage Load Factor
Annual Consumption (kWh)
Fan
Manufacturer or Brand No. of Years
in Use Model
Power Rating (watts)
Hours of Daily Usage
Days of Daily Usage
Load Factor Annual Consumption
(kWh)
Appendix 2. Transport Sector
Road vehicles (sedan, taxi, bus, and truck)
Classification
Dri
ver
Ge
nd
er
Ho
w m
any
year
s ag
o
did
yo
u o
bta
in a
dri
ver’
s lic
en
se?
Name, Type, and
Purpose of
Vehicles
Engi
ne
Ho
w m
any
year
s h
ave
you
dri
ven
yo
ur
curr
en
t ve
hic
le?
Wh
at is
th
e v
eh
icle
age
? (i
n y
ear
s)
Pro
pe
rty
Typ
e
Fuel Consumption (l/100 km) The distance of
trip (km)
Norm
Consumption Per day
Per month
Loaded Not Loaded
Winter Summer Winter Summer

80
Railway
Classification Age
Ge
nd
er
Ho
w m
any
year
s ag
o
did
yo
u b
eco
me
a
loco
mo
tive
dri
ver?
Name, Type, and Purpose of Locomotive
Engi
ne
Ho
w m
any
year
s
hav
e y
ou
dri
ven
you
r cu
rre
nt
loco
mo
tive
?
Wh
at is
th
e
loco
mo
tive
age
? (i
n
year
s)
Pro
pe
rty
Typ
e
Fuel Consumption (l/100 km) The distance of
trip (km)
Norm
Consumption Per day
Per month
Loaded Not Loaded
Winter Summer Winter Summer
Airplanes
Classification Age
Ge
nd
er
Ho
w m
any
year
s
ago
did
yo
u
be
com
e a
pilo
t?
Name, Type, and Purpose
of Airplane
Engi
ne
Ho
w m
any
year
s
hav
e y
ou
pilo
ted
you
r cu
rre
nt
airp
lan
e?
Wh
at is
th
e
airp
lan
e a
ge?
(in
year
s)
Property Type
Fuel Consumption (kg/h) The distance of trip /km/
Norm
Consumption Per day
Per month
loaded Not loaded
Winter summer Winter summer
Appendix 3. Commercial Sector
Office questionnaire
Nam
e o
f O
ffic
e
& A
dd
ress
(in
dic
ate
To
wn
ship
)
Description of Building
Total Electricity
Consumption (kWh / year)
Total Fuel Consumption of Standby Generator Set
He
at C
on
sum
pti
on
(kW
h/y
r)
We
ekl
y O
pe
rati
on
al H
ou
rs
Ye
arly
Op
era
tio
nal
Ho
urs
Tota
l Gro
ss F
loo
r A
rea
(m2 -
exc
l. c
ar p
ark
& d
ata
cen
tre
)
Tota
l Bu
ildin
g En
erg
y C
on
sum
pti
on
(kW
h/y
r)
Ave
rage
BEI
(kW
h/m
2/y
r)
Spe
cify
Oth
er
Usa
ge
Occ
up
ancy
R
ate
Sto
rey
Lin
k /
Det
ach
ed
Loca
tio
n
(Urb
an/R
ura
l)
Fue
l Typ
e
Litr
e/ye
ar
Ener
gy
Co
nsu
mp
tio
n/Y
ear
(kW
h/
ear)
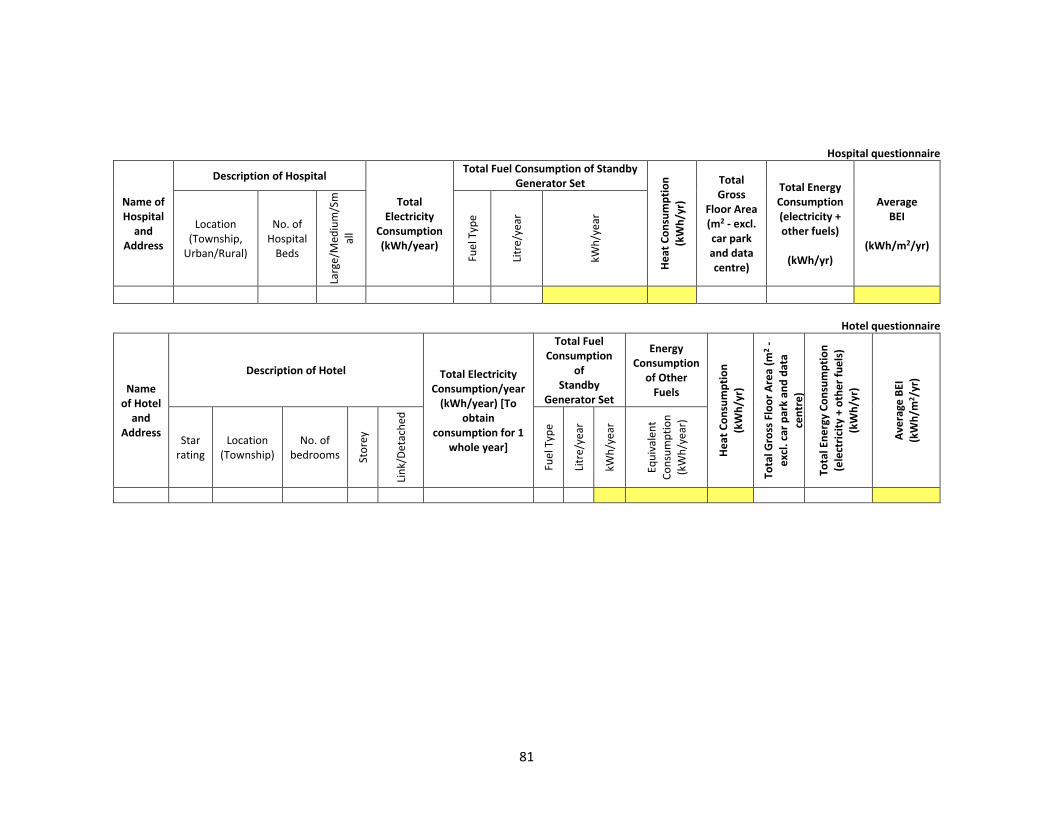
81
Hospital questionnaire
Name of Hospital
and Address
Description of Hospital
Total Electricity
Consumption (kWh/year)
Total Fuel Consumption of Standby Generator Set
He
at C
on
sum
pti
on
(kW
h/y
r)
Total Gross
Floor Area (m2 - excl. car park and data centre)
Total Energy Consumption (electricity + other fuels)
(kWh/yr)
Average BEI
(kWh/m2/yr)
Location (Township,
Urban/Rural)
No. of Hospital
Beds
Larg
e/M
ediu
m/S
m
all
Fue
l Typ
e
Litr
e/ye
ar
kWh
/ye
ar
Hotel questionnaire
Name of Hotel
and Address
Description of Hotel Total Electricity Consumption/year
(kWh/year) [To obtain
consumption for 1 whole year]
Total Fuel Consumption
of Standby
Generator Set
Energy Consumption
of Other Fuels
He
at C
on
sum
pti
on
(kW
h/y
r)
Tota
l Gro
ss F
loo
r A
rea
(m2 -
exc
l. c
ar p
ark
and
dat
a
cen
tre
)
Tota
l En
erg
y C
on
sum
pti
on
(e
lect
rici
ty +
oth
er
fue
ls)
(kW
h/y
r)
Ave
rage
BEI
(kW
h/m
2/y
r)
Star rating
Location (Township)
No. of bedrooms St
ore
y
Lin
k/D
etac
hed
Fue
l Typ
e
Litr
e/ye
ar
kWh
/ye
ar
Equ
ival
ent
Co
nsu
mp
tio
n
(kW
h/y
ear
)

82
Restaurant questionnaire
Name of Air-Conditioned Restaurants and Address
(Indicate Township)
Description of Building
Tota
l Ele
ctri
city
Co
nsu
mp
tio
n
(kW
h/y
ear
)
Energy Consumption of
Other Fuels
He
at C
on
sum
pti
on
(kW
h/y
r)
We
ekl
y O
pe
rati
on
al H
ou
rs
Tota
l Gro
ss F
loo
r A
rea
(m2 -
exc
l. c
ar p
ark
and
dat
a ce
ntr
e)
Tota
l En
erg
y C
on
sum
pti
on
(in
cl. o
the
r fu
els
an
d
ele
ctri
city
)(k
Wh
/ye
ar)
Ave
rage
BEI
(kW
h/m
2/y
r)
No
. of
Sto
rey
Lin
k /
det
ach
ed
Smal
l/M
ediu
m/L
arge
Loca
tio
n (
Urb
an/R
ura
l)
Fue
l Typ
e
Qu
anti
ty/y
ear
Equ
ival
ent
con
sum
pti
on
(kW
h/y
ear
)
Shopping mall questionnaire
Name of Mall/Shop
and Address (Indicate
Township)
Description of Building
Total Electricity Consumption (kWh/year)
Total Fuel Consumption of
Standby Generator Set
He
at C
on
sum
pti
on
(kW
h/y
r)
We
ekl
y O
pe
rati
on
al H
ou
rs
Ye
arly
Op
era
tio
nal
Ho
urs
Tota
l Gro
ss F
loo
r A
rea
(m2 -
exc
l.
car
par
k an
d d
ata
cen
tre
)
Tota
l Bu
ildin
g En
erg
y
Co
nsu
mp
tio
n (
kWh
/ye
ar)
Ave
rage
BEI
(kW
h/m
2/y
r)
No
. of
Sto
rey
Lin
k/D
etac
hed
Smal
l/M
ediu
m/L
arge
Loca
tio
n (
Urb
an/R
ura
l)
Fue
l Typ
e
Litr
e/ye
ar
kWh
/ye
ar
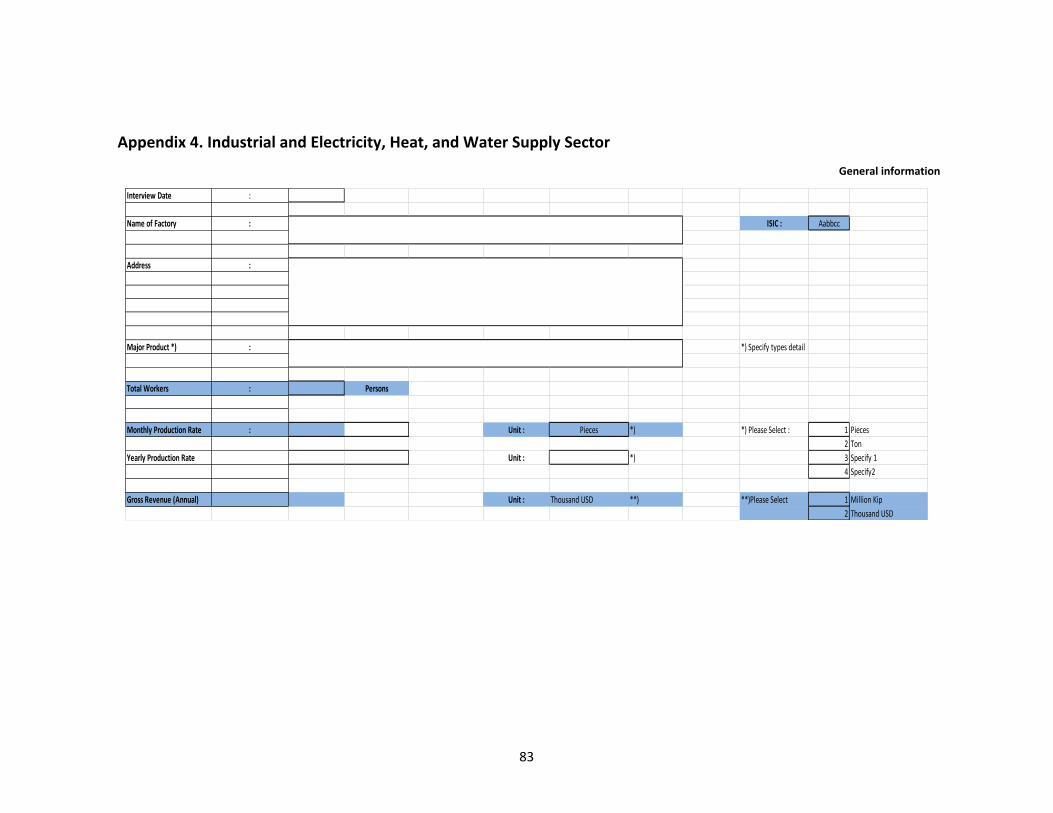
83
Appendix 4. Industrial and Electricity, Heat, and Water Supply Sector
General information
Interview Date :
Name of Factory : ISIC : Aabbcc
Address :
Major Product *) : *) Specify types detail
Total Workers : Persons
Monthly Production Rate : Unit : Pieces *) *) Please Select : 1 Pieces
2 Ton
Yearly Production Rate Unit : *) 3 Specify 1
4 Specify2
Gross Revenue (Annual) Unit : Thousand USD **) **)Please Select 1 Million Kip
2 Thousand USD

84
Average monthly consumption or purchasing amount questionnaire
Fuel Type Fuel Unit As Fuel
TOTAL Production Non-production*) Transportation Notes*)
Coal Kg - Wood Kg - Other Biomass Kg - LPG Kg Labour kitchen Electricity MWh office, factory, housing Diesel Litre - Gasoline Litre Fuel Oil Litre
Lubricants Specify
Other Petroleum Products - Naphtha Specify - Specify 1 - Specify 2 Specify -
Non-energy
Feedstock Additive Others
Electricity purchase questionnaire
Source of Power Amount Value
MWh Tugrik (₮) US$
State company
Private company
Total
Self-generation questionnaire
Generation Unit Capacity Generator Operation Electricity Generation
(MW) (hr/year) (MWh)

85
Generator 1
Generator 2
Generator 3
Generator 4
TOTAL
Sale (MWh) Fuel Use NOTE
GRID OFF GRID Type Consumption Unit
Diesel litre
Heat purchase questionnaire
Source of Heat AMOUNT VALUE
Gcal Tugrik (₮) USD
State company
Private company
TOTAL
Co-generation questionnaire
Parameters Electricity Unit Thermal Energy Unit
Capacity/Throughput
Production
Fuel Type
Fuel Consumption
Heat process questionnaire
Type Capacity/ Throughput Boiler/furnace Operation Heat Production
(kg/Hr) (Hr/year) (Kg/Hr)
Boiler 1
Boiler 2
Burner/Furnace 1
Burner/Furnace 1

86
Fuel Use NOTE
Type Consumption Unit