STUDIS Stationary Turbine Generator Diagnostic System · turbine generator behaves as expected, no...
12
>>> www.siempelkamp-nis.com STUDIS S tationary Tu rbine Generator Di agnostic S ystem Plants that produce electrical power with the aid of turbine generators are designed to ensure maximum reliabi- lity and costeffectiveness in produc- tion. To achieve these objectives, the conditions of turbine generators must be monitored precisely and deviations from normal operating behavior must be identified. STUDIS – the Stationary Turbine Ge- nerator Diagnostic System – is de- signed to ensure early detection of system errors/defects as a prerequisite for condition-based preventive main- tenance. Based upon values recorded by a monitoring system, deviations from normal behavior and possible errors/defects are identified and re- ported by an expert system. In addition to the primary functions of condition monitoring, early error detection and error/defect analysis, STUDIS also assists the operator in maintaining optimum system opera- tions, avoiding undesirable operating conditions and establishing a reliable and economical mode of operation. Furthermore, stored data can be ac- cessed at any time for use in analysis. STUDIS is not intended to replace the expert but relieves him of the routine task of evaluating conditions whose symptoms and effects are familiar, thus enabling him to organize his work more effectively.
Transcript of STUDIS Stationary Turbine Generator Diagnostic System · turbine generator behaves as expected, no...

>>> www.siempelkamp-nis.com
STUDISStationary Turbine Generator Diagnostic System
Plants that produce electrical power with the aid of turbine generators are designed to ensure maximum reliabi-lity and costeffectiveness in produc-tion. To achieve these objectives, the conditions of turbine generators must be monitored precisely and deviations from normal operating behavior must be identified.
STUDIS – the Stationary Turbine Ge-nerator Diagnostic System – is de-signed to ensure early detection of
system errors/defects as a prerequisite for condition-based preventive main-tenance. Based upon values recorded by a monitoring system, deviations from normal behavior and possible errors/defects are identified and re-ported by an expert system.
In addition to the primary functions of condition monitoring, early error detection and error/defect analysis, STUDIS also assists the operator in maintaining optimum system opera-
tions, avoiding undesirable operating conditions and establishing a reliable and economical mode of operation.
Furthermore, stored data can be ac-cessed at any time for use in analysis.
STUDIS is not intended to replace the expert but relieves him of the routine task of evaluating conditions whose symptoms and effects are familiar, thus enabling him to organize his work more effectively.

System Configuration
The illustration below shows an example of a possible configuration of the system. The measurements for the turbines shown in the diagram are recorded and evaluated by highspeed frontends (MDS-100) and forwar-ded to a central server. Data are then ana-lyzed for diagnostic purposes on the server. In addition, an online diagnosis option is available at any time via a link to our Service Computer.
In addition to machine signals, signals gene-rated at the process control level can also be read by STUDIS. The process control system is linked to STUDIS through the existing standard process control system interfaces.
Stringent requirements with respect to hand-ling and ease of operation apply to turbine generator diagnostic systems. Less experi-enced users should be able to access impor-tant information quickly and easily. Experts must have a highly flexible, extensive toolbox at their disposal for the purpose of perfor-ming detailed analyses without complicated procedures.
Inexperienced users of STUDIS move by mouse click from an overview diagram to a display which illustrates the most impor-tant relationships and time curves of mea-surements or key values. Based on templa-te images, the expert can modify detailed
configurations as desired using a procedu-re involving only a few simple steps. Any diagram in the system serves as a template. In the case of preconfigured criteria (e.g. turbine-generator run-down), the user is guided through entire groups of diagrams. These are compiled easily by the user and are available, accompanied by the appropri-ate data for the relevant time period, if and when the event occurs.
Fig. 1: Sample system configuration
STUDIS Stationary Turbine Generator Diagnostic System
2

Modular Structure
Fig. 2: Modular, scaleable configuration
3
Modular scaleable system
All modules can access the central STUDIS core (Fig. 2). The configuration of the modules is oriented to the functional groups of the turbine generator.
Modules from systems supplied by other manufacturers can also be integrated. The modular configuration of the system provides an ideal basis from which to plan investments and later system upgrades. The interfaces are open and conform to current standards.
The modular, scaleable STUDIS system contains the following modules:
> Data recording
> Data qualification
> Data display
> Analysis and
> Diagnosis
Data Acquisition Hardware
Rapid data recording with the MDS-100 frontend
The timely recording of vibration signals is accomplished by a frontend system (MDS-100), which transmits data via a 100-Mbit network to the STUDIS computer. Measu-rement points used to monitor operations from the control room are also used for STUDIS. The STUDIS computer is responsib-le for further processing of recorded data as well as visualization, storage and diagnosis.
Continuous data recording
The system is capable of recording any num-ber of process channels via the control inter-face or a local A-D converter continuously in real time. Up to 40 machine planes, each with four vibration sensors and a large num-ber of digital channels can be monitored at intervals of approx. one second (adjustable).
Continuous data recording is effected specifi-cally for vibration values at the shaft and bearings, with 1024/256 scans per revolution, respectively. Scans are distributed uniformly over a shaft revolution and are controlled by a key phaser signal. The measurements recor-ded in the process are stored in a ring buffer.
Intelligent data compression
Intelligent, operating-state-based datacom-pression provides for long-term monitoring and enhances the reproducibility of system conditions. This feature makes it possible to document machine behavior over an unli-mited period of time and to identify gradual changes caused by system errors or defects. Data sets (momentary data) recorded at one-second intervals can also be kept available for additional in-depth analysis.
Data from each revolution can be retrieved from the ring buffer and saved to permanent memory for selected time periods automati-cally, on the basis of preconfigured criteria or manually.
4
STUDIS Stationary Turbine Generator Diagnostic System

Monitoring
Fig. 3: Interaction between monitoring and diagnosis
5
Early error detection and long-term monitoring
In order to ensure optimum control of tur-boset operations, it is important that gradual changes in values are detected and evalua-ted. Such changes do not necessarily indi-cate errors or defects but may be caused by soiling, for example. In order to ensure early detection of these gradual changes, the sys-tem must have access to qualitycontrolled, load-point-adjusted evaluation criteria over a sufficiently long period of time. Because STUDIS facilitates this process, operating personnel receive support in selecting opti-mum time for maintenance.
In order to compute the remaining estima-ted service life of steam-turbine components subject to heavy loads, the operator must have access to data on pressure and tempe-rature loads over time. This data is ordinarily obtained by evaluating printed records. STUDIS enables the operator to obtain load and time data online. This provides opera-tors, manufacturers and inspectors with sig-nificantly more precise load statistics.
Monitoring and diagnosis
All measurement values are recorded by the monitoring system within a given measure-ment cycle. The monitoring system also per-forms frequency and order analyses as well as quality tests. In addition, measured values are checked and evaluated, and an load-point-based comparison of expected and actual behavior is performed.
The results of comparative analysis are for-warded to the expert system. The expert sys-tem allocates detected deviations to error di-agnoses on the basis of preconfigured rules.

Diagnosis with expert system
Error diagnosis with a rule-based expert system
One of the essential features of STUDIS is its rule-based expert system. Unlike many diagnostic systems produced by other manu-facturers, in which all error rules are pro-cessed on an event- or time-controlled basis, STUDIS process only error-hypothesis rules in which the premise values show a signifi-cant deviation from an expected value. This makes it possible to verify error hypotheses effectively online.
Processing is performed initially for periods of stationary operation of the turbine gene-rator in condition of thermal balance. The measured and reference values are subject
to a multi-level quality control procedure, the results of which are recorded in a status. The status is taken into consideration in all further evaluations of the diagnosis.
The results of diagnosis are documented, to include all information obtained during the diagnostic sequence, for evaluation by an ex-pert. This ensures that the diagnosis can be reconstructed at a later point in time or that diagnostic rules can be adjusted in response to new insights.
The expert system makes it possible to de-tect errors at an early point in time, even if selected tolerance bands are unfavorable or the knowledge of an error hypothesis is imprecise.
Fig. 4 presents a schematic diagram of the diagnostic process. The different results of comparison between expected and actual values are linked to rules. Depending upon the level of conformity with the rules, a diag-nostic result is issued. This ensures that only relevant errors, defects or disruptions are displayed.
Fig. 4: Schematic diagram of the diagnostic process
6
STUDIS Stationary Turbine Generator Diagnostic System

Compact Information Display
Fig. 5 : STUDIS „Magic Eye“
7
Detection of machine behavior
STUDIS employs primarily automatic me-chanisms for the purpose of detecting un-expected machine behavior. For example criteria can be formulated to control the evaluation process and dispatch messages to authorized personne. As long as the turbine generator behaves as expected, no expert input is required. When deviations occur, STUDIS supports the expert with a wide range of analytical tools.
Operating-point-based confidence interval
Measured and computed values are stan-dardized in conformity with their operat-ing-point-based confidence interval. Dy-namic, operating-point-based confidence interval monitoring facilitates the early detection of even small deviations result-ing from machine malfunction.
STUDIS „Magic Eye“
In support of online evaluation of current machine status, a high-compression data display, the STUDIS „Magic Eye“ (Fig. 5) provides a standardized display of every configured value relative to its specific tolerance band.
The Magic Eye is capable of displaying up to 1200 values, showing a representation of the value, the confidence interval and deviations from confidence limits. Colored markers in the outer ring indicate that a deviation from tolerance has occurred within the past 24 hours.

Samples for Visualization
Modern display philosophy with a high level of flexibility
All measured and computed values can be displayed as time functions or as functions of other selected values. Data can be displayed in accordance with individualized selection criteria.
Data can also be displayed in combination with characteristic curves and reference peri-ods. It is displayed on the basis of individual criteria on authorized network PC. Every dia-gram created remains available as a template for use in other freely configurable graphs.
Waterfall diagram
In the waterfall diagram, frequency analyses of vibration signals are displayed as a time se-quence. The diagram can be revolved as desi-red. It is possible to examine every frequency line individually in a separate window.
Spectrogram
A variation on the waterfall diagram is the spectrogram, in which amplitude patterns are represented by colors. Logarithmic, quadratic or exponential color scales can be selected. The scale spread can also be adjusted manually.
Weekly-, monthly- and quarterly report
The reports show deviations of parameters from expected values. Parameters and time frame can be defined manually.
Spectrogram
Waterfall diagram
8
STUDIS Stationary Turbine Generator Diagnostic System
9
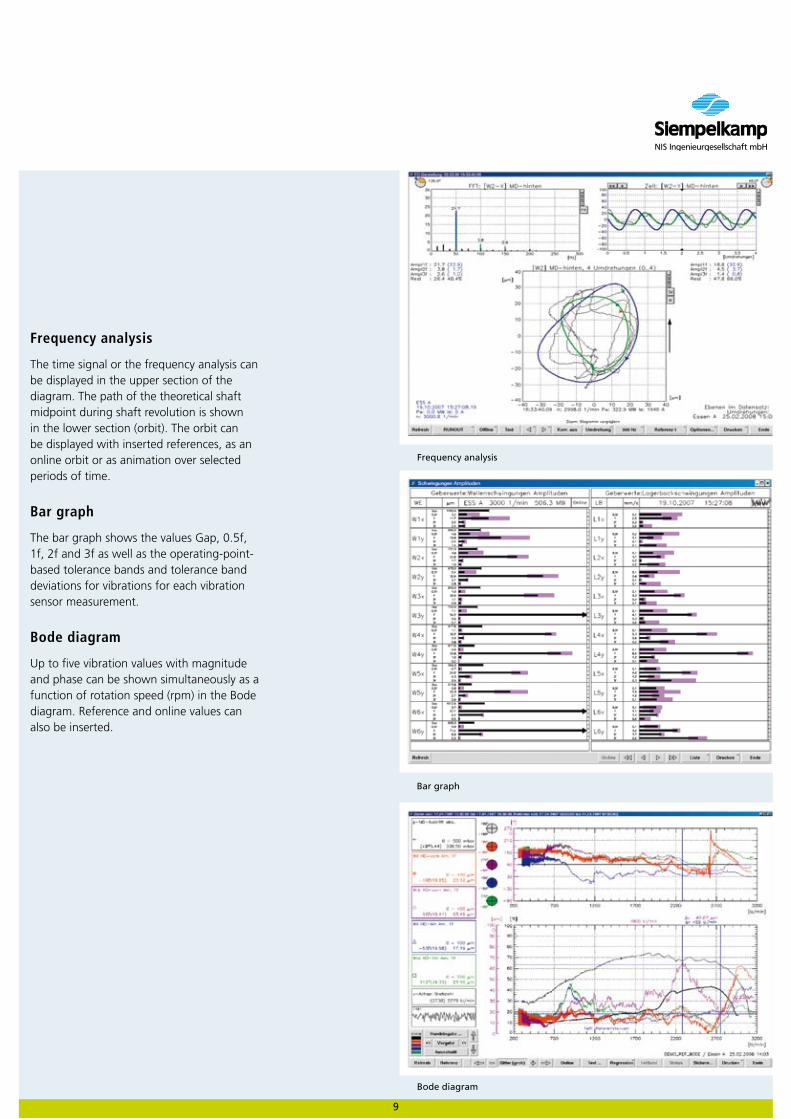
Frequency analysis
The time signal or the frequency analysis can be displayed in the upper section of the diagram. The path of the theoretical shaft midpoint during shaft revolution is shown in the lower section (orbit). The orbit can be displayed with inserted references, as an online orbit or as animation over selected periods of time.
Bar graph
The bar graph shows the values Gap, 0.5f, 1f, 2f and 3f as well as the operating-point-based tolerance bands and tolerance band deviations for vibrations for each vibration sensor measurement.
Bode diagram
Up to five vibration values with magnitude and phase can be shown simultaneously as a function of rotation speed (rpm) in the Bode diagram. Reference and online values can also be inserted.
Bar graph
Bode diagram
Frequency analysis

Nyquist plot
In the Nyquist plot, each vibration signal is shown with magnitude and phase. A dif-ference vector can also be shown for the purposes of evaluation. Tolerance bands can be inserted in the online display, if desired. In addition to the standard tool bar, tools for limiting, selecting and evaluating results are also provided for the Nyquist plot.
Nyquist overview
Nyquist plot
10
STUDIS Stationary Turbine Generator Diagnostic System

Performance
11
Blade damage Source: VDI Report, June 2003
Distribution of information in the case of turbo generator malfunction
Message can be transmitted to selected in-dividuals by e-mail or SMS in order to ensure that the result of the expert system and rele-vant data are evaluated and analyzed by an expert without delay.
Integration in existing control systems
STUDIS is equipped with an open interface that provides for convenient integration into existing control systems.
STUDIS Highlights:
> Mobile and stationary STUDIS
> Modular, scaleable system
> Rapid data recording with frontend system (TCP/IP Ethernet)
> Data qualification / validation
> Dynamic, operating-point-based tolerance band monitoring
> High-compression information display („STUDIS Magic Eye“)
> Diagnosis with rule-based expert system
> Modern display philosophy with a high level of flexibility
> Frequency and order analysis
> Dynamic reporting feature (dynamic graphic display)
> Messaging (RMA, SMS, e-mail...)
> Operable from a competence or diagnostic center
Early detection of:
> Rubbing
> Bearing hot spots
> Shaft deformation, cracks, alignment errors
> Mass losses (e.g. loss of parts of blades)
> Atypical component behavior
Analysis of:
> Blade damage
> Transmission damage
> Shaft fractures
> Bearing damage
Services:
Our standard program of products and ser-vices includes basic support and guidance for the implementation of a STUDIS system. We also offer optional online diagnosis in support of day-to-day operations within the framework of a maintenance contract.
Every STUDIS package also includes one full day of training for up to 4 persons.

>>> www.siempelkamp-nis.com
Technical data:
> Modular system configuration
> Continuous vibration monitoring without time gaps
> Supply voltage 24 – 38 VDC
> Frontend buffer depth up to 256 seconds
> Each frontend unit (MDS-100) is equipped with 4 high-speed and 4 low-speed inputs: • High-speed inputs per card: 16,000 scans per second for key phaser: controlled measurement up to 1,024 samples per revolution • Low-speed inputs: 4 samples per second
> Resolution: 12 bit for low-speed inputs/ 16 bit for high-speed inputs
> 2 free process-data inputs ± 10 V/0 … 20 mA
> Input resistance: 0.5 MV/1 MV at 30 pF input capacitance
> Galvanic separation for all inputs and outputs
> 100-Mbit Ethernet interface
> Permanent server memory: >140 GB
> Ring buffer capacity >140 GB
> Fully network capable (Windows, Unix, VMS, etc.)
> Firmware updates and software modifications available on the Internet
> Upgrades are fully compatible with older systems
Selected STUDIS references:
Stationary Diagnostic and Optimization Systems
> Weisweiler Power Plant, Blocks E – H, VGTs G and H, since 2008
> Huckingen Power Plant, since 2008
> Gersteinwerk Power Plant, Blocks F – K, since 2008
> Emsland Power Plant, Blocks B and C, since 2007
> Westfalen Power Plant, Blocks B and C, since 2007
> Goldenbergwerk Power Plant, Block F and E, since 2006 resp. since 2008
> GuD BASF Antwerpen 2005
> Neurath Power Plant, (B:1991) since 2002 all 5 Blocks
> Niederaußem Power Plant, (H:1994) since 2002 all 8 Blocks
> BOA Niederaussem, since 2002 HT, SPT, TSP, FL, SZ
> GuD Bayer Dormagen, since 2000 GT1, GT2, DT, HKP
> Frimmersdorf Power Plant, Block P and Q, since 1998 resp. since 2008
> Ibbenbüren Power Plant, Block B, since 1998
> GuD BASF Ludwigshafen, since 1997
> Solvay GmbH, Rheinberg, since 1997
12
Stu
dis
_EN
_01
_20
11
NIS Ingenieurgesellschaft mbHIndustriestrasse 13 · 63755 Alzenau · GermanyPhone: +49 (0) 6023 / 91-3991 · Fax: +49 (0) 6023 / [email protected]
Branch office RheinsbergAm Langen Luch 3 · 16831 Rheinsberg · GermanyPhone: +49 (0) 33931 / 415-0 · Fax: +49 (0) 33931 / [email protected]
Branch office EssenAltenessener Strasse 37 · 45141 Essen · GermanyPhone: +49 (0) 201 / 12-23385 · Fax: +49 (0) 201 / 12-22981
Branch office DresdenHugo-Junkers-Ring 9 · 01109 Dresden · GermanyPhone: +49 (0) 351 / 88363-0 · Fax: +49 (0) 351 / [email protected]