STUDIES ON THE CHEMICAL COMPOSITION OF BEEF BLOOD
12
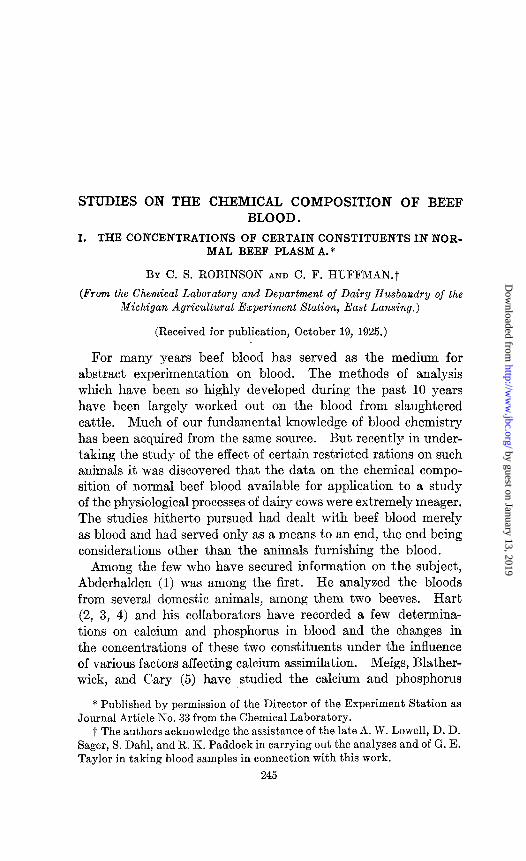
STUDIES ON THE CHEMICAL COMPOSITION OF BEEF BLOOD. I. THE CONCENTRATIONS OF CERTAIN CONSTITUENTS IN NOR- MAL BEEF PLASM A.* BY C. S. ROBINSON AND C. F. HUFFMAN.? (From the Chemical Laboratory and Department of Dairy Husbandry of the Michigan Agricultural Experiment Station, East Lansing.) (Received for publication, October 19, 1925.) For many years beef blood has served as the medium for abstract experimentation on blood. The methods of analysis which have been so highly developed during t,he past 10 years have been largely worked out on the blood from slaughtered cattle. Much of our fundamental knowledge of blood chemistry has been acquired from the same source. But recently in under- taking the study of the effect of certain restricted rations on such animals it was discovered that the data on the chemical compo- sition of normal beef blood available for application to a study of the physiological processes of dairy cows were extremely meager. The studies hitherto pursued had dealt with beef blood merely as blood and had served only as a means to an end, the end being considerations other than the animals furnishing the blood. Among the few who have secured information on the subject, Abderhalden (1) was among the first. He analyzed the bloods from several domestic animals, among them two beeves. Hart (2, 3, 4) and his collaborators have recorded a few determina- tions on calcium and phosphorus in blood and the changes in the concentrations of these two constituents under the influence of various factors affecting calcium assimilation. Meigs, Blather- wick, and Gary (5) have studied the calcium and phosphorus * Published by permission of the Director of the Experiment Station as Journal Article No. 33 from the Chemical Laboratory. t The authors acknowledge the assistance of the late A. W. Lowell, D. D. Sager, S. Dahl, and R. K. Paddock in carrying out the analyses and of G. E. Taylor in taking blood samples in connection with this work. 245 by guest on January 13, 2019 http://www.jbc.org/ Downloaded from
Transcript of STUDIES ON THE CHEMICAL COMPOSITION OF BEEF BLOOD
STUDIES ON THE CHEMICAL COMPOSITION OF BEEF BLOOD.
I. THE CONCENTRATIONS OF CERTAIN CONSTITUENTS IN NOR- MAL BEEF PLASM A.*
BY C. S. ROBINSON AND C. F. HUFFMAN.?
(From the Chemical Laboratory and Department of Dairy Husbandry of the Michigan Agricultural Experiment Station, East Lansing.)
(Received for publication, October 19, 1925.)
For many years beef blood has served as the medium for abstract experimentation on blood. The methods of analysis which have been so highly developed during t,he past 10 years have been largely worked out on the blood from slaughtered cattle. Much of our fundamental knowledge of blood chemistry has been acquired from the same source. But recently in under- taking the study of the effect of certain restricted rations on such animals it was discovered that the data on the chemical compo- sition of normal beef blood available for application to a study of the physiological processes of dairy cows were extremely meager. The studies hitherto pursued had dealt with beef blood merely as blood and had served only as a means to an end, the end being considerations other than the animals furnishing the blood.
Among the few who have secured information on the subject, Abderhalden (1) was among the first. He analyzed the bloods from several domestic animals, among them two beeves. Hart (2, 3, 4) and his collaborators have recorded a few determina- tions on calcium and phosphorus in blood and the changes in the concentrations of these two constituents under the influence of various factors affecting calcium assimilation. Meigs, Blather- wick, and Gary (5) have studied the calcium and phosphorus
* Published by permission of the Director of the Experiment Station as Journal Article No. 33 from the Chemical Laboratory.
t The authors acknowledge the assistance of the late A. W. Lowell, D. D. Sager, S. Dahl, and R. K. Paddock in carrying out the analyses and of G. E. Taylor in taking blood samples in connection with this work.
245
by guest on January 13, 2019http://w
ww
.jbc.org/D
ownloaded from
Beef Blood. I
changes in t’he blood of cows, while Blatherwick (6) has added some data on the composition of blood in relation to the regula- tion of neutrality.
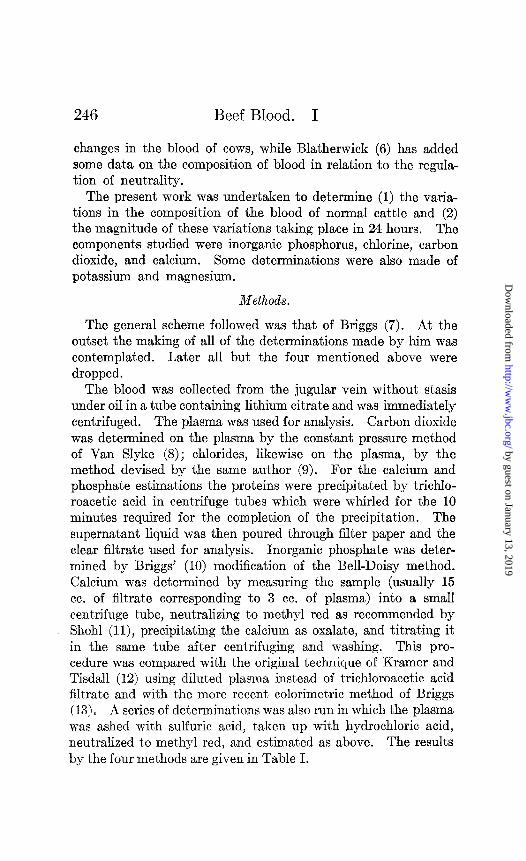
The present work was undertaken to determine (1) the varia- tions in the composition of the blood of normal cattle and (2) the magnitude of these variations taking place in 24 hours. The components studied were inorganic phosphorus, chlorine, carbon dioxide, and calcium. Some determinations were also made of potassium and magnesium.
Methods.
The general scheme followed was that of Briggs (7). At the outset the making of all of the determinations made by him was contemplated. Later all but the four mentioned above were dropped.
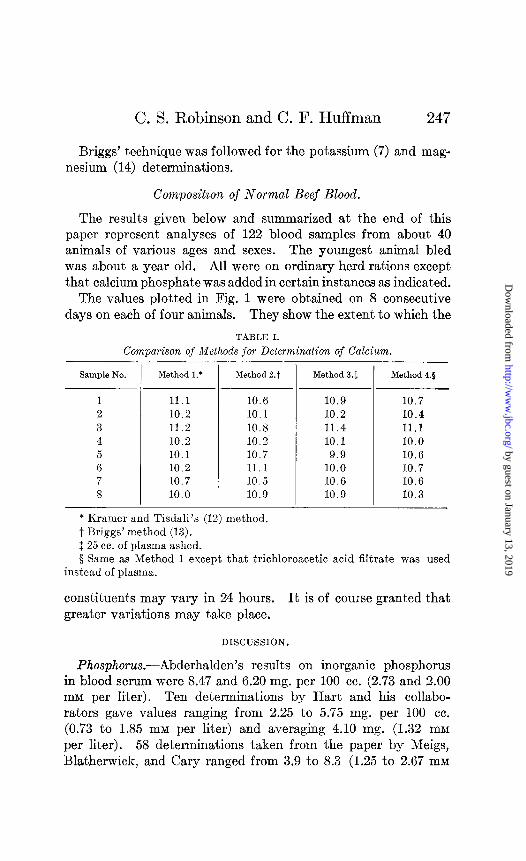
The blood was collected from the jugular vein without stasis under oil in a tube containing lithium citrate and was immediately centrifuged. The plasma was used for analysis. Carbon dioxide was determined on the plasma by the constant pressure method of Van Slyke (8); chlorides, likewise on the plasma, by the method devised by the same author (9). For the calcium and phosphate estimations the proteins were precipitated by trichlo- roacetic acid in centrifuge tubes which were whirled for the 10 minutes required for the completion of the precipitation. The supernatant liquid was then poured through filter paper and the clear filtrate used for analysis. Inorganic phosphate was deter- mined by Briggs’ (10) modification of the Bell-Doisy method. Calcium was determined by measuring the sample (usually 15 cc. of filtrate corresponding to 3 cc. of plasma) into a small centrifuge tube, neutralizing to methyl red as recommended by Shohl (ll), precipitating the calcium as oxalate, and titrating it in the same tube after centrifuging and washing. This pro- cedure was compared with the original technique of Kramer and Tisdall (12) using diluted plasma instead of trichloroacetic acid filtrate and with the more recent calorimetric method of Briggs (14). A series of determinations was also run in which the plasma was ashed with sulfuric acid, taken up with hydrochloric acid, neutralized to methyl red, and estimated as above. The results by the four methods are given in Table I.
by guest on January 13, 2019http://w
ww
.jbc.org/D
ownloaded from
C. S. Robinson and C. F. Huffman 247
Briggs’ technique was followed for the potassium (7) and mag- nesium (14) determinations.
Composition of Normal Beef Blood.
The results given below and summarized at the end of this paper represent analyses of 122 blood samples from about 40 animals of various ages and sexes. The youngest animal bled was about a year old. All were on ordinary herd rations except that calcium phosphate was added in certain instances as indicated.
The values plotted in Fig. 1 were obtained on 8 consecutive days on each of four animals. They show the extent to which the
TABLE I.
Comparison of Methods for Determination of Calcium.
Sample No. Method l.* Method 2.t Method 3.t: Method 4.5
I 11.1 IO.6 10.9 10.7 2 10.2 10.1 10.2 10.4 3 11.2 10.8 11.4 11.1 4 10.2 10.2 10.1 10.0 5 10.1 10.7 9.9 10.6 6 10.2 11.1 10.0 10.7 7 10.7 10.5 10.6 10.6 8 10.0 10.9 10.9 10.3
* Kramer and Tisdall’s (12) method. t Briggs method (13). 125 cc. of plasma ashed. 0 Same as Method 1 except that trichloroacetic acid filtrate was used
instead of plasma.
constituents may vary in 24 hours. It is of Couise granted that greater variations may take place.
DISCUSSION.
Phosphorus.-Abderhalden’s results on inorganic phosphorus in blood serum were 8.47 and 6.20 mg. per 100 cc. (2.73 and 2.00 mM per liter). Ten determinations by Hart and his collabo- rators gave values ranging from 2.25 to 5.75 mg. per 100 cc. (0.73 to 1.85 mM per liter) and averaging 4.10 mg. (1.32 mM per liter). 58 determinations taken from the paper by Meigs, Blatherwick, and Cary ranged from 3.9 to 8.3 (1.25 to 2.67 mM
by guest on January 13, 2019http://w
ww
.jbc.org/D
ownloaded from

248 Beef Blood. I
per liter) with an average of 5.4 mg. per 100 cc. (1.74 mM per liter). Our own range from 3.00 to 8.99 (0.97 to 2.90 mM per liter) with an average of 5.87 mg. per 100 cc. (1.89 mM per liter) for 122 estimations.
It is commonly held that inorganic phosphorus is one of the constituents of the blood that, in mature animals, is influenced
FIG. 1. Daily variation in composition of beef blood.
by the amount of phosphorus in the diet. Many of the data leading to this conclusion have been secured on animals other than cattle but Meigs, Blatherwick; and Cary (5) and Blather- wick (6) report results on cows supporting this assertion. We have two sets of experiments on three cows each which afford further confirmation of this. The results are shown graphically
by guest on January 13, 2019http://w
ww
.jbc.org/D
ownloaded from
C. S. Robinson and C. F. Huffman 249
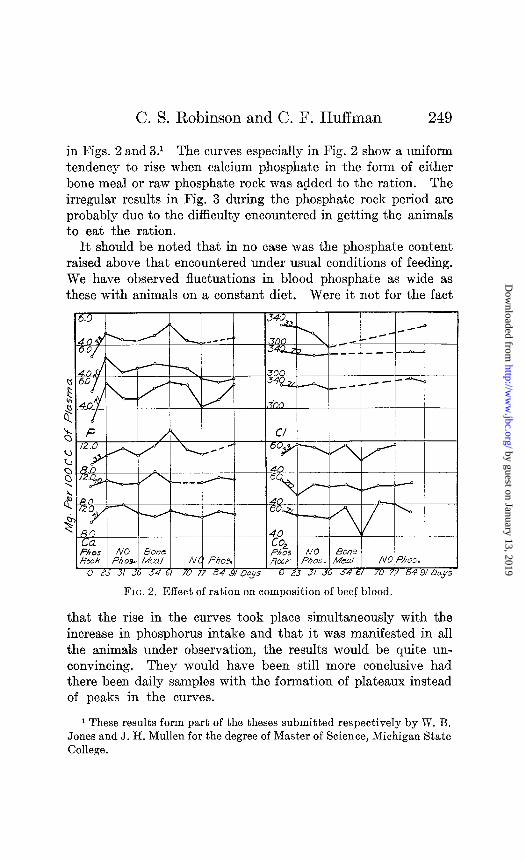
in Figs. 2 and 3.’ The curves especially in Fig. 2 show a uniform tendency to rise when calcium phosphate in the form of either bone meal or raw phosphate rock was added to the ration. The irregular results in Fig. 3 during the phosphate rock period are probably due to the difficulty encountered in getting the animals to eat the ration.
It should be noted that in no case was the phosphate content raised above that encountered under usual conditions of feeding. We have observed fluctuations in blood phosphate as wide as these with animals on a constant diet. Were it not for the fact
/ I’ I / / I
0 23 31 36 54 6l 70 77 84 9/Ooys 0 23 31 36 54 61 70 77 849lDays I
FIG. 2. Effect of ration on composition of beef blood.
that the rise in the curves took place simultaneously with the increase in phosphorus intake and that it was manifested in all the animals under observation, the results would be quite un- convincing. They would have been still more conclusive had there been daily samples with t,he formation of plateaux instead of peaks in the curves.
1 These results form part of the theses submitted respectively by W. B. Jones and J. H. Mullen for the degree of Master of Science, Michigan State College.
by guest on January 13, 2019http://w
ww
.jbc.org/D
ownloaded from

250 Beef Blood. I
Other causes of phosphate variation are still obscure and we have been able to correlate them with no other blood constituent nor in most cases with any definite cause. In Fig. 1 it will be observed that the phosphate curves are quite irregular, indicating variations as high as 1.87 mg. per 100 cc. of plasma (0.60 mM per liter) in 24 hours and 2.89 mg. (0.93 mM per liter) during the 8 days of the experiment. These animals were all on the same rations and were living under identical conditions.
ChZoriue.-Abderhalden (1) found 369 mg. of chlorine per
FIG. 3. Effect of ration on composition of beef blood.
100 gm. of serum (104.0 mM per liter) in the two samples that he analyzed. We are unaware of any extensive set of analyses of beef blood for chlorine. Our results show that this element is remarkably constant in amount, 110 analyses ranging from 294 to 357 (82.9 rnM to 100.6 mM per liter) with an average of 329 mg. per 100 cc. (92.9 mM per liter). In the day to day experi- ment the greatest variation in any one 24 hour period was 24 mg., while the maximum fluctuation throughout the 8 days was 39 mg. The maximum and minimum values for the group were 318 and 357 mg. (89.9 mM and 100.6 mM per liter) respectively.
by guest on January 13, 2019http://w
ww
.jbc.org/D
ownloaded from

C. S. Robinson and C. F. Huffman 251
Carbon DiozicZe.-Blatherwick (6) and also Hart (2) have re- ported studies on the carbon dioxide content of beef blood. Twenty-two determinations made by the former on sixteen cows showed a variation between 55.1 and 68.3 volume per cent (24.8 and 30.7 mM per liter) with an average of 61.5 per cent (27.7 rnM per liter). He found a decided response in COZ capacity to changes in ration, acid-forming grain mixtures causing a decrease in COZ while base-forming food caused it to rise. He found no relation between COZ capacity and pregnancy.
112 determinations on our animals gave a range of 41.4 to 75.8 volume per cent (18.6 to 34.1 mM per liter) with an average of 59.2 (26.6 mM per lit.er). The maximum daily variation for a single animal was 14.0 per cent (6.3 mM per liter) while for the 8 days it was 17.8 per cent (8.0 mM per liter). The range for the four animals throughout the week was from 58.0 to 75.8 volume per cent (26.1 to 34.1 mM per liter).
The extreme values quoted above are, in our experience, rather unusual. We have observed that such figures occasionally occur for a short period or for only a single sample and presumably represent some temporary disturbance in the animal which is not otherwise manifest. The usual range of carbon dioxide content we find to be between 50 and 70 per cent (22.5 and 31.5 mM per liter).
Calcium.-Abderhalden (1) found 11.9 and 11.1 mg. (2.98 to 2.78 mM per liter) Ca in the samples of beef blood that he analyzed. Meigs, Blatherwick, and Cary (5) analyzed many samples of blood from cows in various stages of lactation and pregnancy. Hart (2, 3, 4) and Blatherwick (6) have also secured some results on this element.
Forty-one determinations from the paper of Meigs, Blather- wick, and Cary (5) gave an average of 9.72 mg. per 100 cc. (2.43 mM per liter) and ranged from 8.9 to 13.7 mg. (2.22 to 3.43 mM per liter). Blatherwick (6) reports 10.3, 11.3, and 10.4 mg. (2.58, 2.83, and 2.60 mM per liter) in three analyses. Hart (3) reports twelve determinations ranging from 8.79 to 24.42 (2.20 to 6.11 m&r per liter) and averaging 16.25 mg. per 100 cc. (4.06 mM per liter) and nine (2) varying from 9.2 to 11.6 (2.30 to 2.90 mM per liter) and averaging 10.0 mg. per 100 cc. (2.50 mM per liter).
117 estimations in the course of our work averaged 11.0 mg.
by guest on January 13, 2019http://w
ww
.jbc.org/D
ownloaded from
252 Beef Blood. I
(2.75 mM per liter) and ranged from 7.7 to 14.7 mg. per 100 cc. of plasma (1.93 to 3.68 mM per liter). We found a maximum 24 hour fluctuation of 2.0 mg. (0.5 mM per liter), while the greatest variation during the 8 days was 2.8 mg. (0.7 mM per liter).
The blood calcium in animals other than cattle has usually been considered to be constant irrespective of variations in the intake of this element except in cases where the blood calcium is abnormally low (15). Meigs, Blatherwick, and Cary (5) were unable to raise appreciably the blood calcium in cattle by feeding calcium chloride. Blatherwick (6) reports a higher value for this element in an animal when on a diet of alfalfa hay than when on a ration of grain or corn silage and ascribes this result to the greater quantity of calcium in the hay. He also reports a value of 12.1 mg. per 100 cc. of plasma for a cow on alfalfa hay. This being above a normal value of about 10 mg. is advanced as additional evidence that hay can raise the blood calcium. These results do not appear to be conclusive. The first one represents a single value about 1 mg. higher than the results obtained several days before and after it. We have had variations twice as great occur with an animal on a constant diet and all of the sets of observations reported above had this or greater variations during 24 hours at least once during the 8 days that the animals were under observation. The second case is likewise doubtful as values of 12 mg. are not unusual with no abnormally high intake of calcium. Hart and his collaborators even report marked decreases in blood calcium when animals were changed from timothy to alfalfa hay with an increased cal- cium intake. They also have published figures showing the independence of the calcium intake and the blood calcium.
Our own results, however, apparently indicate a tendency towards an increase in blood calcium with an increase in t.he cal- cium in the ration. Particularly in Fig. 2 there seems to be a consistent rise in the blood calcium during or immediately follow- ing the periods of high calcium intake. In Fig. 3 the bone meal apparently caused a marked increase in the blood calcium. How- ever, the fact that this high level persisted over a 3 week period during which no calcium was added to the rat,ion makes any con- clusion drawn from the picture of doubtful value. The doubt is intensified by the decided drop during the period of feeding
by guest on January 13, 2019http://w
ww
.jbc.org/D
ownloaded from

C. S. Robinson and C. F. Huffman 253
phosphate rock, although, as mentioned above, the difficulty in feeding this material caused considerable disturbance in the animals. We are, however, inclined to believe that an increase in intake of either phosphorus or calcium causes a tendency towards an increase in the concentration of the corresponding element in the blood but the actual rise does not usually carry the values beyond t.he normal range and the picture may be ob- scured by changes produced by other factors more potent than the one under consideration.
The following case may be cited in this connection. We had under observation four calves which were suffering severely from depraved appetite. They were bled when first called to our atten- tion on January 15. Bone meal and cod liver oil were added to their ration and they were bled again on the dates indicated. In two of these four calves the blood phosphate and in three of them the blood calcium was markedly increased. None of these animals was in normal state of health and the results must be considered with that point in mind. The results are shown in Table II.
Potassium.-Thirty-one estimations of potassium ranged from 16.4 to 41.3 (4.2 to 10.5 mM per liter) with an average of 27.3 mg. per 100 cc. of plasma (7.0 mM per liter).
Magnesium.-Twenty-six determinations gave results varying from 0.31 to 3.08 mg. per 100 cc. of plasma (0.13 to 1.26 mM per liter), average 2.16 (0.89 mM per liter).
SUMMARY.
An analysis of more than a hundred samples of blood from normal mature cattle showed the following values:
I Range. AVWagt?.
Inorganic phosphorus. Chlorine .............. Calcium. ............. Carbon dioxide ........ Potassium ............. Magnesium. ...........
3.00-8.990.97-2.90 5.87 1.89 294-357 82.9-100.6 329 92.9 7.7-14.7 1.93-3.68 11.0 2.75
41.4-75.818.6-34.1 59.2 26.6 16.441.3 4.2-10.5 27.3 7.0 0.31-3.080.13-1.26 2.16 0.89
WLM
- 1 Maximum 24 hr.
variation.
7% fc: 1.87
24 2.0
14.0
0.60 0.68 0.50 6.3
by guest on January 13, 2019http://w
ww
.jbc.org/D
ownloaded from

-
>
-
-
i
-
254
by guest on January 13, 2019http://w
ww
.jbc.org/D
ownloaded from
C. S. Robinson and C. F. Huffman
Increased intake of calcium phosphate produced a slight in- crease in the inorganic phosphorus and calcium in the blood but the values were still within the normal range. Other factors pro- duced greater changes in these two constituents.
BIBLIOGRAPHY.
1. Abderhalden, E., 2. physiol. Chem., 1898, xxv, 65. 2. Hart, E. B., Steenbock, H., and Humphrey, G. C., Wisconsin Agric.
Exp. Station, Research Bull. 49, 1920, 19. 3. Hart, E. B., Steenbock, H., Hoppert, C. A., Bethke, R. M., and Hum-
phrey, G. C., J. Biol. Chem., 1922, liv, 82. 4. Hart, E. B., Steenbock, H., and Elvehjem, C. A., J. Biol. Chem., 1924-
25, lxii, 117. 5. Meigs, E. B., Blatherwick, N. R., and Cary, C. A., J. Biol. Chem., 1919,
xxxvii, 1. 6. Blatherwick, N. R., J. Biol. Chem., 1920, xlii, 517. 7. Briggs, A. P., J. Biol. Chem., 1923, lvii, 351. 8. Van Slyke, D. D., J. Biol. Chem., 1917, xxx, 347. 9. Van Slyke, D. D., J. Biol. Chem., 1923-24, lviii, 523.
10. Briggs, A. P., J. Biol. Chem., 1922, liii, 13. 11. Shohl, A. T., J. Biol. Chem., 1922,1, 527, 12. Kramer, B., andTisdal1, F. F., J. Biol. Chem., 1921, xlvii, 475. 13. Briggs, A. P., J. Biol. Chem., 1921, lix, 255. 14. Briggs, $.P., J. Biol. Chem., 1922, lii, 349. 15. Boggs, T. R., Bull. Johns Hopkins Hosp., 1908, xix, 201. Denis, W.,
and Minot, A. S., J. Biol. Chem., 1920, xli, 357. Clark, G. W., J. Biol. Chem., 1920, xliii, 89.
by guest on January 13, 2019http://w
ww
.jbc.org/D
ownloaded from
C. S. Robinson and C. F. HuffmanPLASMA
CONSTITUENTS IN NORMAL BEEF THE CONCENTRATIONS OF CERTAIN
COMPOSITION OF BEEF BLOOD: I. STUDIES ON THE CHEMICAL
1926, 67:245-255.J. Biol. Chem.
http://www.jbc.org/content/67/1/245.citation
Access the most updated version of this article at
Alerts:
When a correction for this article is posted•
When this article is cited•
alerts to choose from all of JBC's e-mailClick here
ml#ref-list-1
http://www.jbc.org/content/67/1/245.citation.full.htaccessed free atThis article cites 0 references, 0 of which can be
by guest on January 13, 2019http://w
ww
.jbc.org/D
ownloaded from