STUDIES ON LITHOMARGIC CLAY STABILIZED USING …
162
STUDIES ON LITHOMARGIC CLAY STABILIZED USING GRANULATED BLAST FURNACE SLAG AND CEMENT Thesis Submitted in partial fulfilment of the requirements for the degree of DOCTOR OF PHILOSOPHY by DARSHAN C SEKHAR DEPARTMENT OF CIVIL ENGINEERING NATIONAL INSTITUTE OF TECHNOLOGY KARNATAKA SURATHKAL, MANGALORE -575025 OCTOBER 2017
Transcript of STUDIES ON LITHOMARGIC CLAY STABILIZED USING …

STUDIES ON LITHOMARGIC CLAY
STABILIZED USING GRANULATED
BLAST FURNACE SLAG AND CEMENT
Thesis
Submitted in partial fulfilment of the requirements for the degree of
DOCTOR OF PHILOSOPHY
by
DARSHAN C SEKHAR
DEPARTMENT OF CIVIL ENGINEERING
NATIONAL INSTITUTE OF TECHNOLOGY KARNATAKA
SURATHKAL, MANGALORE -575025
OCTOBER 2017

D E C L A R A T I O N
by the Ph.D.Research Scholar
I hereby declare that the Research Thesis entitled “Studies on lithomargic clay
stabilized using granulated blast furnace slag and cement” which is being
submitted to the National Institute of Technology Karnataka, Surathkal in partial
fulfilment of the requirements for the award of the Degree of Doctor of Philosophy
in Civil Engineering, is a bonafide report of the research work carried out by me.
The material contained in this Research Thesis has not been submitted to any
University or Institution for the award of any degree.
(DARSHAN C SEKHAR)
Register No.145022CV14F02
Department of Civil Engineering
Place: NITK, Surathkal
Date: 16-10-2017
C E R T I F I C A T E
This is to certify that the Research Thesis entitled “Studies on lithomargic clay
stabilized using granulated blast furnace slag and cement” submitted by
Mr. DARSHAN C SEKHAR (Register Number: 145022CV14F02) as the record of
the research work carried out by him, is accepted as the Research Thesis submission
in partial fulfilment of the requirements for the award of degree of Doctor of
Philosophy.
Dr. Sitaram Nayak
Research Guide
(Signature with date and seal)
Dr. Varghese George
Chairman - DRPC
(Signature with date and seal)

DEDICATED TO
MY PARENTS

ACKNOWLEDGEMENT
With immense respect and pleasure, I wish to express heartfelt gratitude, indebtedness
and heartiest thanks to my research supervisor Prof. Sitaram Nayak, for his
continuous patience, encouragement, and relentless guidance that proved instrumental
in the upbringing of this thesis. His keen engineering and scientific insight has helped
me tremendously in improving the technical content and practical relevance of the
thesis. Working with him has been a great learning experience to me. This research
would not have been possible without his support and guidance. More than anything,
he looked after me as a guardian and helped me immensely. To accomplish my
doctorate thesis under his supervision has been both a great privilege and honour for
me.
I am greatly indebted to RPAC members, Prof. A. U. Ravishankar of civil engineering
department and Prof. Subba Rao from department of applied mechanics for their
critical evaluation and valuable suggestions during the progress of the work.
I am thankful to Prof. Varghese George, Head of civil engineering department and
chairman of DRPC, Dr. Jayalekshmi, secretary DRPC. I take this opportunity to thank
former department heads namely, Prof. K. N. Lokesh and Prof. Venkat Reddy for
their timely help during my entire research period.
I sincerely thank Prof. Katta Venkataramana, Dean (Academic) for his continuous and
wholehearted support during my entire research period.
I gratefully acknowledge the support and help rendered by Mr. Preetham Patel, Mr.
Ravi Naik, Mrs. Dhanya Raj and Mrs. Reva Venu (Former M.Tech. students of GTE)
for the successful completion of my experimental work. Special thanks to Keshav,
Manjunath, Sajja, Yaswanth, and Eldhose for their timely help. I sincerely thank
geotechnical engineering laboratory staff especially Mr. Yathish Saliyan for the help
rendered by him during the experimental stages of the work.
I take this opportunity to thank Dr. B. M. Sunil and Prof. S. Shrihari for helping me in
procuring the GBFS material required for the study from KFIL, Koppal in the first

and second phase of work respectively. I also like to extend my gratitude to all the
teaching faculty and supporting staff of the civil engineering department, for their
encouragement, help and support provided during the research work.
I would like to thank the authorities and staff at Nirmiti Kendra, NITK Surathkal for
providing the necessary facilities for soil block preparation.
My thanks are also due to the office staff of Civil Engineering Department, especially
Mrs. Vagdevi for their constant administrative help at different stages of my research.
I would like to express my sincere gratitude to the authorities of NITK Surathkal, for
providing me excellent facilities and comfortable stay in the campus.
I also thank my professors Prof. H. N. Ramesh and Prof. S. Gangadhara of UVCE,
Bangalore who motivated me and helped me during post-graduation at UVCE. I thank
Prof. G. L. Sivakumar Babu, IISc, Bangalore who brought about my research interest
in me, during my stay at IISc, which eventually lead to pursuing my Ph.D.
I would to thank my friends Naresh and Renuka Prasad whom I dearly miss at this
time. Special thanks to Basavanagowda, Puneeth, Shareef, Parameshwar, Sharan,
Vinod and Shivprasad for their support and great company during my stay at NITK.
I thank all my friends at NITK who were always co-operative and friendly to me.
I thank my mother Ramadevi for the great sacrifice she has done for my education
and the bright future. I thank my father Chandrasekhar who always pushed me into
studying any subject and gave freedom. I am grateful to my lovely sister Deepthi for
her moral support.
I would like to remember The Almighty for providing such a wonderful learning
experience in my life through this journey
Finally, I thank all my well-wishers who have directly or indirectly supported me in
the need of hour.
Darshan C Sekhar

ABSTRACT
Southwestern coast of India has vast deposits of problematic silty soil (locally called
shedi soil) normally referred as lithomargic clay in the literature. This problematic
silty soil is characterized by its high sensitivity to moisture content with high erosion
potential and low shear strength, especially in wet conditions or when it absorbs
sufficient moisture. In order to overcome these problems, an industrial by-product
obtained from the iron industry i.e. granulated blast furnace slag (GBFS) has been
used to improve the strength properties of the lithomargic clay. To achieve the study
objectives, lithomargic clay was replaced with the GBFS in different proportions.
From the experimental results, it was observed that lithomargic clay when replaced
with 25% GBFS produced good improvement in UCC strength and shear strength.
The study includes an investigation on a combination of lithomargic clay replaced by
optimum percentage of GBFS with addition of varying percentage of cement on their
shear strength parameters. The improvement in strength was justified by conducting
microstructural analysis using SEM and XRD. The experimental results are used in
numerical analysis i.e., in PLAXIS 2D for load-settlement analysis of a strip footing
and for a typical embankment slope stability problem. In addition, studies were
carried out to check the effectiveness of GBFS and cement in the production of
compressed stabilized earth blocks (CSEB). From the current study, it is concluded
that lithomargic clay stabilized with GBFS and cement can be effectively used in
geotechnical applications, thereby increasing the rate of effective disposal of GBFS.
Keywords: Lithomargic clay, Granulated Blast Furnace Slag, Stabilization,
PLAXIS 2D, Compressed Stabilized Earth Blocks, SEM, XRD.

i
TABLE OF CONTENTS
DECLARATION
CERTIFICATE
ACKNOWLEDGEMENT
ABSTRACT
TABLE OF CONTENTS i
LIST OF FIGURES v
LIST OF TABLES x
NOMENCLATURE xii
1 INTRODUCTION
1.1 GENERAL 1
1.2 SOIL STABILIZATION 1
1.3 LITHOMARGIC CLAY 3
1.4 GRANULATED BLAST FURNACE SLAG (GBFS) 4
1.5 SCOPE AND OBJECTIVES OF THE INVESTIGATION 6
1.6 ORGANIZATION OF THE THESIS 7
2 REVIEW OF LITERATURE
2.1 GENERAL 9
2.2 LITHOMARGIC CLAY AND LATERITIC SOIL 9
2.3 SOIL STABILIZATION USING CEMENT, SLAG 11
AND OTHER ADDITIVES
2.4 SETTLEMENT ANALYSIS AND SLOPE STABILITY 19
ANALYSIS USING PLAXIS SOFTWARE
2.5 COMPRESSED STABILIZED EARTH BLOCKS 20
2.6 SUMMARY OF LITERATURE REVIEW 23
2.7 LIST OF DRAWBACKS 23
ii
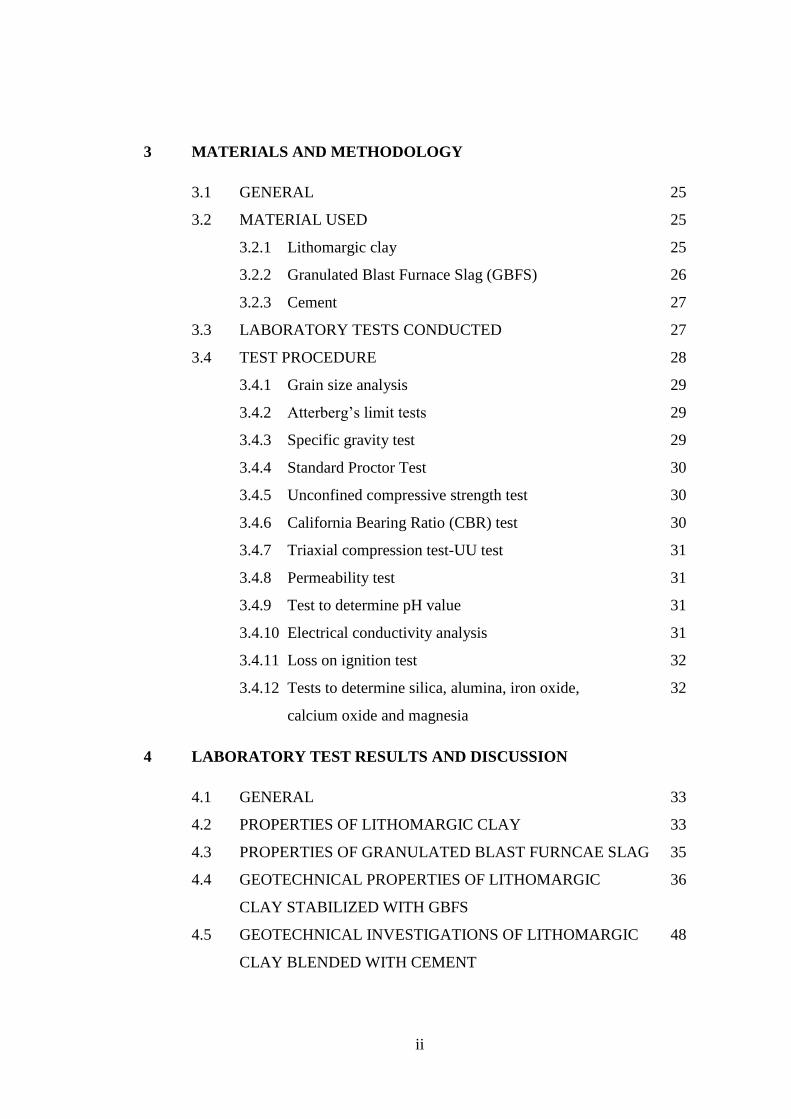
3 MATERIALS AND METHODOLOGY
3.1 GENERAL 25
3.2 MATERIAL USED 25
3.2.1 Lithomargic clay 25
3.2.2 Granulated Blast Furnace Slag (GBFS) 26
3.2.3 Cement 27
3.3 LABORATORY TESTS CONDUCTED 27
3.4 TEST PROCEDURE 28
3.4.1 Grain size analysis 29
3.4.2 Atterberg’s limit tests 29
3.4.3 Specific gravity test 29
3.4.4 Standard Proctor Test 30
3.4.5 Unconfined compressive strength test 30
3.4.6 California Bearing Ratio (CBR) test 30
3.4.7 Triaxial compression test-UU test 31
3.4.8 Permeability test 31
3.4.9 Test to determine pH value 31
3.4.10 Electrical conductivity analysis 31
3.4.11 Loss on ignition test 32
3.4.12 Tests to determine silica, alumina, iron oxide, 32
calcium oxide and magnesia
4 LABORATORY TEST RESULTS AND DISCUSSION
4.1 GENERAL 33
4.2 PROPERTIES OF LITHOMARGIC CLAY 33
4.3 PROPERTIES OF GRANULATED BLAST FURNCAE SLAG 35
4.4 GEOTECHNICAL PROPERTIES OF LITHOMARGIC 36
CLAY STABILIZED WITH GBFS
4.5 GEOTECHNICAL INVESTIGATIONS OF LITHOMARGIC 48
CLAY BLENDED WITH CEMENT

iii
4.6 EFFECT OF GBFS AND CEMENT ON PROPERTIES OF 54
LITHOMARGIC CLAY
5 MICROSTRUCTURAL INVESTIGATIONS ON STABILIZED
LITHOMARGIC CLAY
5.1 INTRODUCTION 57
5.2 X RAY DIFFRACTION ANALYSIS 57
5.3 SCANNING ELECTRON MICROSCOPY ANALYSIS 64
5.4 QUANTITATIVE EDS ANALYSIS 72
6 TYPICAL STUDIES ON APPLICATIONS OF STABILIZED SOIL
USING PLAXIS 2D
6.1 GENERAL 75
6.2 OVERVIEW OF THE ANALYIS PROGRAM 76
6.3 LOAD-SETTLEMENT ANALYSES OF STRIP FOOTING 76
RESTING ON LITHOMARGIC CLAY AND ON STABILIZED
LITHOMARGIC CLAY
6.3.1 Steps followed for settlement analyses of strip footing 79
resting on lithomargic clay and stabilized lithomargic
clay using PLAXIS 2D
6.3.2 Different cases considered in the analyses 81
6.3.3 Increase in net allowable pressure for stabilized soil 92
6.4 STABILITY ANALYSES OF AN EMBANKMENT SLOPE 94
(SOON AFTER CONSTRUCTION) USING PLAXIS 2D
6.4.1 Various cases considered in the analyses 96
6.4.2 Results of slope stability analyses for embankment 98
made up of lithomargic clay and resting on
lithomargic clay (Case 1)
6.4.3 Results of slope stability analyses for embankment 99
with stabilized soil resting on lithomargic clay (Case 2)

iv
6.4.4 Results of slope stability analyses for embankment 104
with stabilized soil and soil below embankment stabilized
for a depth of half the embankment height (Case 3)
6.4.5 Effect of stabilization on Factor of Safety (FoS) 108
7 MANUFACTURE AND TESTING OF COMPRESSED
STABILIZED EARTH BLOCKS
7.1 INTRODUCTION 111
7.2 MATERIALS USED 111
7.2.1 Soils 112
7.2.2 Granulated Blast Furnace Slag (GBFS) 113
7.2.3 Ordinary Portland Cement (OPC) 113
7.3 MANUFACTURE AND TESTING 113
7.4 RESULTS AND DISCUSSION 120
7.4.1 Effect of GBFS on properties of lateritic soil 120
7.4.2 Test results of compressed stabilized lithomargic clay 121
blocks
7.4.3 Test results of compressed stabilized lateritic soil blocks 123
8 SUMMARY AND CONCLUSIONS
8.1 SUMMARY 127
8.2 CONCLUSIONS 128
8.3 LIMITATIONS OF THE PRESENT WORK 129
8.4 SCOPE FOR FUTURE WORK 130
REFERENCES 131
LIST OF PUBLICATIONS 141
CURRICULUM VITAE 143

v
LIST OF FIGURES
Fig. No. Title Pg. No.
1.1 Profile of lateritic soil and lithomargic clay at Padupanambur site, 3
Mangalore, Karnataka, India
1.2 Profile of granulated blast furnace slag at Kirloskar Ferrous Industries 5
Limited, Koppal, Karnataka, India
3.1 Lithomargic clay sample 26
3.2 Granulated blast furnace slag (GBFS) sample 27
4.1 Particle size distribution curves for both lithomargic clay and GBFS 36
4.2 Plot of water content Vs no. of blows for lithomargic clay 38
4.3 Plot of water content Vs no. of blows for lithomargic clay with 25% 38
GBFS replacement
4.4 Variation of liquid limit with increasing percentage of GBFS replacing 39
soil
4.5 Variation of specific gravity with increasing percentage of GBFS 39
replacing soil
4.6 Plot of maximum dry unit weight Vs water content for lithomargic clay 40
4.7 Plot of maximum dry unit weight Vs water content for lithomargic clay 40
with 25% GBFS replacement
4.8 Variation of OMC with increasing percentage of GBFS replacing soil 41
4.9 Variation of soaked CBR with increasing percentage of GBFS replacing 41
soil
4.10 Variation of UCS with increasing percentage of GBFS replacing soil 42
4.11 Plot of stress versus strain for lithomargic clay with 25% GBFS 43
replacement for varying curing periods
4.12 Plot of Mohr circle and failure envelope for lithomargic clay 45
4.13 Plot of Mohr circle and failure envelope for lithomargic clay with 45
25% GBFS replacement at 7 days curing period
4.14 Plot of Mohr circle and failure envelope for lithomargic clay with 46
25% GBFS replacement at 28 days curing period

vi
4.15 Plot of stress versus strain for lithomargic clay with 15% GBFS 46
replacement for different confining pressures
4.16 Variation of cohesion with increasing percentage of GBFS replacing soil 47
4.17 Variation of frictional angle with increasing percentage of GBFS 47
replacing soil
4.18 Plot of water content versus no. of blows for lithomargic clay with 51
4% cement
4.19 Variation of plasticity index with increasing percentage of cement added 52
4.20 Plot of dry unit weight versus water content for lithomargic clay with 52
4% cement
4.21 Plot of stress versus strain for lithomargic clay with varying cement 53
content
4.22 Variation of UCS with different percentage of cement for 7 days 53
curing period
4.23 Plot of failure envelopes for different stabilized soil combinations 55
5.1 X-ray diffraction spectrum for lithomargic clay (soil) 58
5.2 XRD spectrum for 85% soil + 15% GBFS mix at 7 days curing 58
5.3 XRD spectrum for 85% soil + 15% GBFS mix at 28 days curing 59
5.4 XRD spectrum for 75% soil + 25% GBFS mix at 7 days curing 59
5.5 XRD spectrum for 75% soil + 25% GBFS mix at 28 days curing 59
5.6 XRD spectrum for 65% soil + 35% GBFS mix at 7 days curing 60
5.7 XRD spectrum for 65% soil + 35% GBFS mix at 28 days curing 60
5.8 XRD spectrum for 75% soil + 25% GBFS mix with addition of 60
2% cement at 7 days curing
5.9 XRD spectrum for 75% soil + 25% GBFS mix with addition of 61
2% cement at 28 days curing
5.10 XRD spectrum for 75% soil + 25% GBFS mix with addition of 61
4% cement at 7 days curing
5.11 XRD spectrum for 75% soil + 25% GBFS with addition of 62
4% cement at 28 days curing
5.12 SEM image and EDS micrograph of lithomargic clay (soil) 65

vii
5.13 SEM image and EDS micrograph of 85% soil + 15% GBFS mix at 66
7 days curing.
5.14 SEM image and EDS micrograph of 85% soil + 15% GBFS mix at 66
28 days curing.
5.15 SEM image and EDS micrograph of 75% soil + 25% GBFS mix at 67
7 days curing.
5.16 SEM image and EDS micrograph of 75% soil + 25% GBFS mix at 67
28 days curing.
5.17 SEM image and EDS micrograph of 65% soil + 35% GBFS mix at 68
7 days curing.
5.18 SEM image and EDS micrograph of 65% soil + 35% GBFS mix at 68
28 days curing.
5.19 SEM image and EDS micrograph of 75% soil + 25% GBFS mix 69
with addition of 2% cement at 7 days curing
5.20 SEM image and EDS micrograph of 75% soil + 25% GBFS mix 69
with addition of 2% cement at 28 days curing
5.21 SEM image and EDS micrograph of 75% soil + 25% GBFS mix 70
with addition of 4% cement at 7 days curing
5.22 SEM image and EDS micrograph of 75% soil + 25% GBFS mix 70
with addition of 4% cement at 28 days curing
6.1 Finite element model for 2m wide(B=2m)strip footing on lithomargic clay 79
6.2 Typical output showing deformed mesh 80
6.3 Typical output showing settlement contours 80
6.4 Case 1: Footing resting on lithomargic clay 81
6.5 Case 2: Footing resting on stabilized soil having width 2B and depth 1B 82
6.6 Case 3: Footing resting on stabilized soil having width 3B and depth 2B 82
6.7 Settlement vs load intensity for 1m, 1.5m and 2m wide strip footing 84
resting on lithomargic clay
6.8 Settlement vs load intensity for different soil combinations for strip 85
footing of width B=1m resting on stabilized soil of width 2B and depth 1B
6.9 Settlement vs load intensity for different soil combinations for strip 86
footing of width B=1.5m resting on stabilized soil of width 2B and depth 1B

viii
6.10 Settlement vs load intensity for different soil combinations for strip 87
footing of width B=2m resting on stabilized soil of width 2B and depth 1B
6.11 Settlement vs load intensity for different soil combinations for strip 89
footing of width B=1m resting on stabilized soil of width 3B and depth 2B
6.12 Settlement vs load intensity for different soil combinations for strip 90
footing of width B=1.5m resting on stabilized soil of width 3B and depth 2B
6.13 Settlement vs load intensity for different soil combinations for strip 91
footing of width B=2m resting on stabilized soil of width 3B and depth 2B
6.14 Various cases considered for the analyses 97
6.15 Variation of factor of safety with embankment constructed with 99
lithomargic clay with varying embankment slope angle and varying
embankment height
6.16 Variation of FoS for slope angle of 30° (Case 2) 100
6.17 Variation of FoS for slope angle of 45° (Case 2) 101
6.18 Variation of FoS for slope angle of 60° (Case 2) 102
6.19 Variation of FoS for slope angle of 75° (Case 2) 103
6.20 Variation of FoS for slope angle of 30° (Case 3) 105
6.21 Variation of FoS for slope angle of 45° (Case 3) 106
6.22 Variation of FoS for slope angle of 60° (Case 3) 107
6.23 Variation of FoS for slope angle of 75° (Case 3) 108
6.24 Variation of FoS for different cases for 75% LC + 25% GBFS 110
6.25 Variation of FoS for different cases for 75% LC + 25% GBFS with 110
addition of 2% cement
7.1 Grain size distribution of lateritic soil, lithomargic clay and GBFS 113
7.2 Cleaning and lubricating the block mould 115
7.3 Dry mixing of all the constituents 116
7.4 Addition of water to the dry mix 116
7.5 Compressing the block by pulling down the lever arm 117
7.6 Ejecting the soil block after compression process 117
7.7 Storage and curing of stabilized blocks 118
7.8 Testing for compressive strength in a compression testing machine 119
7.9 Placement of soil blocks in hot air oven for water absorption test 119

ix
7.10 Variation of UCS with different percentage of GBFS replacement 121
7.11 Variation of dry and wet compressive strength of stabilized lithomargic 123
clay blocks
7.12 Variation of dry and wet compressive strength of stabilized lateritic blocks 124

x
LIST OF TABLES
Table No. Title Pg. No.
4.1 Properties of lithomargic clay (shedi soil) 34
4.2 Properties of granulated blast furnace slag (GBFS) 35
4.3 Geotechnical properties of lithomargic clay before and after stabilization 37
with GBFS
4.4 Variation of UCS with percentage of GBFS replacing soil 42
4.5 Variation of c and φ with increasing percentage of GBFS replacing soil 44
4.6 Geotechnical properties of lithomargic clay blended with cement 49
4.7 Variation of shear strength parameters with different percentage of 54
cement to optimized mix
5.1 Quantitative EDS analysis of various samples at different curing periods 72
6.1 Input parameters for lithomargic clay, GBFS stabilized lithomargic clay 78
and GBFS + cement stabilized lithomargic clay
6.2 Settlement of strip footings of different widths resting on lithomargic clay 83
6.3 Settlement of B=1m wide strip footing resting on stabilized soil of 85
width 2B and depth 1B considering various soil mixtures
6.4 Settlement of B=1.5m wide strip footing resting on stabilized soil of 86
width 2B and depth 1B considering various soil mixtures.
6.5 Settlement of B=2m wide strip footing resting on stabilized soil of 87
width 2B and depth 1B considering various soil mixtures
6.6 Settlement for B=1m wide strip footing resting on stabilized soil of 89
width 3B and depth 2B considering various soil mixtures
6.7 Settlement of B=1.5m wide strip footing on stabilized soil of 90
width 3B and depth 2B considering various soil mixtures
6.8 Settlement of B=2m wide strip footing resting on stabilized soil of 91
width 3B and depth 2B considering various soil mixtures
6.9 Net allowable pressure for various soil mixtures for footing resting on 92
stabilized soil of width 2B and depth 1B for an allowable settlement of 25mm
xi
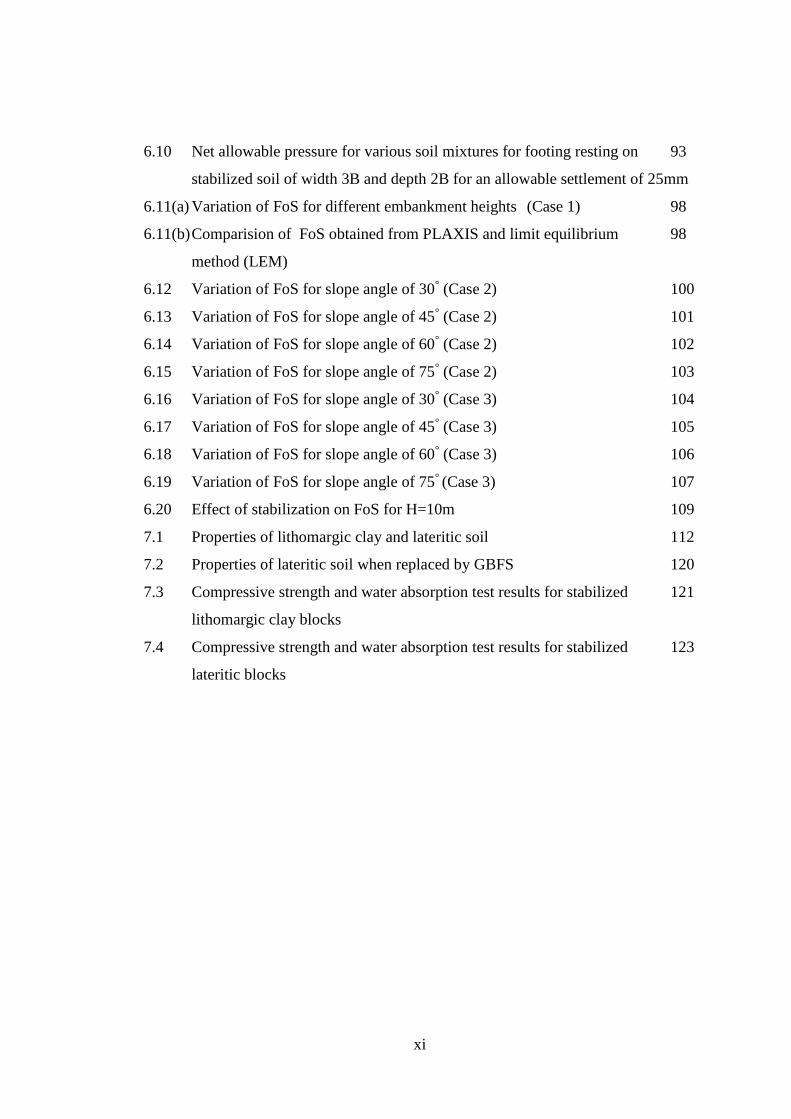
6.10 Net allowable pressure for various soil mixtures for footing resting on 93
stabilized soil of width 3B and depth 2B for an allowable settlement of 25mm
6.11(a) Variation of FoS for different embankment heights (Case 1) 98
6.11(b) Comparision of FoS obtained from PLAXIS and limit equilibrium 98
method (LEM)
6.12 Variation of FoS for slope angle of 30° (Case 2) 100
6.13 Variation of FoS for slope angle of 45° (Case 2) 101
6.14 Variation of FoS for slope angle of 60° (Case 2) 102
6.15 Variation of FoS for slope angle of 75° (Case 2) 103
6.16 Variation of FoS for slope angle of 30° (Case 3) 104
6.17 Variation of FoS for slope angle of 45° (Case 3) 105
6.18 Variation of FoS for slope angle of 60° (Case 3) 106
6.19 Variation of FoS for slope angle of 75° (Case 3) 107
6.20 Effect of stabilization on FoS for H=10m 109
7.1 Properties of lithomargic clay and lateritic soil 112
7.2 Properties of lateritic soil when replaced by GBFS 120
7.3 Compressive strength and water absorption test results for stabilized 121
lithomargic clay blocks
7.4 Compressive strength and water absorption test results for stabilized 123
lateritic blocks

xii
NOMENCLATURE
Abbrevations
CAH Calcium Aluminum Hydrate
CAOH Calcium Aluminum Oxide Hydrate
CASH Calcium Aluminum Silicate Hydrate
CBR California Bearing Ratio
CSEB Compressed Stabilized Earth Blocks
CSH Calcium Silicate Hydrate
CSHH Calcium Silicate Hydroxide Hydrate
GBFS Granulated Blast Furnace Slag
GGBFS Ground Granulated Blast Furnace Slag
IS Indian Standards
LC Lithomargic Clay
MDD Maximum Dry Density
OMC Optimum Moisture Content
OPC Ordinary Portland Cement
PC Portland Cement
pH Potential of Hydrogen
UCS Unconfined Compressive Strength
UU Unconsolidated Undrained
Notations
wL Liquid Limit
wP Plastic Limit
wS Shrinkage Limit
IP Plasticity Index
γd Maximum Dry Unit Weight
c Cohesion
ϕ Angle of Internal Friction
° Degrees

1
CHAPTER 1
INTRODUCTION
1.1 GENERAL
Every civil engineering structure, whether it is a building, a bridge, a tower, an
embankment, a road pavement, a railway line, a tunnel or a dam, has to be founded in
soil or rock and thus shall transmit the dead and live loads to the soil stratum. Proper
functioning of a structure depends critically on the success of the foundation element
resting on the subsoil.
In earlier days, the land possessing good engineering sites were available in plenty.
Now, the situation has changed. The good sites are not available. Due to rapid
urbanization and industrialization, the low lying areas are filled with mainly poor soil.
The construction and design of embankments and foundations on such kind of
problematic soils is challenging assignment for engineers. With increase in construction
activity both onshore and off shore, it has become imperative to solve geotechnical
problems concerned with soft, organic and compressible soil. Soil used for foundation
and embankment construction should possess adequate strength and incompressibility.
Obtaining such soil satisfying all conditions is impossible. In such cases, the available
soil is modified and its properties are improved by some chosen method (Sarvade and
Nayak 2014).
1.2 SOIL STABILIZATION
Sites having poor engineering properties like low lying agricultural and marshy lands
that were once discarded as not suitable for construction activities are now being used
because of the rapid industrialization and urbanisation. Hence, ground improvement is
the need of the hour.
Soil stabilization is the process of improving the engineering properties of the soil by
addition of a special soil or a cementing material or other chemical materials and thus
making it more stable. This technique is used to improve the shear strength and to

2
reduce the permeability and compressibility of the soil mass. One of the most common
stabilization process includes the mixing of natural coarse grained soil and fine grained
soil to obtain a mixture that have adequate angle of internal friction and cohesion thus
providing a material that is stable and workable during the placement operations.
In many cases, the ground conditions and the earth materials are not ideal for proposed
or planned development. Poor soil conditions inhibit sound construction and
development of quality infrastructure. As development continues throughout the world,
many of the ideal sites have already been built upon, leaving less desirable sites for
future use. This necessitates the use of sites with soils of marginal quality. Thus, ground
improvement techniques have been used which provide suitable alternatives for new
construction in a previously discarded site with poor soil conditions. Modification of
the earth materials or stabilization of soils can be done to achieve the desired goals of
assuring adequate engineering properties and responses for a variety of applications and
conditions. In addition, the precious resources of earth materials can be preserved with
this better treatment of existing soils to provide acceptable engineering properties.
Nowadays, the disposal of industrial waste materials have become a serious issue and
thus the reuse of waste materials or industrial by-products for stabilization of soil can
solve the problem to a great extent. Various techniques can be used and they are aimed
at improving the properties by:
Reducing the compressibility to avoid settlement.
Increasing shear strength, stability, bearing capacity, stiffness and durability.
Modifying permeability.
Mitigating the undesirable properties such as shrinkage or swell potential and
liquefaction potential.
Improving durability to dynamic/repeated loads, including freeze-thaw.
These improvements can be done during the preconstruction, construction or post
construction phases. They provide a diverse choice of approaches for solving the
challenges.

3
1.3 LITHOMARGIC CLAY
The southwestern coastal area of India has a hard crust on the top. These top layers of
the laterite formations are highly porous but hard and strong. Below these hard laterites,
soils consisting mainly of silt is present. These silty soils dissolve and flow like water
when water gushes through this layer during monsoon and many times washes–off the
fine soil, creates cavities and at time causes heavy settlement and sliding of the top
layers after the application of load. This bed soil is termed as lithomargic clay, locally
known as shedi soil. This type of soil is abundantly available in regions starting from
Cochin to Goa (Nayak and Sarvade 2012).
Fig. 1.1 Profile of lateritic soil and lithomargic clay at Padupanambur site, Mangalore,
Karnataka, India
Lithomargic clay is mainly composed of hydrated alumina and kaolinite powder. It is
whitish, pinkish or yellowish in colour, consisting mainly of silt and sand particles. This
soil is present in between weathered laterite and hard granite gneiss and is found at a
depth of 1–3 m below the top lateritic outcrop throughout the western coast of south
India (figure 1.1). Lithomargic clay is the product of tropical or subtropical weathering.
Lithomargic clay mainly composes of silty particles in a size range of 2 to 75 microns.

4
These are commonly formed by the mechanical weathering of rocks. It tends to exist in
a meta-stable state (Nayak and Sarvade 2012).
When lithomargic clay loses its strength when it is exposed to water. This makes it
unsuitable for construction of many structures. This soil also has high erosion potential.
Predominance of dissolved Na+ makes the soil susceptible for erosion. Such soil tends
to disperse even in still water. It does not possess any desirable engineering properties
and its behaviour is unpredictable, especially when the soil is fully saturated. As a
consequence of wetting, slope failure, embankment failures, cavity formation in
tunnels, heaving of soil and settlement of foundation may occur. This soil is neither
suitable as foundation material nor as a filling material in construction activities.
Therefore, construction on this type of soil requires special design and precautions.
1.4 GRANULATED BLAST FURNACE SLAG (GBFS)
The use of normal stabilizers like cement, lime etc. for soil stabilization is being
reduced because of the increase in the cost of cement and its effect on the carbon
footprint. Nowadays, the emphasis is on the material handling ability and achieving the
desirable properties. Utilization of industrial wastes/by-products mainly reduces their
disposal problems and the cost of the project. Such materials provide social, economic
and environmental benefits when used in soil stabilization.
Due to rapid industrialization and urbanization, steel is one of the major constituent in
construction activities. Granulated Blast Furnace Slag (GBFS) is obtained from the iron
and steel industries in large quantities (i.e. >10 million tons/annum). This slag is
obtained by quenching the molten slag with high-pressure jets. Quenching prevents the
crystallization leading to the formation of granular glassy aggregates. When these slags
are crushed, powdered and screened, they can be used in the production of Ground
Granulated Blast Furnace Slag (GGBFS) and slag-cement because of their binding
properties similar to that of cement (Gruskovnjak et al. 2006). For every ton of crude
iron produced, about 300-540kg of slag is obtained. These slags mainly consists of
calcim, magnesium, manganese and aluminum silicates in numerous combinations.
Blast furnace slag with its high lime content (30-45%) upon exposure to water, hydrates
forming cementitious pozzolanic reactions products similar to those formed during the

5
hydration of cement (Kavak and Bilgen 2016). Moreover, this would reduce the CO2
emissions produced from the manufacture of cement and conserve the limestone
deposits that would be utilized in the production of cement. The National Slag
Association (NSA) has proved that the use of these slags in construction activities does
not possess any threat to the humans and environment (Indian Minerals Yearbook
2015). In addition, the cost of Granulated Blast Furnace Slag (GBFS) is inexpensive
when compared to cement.
Fig. 1.2 Profile of granulated blast furnace slag at Kirloskar Ferrous Industries Limited,
Koppal, Karnataka, India
With increase in demand for steel, iron industries are increasing their capacities for
production and hence the higher amount of slag is being generated. Moreover, with the
upsurge in cost of grinding these coarse slags to a finer size, which would be later used
in production of GGBFS and slag-cement, there is a large accumulation of these slags
near these iron industries. This is an added burden for these industries because large
stacking of these slags disturb the surrounding environment and consume large areas
(figure 1.2). Hence, to increase the rate of disposal of these slags and to check the
efficiency of granulated blast furnace slag in stabilizing lithomargic clay, this work is
proposed, as it would be a cost effective method of disposing slag. Thus, the overall

6
objective is to maximize the slag utilization without any appreciable loss in strength
(Rabbani et al. 2012, Dermatas and Meng 2003).
1.5 SCOPE AND OBJECTIVES OF THE INVESTIGATION
GBFS is a byproduct produced during iron manufacturing and is easily available in very
large amounts and it is relatively economical compared to cement and other additives.
Using GBFS and cement as soil stabilization agents may impart new and improved
strength properties in lithomargic clay soils. It may impart greater strength than using
any additive alone in the long term, which improves the durability and performance of
structures. Using GBFS and cement for lithomargic clay stabilization is still a novel
process in southwestern coast of India and it has never been used in manufacturing
compressed stabilized earth blocks. Hence, there is need for research in this regard.
The main objectives of the study are:
1. To characterize lithomargic clay and GBFS according to their geotechnical
properties.
2. To investigate the effect of GBFS with and without cement, on index and strength
properties of lithomargic clay.
3. To identify the reaction products of the stabilized soil and to
i. Identify mechanisms by which the changes in engineering properties
will be achieved using X-ray diffraction.
ii. Study the change in structural morphology using scanning electron
microscopy.
4. To apply the experimental results in PLAXIS 2D software to
i. Load-settlement analyses of strip footings.
ii. Stability analyses of embankment slopes [soon after construction –UU
condition].
5. The usage potential of GBFS in the manufacture of compressed stabilized earth
blocks (CSEBs)

7
1.6 ORGANIZATION OF THE THESIS
The thesis work titled ‘Studies on lithomargic clay stabilized using granulated blast
furnace slag and cement’ is presented in eight chapters as follows:
Chapter 1: The first chapter includes introduction to lithomargic clay, GBFS and
their problems, the need for stabilization and the research objectives
adopted for the thesis.
Chapter 2: A comprehensive literature available for the present study is reviewed
in this chapter.
Chapter 3: This chapter provides a detailed discussion on the different materials,
experimental tests and their methodology.
Chapter 4: The fourth chapter deals with the results obtained from the experiments
conducted on lithomargic clay, GBFS and lithomargic clay stabilized
with GBFS and cement.
Chapter 5: The microstructural analysis of stabilized soil using Scanning Electron
Microscopy and X-Ray Diffraction is presented in this chapter.
Chapter 6: Load settlement analyses of strip footings and slope stability analyses
(of embankment soon after construction) for soil alone as well as
stabilized soil using PLAXIS 2D is dealt in this chapter by inputting the
results obtained from the laboratory experiments.
Chapter 7: This chapter deals with the utilization of GBFS and cement in the
manufacture and testing of compressed stabilized earth blocks made
from two locally available soils.
Chapter 8: The conclusion drawn from the study along with scope for future work
is presented in this chapter.

8

9
CHAPTER 2
REVIEW OF LITERATURE
2.1 GENERAL
There is a need for innovative research, knowledge transfer and best practice regarding
the ground improvement methods. Soil stabilization is a useful civil engineering
method that allows the in-situ ground to support an engineered structure. With the rise
in carbon emissions resulting in global warming and climate change, successful new
methods are vital. The impact of the traditional stabilizers does not restrict itself to the
contamination of the geoenvironment, but turns out to be a serious global threat due to
the emission of greenhouse gases. Hence, it becomes essential to find new alternatives.
This environmental impact due to conventional additives can be reduced by the
utilization of industrial by-products, which are sustainable, and easily available
(Jayanthi and Singh2016). These by-products should be able to satisfy the requirements
of an additive, to create more durable and sustainable composites. Through such
materials, sustainable infrastructure development is possible. An attempt is made in this
chapter to review the available literature regarding the usage of slag and cement in soil
stabilization and their applications.
2.2 LITHOMARGIC CLAY AND LATERITIC SOIL
Laterite is well known in southwestern coast of India as a building material for
generations. Lateritic soil is defined as a soil layer that is rich in iron oxide and derived
from a wide variety of rocks weathers under strongly oxidizing and leaching conditions.
It forms in tropical and subtropical regions where the climate is humid. The term
lateritic soil is often substituted for ferricrete but technically refers to a soil rich in iron
oxides and aluminum. It is a highly weathered material, rich in secondary oxides of iron
and aluminum or both and hence its colour is reddish brown. Generally, it is expected
that deeper the excavation, harder the ground met with but in lateritic formation, this
situation is reversed as seen in the geoprofile. Hard stratum is met at top followed by
soft stratum of weathering zone for considerable depth and the parent rock at the

10
deepest level. According to strength criteria, it goes reducing from top to deeper level
due to varying engineering properties. Laterites are formed by the decomposition of the
rock, removal of silica and bases and accumulation of aluminum of iron sesquioxides,
titanium, magnesium, clay and other amorphous products. Generally, a coarse-grained
concretionary material with ninety percent or more of these laterite constituents is
termed as laterites. These top layers of the laterite formations are highly porous but hard
and strong. While relatively fine-grained material with lower concentrations of oxides
are referred to as lateritic soils (Hegde and Davare 2010).
The problematic lithomargic clay soil, locally known as shedi soil is found from a depth
of about 2 meters to 20 meters, underlying lateritic soil layer in the coastal area of
Karnataka. This shedi soil is a non-expansive soil containing Kaolinite and Smectite as
major clay minerals. (Ramesh et al. 2009). In between the top low-level laterites and
bottom high-level laterites, lithomargic clays are present. They have a size distribution
between sand and silt. Due to its dispersive nature, these soils dissolve and flow like
water whenever it is exposed to water, which creates cavities and at time causes heavy
settlement and sliding of the top layers after the application of load (Ramesh and
Venkataraja Mohan 2011, Ramesh et al. 2013).
The strength property of shedi soil depends on density and compactive effort. The
strength of shedi soil increases continuously with the addition of fly ash. The strength
of lithomargic clay treated with 20% fly ash increases the strength with curing both for
soaked and unsoaked conditions. However, for unsoaked condition the increase is 18
folds and for soaked condition it is 14 folds compared to shedi soil alone (Ramesh et
al. 2011). The strength of shedi soil increases when it is stabilized with certain additives
and it can be successfully used in the construction field (Shruthi and Kishore Kumar
2015). Shedi soil stabilized with pond ash showed improvement in strength. The gain
in strength for 7 days cured samples may be because of long term reaction such as
pozzolanic and carbonation (Suresh et al. 2009).
Studies on lithomargic clay showed a reduction both in modulus of subgrade reaction
and in elastic modulus by 72% and 70% respectively due to soaking (Ravi Shankar and
Suresha 2006). Improvement in strength is observed when lithomargic clay is stabilized

11
with coir, pond ash and lime. The CBR of shedi soil at light compaction condition was
<1% for soaked condition and 6% for unsoaked condition (Ravi Shankar et al. 2013).
Reduction in plasticity characteristics and improvement in strength were observed in
lithomargic clay when stabilized with quarry dust and cement (Nayak and Sarvade
2012).
When Portland cement is added to lateritic soil, CASH is formed. As the pozzolanic
reaction progresses, CASH is slowly converted into a well crystalline phase to form
calcium silicate hydrate (CSH) and calcium aluminium hydrate (CAH) which hardens
with age to form a permanent compound that binds the soil particles. As a result, the
shear strength of the stabilized soil is improved. UCS and CBR of the laterite sample
would increase significantly with a cement quantity of 3% (Jaritngami et al. 2014).
2.3 SOIL STABILIZATION USING CEMENT, SLAG AND OTHER
ADDITIVES
Utilization of conventional stabilizers like cement, lime put great pressure on the natural
resources and to the global environment. There are significant environmental impacts
associated with Portland cement (PC) production, such as high CO2 emissions (0.95 t
CO2/t PC), energy consumption (5000 MJ/t PC), and non-renewable resources (1.5 t
limestone and clay/t PC) (Higgins 2007). Hence, there is a great need to find new
alternatives. Granulated blast furnace slag (GBFS) is a by-product obtained from the
iron industry. Granulated slag is obtained by quenching the molten slag by means of
high-pressure water jets. Quenching prevents crystallization, thus resulting in granular,
glassy aggregates. This slag is crushed, pulverized and screened for use in various
applications, particularly in cement production because of its pozzolanic
characteristics. More than 10 million tonnes of slag per annum is produced in India.For
every tonne of crude iron produced, about 300-540kgs of slag is obtained. The cement
industry consumes up to 70% of the blast furnace slag generated. Nevertheless, the rate
of disposal of these slags is less when compared to the amount of slag generated. With
increasing capacities, there is large stacking of these slags in the vicinity of these
industries, which causes environmental and disposal issues. Nevertheless, slag
generation remains unavoidable and emphasis on its recycling remains one of the most

12
serious concerns that need attention. Pertinently, the concerns of today are to pay
adequate emphasis on minimization of waste generation, recycling and re-use of waste,
and minimizing the adverse impact of disposals to the environment. Slag cement has
low heat of hydration, low alkali aggregate reaction, high resistance to chlorides and
sulphate and it can substitute for ordinary Portland cement. Hence, slag cement is
helpful in reducing the impact on the global climate and environment caused by the
production of cement (Indian Minerals Yearbook 2015).
Cement stabilization of clays showed large improvements in strength. This
improvement is due to the increased reticulation forming CSH gel. Thus, clay particles
flocculate into larger size clusters. The fast hydration reaction is accompanied by the
much slower pozzolanic reaction over time. The secondary cementitious products
appear to be deposited on or near the surfaces of the clay clusters. This give rise to a
reduction in entrance pore diameter but an increase in particle size (Chew et al. 2004).
The strengths of a soft marine clay significantly increased when mixed with cement. It
was found that growths of CSH and ettringite with curing time were responsible to
improved strength. Strengths were increased proportionally with amounts of the major
hydration products such as CSH and ettringite that were formed. (Nontananandh et al.
2010). Water/Cement ratio is the key parameter controlling the strength of the treated
soil samples. Higher initial water content requires more cement content to attain desired
strength as compared to the soil treated at lower initial water content for the same water
cement ratio (Suganya and Sivapullaiah 2013). C3S and C2S are responsible for the
early and later strength respectively. With the addition of water, C3S rapidly reacts to
release Ca ions, OH- ions, and a large amount of heat. This reaction slowly continues
producing Ca and OH- ions until the system becomes saturated. Soon, the calcium
hydroxide starts to crystallize. Simultaneously, CSH begins to form. The formation of
the Ca(OH)2 and CSH crystals, results further formation of CSH gel (Ouf 2012).
Cement stabilization improves the soil structure by increasing inter-cluster cementation
bonding and reducing the pore space. With time, the large pores are filled with the
cementitious products; thus, the small pore volume increases, and the total pore volume
decreases. This is the reason for improvement in strength with curing (Horpibulsuk et
al. 2010). A three-step model of dissolution, orientation and hardening takes place in

13
the mix. The reaction products depend also on the activator and on the prime materials
(Pacheco-Torgal et al. 2008).
The formation of pozzolanic reaction compounds (CSH, CAH) in lime treated soil
confirms the reduction of compressibility behavior by aggregation and strong binding
of particles, which is mainly due to the pozzolanic reaction. Broad peaks of pozzolanic
reaction compounds (CSH, CAH) are observed with curing period, causing more
reduction in soil compressibility. Increase in ratio of Ca:Si with lime content and curing
period may be attributed to formation of pozzolanic reaction product (Jha and
Sivapullaiah 2014). Through Scanning Electron Microscopy analyses, it was observed
that for any given percentage of lime, strength improved by the aggregation of soil
particles and formation of compacted matrix with curing period. Cementitious
compounds such as CASH, CAH and CASH were observed in lime treated soil at higher
lime content from XRD analyses (Jha and Sivapullaiah 2015).
In lime stabilized soils, liquid limit decreased by altering its diffuse double layer. With
increased lime content the amount of cementitious compounds that result in visible
strength increases. Among these, the major cementitious compounds are gyrolite, CSH,
and CASHH, which improves the strength and stiffness of the soil. However, further
addition of lime reduced improvement in strength. This is due to the excess formation
of silica gel, a highly porous material (Dash and Hussain 2012). The strength
development in lime-stabilized soils is mainly due to the pozzolanic reaction and is a
time-dependent phenomenon. The remaining lime content after short-term reaction
(flocculation and cation exchange) is used for pozzolanic reaction (long term reaction).
With the use of 2% and 4% lime, the maximum lime is consumed in the short term
reaction and, hence, very less amount of lime is available for the long term reaction,
leading to the marginal increase in strength. Strength reduction in lime stabilized
gypsiferous soil is due to the formation of more ettringite needles. The formation of
larger voids, reduction in cementitious ability and disturbance in the soil matrix leads
to the sharp reduction in the strength of soil at 28 days (Jha and Sivappullaiah 2015).
The addition of a sufficient amount of lime induces a highly alkaline environment
(pH≥12), which helps to promote slow clay dissolution and the formation of aluminate

14
and silicate anions. Ca2+ cations can link aluminate and silicate anions and induce the
formation of calcium aluminosilicate hydrates, a cementitious product bonding the
adjacent soil particles together. These reactions, called pozzolanic reactions, are very
slow at room temperature and yield various amorphous phases (gels). Adding more
lime (>4%) seems to fill the porosity of the sample and reduces its permeability. With
curing time, permeability decreases for the treated sample as the continuous lime/clay
reaction modifies the pore size distribution by cementation and filling some pores.
Changes in the texture, pore size and pore accessibility increase the tortuosity which
leads to a reduction in permeability (Al-Mukhtar et al. 2012). In case of cement, the
reactions are mainly hydraulic, while with lime they are pozzolanic. This means that
cement needs only water to react, since the pozzolanic component is already
incorporated into the cement, whereas lime needs water and a pozzolanic material, like
clay (Cristelo et al. 2013).
Knowledge of the chemical, mineralogical, and morphological properties of slags is
essential because their cementitious and mechanical properties, which play a key role
in their utilization, are closely linked to these properties. Although slag without an
activator does react with water, the rate of hydration is very slow. Coatings of alumino
silicate form on the surface of slag grains within a few minutes of exposure to water,
and these coatings were impermeable to water. Unless a chemical activator is present,
further hydration is inhibited. Portland cement, gypsum and many alkalies have been
used as activators, and it has been observed that the rate of hydration is faster at higher
alkali concentrations. The pH of the solution plays an important role in the hydration
process and also in determining the nature of C-S-H formation. With a solution pH
below 11.5, it is hard to solubilize silica in spite of the presence of a chemical activator
in the aqueous phase (Song et al. 2000).
Soft clays containing high organic matter when stabilized with cement or lime have
shown no desired improvement in properties, due to the humic acid that affects the
reaction. Hence, the partial replacement of cement by GBFS has produced effective
results due to its potential hydraulicity that enabled pozzolanic reactions and increased
the unconfined compressive strength of the soft clay. The strength of cement and slag
stabilized clays is higher than the cement alone stabilized at high curing periods (Jiang

15
et al, 2004). In PC-GGBFS blends, GGBFS is mainly activated by the portlandite, one
of the PC hydration products indicating that hydrated lime may be used to activate
GGBFS directly.
Dispersive clays can be stabilized satisfactorily using blast furnace slag and basic
oxygen furnace slag (BOFS). This is due to the ion exchange phenomenon. As the
additive content increases, causing a more flocculated structure and producing larger
particles that have a lower tendency to erosion (Goodarzi and Salimi 2015).
Improvement in bearing capacity is seen in clayey soils mixed with ladle furnace slag
than those stabilized with lime. The curing time is longer and durability is better than
that of lime-soil mixtures (Manso et al. 2013).
CBR values increased with GGBFS addition to the soil, especially in presence of lime.
The un-soaked and soaked CBR values of samples have increased significantly
(Rabbani et al. 2012). Granulated blast furnace slag (GBFS) and GBFS cement
(GBFSC) reduced the expansion of expansive soil. With the addition of GBFS and
GBFSC clay fractions decreased and silt fractions increased upon adding GBFS and
GBFSC and Plasticity index decreased (Cokca et al. 2009).
Use of slag as an admixture for improving engineering properties of the soils is an
economical solution to use the locally available poor soil. It is observed that with
increase of additives, both the UCS and stability of soil is improved when compared to
using lime alone. UCC strength of lime-slag stabilized black cotton soil increased up to
18 times that of natural soil (Manjunath et al. 2012). With the increase in GGBFS
content, compressive strength increases by the re-arrangement of soil particles to reduce
the voids. The pavement thickness can be reduced considerably with increases in
percentage of GGBFS (Pathak et al. 2014). As the CaO/SiO2 ratio increases, the rate of
reactivity of the GGBFS also increases up to a limiting point. Increasing the CaO
content makes granulation to glass phase content. (Takhelmayum et al. 2013). In
comparison to conventional stabilizers like lime, cement etc. GGBFS is very economic
and should thus be given serious consideration when specified for highways and
foundations (Veith 2000). With the increase of GGBFS content liquid limit, plastic limit
and plasticity index decreases, which makes the soil less plastic and hence plasticity

16
index reduces. With the increase in GGBFS content, compressive strength as well as
the CBR value increases (Kumar et al. 2015). Shape and size of fly ash and GGBFS are
the main factors controlling the compressibility, resilient and permanent deformation
characteristics (Sharma and Sivapullaiah 2016).
Since the slag introduces extra and more freely available alumina and silica due to its
high reactivity in the presence of lime, the formation of the strength contributing
silicates and aluminates is enhanced. In PC–GGBFS systems, the higher amounts of C–
S–H gel are produced (Wild et al. 1998). The stabilization performance of the high
plastic clay is better than that of the low plastic clay for each of the GGBFS contents.
This study has revealed that the use of GGBFS waste material has the potential to
modify the properties of clays in order to decrease their swelling potential, and therefore
positively affect the stabilized soil samples (Sivrikaya et al. 2014). Hydration reaction
of GGBFS is slower than that of the hydration of cement. The blocking of pores leads
to higher strength and lower permeability (Wild et al. 1996). The GGBFS basicity is
considered as the factor governing for hydraulicity. The more basic the slag, the greater
is its hydraulic reactivity. In the presence of alkaline activators, the hydration of slag
involves complex chemical and physical reactions such as adsorption, ion exchange,
dissolution, and hydrolysis (Lizarazo-Marriaga et al. 2011).
GGBFS when mixed with clay without any other activator is able to produce only a low
amount of the hydration products after a long time curing period. In fact, when the
GGBFS is in a moist condition, it forms an Al−Si−O layer on the surface of its particle.
However, the pH of the mixture and OH− increase due to absorbed H+ ions by this layer,
but it is not sufficient to break the Al−O and Si−O bonds to generate the hydration
products and only a small amount of the CSH will be generated after a long curing time.
Therefore, application of the GGBFS is based on the power of its activator for breaking
these bonds. The formation of CSH in the mixture of the GGBFS with clay is due to
addition of the PC as an activator. Ettringite was not observed in the GGBFS mixed
with clay pattern, as it is an early hydration product generates in GGBFS activation
(Keramatikerman et al. 2016).

17
Slag has a relatively constant chemical composition compared to fly ash, silica fume,
pozzolanas etc. Besides, it has advantages like low heat of hydration, high sulfate and
acid resistance, better workability, higher ultimate strength, etc. These properties are
beneficial in specialized applications such as hydroelectric dams, large bridges, power
stations, metro systems, motorways, and harbours (O nera et al. 2003).
The stiffness and strength improve with increase in PC content. The dissolution rate of
GGBFS generally depends on the alkali concentration of the reacting system.
Formation of hydration products, leading to higher rate of strength development, are
determined by the availability of Ca2+ provided by the free lime content (Konsta-
Gdoutos and Shah 2003). Initial tangent modulus and UCS of soil-lime and GBFS
mixture increase with increase in additives and also with curing periods (Swamy et al.
2015). Utilization of lime and GGBFS in soil stabilization offers a slower early-rate of
strength development, providing more time for construction operations. There is also
extra ability to self-heal, in the case of early-life damage caused by overloading. There
is an improvement in structural performance in the long term (Higgins 2005).
Soil stabilization with slag-lime reduces the dry unit weight. The soil transforms into a
rapid structure and the modulus of elasticity increases. The improvement in strength
with the combination of GGBFS and lime is much larger when compared to lime
stabilization (Kavak and Bilgen 2016). Both the liquid limit and plastic limit decreased
with an increase in the slag content. This is due to the less moisture-holding capacity
of the slag. The soil–slag mix is a non-swelling-type material having less affinity
towards water. There was a large improvement in UCS with little addition of cement
content. Therefore, the slag–soil mix stabilized with adequate cement content can be
used as a suitable construction material (Athulya et al. 2016). Both fly ash and GBFS
are granular particles having no cohesion between the particles. The strength offered
by the compacted fly ash–GBFS sample is mainly due to the mobilization of frictional
strength of the materials. With increase in cement content in the mixture, the quantity
of gel formation increases, which binds the particles more effectively resulting in higher
CBR value (Singh et al. 2008). The hydrated lime-activated GGBFS with lime to
GGBFS ratio of 0.10 is recommended to replace PC for this soft marine clay
stabilization application for environmental and economical benefits (Yi et al. 2015).

18
Addition of GGBFS reduces optimum moisture content as well as maximum dry unit
weight. This is due to the reduction in clay fraction of the soil and therefore the lesser
water holding capacity. The reduction in MDD is due to the predominant effect of high
frictional resistance offered by coarser GGBFS particles due to size and surface texture
resisting the compactive effort effectively. However, the effect of reduction in water
holding capacity and increase in frictional resistance are more or less evenly balanced
at lower GGBFS contents and maximum dry unit weight remains unaffected (Sharma
and Sivapullaiah 2012). Strength increases significantly with addition of little percent
of lime to slag stabilized soil, however at higher content of lime the improvement in
strength is negligible (Sivapullaiah 2013). Unconfined Compressive Strength (UCS) of
black cotton soil increases with the addition of small amount of GGBFS, which remains
constant up about 40% addition of GGBFS. With further addition of GGBFS, the UCS
decreases continuously. This is due to the reduction in clay fraction of the soil with
addition of coarser GGBFS particles and the effect of compaction parameters as the soil
GGBFS mixes, which are compacted at their respective optimum water contents. With
increase in the GGBFS percentage the available pozzolanic material increases but the
available water for pozzolanic reactions reduces due to decrease in their moulding water
content. Additionally, the moulding unit weights are also lower with increasing GGBFS
percentages. At higher GGBFS replacement (i.e. >40%) the effect of decreased
moulding water content and density dominate and hence the strength decreases (Sharma
and Sivapullaiah 2011).
Fly ash mixed with GGBFS has the potential to improve the properties of expansive
soil with a minimum requirement of chemical additives such as lime. The pozzolanic
reaction can be enhanced by adding lime or cement that could improve the performance
of fly ash/GGBFS mixtures (Sharma and Sivapullaiah 2016). The cementitious and
pozzolanic behavior of ground granulated blast furnace slag is essentially similar to that
of high-calcium fly ash. Since the pozzolanic reaction is slow and depends on the
calcium hydroxide availability, the strength gain takes longer time for the GGBFS
concrete. Calcium hydroxide is produced by the hydration of cement and consumed in
the pozzolanic reaction. The pozzolanic reaction can only takes place after the Portland
cement hydration starts. As the cement content increases, the hydration product calcium
19
hydroxide also increases and more calcium silicate hydrates are formed due to reaction
with GGBFS. Hence, pozzolanic reaction is slow and the formation of calcium
hydroxide requires time (Oner and Akyuz 2007). The main hydration product of
GGBFS was Calcium Silicate Hydrate, regardless of the activator type (Yi et al. 2014).
The decrease in initial strength of GGBFS cement could be overcome if the fineness of
GGBFS were increased to promote higher rate of hydration. However, increasing the
fineness of slag by pulverization could easily increase the manufacturing cost of
GGBFS. GGBFS is a low performance cementitious material, which can achieve high
compressive strength when an alkaline activator is used (Kim et al. 2011).
In lime-fly ash stabilized soils, the calcium from lime and fly ash reacts with soluble
alumina and silica from clay and fly ash, in presence of water to produce stable CSH
and CAH. The reduction in pore spaces was observed which generates long-term
strength gain and improve the geotechnical properties of the soil (Sharma et al. 2012).
For class-F fly ashes, which usually require high amounts of lime or cement as
additives, the addition of GGBFS will help to enhance its mechanical properties largely
even with a small amount of additive such as lime. The addition of lime to fly ash–
GGBFS mixtures further increased the UCS by accelerating the pozzolanic reaction
(Sharma and Sivapullaiah 2016). Stabilization of clayey soils with high calcium fly ash
depends on the type of soil, the amount of stabilizing agent and the curing periods.
Higher amounts of tobermorite is produced leading to a denser and more stable structure
of the stabilized material. A further addition of cement provides better setting and
hardening and the combination of these two binders can increase the early as well the
final strength of the samples (Kolias et al. 2005).
2.4 SETTLEMENT ANALYSIS AND SLOPE STABLILITY ANALYSIS USING
PLAXIS SOFTWARE
The soil beneath the footing was replaced with a granular fill and load settlement
response were measured through experimental investigations. From the analysis in
PLAXIS, it was observed that the granular-fill layer helps to improve the load-bearing
capacity of the footing and reduces the settlement since the granular-fill layer is stiffer
and stronger than the natural clay. The partial replacement of the soil with the granular-

20
fill layer results in a redistribution of the applied load to a wider area and thus
minimizing the stress concentration and achieving an improved distribution of induced
stress. Hence, the bearing capacity increased while the footing settlement decreased
(Ornek et al. 2012).
PLAXIS software was used to analyze strip footing resting on granular layer over weak
soil improved by end bearing or floating granular piles. Granular piles of different
diameters, lengths, stiffness and arrangements were modeled. It was found that stiffness
of granular layer has little effect compared to a significant effect of other parameters on
the vertical and differential displacements and the induced bending moment of the strip
footing (El-Garhy and Elsawy 2017).
A comparison of embankment slope stability analysis with the limit equilibrium method
computer program Slope/W and the finite element method computer program Plaxis
2D were analyzed. The results indicated that it is important to use the effective shear
strength characterization of the soil when performing the slope stability analysis. The
factor of safety computed from both Slope/W and Plaxis 2D decreases as the slope
angle becomes larger. The limit equilibrium method overestimated the factor of safety
as compared to the finite element method (Rahman 2012).
2.5 COMPRESSED STABILIZED EARTH BLOCKS
Shelter is one of the basic needs of humans, especially for the lower income groups.
Lack of materials and their higher cost have encouraged research to find new substitutes
to convectional building materials. Cost reduction in the housing sector especially with
the lower income sections can be achieved by innovating new construction materials,
which can be locally made, and with ease of construction. Among sustainable
construction techniques, stabilized earth seems to be noteworthy. From the past 50
years, Compressed Stabilized Earth Blocks (CSEBs) are used for load bearing masonry
construction in various countries. The term block is used to differentiate from brick,
which is usually fired. The main advantage of these blocks is that they can be locally
made with simple construction methods with semi-skilled labour, not requiring a very
specialized equipment, offering high thermal and acoustic insulation. These CSEBs are
about 2.5 times larger than conventional fired clay bricks and therefore construction is
21
faster with lesser joints. Moreover, they consume lesser energy when compared to that
of fired clay bricks or concrete masonry, thus making them cheap and affordable (James
et al 2016). Regardless of these advantages, the use of CSEBs are restricted due to its
below par performance in durability, tensile strength, impact and abrasion resistance
when compared to conventional fired clay bricks. Moreover, the lack of guidelines for
both manufacturers and builders converts it into low acceptance of these CSEBs in
housing sector. CSEBs are manufactured by compressing a wet soil mixture and a
suitable stabilizer in a manually operated press to get a high density block. For meeting
the requirements of building codes, small amount of cement is generally used as a
stabilizer as it is easily available and gives the necessary strength and durability
properties to these blocks.
Compressed stabilized earth blocks (CESBs) are eco-friendly, having sufficient
strength and durability properties with good insulation properties. The use of CSEBs
promotes healthier living for lower income section of the society (Walker 1995). As
clay content increases, strength of blocks are reduced. Reduction in compressive
strength with immersion in water for 48 hours is due to the development of pore water
pressures and the liquefaction of unstabilized clay minerals in the block matrix
(Ramirez et al 2012). The amount of cement to be used will depend on the composition
of the soil. Sandy soils require 5 to 9% cement by volume. Silty soils need 8 to 12%,
and clayey soils require 12 to 15% cement as stabilizer. Cement content more than 15%
is uneconomical (Nagaraj et al. 2014). It is the binding of sand particles, and the self-
hydration products of the cement that contribute to the early strength of the blocks
(Walker and Stace 1997). Cement stabilized soil blocks are ideal for low-rise residential
construction, where minimum strength requirements are often dictated by handling
rather than load carrying requirements. For this purpose, a minimum saturated
compressive strength of 1.0 MPa may be considered satisfactory (Bahar et al. 2004).
The reduction of compressive strength upon saturation goes up to 60% for cement-
stabilized samples. The reduction in compressive strength upon saturation was lower
when high percentages of cement is used (Taallah et al. 2014).
The increase in dry compressive strength would be due to the increasing amount of C2S
and C3S brought about by increasing cement content (Kwon et al 2010). Strength and

22
durability of cement stabilized blocks is dependent on soil gradation and their plasticity
characteristics. In addition, it also depends on the clay type and the amount of clay
content (Nagaraj et al. 2016). Water absorption capacity reduces with time for stabilized
blocks. The decrease in water absorption of stabilized blocks is due to the interactions
of cement with the alumino-silicates in the soil to form cementitious products that
consequently bind the soil particles together and harden with time, thus reducing the
interconnectivity of the voids (Oyelami and Van Rooy 2016). Lateritic soils are found
to be suitable as materials for compressed earth blocks (CEB) with good compressive
and durability strength, which qualifies them as sustainable and cost-effective materials
for low-cost housing development (Reddy et al. 2007). Density significantly affects the
strength and durability properties of CSEBs (Muntohar 2011). In the sand–clay matrix,
since the sand is coarser and the clay finer, the clay particles will fill the void of the
sand particles resulting in an increase in density and reduction of void spaces. The CSH
gel formed fills the void spaces and results in a more impermeable structure, thereby
resulting in an effective binding of particles with significant improvement in strength
(Oti et al. 2009). Hydration reactions take place when cement is blended with soil in
presence of water. The C3S and C2S present in cement react with water forming
complex calcium silicate hydrates. This CSH gel produced will fill the void spaces and
binds the soil particles together imparting rigidity to the mixture. When cement is
blended with GGBFS and soil in the presence of water, the amount of gel formations
increases and gel binds the particles more efficiently (Morel et al. 2007). Strength
reduction on saturation is due to the softening of binders by water and development of
pore water pressures. For an unstabilized soil block, the compressive strength when
immersed in water is zero. The wet compressive strength is nearly half of the dry
compressive strength for stabilized blocks (Oti et al. 2009).
Cement in the activated PC–GGBFS–soil mixture improves the strength by largely
covering the clay particles with an insoluble and impermeable coating (Oti et al. 2009).
Significant improvement in strength can be achieved by little addition of cement and
the strength gain increases with cement content and curing time (Kaniraj and Havanagi
1999). Cement content >4% provides good strength and durability properties for
CSEBs. The strength at 10% cement is almost double that of 4% cement (Tripura and

23
Singh 2015). Higher cement content leads to better stabilization and hence higher wet
strength to dry strength ratio. Higher cement dosages lead to more cementitious material
available to establish water insoluble bonds with the silt and sand particles and hence
leads to higher strength for CSRE (Reddy and Kumar 2011). CSEBs stabilized with
cement is found to have good strength and durability properties when compared with
that of lime stabilized CSEBs (Holliday et al. 2016).
2.6 SUMMARY OF LITERATURE REVIEW
A review of literature revealed that many researchers have worked on the topic
stabilization of soils and their contributions have great significance in the engineering
field. Different laboratory tests and geotechnical investigations have been carried out
to find the influence of various admixtures on the soil behaviour. Studies have been
carried out on the stabilization of problematic soils using various admixtures such as
cement, lime, fly ash and other industrial waste products. Portland cement was found
to be one of the successful admixtures for stabilization from the literature. Nowadays,
stabilization with industrial by products has also attained greater significance. Blast
furnace slag having good pozzolanic character was one among them. Stabilization using
ground granulated blast furnace slag (GGBFS) were studied in the past. However,
detailed studies were not carried out on the stabilization of lithomargic clay with
granulated blast furnace slag (GBFS) and its geotechnical applications. It was also
observed that no study was carried out on the use of lithomargic clay, granulated blast
furnace slag (GBFS) and cement in the manufacture of CSEBs and hence motivated us
to take up the present study. Thus, this study is mainly focused on the behaviour of
lithomargic clay stabilized using GBFS and cement and its application to typical
engineering problems.
2.7 LIST OF DRAWBACKS
1. Experimental studies on soil stabilization were mainly carried out and very few
studies were carried out with respect to its applications.
2. Detailed studies were limited to mainly strength properties and studies on gain
in strength with time with industrial waste as stabilizers is limited.

24
3. No study was reported on stabilization of lithomargic clay using granulated
blast furnace and cement.
4. The usage of lithomargic clay along with granulated blast furnace slag and
cement in the manufacture of compressed stabilized earth blocks is not
explored.

25
CHAPTER 3
MATERIALS AND METHODOLOGY
3.1 GENERAL
A geotechnical engineer aims at collecting and classifying soil samples and
investigating for its geotechnical properties. In any project, evaluation of the index
properties, compaction, shear and settlement characteristics is one of the important step.
Several tests are conducted to determine the properties of both unstabilized and
stabilized soils. The materials used and the methodology adopted for the various tests
are clearly depicted in this chapter. All the tests were conducted as per the Bureau of
Indian Standards.
3.2 MATERIALS USED
3.2.1 Lithomargic clay
The lithomargic clay also known as shedi soil is widely available weak soil in the
southwestern part of India along the Konkan coast. For the present study, the soil
samples were collected from a site at Padupanambur, Mangalore which is located in the
South Canara district of Karnataka state, India. Lithomargic clay was dried, pulverized
and sieved properly as per the requirements. Initially all the basic geotechnical tests
were conducted for the soil alone. Experiments to determine the chemical properties
such as pH, electrical conductivity, silica content etc. of the soil were also conducted.
Then stabilization of lithomargic clay with granulated blast furnace slag and cement
were done separately. Lithomargic clay was replaced by GBFS in different proportion
by dry weight of the soil i.e. 5%, 15%, 25%, 35%, and 45%. Cement was added in
different percentages of 2, 4, 6 and 8% by dry weight of the soil. For each trial, uniform
mixing was ensured to study the geotechnical properties of the stabilized soil. Finally,
experiments were conducted to determine the strength parameters of the soil stabilized
with optimum amount of GBFS and varying percentages of cement. The testing of
stabilized soil was carried out after proper mixing and curing.

26
Fig.3.1 Lithomargic clay sample
3.2.2 Granulated blast furnace slag (GBFS)
The GBFS is a byproduct obtained from the iron industry. It can be used effectively as
a stabilizer to improve the soil properties. GBFS for the present study was collected
from the industrial area at Kirloskar Ferrous Industries Limited, Bevinahalli, Koppal
district located in the northern part of Karnataka state, India. For GBFS alone, basic
geotechnical tests and some of the chemical tests to determine the pH, electrical
conductivity, loss of ignition, the amount of silica, alumina, oxides of calcium etc. were
carried out. Then various geotechnical tests were conducted on soil-GBFS mixtures in
which percentages of GBFS replacing the soil was varied from 5% to 45% of dry weight
of the soil. Strength properties of stabilized soil was determined after different curing
periods.

27
Fig. 3.2 Granulated blast furnace slag (GBFS) sample
3.2.3 Cement
Cement is effective in improving the engineering properties of a wide variety of soils,
including granular materials, silts and clays. Ordinary Portland Cement was used as a
binding material in this study. Cement was added as an additive to the lithomargic clay
in varying amounts of 2, 4, 6 and 8% by dry weight of the soil. Geotechnical tests were
conducted to determine the index properties, compaction characteristics, unconfined
compressive strength, CBR values etc. of the cement-stabilized soil. Finally, cement
was added to the optimum slag stabilized soil and tests to determine the strength
parameters were carried out. Since it needs time for the pozzolanic reaction to occur,
samples were cured for 7 and 28 days and tested.
3.3 LABORATORY TESTS CONDUCTED
The following tests were conducted to determine the geotechnical parameters of the
unstabilized and stabilized soil:
Grain size analysis- sieve analysis and hydrometer analysis

28
Atterberg’s limits tests
Specific gravity test
Standard Proctor test
Unconfined compressive strength test
California bearing ratio test
Triaxial compression test- UU test
Permeability test
For basic soil, tests to determine chemical characteristics such as pH, electrical
conductivity, silica content etc. were also carried out.
To determine the chemical characteristics of GBFS the following tests were carried out:
pH value test
Electrical conductivity analysis
Loss on ignition test
Silica test
Combined alumina and ferric oxide test
Ferric oxide test
Alumina test
Calcium oxide test
Magnesia test
3.4 TEST PROCEDURE
Experiments to determine the geotechnical properties of unstabilized and stabilized
soils were conducted as per IS 2720 and SP 36. Both index and strength properties were
determined. Tests were also conducted to determine the chemical characteristics of
granulated blast furnace slag and study soil. These tests were carried out according to
IS 2720 (Part 26)-1987 Reaffirmed 2002 and IS 1727-1967 (Reaffirmed 2004). The
procedure adopted for all these tests are briefly explained below in the subsequent
sections.

29
3.4.1 Grain size analysis
The test was carried according to IS: 2720 (Part 4)-1985 (Reaffirmed 2006). Soil was
sieved through a set of sieves and the weights of the material retained on different sieves
were determined. This can be used for determining the distribution of coarser fraction
in the soil sample. To determine the distribution of fine particles, hydrometer analysis
is carried out. Soil sample is washed through IS 75 micron sieve and the soil retained
on the sieve was oven dried. The dried out sample was again sieved through the sieve
set specified by the standards and 50 gram of dried sample from the washout (passing
75 micron sieve) was used for hydrometer analyses. The hydrometer measures the unit
weight of the soil suspension, which depends on the mass of solids present that in turn
depends on the particle size.
3.4.2 Atterberg’s limit tests
Liquid limit and plastic limit tests are used to distinguish between silt and clay. Tests
were conducted to determine the liquid limit, plastic limit and shrinkage limit of soil
samples passing through 425μ IS sieve as per IS 2720 (Part 5)–1985 (Reaffirmed 2006).
The liquid limit was determined with the aid of the standard mechanical liquid limit
device, designed by Arthur Casagrande. It is the water content at which, grooves cut in
a pat of soil by a grooving tool of standard dimensions will flow together for a distance
of 13 mm, under 25 blows in the device. From the plot of water content versus log
number of blows, the liquid limit was determined corresponding to 25 numbers of
blows. Plastic limit corresponds to the water content at which the soil when rolled into
3 mm diameter thread just begins to crumble.
3.4.3 Specific gravity test
The ratio of weight of given volume of soil solids to the weight of an equal volume of
water gives the specific gravity value. Great care must be taken to expel all the
entrapped air inside the soil while doing the test. The test follows procedure as per IS
2720-1980 (Part 3) (Reaffirmed 2002).
30
3.4.4 Standard Proctor test
Standard Proctor test also known as light compaction test was carried out to assess the
amount of compaction and water content required in the field. The degree of
compaction is measured in terms of dry unit weight and it is maximum at the optimum
moisture content. A curve was drawn between the water content and the dry unit weight
to obtain the maximum dry unit weight and the optimum moisture content. The
equipment and test procedures adopted are as per IS 2720 (Part 7)-1980 (Reaffirmed
2011).
3.4.5 Unconfined compressive strength test
The unconfined compressive strength is the load per unit area at which the cylindrical
specimen of a soil fails in compression. This test gives the unconfined compressive
strength of soil. UCC tests were performed on statically compacted samples at
maximum dry unit weights and optimum moisture contents as obtained from standard
proctor test. The unconfined compressive strength is taken as the maximum load
attained per unit area, or the load per unit area at 20% axial strain, whichever occurs
earlier while conducting the test. The test was conducted according to IS 2720 (Part
10)-1991 (Reaffirmed 2006).
3.4.6 California Bearing Ratio (CBR) test
The CBR is defined as the force per unit area required to penetrate a soil mass with
standard circular piston at the rate of 1.25mm/minute. The CBR test is conducted to
evaluate the suitability of the sub grade and the materials used in sub-base and base of
a flexible pavement. The plunger penetrates the specimen in the mould at the rate of
1.25 mm per minute. The loads required for a penetration of 2.5 mm and 5 mm were
determined. The penetration load was expressed as a percentage of the standard loads
at the respective penetration level of 2.5 mm or 5 mm. To replicate worst conditions in
the field, the samples were kept soaked in water for 4 days before testing. The test
procedure and equipment used were as specified in the IS 2720 (Part 16)-1987
(Reaffirmed 2002).

31
3.4.7 Triaxial compression test –UU test
Triaxial compression tests are conducted to determine the shear strength parameters of
the soil sample. The specimen is subjected to three compressive stresses in mutually
perpendicular directions; one of the three stresses (vertical stress) was increased until
the specimen fails. In the case of Unconsolidated Undrained (UU) test, no drainage was
permitted during the application of axial stress or all-round pressure. The UU test is
also referred as the quick test because it is a relatively fast test. The stabilized soil
samples were cured for 7 days and 28 days and the UU tests were carried out as per IS
2720 (part 11) 1993 (Reaffirmed 2002).
3.4.8 Permeability test
Tests were carried out to determine coefficient of permeability. The test apparatus and
procedure adopted are according to IS 2720 (Part 17) 1986 (Reaffirmed 2002).
3.4.9 Test to determine pH value
The acidic or alkaline characteristics of a soil sample can be quantitatively expressed
by hydrogen ion-activity commonly designated as pH. The pH is measured
electrometrically by means of an electrode assembly consisting of one glass electrode
and one calomel reference electrode with a saturated potassium chloride solution. The
pH meter directly gives the pH value. The samples were sieved and tested as per IS
2720 (Part 26)-1987 (Reaffirmed 2002). The pH of GBFS was established by this
electrometric method.
3.4.10 Electrical conductivity analysis
Electrical conductivity is an indirect measurement that correlates well with several soil
physical and chemical properties. It is the ability of the material to conduct (transmit)
an electric current and is commonly expressed in micro Siemens. Using conductivity
meter, it can be directly measured in micro Siemens. This test was conducted as per IS
14767-2000.
32
3.4.11 Loss on ignition test
Loss on ignition test was conducted for GBFS according to the procedure mentioned in
IS 1727-1967 (Reaffirmed 2004). The percentage loss on ignition is reported nearest to
0.1 as the ratio of loss in weight to the weight of moisture free sample used.
3.4.12 Test to determine silica, alumina, iron oxide, calcium oxide and magnesia
The various chemical compounds present in GBFS were determined as per the
procedure laid down by IS 1727- 1967 (Reaffirmed 2004). The amount of silica,
alumina, iron oxide, calcium oxide and magnesia present in it were determined through
a series of chemical tests. The silica content in lithomargic clay was also determined.

33
CHAPTER 4
LABORATORY TEST RESULTS AND DISCUSSION
4.1. GENERAL
In the present study, experimental investigation was carried out on the lithomargic clay,
granulated blast furnace slag (GBFS) and lithomargic clay stabilized using GBFS and
cement. To understand the benefits obtained from the stabilization, several tests were
conducted on both unstabilized and stabilized lithomargic clay. All the test results are
analyzed and presented systematically in this chapter.
4.2. PROPERTIES OF LITHOMARGIC CLAY
The lithomargic clay present below the weathered laterite is problematic as its strength
reduces drastically upon saturation. In this work, an attempt is made to study the
improvement in the behavior of the study soil (lithomargic clay) after being blended
with GBFS and cement. The results obtained from various tests are presented in tabular
and graphical form. Test results obtained for the lithomargic clay are presented in Table
4.1.
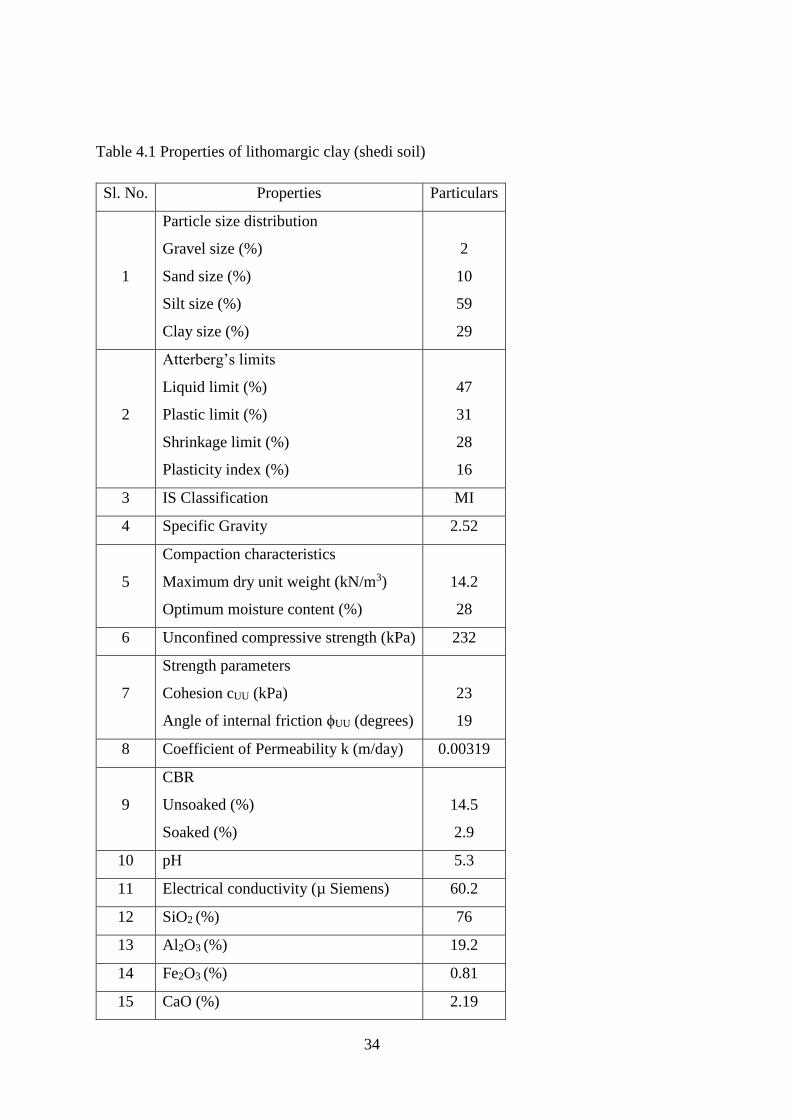
34
Table 4.1 Properties of lithomargic clay (shedi soil)
Sl. No. Properties Particulars
1
Particle size distribution
Gravel size (%)
Sand size (%)
Silt size (%)
Clay size (%)
2
10
59
29
2
Atterberg’s limits
Liquid limit (%)
Plastic limit (%)
Shrinkage limit (%)
Plasticity index (%)
47
31
28
16
3 IS Classification MI
4 Specific Gravity 2.52
5
Compaction characteristics
Maximum dry unit weight (kN/m3)
Optimum moisture content (%)
14.2
28
6 Unconfined compressive strength (kPa) 232
7
Strength parameters
Cohesion cUU (kPa)
Angle of internal friction ϕUU (degrees)
23
19
8 Coefficient of Permeability k (m/day) 0.00319
9
CBR
Unsoaked (%)
Soaked (%)
14.5
2.9
10 pH 5.3
11 Electrical conductivity (µ Siemens) 60.2
12 SiO2 (%) 76
13 Al2O3 (%) 19.2
14 Fe2O3 (%) 0.81
15 CaO (%) 2.19

35
The grain size distribution curve for lithomargic clay is shown in figure 4.1. The particle
size distribution shows that major portion of the soil constitutes of fine-grained soil
particles, silt size of 59% and clay size of 29%. The remaining 12% constitutes coarser
particle size (Gravel size=2%, Sand size=10%).
4.3 PROPERTIES OF GRANULATED BLAST FURNCAE SLAG
The laboratory test results obtained from the basic geotechnical tests and some chemical
tests on GBFS are presented in the Table 4.2.
Table 4.2 Properties of granulated blast furnace slag (GBFS)
Sl. No. Properties Particulars
1 Specific gravity 1.73
2
Grain size distribution
Gravel size (%)
Coarse sand size (%)
Medium sand size (%)
Fine sand size (%)
01
14
43
42
3
Strength parameters
Cohesion (kPa)
Angle of internal friction ϕ (degrees)
4
42
4 pH 9.2
5 Electrical conductivity (µ Siemens) 176
6 Calcium oxide (%) 41
7 SiO2 (%) 35.3
8 Fe2O3 (%) 0.17
9 Al2O3 (%) 13.5
10 MgO (%) 7.2
11 Loss on ignition (%) 0.83
The grain size distribution curve for GBFS is included in figure 4.1. It showed that
GBFS has predominantly medium and fine sand sized particles.

36
Fig. 4.1 Particle size distribution curves for both lithomargic clay and GBFS
4.4. GEOTECHNICAL PROPERTIES OF LITHOMARGIC CLAY
STABILIZED WITH GBFS
In this study, the lithomargic clay was blended with granulated blast furnace slag
(GBFS) and the improvement in properties were analyzed. The soil was replaced with
GBFS in different proportions of 5%, 15%, 25%, 35% and 45% by dry weight of the
soil. The results obtained from the tests are presented in tabular columns. All the
relevant graphs are plotted and the variation in the properties of the stabilized soil is
analyzed and discussed. The summary of the test results of lithomargic clay before and
after stabilization with GBFS is presented in Table 4.3.

37
Table 4.3 Geotechnical properties of lithomargic clay before and after stabilization
with GBFS
Sl.
No. Properties
Percentage of GBFS replacing soil
0% 5% 15% 25% 35% 45%
1 Liquid limit wL (%) 47 43 38 37 35 33
2 Plastic limit wP (%) 31 29 26 25 NP NP
3 Plasticity Index IP
(%) 16 14 12 12 - -
4 Specific gravity G 2.52 2.46 2.38 2.30 2.25 2.21
5 Maximum dry unit
weight γd (kN/m3) 14.2 14.3 14.3 14.2 14.2 14.1
6 Optimum moisture
content (%) 28 27 25.5 24 22 19
7 Soaked CBR (%) 2.9 4.1 6.2 11.9 17 18.3
Typical plots of liquid limit determination from Casagrande’s method are shown in
figures 4.2 and 4.3 for lithomargic clay and lithomargic clay with 25% GBFS
replacement respectively. From Table 4.3 and figure 4.4, it is observed that the liquid
limit of the soil-GBFS mixes reduced with increasing replacement of GBFS to the study
soil. This is due to the replacement of soil particles with that of a non-plastic coarser
material i.e. GBFS to the study soil. The decrease in the specific gravity was due to the
lower specific gravity of the GBFS when compared to lithomargic clay. The specific
gravity reduced from 2.52 to 2.21 at 45% replacement (figure 4.5). Typical plots of
maximum dry unit weight versus and water content are shown in figures 4.6 and 4.7 for
lithomargic clay and lithomargic clay with 25% GBFS replacement respectively. No
major variation in the maximum dry unit weight of the mix was observed because the
GBFS particles due to its size and rough texture resisted the compaction effort. The

38
OMC reduced because of the replacement of soil with that of GBFS, which has lower
water holding capacity than the study soil. The percentage reduction in OMC was found
to be 32% when soil was replaced by 45% GBFS as shown in figure 4.8 (Sharma and
Sivapullaiah 2012). Also from the figure 4.9, it was observed that there is a good
improvement in soaked CBR values, with increase in percentage of GBFS replacement
to the soil. The percentage improvement at 45% GBFS replacement to study soil is
found to be 531%.
Fig. 4.2 Plot of water content Vs no. of blows for lithomargic clay
Fig. 4.3 Plot of water content Vs no. of blows for lithomargic clay with 25% GBFS
replacement

39
Fig. 4.4 Variation of liquid limit with increasing percentage of GBFS replacing soil
Fig. 4.5 Variation of specific gravity with increasing percentage of GBFS replacing
soil

40
Fig. 4.6 Plot of maximum dry unit weight Vs water content for lithomargic clay
Fig. 4.7 Plot of maximum dry unit weight Vs water content for lithomargic clay with
25% GBFS replacement
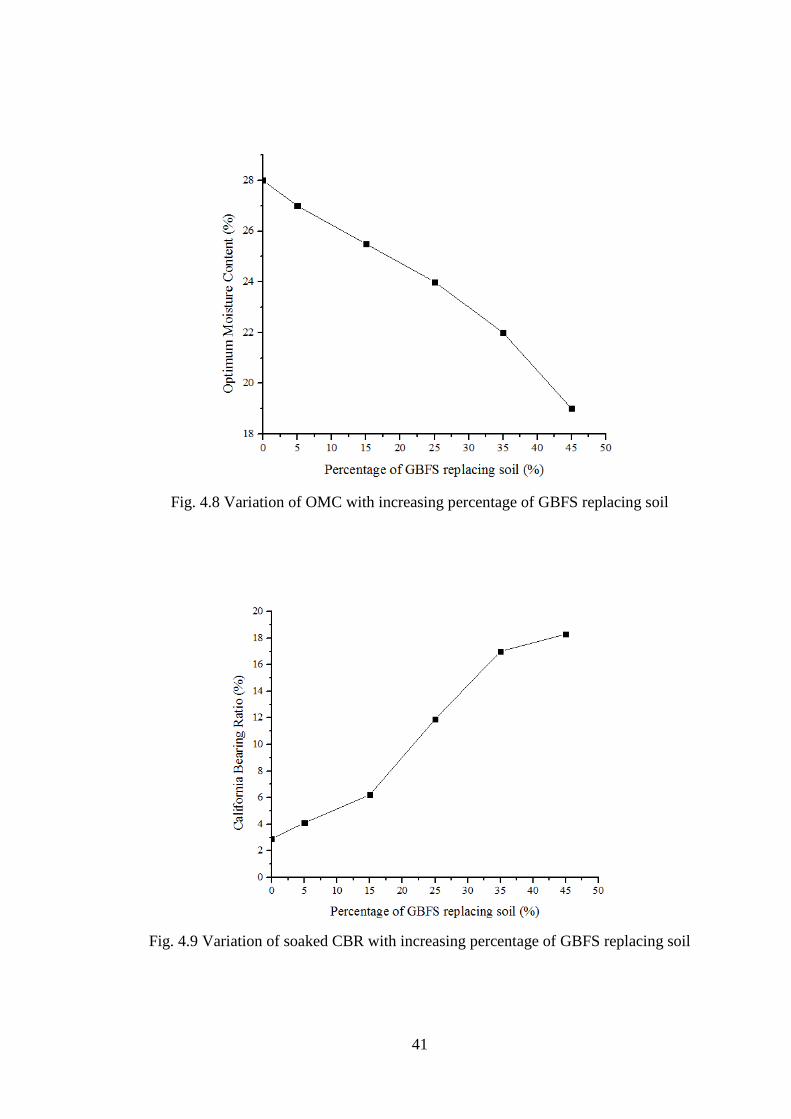
41
Fig. 4.8 Variation of OMC with increasing percentage of GBFS replacing soil
Fig. 4.9 Variation of soaked CBR with increasing percentage of GBFS replacing soil

42
Table 4.4 Variation of UCS with percentage of GBFS replacing soil
Curing
period
UCC Strength(kPa)
Percentage of GBFS replacing soil
0% 5% 15% 25% 35% 45%
0 days 232 249 242 238 211 161
7 days 232 322 334 385 308 252
14 days 232 393 411 523 443 338
28 days 232 581 604 712 638 477
Fig. 4.10 Variation of UCS with increasing percentage of GBFS replacing soil

43
Fig. 4.11 Plot of stress versus strain for lithomargic clay with 25% GBFS replacement
for varying curing periods.
Variation of UCS with different percentage of GBFS replacing soil (for curing period
of 0,7,14 and 28 days) is shown in Table 4.4 and figure 4.10. From figure 4.10, it is
observed that, for immediate testing, there is no significant improvement in UCS value
with the replacement of soil by GBFS up to 25% and for 35% and 45% replacement,
the UCS value decreased considerably. This is due to the fact that, adding a coarser
(non-cohesive) material (GBFS) will reduce the fines content in the soil-GBFS mix and
the strength decreased due to the lack of confinement. With 7 days curing, the strength
increased considerably until 25% replacement. This is due to the occurrence of
pozzolanic reactions like CSH gel formation, caused by soil and slag. At 25% of slag
replacing the soil, the strength increased from 232kPa to 385kPa (increase of 65.9%) at
7 days. Beyond 25% replacement of soil by GBFS, the UCS decreased. A similar trend
was observed for higher period of cured samples (i.e. 14 days and 28 days). This is
because although with increase in GBFS content, the availability of pozzolanic material
increases, the water available for pozzolanic reactions becomes less due to decreasing
water content. The maximum UCS is observed for 25% soil replaced by GBFS which
is 712kPa at 28 days curing period. An increase of 206.9% (232kPa to 712kPa) is

44
observed in UCS at 28 days curing for lithomargic clay replaced by 25% GBFS. Stress-
strain curves for lithomargic clay with 25% GBFS replacement at varying curing
periods are shown in figure 4.11. We can observe that the slope of the stress-strain
curves becomes steeper with increasing curing periods. Thus lithomargic clay replaced
by 25% GBFS is found to be optimized mix.
Table 4.5 Variation of c and φ with increasing percentage of GBFS replacing soil.
Properties obtained from
triaxial UU test
Percentage of GBFS replacing soil
0% 5% 15% 25% 35% 45%
0 days Cohesion cUU
(kPa) 23 22 21 20 19.5 18
0 days
Angle of
internal friction
ϕUU (degrees)
19 20 22 26 27.5 30.5
7 days Cohesion cUU
(kPa) 23 29 43 59 53 42
7 days
Angle of
internal friction
ϕUU (degrees)
19 21 24 27.5 29 32
28 days Cohesion cUU
(kPa) 23 40 61 83 75 64
28 days
Angle of
internal friction
ϕUU (degrees)
19 22.5 26 29 31 33

45
Fig. 4.12 Plot of Mohr circle and failure envelope for lithomargic clay
Fig. 4.13 Plot of Mohr circle and failure envelope for lithomargic clay with 25% GBFS
replacement at 7 days curing period.

46
Fig. 4.14 Plot of Mohr circle and failure envelope for lithomargic clay with 25% GBFS
replacement at 28 days curing period.
Fig. 4.15 Plot of stress versus strain for lithomargic clay with 15% GBFS replacement
for different confining pressures

47
Fig. 4.16 Variation of cohesion with increasing percentage of GBFS replacing soil
Fig. 4.17 Variation of frictional angle with increasing percentage of GBFS replacing
soil.

48
Typical plots of Mohr circle with failure envelope are shown in figures 4.12-4.14. In
addition, a typical plot of stress strain curves is shown in figure 4.15 for lithomargic
clay with 15% GBFS replacement. From the figure 4.16, it is clear that at immediate
testing cohesion reduced with increasing percentage of replacement of soil by GBFS.
However, at 7 days and 28 days cured samples, the cohesion increased up to 25%
replacement of soil by GBFS and further decreased at higher percentages (35% and
45%) of replacement of soil by GBFS. For 7 days cured samples, increase in cohesion
when lithomargic clay is replaced by 25% GBFS is found to be 156.5% (i.e. 23kPa to
59kPa), whereas at 28 days curing, it is 260.9% (23kPa to 83kPa). This is due to the
fact that pozzolanic reactions increase up to 25% and beyond this, the cohesion
decreased because the water required for the hydration of the pozzolanic reactions is
insufficient and hence the reduced reactions. The excess slag particles remains
redundant (Yi et al 2014). From figure 4.17, we can see an increase in the frictional
angle for all the combinations due to pozzolanic reactions. In addition, the granulated
blast furnace slag particles have good interlocking and rough surface, which leads to
the increase in friction angle. At 7 days curing frictional angle increased from 19°to
27.5°when soil is replaced by 25% GBFS and increase is found to be from 19°to 29° for
28 days cured samples.
4.5. GEOTECHNICAL INVESTIGATIONS OF LITHOMARGIC CLAY
BLENDED WITH CEMENT
Cement is universally used admixture to improve the properties of the soil. Cement
stabilization has attained a wider acceptance all over the world. The lithomargic clay
was blended with cement as an additive in which cement was added in different
percentages such as 2%, 4%, 6% and 8% by dry weight of the soil. These soils mixed
with cement were tested to get various geotechnical properties. The summary of the
laboratory test results are presented in Table 4.6 and figures 4.18 - 4.22.

49
Table 4.6 Geotechnical properties of lithomargic clay blended with cement
Sl.
No. Properties
Percentage of cement added to soil
0% 2% 4% 6% 8%
1 Liquid limit wL (%) 47 46 45 43.7 42.4
2 Plastic Limit wp (%) 31 31.5 32.3 33.2 34
3 Plasticity Index Ip (%) 16 14.5 12.7 10.5 8.4
4 Max Dry Unit Weight γd
(kN/m3) 14.2 14.2 14.3 14.4 14.6
5 Optimum Moisture Content
(%) 28 26 26 25.8 25.8
6 Unconfined Compressive
Strength (kPa) 232 343 512 623 779
7 Soaked CBR (%) 2.9 22.4 53.1 65 79
A typical plot of liquid limit determination by Casagrande’s method is shown in figure
4.18. With increase in addition of cement to lithomargic clay, liquid limit reduces and
plastic limit increased thereby reducing the plasticity index of the soil-cement mix
(figure 4.19). There is a reduction in plasticity index by 47.5% (i.e. 16% to 8.4%). A
typical plot of water content versus dry unit weight is shown in figure 4.20. There is
negligible variation in maximum dry unit weight, with increase in cement to the mix.
This is because the proctor test was carried out before the commencement of hydration
reactions. Stress-strain curves for lithomargic clay stabilized with varying percentage
of cement is shown in figure 4.21. From Table 4.6 and figure 4.22, it is observed that
there is an improvement in unconfined compressive strength with increasing percentage
of cement after 7 days curing period. It was observed that as the cement content

50
increased the Young’s modulus increased. The 7 days cured UCS specimens and CBR
test samples showed significant strength improvement with increasing addition of
cement. Addition of 2% cement to lithomargic clay increased the compressive strength
by 47.8% (from 232kPa to 343kPa). Further, at 4% cement addition, UCS increased
from 232kPa to 512kPa (i.e. an improvement by 120.7%). This is due to the cement
hydration, cation exchange, pozzolanic reaction, and carbonation. Hydration process is
a process under which cement reaction takes place. The process starts when cement is
mixed with water and other components for a desired application resulting into
hardening phenomena. Cement hydration is a complex process affected by the presence
of foreign matter or impurities, water cement ratio, curing temperature, specific surface
of the mixture. Calcium silicates, C3S and C2S are the two main cementitious properties
of ordinary Portland cement responsible for strength development. Calcium hydroxide
is another hydration product of Portland cement that further reacts with pozzolanic
materials available in stabilized soil to produce further cementitious material. Ca(OH)2
in the soil water reacts with the silicates and aluminates in the soil to form a soil-cement
mixture known as calcium aluminate silicate hydrate (CASH). As the pozzolanic
reaction progresses, calcium aluminate silicate hydrate (CASH) is slowly converted
into, a crystalline stage to form calcium silicate hydrate (CSH) and calcium aluminum
hydrate (CAH) (Gruskovnjak et al. 2006, Song et al. 2000, Yi et al. 2015, Kolias et al.
2005, Jaritngami et al. 2014, Dermatas and Meng 2003).
In the presence of water, the calcium ions reduce the thickness of double diffused layer
through cation exchange and flocculation-agglomeration reactions. This is primarily
responsible for improvement in workability through reduction of adsorbed water and
decrease in plasticity index. In long-term, pozzolanic reactions occur between the
calcium ions of the stabilizer and the silica and alumina of the clay minerals resulting
in the formation of cementitious products. The reactions can be written as:
Ca(OH) 2 (ionization of lime) → Ca2+ + 2(OH)-
Ca2+ + OH- + SiO2 (soluble clay silica) → Calcium-Silicate-Hydrate (C-S-H)
Ca2+ + OH- +Al2O3 (soluble clay alumina) → Calcium-Aluminate-Hydrate (C-A-H)

51
These reactions contribute to the reduced plasticity and increase in shear strength
properties
Fig. 4.18 Plot of water content versus no. of blows for lithomargic clay with 4% cement.

52
Fig. 4.19 Variation of plasticity index with increasing percentage of cement added.
Fig. 4.20 Plot of dry unit weight versus water content for lithomargic clay with 4%
cement.

53
Fig.4.21 Plot of stress versus strain for lithomargic clay with varying cement content
Fig. 4.22 Variation of UCS with different percentage of cement for 7 days curing period

54
4.6 EFFECT OF GBFS AND CEMENT ON PROPERTIES OF LITHOMARGIC
CLAY
Triaxial compression tests and unconfined compression tests were conducted on 75%
soil + 25% GBFS mix by adding 2% and 4% cement. Table 4.7 shows the variation of
cohesion, frictional angle and UCS with the addition of 2% and 4% cement to the
optimized combination of soil replaced with 25% GBFS for 7 and 28 days curing.
Table 4.7 Variation of shear strength parameters with different percentage of cement to
optimized mix.
Curing
days
Shear strength
parameters from
triaxial UU test
75% soil + 25% GBFS + varying percentage of
cement
0% cement 2% cement 4% cement
7 days Cohesion cUU (kPa) 59 219 343
7 days Angle of internal
friction ϕUU
(degrees)
27.5 40 42
7 days UCS (kPa) 385 656 932
28 days Cohesion cUU (kPa) 83 246 383
28 days Angle of internal
friction ϕUU
(degrees)
29 42 43
28 days UCS (kPa) 712 1024 1378

55
Fig. 4.23 Plot of failure envelopes for different stabilized soil combinations
Addition of cement to slag stabilized soils causes the alkalinity to activate and
accelerate the pozzolanic properties. With 4% addition of cement to the soil-GBFS
optimum mix, cohesion and angle of friction values are found to be 343kPa and 42°
respectively at 7 days curing, whereas at 28 days curing, cohesion and angle of friction
values are obtained as 383kPa and 43° respectively. Thus by adding 4% cement to
optimum mix, cohesion increased by 481.3% at 7 days curing (from 59kPa to 343kPa)
and by 361% at 28 days curing (from 83kPa to383kPa). The friction angle also
increased by 52.7% at 7 days curing (from 27.5° to 42°) and 48.2% at 28 days curing
(from 29° to 43°) at 4% addition to the optimum GBFS mix. Similarly, at 7 days curing
UCS increased from 385kPa to 932kPa for 4% cement addition whereas for the same
combination increase is found to be from 712kPa to 1378kPa at 28 days curing. The
strength gain with cement to the optimized GBFS mix is due to the self hydration of
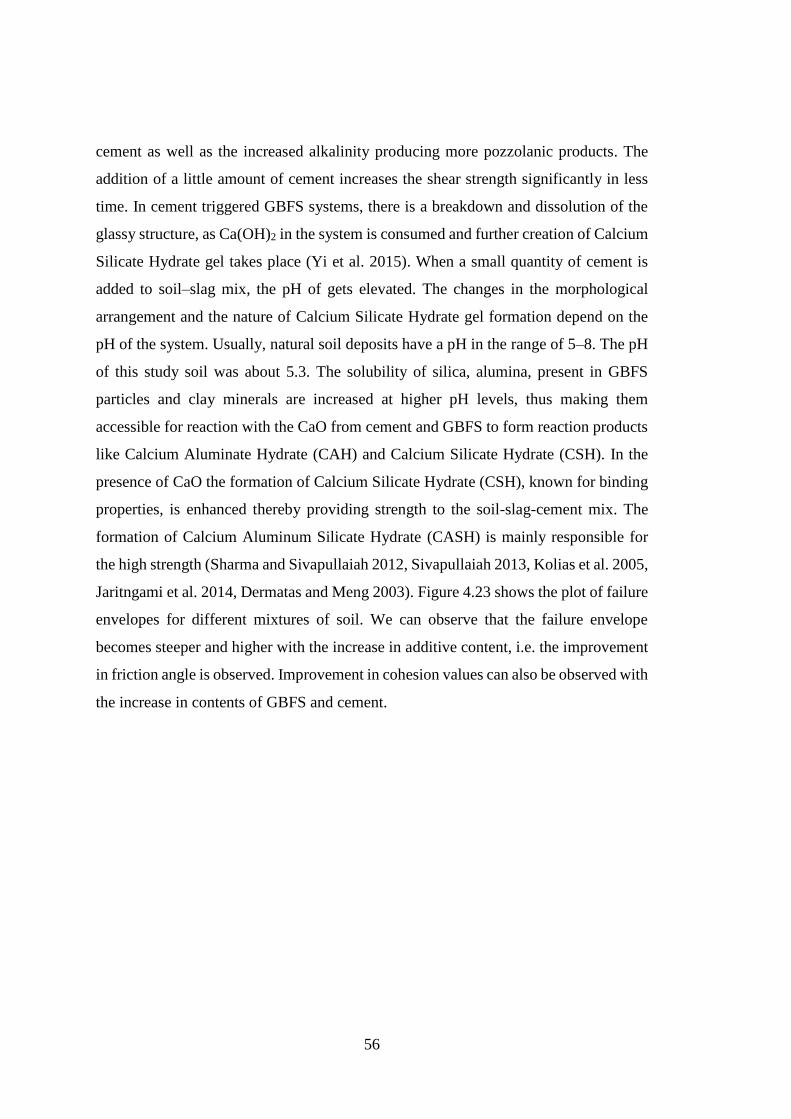
56
cement as well as the increased alkalinity producing more pozzolanic products. The
addition of a little amount of cement increases the shear strength significantly in less
time. In cement triggered GBFS systems, there is a breakdown and dissolution of the
glassy structure, as Ca(OH)2 in the system is consumed and further creation of Calcium
Silicate Hydrate gel takes place (Yi et al. 2015). When a small quantity of cement is
added to soil–slag mix, the pH of gets elevated. The changes in the morphological
arrangement and the nature of Calcium Silicate Hydrate gel formation depend on the
pH of the system. Usually, natural soil deposits have a pH in the range of 5–8. The pH
of this study soil was about 5.3. The solubility of silica, alumina, present in GBFS
particles and clay minerals are increased at higher pH levels, thus making them
accessible for reaction with the CaO from cement and GBFS to form reaction products
like Calcium Aluminate Hydrate (CAH) and Calcium Silicate Hydrate (CSH). In the
presence of CaO the formation of Calcium Silicate Hydrate (CSH), known for binding
properties, is enhanced thereby providing strength to the soil-slag-cement mix. The
formation of Calcium Aluminum Silicate Hydrate (CASH) is mainly responsible for
the high strength (Sharma and Sivapullaiah 2012, Sivapullaiah 2013, Kolias et al. 2005,
Jaritngami et al. 2014, Dermatas and Meng 2003). Figure 4.23 shows the plot of failure
envelopes for different mixtures of soil. We can observe that the failure envelope
becomes steeper and higher with the increase in additive content, i.e. the improvement
in friction angle is observed. Improvement in cohesion values can also be observed with
the increase in contents of GBFS and cement.

57
CHAPTER 5
MICROSTRUCTURAL INVESTIGATIONS ON STABILIZED
LITHOMARGIC CLAY
5.1 INTRODUCTION
There is good improvement in strength of lithomargic clay due to the replacement of
soil by granulated blast furnace slag (GBFS) with/without addition of cement. The
strength improvements are due to the production of hydraulic and pozzolanic
compounds. The type and amount of compounds formed vary which also lead to
microstructural changes. An attempt has been made in this chapter to identify the new
compounds formed and consequent changes in the structure of the soil.
5.2 X-RAY DIFFRACTION ANALYSIS
One of the very well established methods for mineralogical characterization of fine-
grained soils is by X-ray diffraction (XRD) analysis. Majority of the soil minerals are
crystalline in nature and their structure is defined by a unique geometry. XRD identifies
minerals based on this unique crystal structure. In XRD, characteristic X-rays of
particular wave length are passed through a crystallographic specimen. When X-rays
strike a crystal, they penetrate to a depth of several million layers before being
absorbed. At each atomic plane a minute portion of the beam is absorbed by individual
atoms and which oscillates as dipoles and radiate waves in all directions. When X-ray
interacts with crystalline specimen, it gives a particular diffraction pattern, which is
unique for a mineral with a particular crystal structure. The diffraction pattern of the
soil specimen (according to its crystal structure), which is based on powder diffraction
or polycrystalline diffraction, is then analyzed for the qualitative and quantitative
assessment of minerals.
The small size of most soil particles prevents the study of single crystals and hence
powder method is used. In the powder method, a small sample containing particles at
all possible orientations is placed in a collimated beam of parallel X-rays and diffracted

58
beams of various intensities are scanned by a Geiger, proportional, or scintillation tube
and recorded automatically to produce a chart showing the intensity of diffracted beam
as a function of range 2 Theta (2θ).
Fig. 5.1 X-ray diffraction spectrum for lithomargic clay (soil)
Fig. 5.2 XRD spectrum for 85% soil + 15% GBFS mix at 7 days curing

59
Fig. 5.3 XRD spectrum for 85% soil + 15% GBFS mix at 28 days curing
Fig. 5.4 XRD spectrum for 75% soil + 25% GBFS mix at 7 days curing
Fig. 5.5 XRD spectrum for 75% soil + 25% GBFS mix at 28 days curing

60
Fig. 5.6 XRD spectrum for 65% soil + 35% GBFS mix at 7 days curing
Fig. 5.7 XRD spectrum for 65% soil + 35% GBFS mix at 28 days curing
Fig. 5.8 XRD spectrum for 75% soil + 25% GBFS mix with addition of 2% cement at
7 days curing
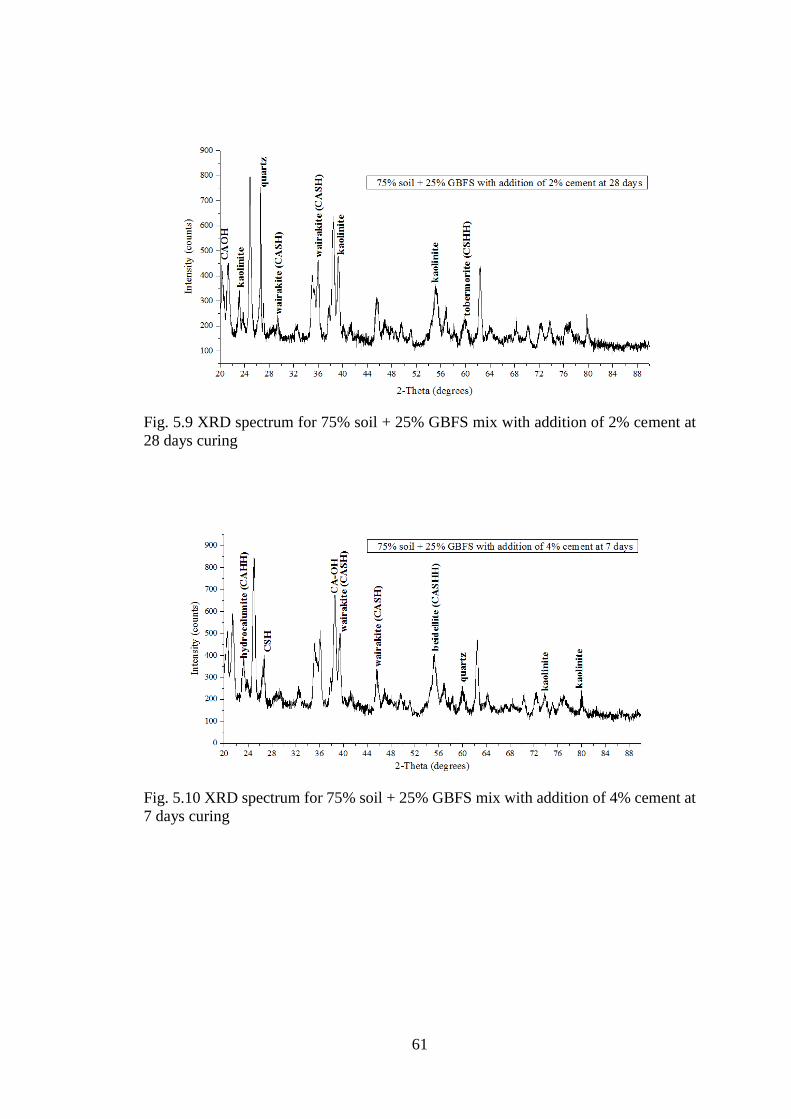
61
Fig. 5.9 XRD spectrum for 75% soil + 25% GBFS mix with addition of 2% cement at
28 days curing
Fig. 5.10 XRD spectrum for 75% soil + 25% GBFS mix with addition of 4% cement at
7 days curing

62
Fig. 5.11 XRD spectrum for 75% soil + 25% GBFS with addition of 4% cement at 28
days curing
Powder X-ray diffraction (XRD) tests were carried out through an X-ray diffractometer,
Rigaku Miniflex 600 XRD analyzer or X-ray diffratometer (40Kv, 15mA) with Cu Kα
radiation were used for the study. The instrument was based on the Bragg-Brentano
geometry. X-Ray Diffraction analysis is done for lithomargic clay and stabilized
lithomargic clay to know the effect of stabilization. Lithomargic clay samples stabilized
with various percentage of GBFS with/without the addition of cement were subjected
to XRD analysis. Samples cured for 7 and 28 days were taken and pulverised, passed
through 75 microns IS sieve and powder samples were oven dried at 110°C for 24 hours
and subjected to XRD analysis. Soil specimens were placed onto the X-ray
diffractometer, and the readings were recorded for 2θ angle from 20◦ to 90◦, and at an
angular speed of 2°/min with a step size of 0.02. Data obtained are shown in figures.
5.1-5.11. The mineralogical analysis of the stabilized soil is very important to determine
the changes in the mineralogical phases due to pozzolanic reactions. These reactions
depend on the chemical and the mineralogical composition of each soil and the
additives. The changes in micro structural development of soils due to addition of
additives play a significant role in the geotechnical properties and the mechanical
behavior of these stabilized soils.
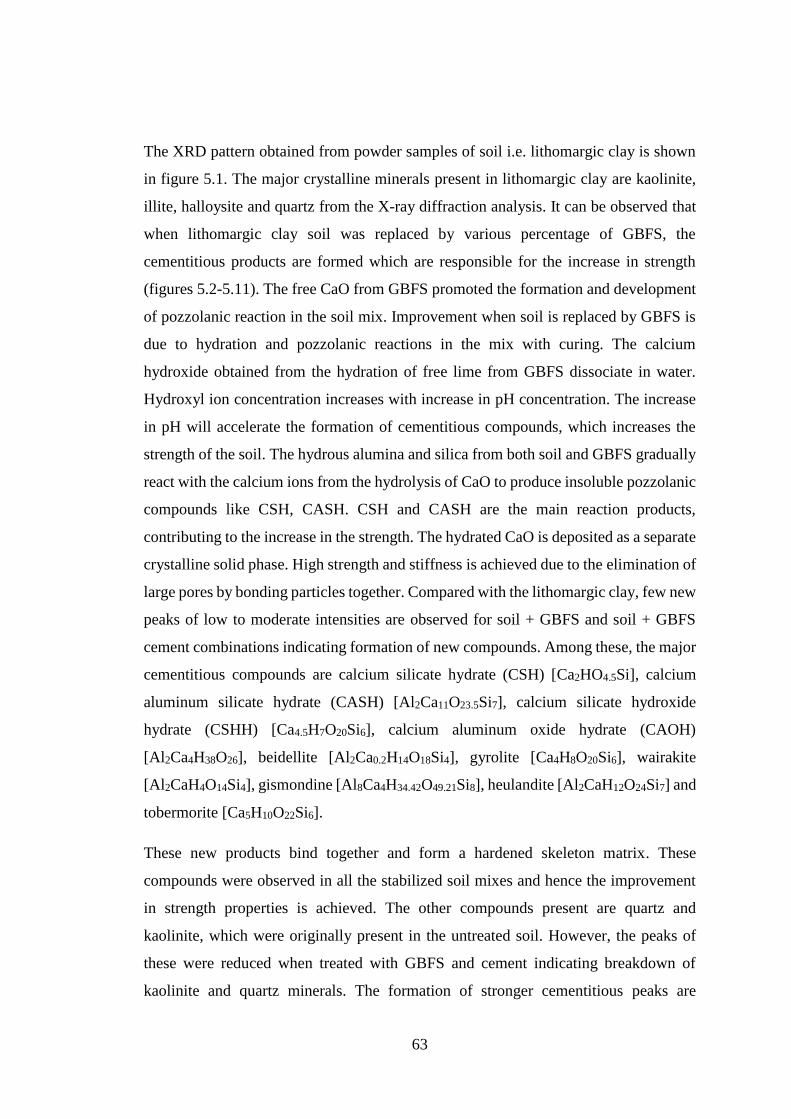
63
The XRD pattern obtained from powder samples of soil i.e. lithomargic clay is shown
in figure 5.1. The major crystalline minerals present in lithomargic clay are kaolinite,
illite, halloysite and quartz from the X-ray diffraction analysis. It can be observed that
when lithomargic clay soil was replaced by various percentage of GBFS, the
cementitious products are formed which are responsible for the increase in strength
(figures 5.2-5.11). The free CaO from GBFS promoted the formation and development
of pozzolanic reaction in the soil mix. Improvement when soil is replaced by GBFS is
due to hydration and pozzolanic reactions in the mix with curing. The calcium
hydroxide obtained from the hydration of free lime from GBFS dissociate in water.
Hydroxyl ion concentration increases with increase in pH concentration. The increase
in pH will accelerate the formation of cementitious compounds, which increases the
strength of the soil. The hydrous alumina and silica from both soil and GBFS gradually
react with the calcium ions from the hydrolysis of CaO to produce insoluble pozzolanic
compounds like CSH, CASH. CSH and CASH are the main reaction products,
contributing to the increase in the strength. The hydrated CaO is deposited as a separate
crystalline solid phase. High strength and stiffness is achieved due to the elimination of
large pores by bonding particles together. Compared with the lithomargic clay, few new
peaks of low to moderate intensities are observed for soil + GBFS and soil + GBFS
cement combinations indicating formation of new compounds. Among these, the major
cementitious compounds are calcium silicate hydrate (CSH) [Ca2HO4.5Si], calcium
aluminum silicate hydrate (CASH) [Al2Ca11O23.5Si7], calcium silicate hydroxide
hydrate (CSHH) [Ca4.5H7O20Si6], calcium aluminum oxide hydrate (CAOH)
[Al2Ca4H38O26], beidellite [Al2Ca0.2H14O18Si4], gyrolite [Ca4H8O20Si6], wairakite
[Al2CaH4O14Si4], gismondine [Al8Ca4H34.42O49.21Si8], heulandite [Al2CaH12O24Si7] and
tobermorite [Ca5H10O22Si6].
These new products bind together and form a hardened skeleton matrix. These
compounds were observed in all the stabilized soil mixes and hence the improvement
in strength properties is achieved. The other compounds present are quartz and
kaolinite, which were originally present in the untreated soil. However, the peaks of
these were reduced when treated with GBFS and cement indicating breakdown of
kaolinite and quartz minerals. The formation of stronger cementitious peaks are

64
observed more clearly with addition of cement. The intensity of peaks related with
cementitious compounds appear broader with increase in curing periods.
The hydration and pozzolanic reactions occur at all percentages of replacement.
However, at 25% replacement of soil by GBFS, UCS was found to be maximum. At
lower percentages of replacement i.e. 15%, the dissolution of alumina and silica from
the slag-soil mix is slightly less (figure 5.2). Thus, only few compounds like
gismondine, gyrolite and CSHH are observed which resulted in little improvement in
strength. At 25% replacement, the dissolution of alumina and silica is complete and
hence all the ions participate in the hydration and pozzolanic reactions. The maximum
strength is justified with the formation of gyrolite, hydrocalumite, tobermorite,
beidellite and CAOH compounds (figure 5.4). At higher percentage of replacement i.e.
35%, the moulding water that is available for the hydration and pozzolanic reactions is
less and the excess CaO remains redundant. This was observed with the occurrence of
portlandite [Ca(OH)2] (figure 5.6). Thus, the voids are filled by the unhydrated slag
particles, which reduced the strength of the soil matrix.
5.3 SCANNING ELECTRON MICROSCOPY ANALYSIS
The Scanning Electron Microscope (SEM) is one of the most versatile instrument used
to study the microstructure of soil particles. Secondary electrons are emitted from a
sample surface and it appears as three-dimensional images. The SEM has x20 to
x150, 000 magnification range and depth of field 300 times greater than that of the light
microscope. In SEM, the sample is being irradiated with an electron beam and the
electrons that are being emitted, scatter electrons from the sample under analysis.
Moreover, by looking at these scattered electrons, by gathering them and subjecting
them to appropriate analysis, we can get an idea about the topography of the surface.
This has led to extensive use of SEM for the study of clay particles. SEM can provide
shape analysis, size analysis, and texture of the specimens. The Scanning Electronic
Microscope (SEM) study along with EDS (Energy Dispersive Spectroscope) can
display all the elements present in the specimen as they are being collected and enables
to perform rapid identification. It enables the composition of the specimen to be
determined to an overall accuracy of about 99% and detection sensitivity down to 0.1%

65
by weight. A semiconductor material is used to detect the X-rays together with
processing to analyze the spectrum. The energy dispersive spectroscope (EDS) analysis
indicates the elements present in the soil samples which involves in the hydration and
pozzolanic reactions.
Samples are prepared to their maximum dry density and OMC, cured for 7 and 28 days
and subjected to SEM. Lithomargic clay and stabilized lithomargic clay are observed
under microscope to magnification of 200x to 3000x, i.e. up to 3-micron level. The
changes in texture and morphology are analyzed. Pieces of soil samples, sliced from
the central region of the post-test specimen, were oven-dried. The dried soil samples
were mounted in phenolic resin base and were coated with a thin layer of gold palladium
to provide surface conductivity. The specimens thus prepared were placed in an SEM
instrument and the photomicrographs were generated. Scanning electron microscope
images show that, there is formation of various new compounds when lithomargic clay
is stabilized using GBFS and cement.
Fig. 5.12 SEM image and EDS micrograph of lithomargic clay (soil)

66
Fig. 5.13 SEM image and EDS micrograph of 85% soil + 15% GBFS mix at 7 days
curing.
Fig. 5.14 SEM image and EDS micrograph of 85% soil + 15% GBFS mix at 28 days
curing.

67
Fig. 5.15 SEM image and EDS micrograph of 75% soil + 25% GBFS mix at 7 days
curing.
Fig. 5.16 SEM image and EDS micrograph of 75% soil + 25% GBFS mix at 28 days
curing.

68
Fig. 5.17 SEM image and EDS micrograph of 65% soil + 35% GBFS mix at 7 days
curing.
Fig. 5.18 SEM image and EDS micrograph of 65% soil + 35% GBFS mix at 28 days
curing.

69
Fig. 5.19 SEM image and EDS micrograph of 75% soil + 25% GBFS mix with addition
of 2% cement at 7 days curing.
Fig. 5.20 SEM image and EDS micrograph of 75% soil + 25% GBFS mix with addition
of 2% cement at 28 days curing.

70
Fig. 5.21 SEM image and EDS micrograph of 75% soil + 25% GBFS mix with addition
of 4% cement at 7 days curing.
Fig. 5.22 SEM image and EDS micrograph of 75% soil + 25% GBFS mix with addition
of 4% cement at 28 days curing.
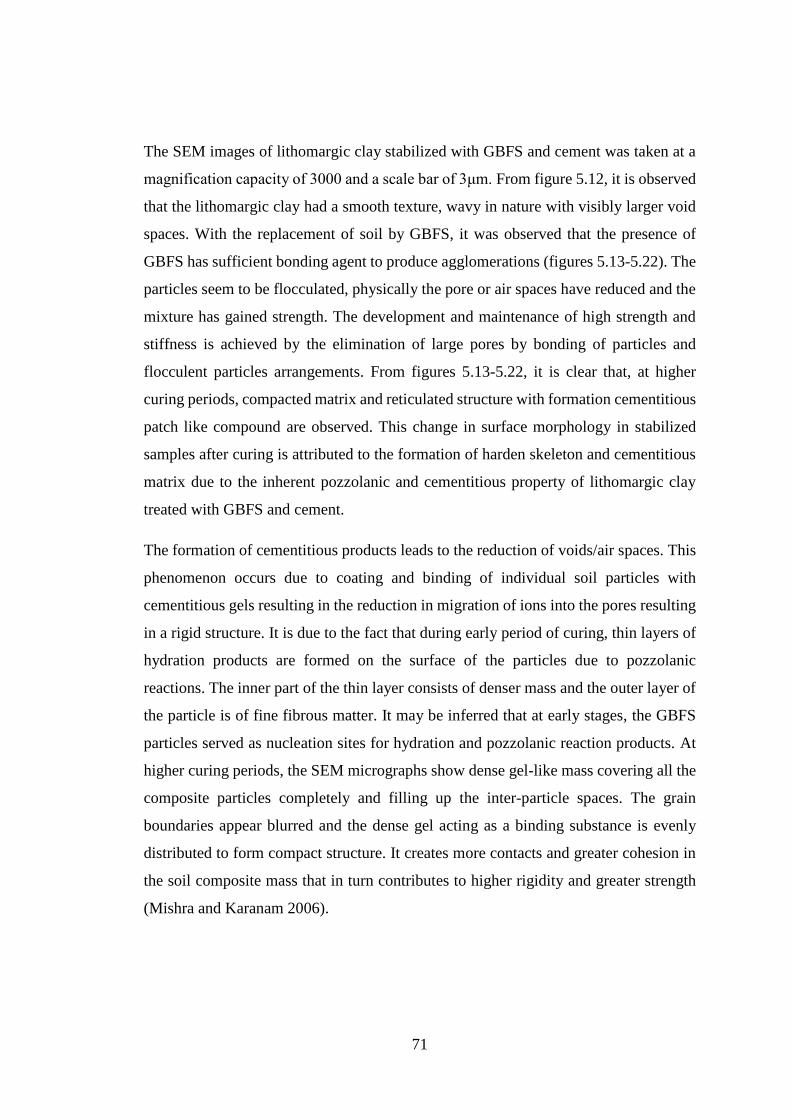
71
The SEM images of lithomargic clay stabilized with GBFS and cement was taken at a
magnification capacity of 3000 and a scale bar of 3μm. From figure 5.12, it is observed
that the lithomargic clay had a smooth texture, wavy in nature with visibly larger void
spaces. With the replacement of soil by GBFS, it was observed that the presence of
GBFS has sufficient bonding agent to produce agglomerations (figures 5.13-5.22). The
particles seem to be flocculated, physically the pore or air spaces have reduced and the
mixture has gained strength. The development and maintenance of high strength and
stiffness is achieved by the elimination of large pores by bonding of particles and
flocculent particles arrangements. From figures 5.13-5.22, it is clear that, at higher
curing periods, compacted matrix and reticulated structure with formation cementitious
patch like compound are observed. This change in surface morphology in stabilized
samples after curing is attributed to the formation of harden skeleton and cementitious
matrix due to the inherent pozzolanic and cementitious property of lithomargic clay
treated with GBFS and cement.
The formation of cementitious products leads to the reduction of voids/air spaces. This
phenomenon occurs due to coating and binding of individual soil particles with
cementitious gels resulting in the reduction in migration of ions into the pores resulting
in a rigid structure. It is due to the fact that during early period of curing, thin layers of
hydration products are formed on the surface of the particles due to pozzolanic
reactions. The inner part of the thin layer consists of denser mass and the outer layer of
the particle is of fine fibrous matter. It may be inferred that at early stages, the GBFS
particles served as nucleation sites for hydration and pozzolanic reaction products. At
higher curing periods, the SEM micrographs show dense gel-like mass covering all the
composite particles completely and filling up the inter-particle spaces. The grain
boundaries appear blurred and the dense gel acting as a binding substance is evenly
distributed to form compact structure. It creates more contacts and greater cohesion in
the soil composite mass that in turn contributes to higher rigidity and greater strength
(Mishra and Karanam 2006).
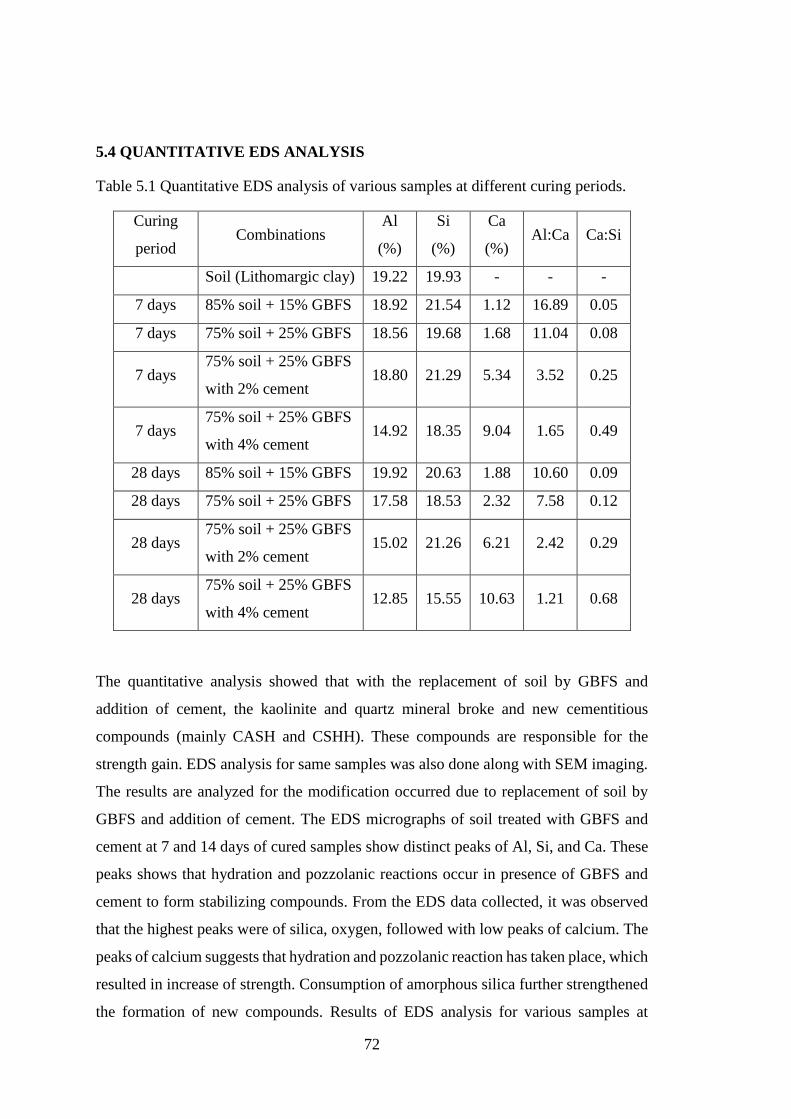
72
5.4 QUANTITATIVE EDS ANALYSIS
Table 5.1 Quantitative EDS analysis of various samples at different curing periods.
Curing
period Combinations
Al
(%)
Si
(%)
Ca
(%) Al:Ca Ca:Si
Soil (Lithomargic clay) 19.22 19.93 - - -
7 days 85% soil + 15% GBFS 18.92 21.54 1.12 16.89 0.05
7 days 75% soil + 25% GBFS 18.56 19.68 1.68 11.04 0.08
7 days 75% soil + 25% GBFS
with 2% cement 18.80 21.29 5.34 3.52 0.25
7 days 75% soil + 25% GBFS
with 4% cement 14.92 18.35 9.04 1.65 0.49
28 days 85% soil + 15% GBFS 19.92 20.63 1.88 10.60 0.09
28 days 75% soil + 25% GBFS 17.58 18.53 2.32 7.58 0.12
28 days 75% soil + 25% GBFS
with 2% cement 15.02 21.26 6.21 2.42 0.29
28 days 75% soil + 25% GBFS
with 4% cement 12.85 15.55 10.63 1.21 0.68
The quantitative analysis showed that with the replacement of soil by GBFS and
addition of cement, the kaolinite and quartz mineral broke and new cementitious
compounds (mainly CASH and CSHH). These compounds are responsible for the
strength gain. EDS analysis for same samples was also done along with SEM imaging.
The results are analyzed for the modification occurred due to replacement of soil by
GBFS and addition of cement. The EDS micrographs of soil treated with GBFS and
cement at 7 and 14 days of cured samples show distinct peaks of Al, Si, and Ca. These
peaks shows that hydration and pozzolanic reactions occur in presence of GBFS and
cement to form stabilizing compounds. From the EDS data collected, it was observed
that the highest peaks were of silica, oxygen, followed with low peaks of calcium. The
peaks of calcium suggests that hydration and pozzolanic reaction has taken place, which
resulted in increase of strength. Consumption of amorphous silica further strengthened
the formation of new compounds. Results of EDS analysis for various samples at

73
different curing periods are presented in Table 5.1. From Table 5.1, it is observed that
there is increase in Ca and decrease in Al for soil stabilized with GBFS and cement at
28 days curing. It confirms the formation of more cementitious compounds with slow
process of pozzolanic reaction [CSH and CAH]. These are responsible for increase in
strength. From the EDS micrographs, it is observed that the intensity peaks of Ca, S, Al
and O become relatively stronger with increase in curing period. Increase in the ratio
of Ca:Si with cement content and curing period may be attributed to the formation of
pozzolanic reaction products (Jha and Sivapullaiah 2014).
The percentage of Ca increases with the increase in GBFS and cement content,
furthermore with increase in curing period. The ratios of Al:Ca and Ca:Si brought out
the changes in the composition of particle surfaces due to coating of new
minerals/compounds formed due to reactions that occur between the soil particles and
additives. Strength improvement due to pozzolanic reactions is achieved with increase
in Ca:Si and decrease in Al:Ca ratios (Table 5.1). Moreover, the increase in calcium
percentage in soil stabilized with GBFS and cement confirms that role of C2S and C3S
is more pronounced.

74

75
CHAPTER 6
TYPICAL STUDIES ON APPLICATIONS OF STABILIZED SOIL
USING PLAXIS 2D
6.1 GENERAL
PLAXIS is a finite element software, which covers all aspects and applications of
geotechnical engineering simulation using a user-friendly interface with the power of
finite element. It is intended for 2 Dimensional and 3 Dimensional analysis of
deformation and stability of soil structures, as well as groundwater and heat flow, in
geo-engineering applications such as excavations, foundations, embankments and
tunnels.
PLAXIS 2D is a two-dimensional finite element program, developed for the analysis
of deformation, stability and groundwater flow in geotechnical engineering. The simple
graphical input procedures enable a quick generation of complex finite element models
and the enhanced output facilities provide a detailed presentation of computational
results. Geotechnical applications require advanced constitutive models for the
simulation of the non-linear, time dependent and anisotropic behaviour of soils and
rock. Special procedures are required to deal with hydrostatic and non hydrostatic pore
pressure in the soil since it is a multiphase material. PLAXIS is equipped with features
to deal with various aspects of complex geotechnical structures.
Laboratory test results obtained for lithomargic clay, lithomargic clay stabilized with
GBFS and lithomargic clay stabilized using GBFS and cement are applied to following
two typical cases using PLAXIS 2D.
i. Load settlement analyses of strip footings resting on lithomargic clay and
stabilized lithomargic clay.
ii. Stability analyses of embankment slopes (soon after construction-UU
condition).
76
Features of PLAXIS program, results obtained from load settlement analysis of strip
footing and stability analysis of embankment slopes are discussed in the subsequent
sections.
6.2. OVERVIEW OF THE ANALYSIS PROGRAM
The basic concept of finite element analysis is that a complicated model of a body or
structure is divided into a number of smaller elements. These elements are then
connected by nodes. By solving the values at the nodes the stresses and strains in every
element can be calculated. In PLAXIS 2D real situations may be modelled either by a
plane strain or an axisymmetric model. To carry out a finite element analysis, the user
has to create a two dimensional geometry model composed of points, lines and other
components in the X-Y plane and specify the material properties and boundary
conditions. The geometry of the model can be easily defined in the soil and structures
modes. When the geometry modelling process is complete, user can proceed with the
calculations. This consists of generation of mesh and definition of the construction
stages. The staged construction mode allows for simulation of construction and
excavation processes by activating and deactivating soil clusters and structural objects.
Finite element calculations can be divided into several sequential calculation phases.
When the calculation phases have been defined and points for curves have been
selected, then the calculation process can be executed. When it gets finished, the
calculation list is updated. An extensive range of facilities exists within the PLAXIS
2D output programs to display the results of the analysis. The main output quantities of
a finite element calculation are the displacements and the stresses. If the model involves
structural elements, then the structural forces in them are also calculated.
6.3 LOAD-SETTLEMENT ANALYSES OF STRIP FOOTING RESTING ON
LITHOMARGIC CLAY AND ON STABILIZED LITHOMARGIC CLAY
A series of two dimensional finite element analyses on strip footings of different widths
were performed to understand the load settlement behaviour. The analyses were
performed using the finite element program PLAXIS 2D software package.

77
The load settlement analyses of lithomargic clay, stabilized lithomargic clay with
different percentages of granulated blast furnace slag (GBFS) replacing the soil and a
combination of soil-GBFS and cement was performed made for strip footings of width
1 m, 1.5 m and 2 m.
Details of the footing:
Width of the footing – 1 m, 1.5 m and 2 m
Depth of footing – 1.2 m below GL
Thickness of footing – 0.6 m
Footing properties:
Modulus of elasticity (E) – 2.2 x 10⁷ kPa
Poisson’s ratio (µ) – 0.15
Unit weight (γ) – 25 kN/m3
The properties of the lithomargic clay and the stabilized soil (with different percentages
of GBFS and GBFS-cement combination) that were used as input in the analyses are
shown in Table 6.1.
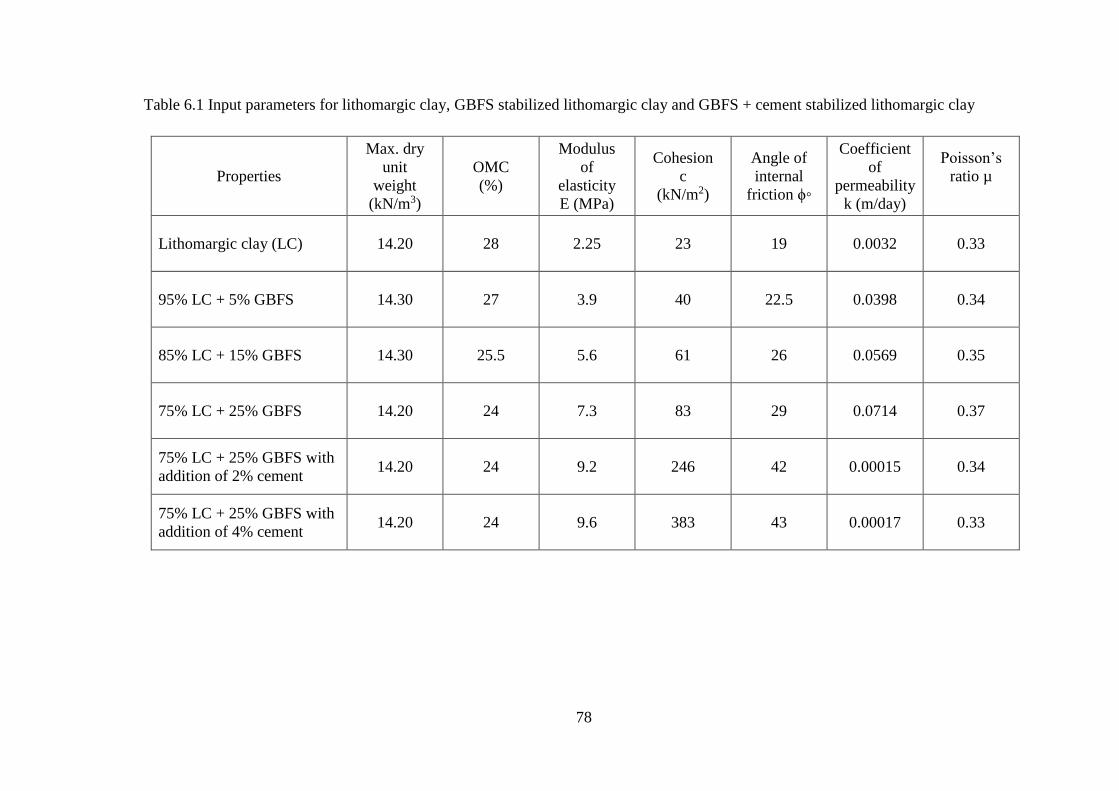
78
Table 6.1 Input parameters for lithomargic clay, GBFS stabilized lithomargic clay and GBFS + cement stabilized lithomargic clay
Properties
Max. dry
unit
weight
(kN/m3)
OMC
(%)
Modulus
of
elasticity
E (MPa)
Cohesion
c
(kN/m2)
Angle of
internal
friction ϕ◦
Coefficient
of
permeability
k (m/day)
Poisson’s
ratio µ
Lithomargic clay (LC) 14.20 28 2.25 23 19 0.0032 0.33
95% LC + 5% GBFS 14.30 27 3.9 40 22.5 0.0398 0.34
85% LC + 15% GBFS 14.30 25.5 5.6 61 26 0.0569 0.35
75% LC + 25% GBFS 14.20 24 7.3 83 29 0.0714 0.37
75% LC + 25% GBFS with
addition of 2% cement 14.20 24 9.2 246 42 0.00015 0.34
75% LC + 25% GBFS with
addition of 4% cement 14.20 24 9.6 383 43 0.00017 0.33

79
6.3.1 Steps followed for settlement analyses of strip footing resting on lithomargic
clay and stabilized lithomargic clay using PLAXIS 2D
Step 1: In the new window of PLAXIS 2D a suitable project title and description is to
be give followed by defining the geometry of footing to be modelled. In this particular
study, the geometry of 8B width and -4B depth is fixed on observing no considerable
changes in the settlement after running few trial settlement analyses (figure 6.1).
Step 2: A bore hole is placed in the model which enables to define the soil properties
like unit weight, permeability, modulus of elasticity and shear strength parameters (c
and ϕ). Total depth of the soil model (4B) is also defined in the bore hole.
Step 3: Strip footing of 0.6 m thickness is placed at -1.2m depth and concrete properties
are assigned to it.
Step 4: A uniformly distributed load is placed on the footing.
Step 5: 2D meshes are generated.
Fig. 6.1 Finite element model for 2m wide (B=2m) strip footing on lithomargic clay
Step 6 (Calculation Phase): The applied soil and concrete properties and loadings are
activated as follows:
Phase 1: Excavation- By default a soil layer will be activated above the footing placed
at -1.2m. Hence the soil layer above the footing is turned off to deactivate it.
Phase 2: The footing is activated. Then the load intensity is activated and a load
intensity of 10kPa is applied.

80
Step 7: Calculations are started.
Step 8: In the output tab, the settlement values are shown with a figure showing the
settlement contours.
Step 9: Step 6 is repeated with increased loading intensity of 50kPa, 100kPa, 150kPa,
etc. up to 400kPa and the corresponding settlements are found out.
Fig. 6.2 Typical output showing deformed mesh.
Fig. 6.3 Typical output showing settlement contours.
Typical output showing deformed mesh and settlement contours are shown in figure
6.2 and figure 6.3 respectively.
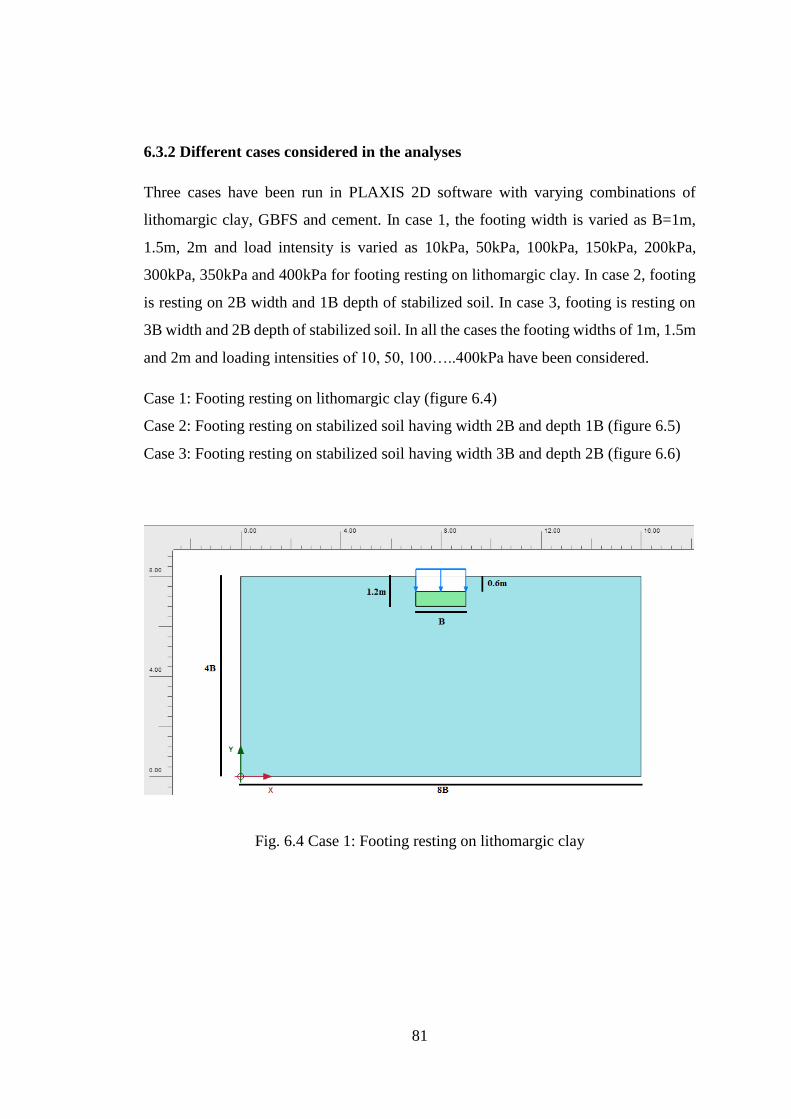
81
6.3.2 Different cases considered in the analyses
Three cases have been run in PLAXIS 2D software with varying combinations of
lithomargic clay, GBFS and cement. In case 1, the footing width is varied as B=1m,
1.5m, 2m and load intensity is varied as 10kPa, 50kPa, 100kPa, 150kPa, 200kPa,
300kPa, 350kPa and 400kPa for footing resting on lithomargic clay. In case 2, footing
is resting on 2B width and 1B depth of stabilized soil. In case 3, footing is resting on
3B width and 2B depth of stabilized soil. In all the cases the footing widths of 1m, 1.5m
and 2m and loading intensities of 10, 50, 100…..400kPa have been considered.
Case 1: Footing resting on lithomargic clay (figure 6.4)
Case 2: Footing resting on stabilized soil having width 2B and depth 1B (figure 6.5)
Case 3: Footing resting on stabilized soil having width 3B and depth 2B (figure 6.6)
Fig. 6.4 Case 1: Footing resting on lithomargic clay

82
Fig. 6.5 Case 2: Footing resting on stabilized soil having width 2B and depth 1B
Fig. 6.6 Case 3: Footing resting on stabilized soil having width 3B and depth 2B

83
Case 1: Load settlement behaviour of strip footing resting on lithomargic clay
The results of the load-settlement analyses for 1m, 1.5m and 2m wide strip footing
resting on lithomargic clay as obtained from the PLAXIS 2D software are presented in
Table 6.2and figure 6.7. From the figure 6.7, it is clear that, with the increase in width
of the footing the settlement increases. In addition, the settlement increases with the
increase in load intensities. For load intensity of 200kPa, settlement for 1m wide strip
footing is 77.38mm, which increases to 167.4mm for footing width of 2m (increase of
116.3%).
Table 6.2 Settlement of strip footings of different widths resting on lithomargic clay
Load intensity
(kPa)
Settlement (mm)
1m wide strip
footing
1.5m wide strip
footing
2m wide strip
footing
10 5.32 6.28 7.59
50 14.94 20.10 22.80
100 26.71 32.43 41.51
150 40.90 57.81 76.41
200 77.38 121.80 167.40
250 165.90 295.00 428.50

84
Fig. 6.7 Settlement vs load intensity for 1m, 1.5m and 2m wide strip footing resting on
lithomargic clay.
Case 2: Load settlement behaviour of strip footing resting on stabilized soil of
width 2B and depth 1B considering various soil mixtures
PLAXIS 2D analyses were carried out for width of footing 1m, considering 95% soil +
5% GBFS, 85% soil + 15% GBFS, 75% soil + 25% GBFS, 75% soil + 25% GBFS with
addition of 2% cement and 75% soil + 25% GBFS with addition of 4% cement. Results
are provided in Table 6.3 for B=1m. Figure 6.8 shows the graphical representation of
load settlement response (B=1m).
From Table 6.3 and figure 6.8, it is observed that with the increase in load intensities,
the settlement increases for lithomargic clay. Upon stabilization with GBFS and cement
the settlement decreases. For a particular load intensity of 200kPa, settlement for
footing on lithomargic clay is 77.38mm which reduces to 37.6mm when soil is replaced
by 25% GBFS. Reduction in settlement is 51.4%. On addition of 4% cement to the
same 75% soil + 25% GBFS mix, settlement reduced to 28.93mm (total reduction of
62.6%). Similar trends are observed for all load intensities and for all mixes. For footing
width of 1.5m, Table 6.4 and figure 6.9 and for footing width of 2m, Table 6.5 and
figure 6.10 shows results obtained from similar analyses.
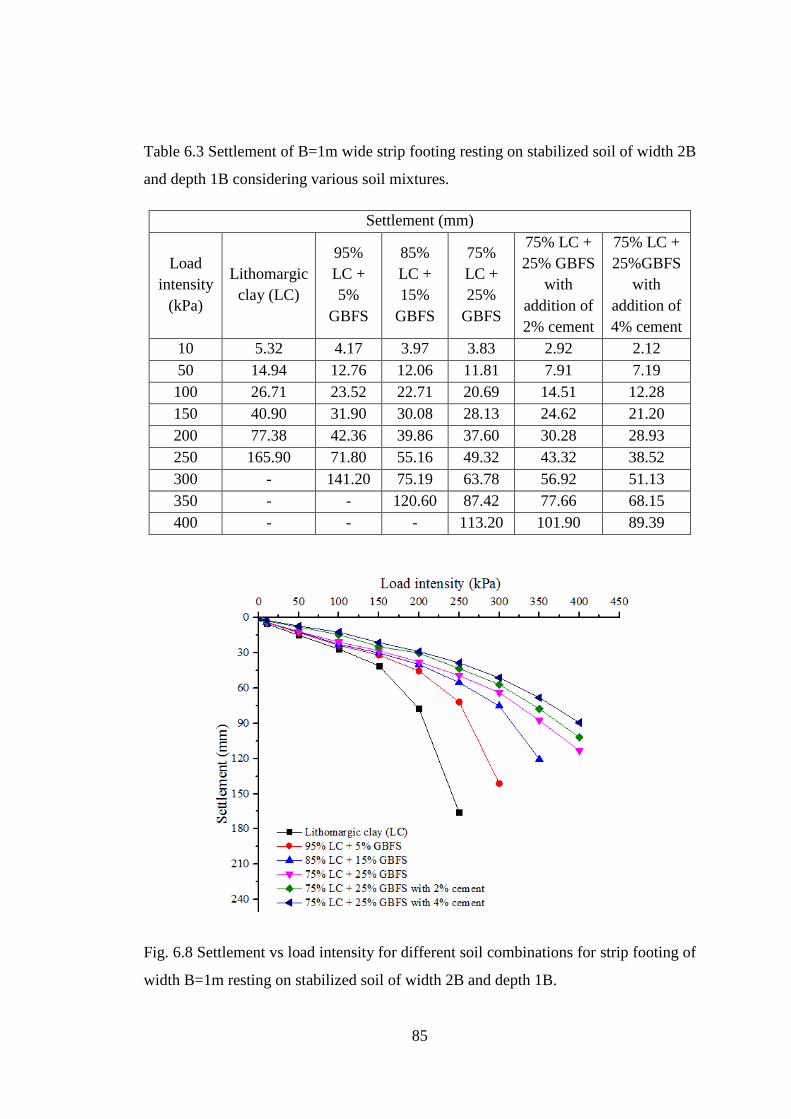
85
Table 6.3 Settlement of B=1m wide strip footing resting on stabilized soil of width 2B
and depth 1B considering various soil mixtures.
Settlement (mm)
Load
intensity
(kPa)
Lithomargic
clay (LC)
95%
LC +
5%
GBFS
85%
LC +
15%
GBFS
75%
LC +
25%
GBFS
75% LC +
25% GBFS
with
addition of
2% cement
75% LC +
25%GBFS
with
addition of
4% cement
10 5.32 4.17 3.97 3.83 2.92 2.12
50 14.94 12.76 12.06 11.81 7.91 7.19
100 26.71 23.52 22.71 20.69 14.51 12.28
150 40.90 31.90 30.08 28.13 24.62 21.20
200 77.38 42.36 39.86 37.60 30.28 28.93
250 165.90 71.80 55.16 49.32 43.32 38.52
300 - 141.20 75.19 63.78 56.92 51.13
350 - - 120.60 87.42 77.66 68.15
400 - - - 113.20 101.90 89.39
Fig. 6.8 Settlement vs load intensity for different soil combinations for strip footing of
width B=1m resting on stabilized soil of width 2B and depth 1B.
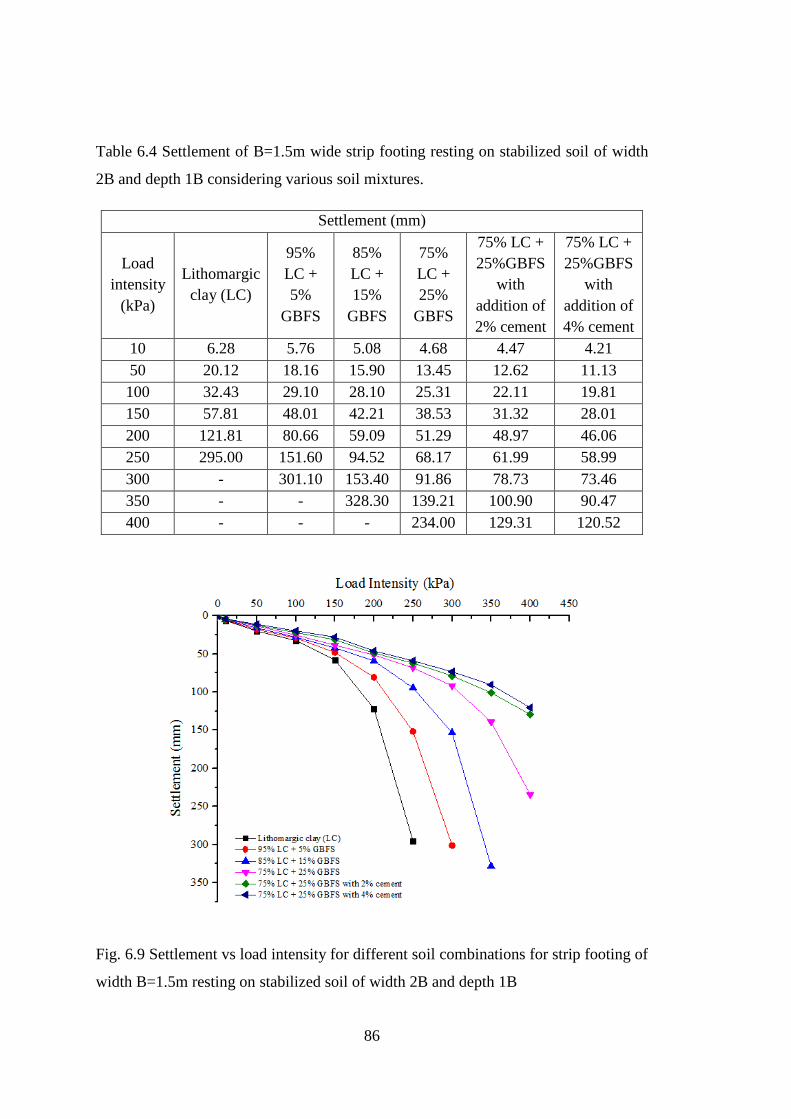
86
Table 6.4 Settlement of B=1.5m wide strip footing resting on stabilized soil of width
2B and depth 1B considering various soil mixtures.
Settlement (mm)
Load
intensity
(kPa)
Lithomargic
clay (LC)
95%
LC +
5%
GBFS
85%
LC +
15%
GBFS
75%
LC +
25%
GBFS
75% LC +
25%GBFS
with
addition of
2% cement
75% LC +
25%GBFS
with
addition of
4% cement
10 6.28 5.76 5.08 4.68 4.47 4.21
50 20.12 18.16 15.90 13.45 12.62 11.13
100 32.43 29.10 28.10 25.31 22.11 19.81
150 57.81 48.01 42.21 38.53 31.32 28.01
200 121.81 80.66 59.09 51.29 48.97 46.06
250 295.00 151.60 94.52 68.17 61.99 58.99
300 - 301.10 153.40 91.86 78.73 73.46
350 - - 328.30 139.21 100.90 90.47
400 - - - 234.00 129.31 120.52
Fig. 6.9 Settlement vs load intensity for different soil combinations for strip footing of
width B=1.5m resting on stabilized soil of width 2B and depth 1B

87
Table 6.5 Settlement of B=2m wide strip footing resting on stabilized soil of width 2B
and depth 1B considering various soil mixtures.
Settlement (mm)
Load
intensity
Lithomargic
clay (LC)
95%
LC +
5%
GBFS
85%
LC +
15%
GBFS
75%
LC +
25%
GBFS
75% LC +
25%GBFS
with
addition of
2% cement
75% LC +
25%GBFS
with
addition of
4% cement
10 7.59 6.61 5.48 5.15 4.65 4.31
50 22.81 19.12 18.21 16.53 14.51 11.98
100 41.53 37.24 35.22 31.81 26.23 22.51
150 76.41 58.92 55.12 51.16 45.32 41.51
200 167.40 94.32 72.53 70.13 63.31 57.63
250 428.56 151.62 101.10 92.92 81.83 77.89
300 - 349.20 176.93 120.01 96.66 92.14
350 - - 361.66 159.20 127.14 119.43
400 - - - 276.91 168.73 157.31
Fig. 6.10 Settlement vs load intensity for different soil combinations for strip footing
of width B=2m resting on stabilized soil of width 2B and depth 1B

88
Case 3: Load settlement behaviour of strip footing resting on stabilized soil of
width 3B and depth 2B considering various soil mixtures
Load settlement analyses using PLAXIS 2D were carried out for varying width of
footing (i.e. 1m,1.5m and 2m), considering different soil-GBFS proportions and soil-
GBFS-cement mixtures. Results are provided in Table 6.6 and figure 6.11 shows the
graphical representation of load settlement response.
From Table 6.6 and figure 6.11, it is observed that with the increase in load intensities,
the settlement increases for lithomargic soil. Upon stabilization of soil with GBFS the
settlement reduces and furthermore reduces when cement is added. For a particular load
intensity of 200kPa, settlement for footing resting on lithomargic clay is 77.38mm
which reduces to 30.10mm when soil is replaced by 25% GBFS (61.1% reduction). On
addition of 4% cement to the same 75% soil + 25% GBFS mix, settlement reduced to
17.16mm (total reduction of 77.82%). Similar trends are observed for all load intensities
and for all mixes. For footing width of 1.5m, Table 6.7 and figure 6.12 and for footing
width of 2m, Table 6.8 and figure 6.13 shows similar results obtained. It was also
observed that as the depth of stabilized zone increased the settlement reduces. The
percentage reduction in settlement is more in this case compared to case 2.

89
Table 6.6 Settlement for B=1m wide strip footing resting on stabilized soil of width 3B
and depth 2B considering various soil mixtures.
Settlement (mm)
Load
intensity
(kPa)
Lithomargic
clay (LC)
95%
LC +
5%
GBFS
85%
LC +
15%
GBFS
75%
LC +
25%
GBFS
75% LC +
25% GBFS
with
addition of
2% cement
75% LC +
25%GBFS
with
addition of
4% cement
10 5.32 3.97 3.81 3.42 2.74 2.22
50 14.94 12.17 9.83 7.61 4.18 2.94
100 26.71 21.51 18.73 15.21 9.96 7.01
150 40.90 30.03 26.53 21.32 15.32 12.83
200 77.38 43.79 37.57 30.10 20.16 17.16
250 165.91 59.33 48.32 42.78 25.12 21.82
300 - 89.88 69.66 52.41 35.51 30.86
350 - - 99.36 62.37 44.29 40.39
400 - - - 74.06 55.40 47.43
Fig. 6.11 Settlement vs load intensity for different soil combinations for strip footing
of width B=1m resting on stabilized soil of width 3B and depth 2B

90
Table 6.7 Settlement of B=1.5m wide strip footing on stabilized soil of width 3B and
depth 2B considering various soil mixtures.
Settlement (mm)
Load
intensity
(kPa)
Lithomargic
clay (LC)
95%
LC +
5%
GBFS
85%
LC +
15%
GBFS
75%
LC +
25%
GBFS
75% LC +
25%GBFS
with
addition of
2% cement
75% LC +
25% GBFS
with
addition of
4% cement
10 6.28 5.10 4.87 3.50 3.29 3.03
50 20.12 16.77 14.02 11.04 7.11 6.75
100 32.40 27.12 23.91 20.32 14.33 12.36
150 57.81 45.31 35.41 27.91 19.39 15.95
200 121.83 71.93 53.75 39.66 26.91 24.21
250 295.12 141.76 73.45 52.48 42.53 36.32
300 - 238.25 115.03 64.90 56.92 52.74
350 - - 188.16 78.57 68.38 64.69
400 - - - 102.22 83.10 75.82
Fig. 6.12 Settlement vs load intensity for different soil combinations for strip footing
of width B=1.5m resting on stabilized soil of width 3B and depth 2B
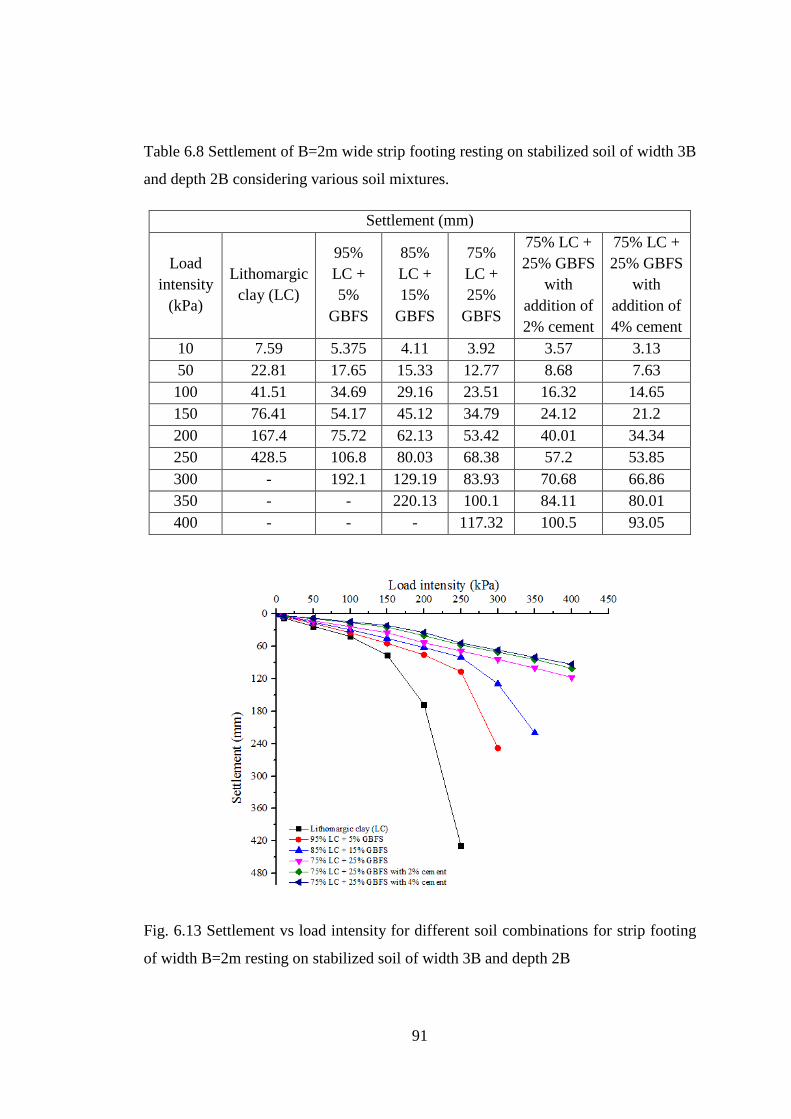
91
Table 6.8 Settlement of B=2m wide strip footing resting on stabilized soil of width 3B
and depth 2B considering various soil mixtures.
Settlement (mm)
Load
intensity
(kPa)
Lithomargic
clay (LC)
95%
LC +
5%
GBFS
85%
LC +
15%
GBFS
75%
LC +
25%
GBFS
75% LC +
25% GBFS
with
addition of
2% cement
75% LC +
25% GBFS
with
addition of
4% cement
10 7.59 5.375 4.11 3.92 3.57 3.13
50 22.81 17.65 15.33 12.77 8.68 7.63
100 41.51 34.69 29.16 23.51 16.32 14.65
150 76.41 54.17 45.12 34.79 24.12 21.2
200 167.4 75.72 62.13 53.42 40.01 34.34
250 428.5 106.8 80.03 68.38 57.2 53.85
300 - 192.1 129.19 83.93 70.68 66.86
350 - - 220.13 100.1 84.11 80.01
400 - - - 117.32 100.5 93.05
Fig. 6.13 Settlement vs load intensity for different soil combinations for strip footing
of width B=2m resting on stabilized soil of width 3B and depth 2B

92
6.3.3 Increase in net allowable pressure for stabilized soil
Table 6.9 Net allowable pressure for various soil mixtures for footing resting on
stabilized soil of width 2B and depth 1B for an allowable settlement of 25mm
Combinations
B=1m B=1.5m B=2m
Net
allowable
pressure
(kPa)
%
increase
in net
allowable
pressure
Net
allowable
pressure
(kPa)
%
increase
in net
allowable
pressure
Net
allowable
pressure
(kPa)
%
increase
in net
allowable
pressure
Lithomargic
clay (LC) 93 - 70 - 56 -
95% LC + 5%
GBFS 109 17.2% 81 15.7% 67 19.6%
85% LC +
15% GBFS 116 24.7% 87 24.3% 70 25%
75% LC +
25% GBFS 129 38.7% 99 41.4% 78 39.3%
75% LC+ 25%
GBFS with
addition of 2%
Cement
153 64.5% 116 65.7% 94 67.8%
75% LC +
25% GBFS
with addition
of 4% Cement
175 88.2% 132 88.6% 107 91.1%
For case 2, for various combinations of soil mixtures, values of net allowable pressure
for allowable settlement of 25mm are tabulated in Table 6.9. Table 6.10 provides
similar results for case 3.

93
Table 6.10 Net allowable pressure for various soil mixtures for footing resting on
stabilized soil of width 3B and depth 2B for an allowable settlement of 25mm
Combinations
B=1m B=1.5m B=2m
Net
allowable
pressure
(kPa)
%
increase
in net
allowable
pressure
Net
allowable
pressure
(kPa)
%
increase
in net
allowable
pressure
Net
allowable
pressure
(kPa)
%
increase
in net
allowable
pressure
Lithomargic
clay (LC) 93 - 70 - 56 -
95% LC +5%
GBFS 121 30.1% 90 28.6% 72 28.6%
85% LC
+15% GBFS 140 50.5% 105 50% 85 51.8%
75% LC +
25% GBFS 171 83.9% 131 87.1% 107 91.1%
75% LC +
25% GBFS
with addition
of 2% cement
248 166.7% 187 167.1% 153 173.2%
75% LC +
25% GBFS
with addition
of 4% cement
268 188.2% 203 190% 165 194.6%
From Table 6.9 and Table 6.10, we see that the increase in net allowable pressure
increases with increase in GBFS content and further more increases with addition of
cement to 75% soil + 25%GBFS mix. The increase in net allowable pressure increases
with increase in the depth of stabilized area below the footing. For a footing width of
B=2m, the percentage increase in net allowable pressure is39.3% for 75% soil + 25%
GBFS mix for 1B depth of stabilized soil (Table 6.9). The net allowable pressure
increased by 91.1% for the same 75% soil + 25% GBFS mix for 2B depth of stabilized
soil (Table 6.10). With addition of 4% cement to the optimized mix (75% soil +
25%GBFS), the net allowable pressure increased by 91.1% for 1B depth stabilized soil
(Table 6.9) and 194.6% increase is found for 2B depth of stabilized soil when compared
with footing resting on lithomargic clay (Table 6.10). Thus there is very good

94
improvement in load settlement behaviour of strip footing when lithomargic clay is
stabilized using GBFS and cement.
6.4 STABILITY ANALYSES OF AN EMBANKMENT SLOPE (SOON AFTER
CONSTRUCTION) USING PLAXIS 2D
Slope instability is a major concern in the areas where failures causes catastrophic
destruction. The failures might be triggered by internal or external factors that cause
imbalance to natural forces. An internal triggering factor is the factor that causes failure
due to internal changes, such as increasing pore water pressure and or imbalanced
forces developed due to external load.
Short-term analyses refers to conditions such as soon after construction where in, there
is no drainage occurring within this period. Short-term stability analysis of an
embankment slope is important.
In slope stability analysis, the factor that is very often in doubt is the shear strength of
the soil. The loading is known more accurately because usually it consists of the self-
weight of the slope. The Factor of Safety (FoS) is taken as a ratio of the available shear
strength to that required to keep the slope stable. For highly unlikely loading conditions,
accepted factors of safety can be as low as 1.2-1.25.e.g., for dam situations based on
seismic effects, or where there is rapid drawdown of the water level in a reservoir.
Generally, accepted factor of safety is 1.5 for undrained analysis and 1.3 for combined
or drained analysis.
An analysis of slope stability begins with the hypothesis that the stability of a slope is
the result of downward or motivating forces (i.e., gravitational) and resisting (or
upward) forces. The resisting forces must be greater than the motivating forces for a
slope to be stable. The relative stability of a slope (or how stable it is at any given time)
is typically conveyed by geotechnical engineers through a FoS defined as
FoS R
M
(6.1)
Where, R is the total resisting moment and M is the total motivating or driving
moment.

95
These analyses provide two useful results: (i) the normal stress on the shear surface and
(ii) the shear stress required for equilibrium. The factor of safety is the ratio of the shear
strength of the soil divided by the shear stress required for equilibrium. The normal
stresses along the slip surface are needed to evaluate the shear strength.
The factor of safety in PLAXIS is computed using phi-c reduction at each case of slope
modeling. In this type of calculation the incremental multiplier, Msf is used to specify
the increment of the strength reduction of the first calculation step. The strength
parameters are reduced successively in each step until all the steps have been
performed. The final step should result in a fully developed failure mechanism, if not
the calculation must be repeated with a larger number of additional steps. Once the
failure mechanism is reached or at the failure stage of the slope, the FoS is given by,
at failureFoS RF
Available strengthMsf value of Msf at failure
Strength at failure (6.2)
The c−φ method is based on the reduction of the cohesion (c) and the tangent of the
friction angle (tanφ) of the soil. The parameters are reduced in steps until the soil mass
fails. PLAXIS uses a factor (RF) to relate the reduction in the parameters during the
calculation at any stage with the input parameters, which is given by,
tan
tan
input input
reduced reduced
RFc
c
(6.3)
Where, RF = the reduction factor at any stage during calculations, tan input and inputc
are the input parameters of the soil, tan reduced and reducedc are the reduced parameters
calculated by the program.
In embankment slope analyses, though there are many situations such as long term
stability, steady seepage condition, effect of water table, live load on embankment etc.,
this work is limited to stability analyses soon after construction and obtaining
improvement in factor of safety values due to stabilization of lithomargic clay. Results
obtained from the analyses are discussed in the subsequent sections.

96
6.4.1 Various cases considered in the analyses
For the stability analyses of embankment slopes (soon after construction), following
three cases are considered.
Case 1: Embankment is made up of lithomargic clay and resting on lithomargic
clay. Slope heights 4m, 6m, 8m, 10m, and 12m and embankment slope
angles of 30°, 45°, 60°, and 75° were considered [figure 6.14(a)].
Case 2: Embankment with stabilized soil resting on lithomargic clay. Slope
heights: 4m, 6m, 8m, 10m and 12m. Embankment slope angles: 30°, 45°,
60° and 75° [figure 6.14(b)].
Case 3: Embankment with stabilized soil and soil below the embankment,
stabilized for a depth of half the embankment height. Embankment
heights: 4m, 6m, 8m, 10m and 12m. Embankment slope angles: 30°, 45°,
60° and 75° [figure 6.14(c)].
Fig. 6.14 (a) - Case 1
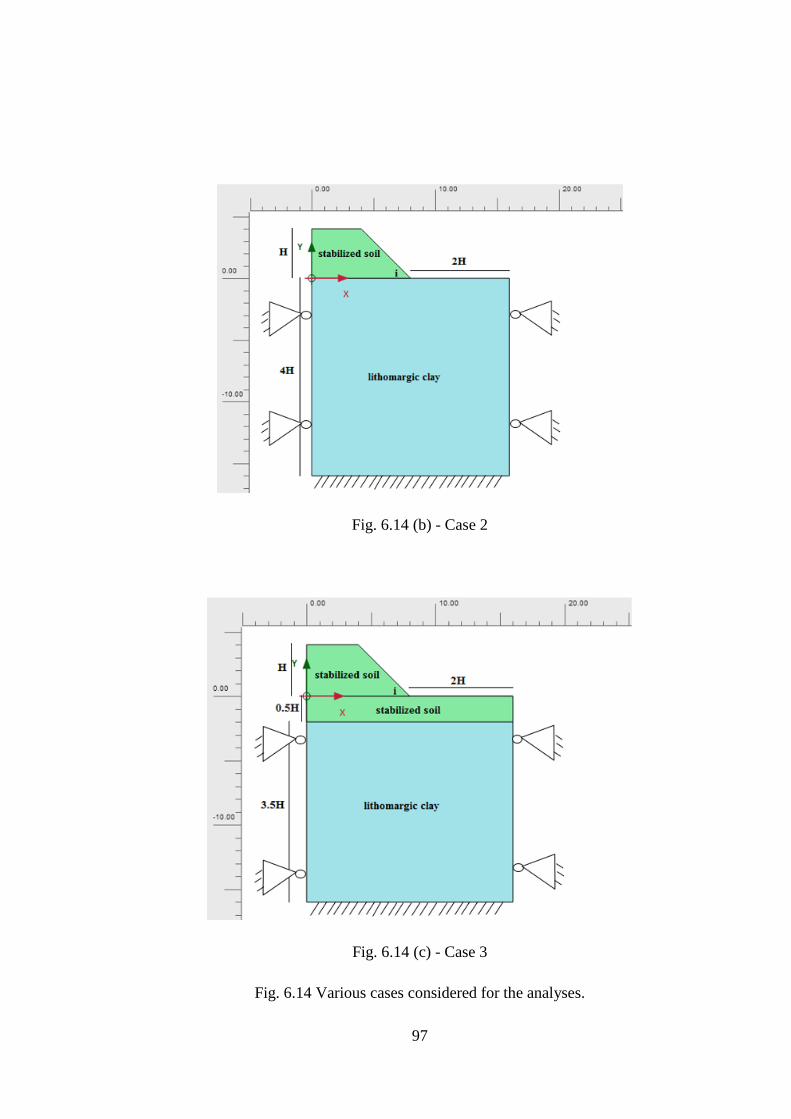
97
Fig. 6.14 (b) - Case 2
Fig. 6.14 (c) - Case 3
Fig. 6.14 Various cases considered for the analyses.

98
6.4.2 Results of slope stability analyses for embankment made up of lithomargic
clay and resting on lithomargic clay (Case 1)
A series of finite element analyses using PLAXIS 2D on stability of embankment slope
were performed and values of factor of safety were established for different heights and
slope angles. Results are provided in Table 6.11(a) and figure 6.15. Analysis using limit
equilibrium method (Nayak and Padmaja 2006) were also done for typical cases to
validate the results. In addition, the percentage difference were recorded and presented
in Table 6.11(b). Difference of 0.32% to 1.87% for slope angle of 30 degrees, 8.1% to
13.4% for slope angle of 45 degrees and 19.85% to 22.8% for slope angle of 60 degrees
were observed between limit equilibrium method and finite element method.
Table 6.11(a) Variation of FoS for different embankment heights (Case 1)
Factor of Safety
Embankment slope angle, i
Height 30° 45° 60° 75°
4m 3.10 2.78 2.64 2.47
6m 2.42 2.15 1.93 1.70
8m 1.98 1.75 1.54 1.32
10m 1.60 1.47 1.31 1.10
12m 1.31 1.24 1.06 -
Table 6.11(b) Comparision of FoS obtained from PLAXIS and limit equilibrium
method (LEM)
Height
30° 45° 60°
PLAXIS LEM
%
diffe-
rence
PLAXIS LEM
%
diffe-
rence
PLAXIS LEM
%
diffe-
rence
4m 3.10 3.09 0.32 2.78 2.51 9.71 2.64 2.05 22.35
6m 2.42 2.40 0.83 2.15 1.86 13.49 1.93 1.49 22.80
8m 1.98 1.95 1.51 1.75 1.54 12.00 1.54 1.22 20.78
10m 1.60 1.57 1.87 1.47 1.35 8.16 1.31 1.05 19.85

99
Fig. 6.15 Variation of factor of safety with embankment constructed with lithomargic
clay with varying embankment slope angle and varying embankment height.
It is noticed from Table 6.11 and figure 6.15 that increase in height of the embankment
resulted in decrease in values of factor of safety. As expected, with the increase in slope
angles, the FoS decreases.
6.4.3 Results of slope stability analyses for embankment with stabilized soil resting
on lithomargic clay (Case 2)
Considering slope heights of 4m, 6m, 8m, 10m and 12m, for various combinations of
soil mixes, analyses were carried out and the results are provided in Table 6.12 for slope
angle of 30°. Graphical representation of the same is shown in figure 6.16. Similar
analyses were carried out for slope angles of 45°, 60° and 75° and results are presented
in Tables 6.13, 6.14 and 6.15 respectively. Figures 6.17, 6.18 and 6.19 provides
variation of factor of safety for slope angles of 45°, 60° and 75° considering various soil
mix combinations.
It is evident from Table 6.12 and figure 6.16 that for an embankment slope angle of 30°,
the FoS decreases with increase in embankment height. With the increase in the GBFS
replacing the soil in the embankment, the FoS increases. The improvement in FoS is
larger when embankment is stabilized with 25% optimum GBFS content and cement.

100
Addition of cement to soil-GBFS mix increases the factor of safety considerably,
compared to soil stabilized with GBFS alone. Similar trend is observed for slope angles
of 45°, 60°and 75° [Tables 6.13-6.15 and figures 6.17-6.19]
Table 6.12 Variation of FoS for slope angle of 30° (Case 2)
Height
Factor of Safety for i=30°
Lithomargic
clay (LC)
95% LC
+ 5%
GBFS
85% LC
+ 15%
GBFS
75% LC
+ 25%
GBFS
75% LC
+ 25%
GBFS
with
addition
of 2%
cement
75% LC
+ 25%
GBFS
with
addition
of 4%
cement
4m 3.10 3.33 3.6 3.86 5.13 5.61
6m 2.42 2.58 2.78 2.99 4.08 4.32
8m 1.98 2.11 2.27 2.46 3.46 3.76
10m 1.60 1.75 1.87 2.01 3.00 3.35
12m 1.31 1.56 1.73 1.86 2.71 3.02
Fig.6.16 Variation of FoS for slope angle of 30° (Case 2)

101
Table 6.13 Variation of FoS for slope angle of 45° (Case 2)
Height
Factor of Safety for i=45°
Lithomargic
clay (LC)
95% LC
+ 5%
GBFS
85% LC
+ 15%
GBFS
75% LC
+ 25%
GBFS
75% LC
+ 25%
GBFS
with
addition
of 2%
cement
75% LC
+ 25%
GBFS
with
addition
of 4%
cement
4m 2.78 3.00 3.23 3.68 4.76 4.99
6m 2.15 2.29 2.49 2.70 3.9 4.16
8m 1.75 1.87 2.05 2.25 3.34 3.62
10m 1.50 1.61 1.78 1.97 2.96 3.27
12m 1.24 1.42 1.50 1.71 2.55 2.96
Fig.6.17 Variation of FoS for slope angle of 45° (Case 2)

102
Table 6.14 Variation of FoS for slope angle of 60° (Case 2)
Height
Factor of Safety for i=60°
Lithomargic
clay (LC)
95% LC
+ 5%
GBFS
85% LC
+ 15%
GBFS
75% LC
+ 25%
GBFS
75% LC
+ 25%
GBFS
with
addition
of 2%
cement
75% LC
+ 25%
GBFS
with
addition
of 4%
cement
4m 2.64 2.91 3.18 3.45 4.34 4.59
6m 1.93 2.10 2.34 2.61 3.35 3.60
8m 1.54 1.72 1.95 2.18 2.83 3.07
10m 1.31 1.49 1.67 1.87 2.51 2.74
12m 1.09 1.27 1.4 1.56 2.20 2.38
Fig.6.18 Variation of FoS for slope angle of 60° (Case 2)

103
Table 6.15 Variation of FoS for slope angle of 75° (Case 2)
Height
Factor of Safety for i=75°
Lithomargic
clay (LC)
95% LC
+ 5%
GBFS
85% LC
+ 15%
GBFS
75% LC
+ 25%
GBFS
75% LC
+ 25%
GBFS
with
addition
of 2%
cement
75% LC
+ 25%
GBFS
with
addition
of 4%
cement
4m 2.47 2.75 3.05 3.26 3.87 4.09
6m 1.70 1.95 2.26 2.50 2.92 3.20
8m 1.32 1.56 1.82 2.02 2.41 2.67
10m 1.10 1.34 1.54 1.74 2.10 2.24
12m - 1.10 1.23 1.40 1.75 1.90
Fig.6.19 Variation of FoS for slope angle of 75° (Case 2)

104
6.4.4 Results of slope stability analyses for embankment with stabilized soil and
soil below embankment stabilized for a depth of half the embankment height (Case
3)
Table 6.16 provides the results from the analyses, carried out for different slope heights
of 4m, 6m, 8m, 10m and 12m considering various combinations of soil mixes, for a
slope angle of 30°. Graphical representation of the same is shown in figure 6.20.
Similarly, analyses were carried out for slope angles of 45°, 60° and 75° and results are
presented in Tables 6.17, 6.18 and 6.19 respectively. Figures. 6.21, 6.22 and 6.23
provides variation of factor of safety for slope angles of 45°, 60° and 75° considering
various soil mix combinations.
From Table 6.16 and figure 6.20, for a slope inclination of 30°, the FoS reduces with
the increase in embankment height. It further increases with the increase in the GBFS
replacing the soil in the embankment. The FoS also increased as the soil below the
embankment is stabilized for a depth of half the embankment height. The improvement
in FoS is higher when embankment is stabilized with 25% optimum GBFS content and
cement. Addition of cement to the soil-GBFS mix increases the factor of safety
considerably, compared to soil stabilized only with GBFS. Similar trend is observed for
slope angles of 45°, 60°and 75° [Tables 6.17-6.19 and figures 6.21-6.23]
Table 6.16 Variation of FoS for slope angle of 30° (Case 3)
Height
Factor of Safety for i=30°
Lithomargic
clay (LC)
95% LC
+ 5%
GBFS
85% LC
+ 15%
GBFS
75% LC
+ 25%
GBFS
75% LC
+ 25%
GBFS
with
addition
of 2%
cement
75% LC
+ 25%
GBFS
with
addition
of 4%
cement
4m 3.13 3.63 4.24 4.64 7.19 8.52
6m 2.42 2.86 3.05 3.73 6.01 6.82
8m 1.98 2.42 2.89 3.23 5.66 6.25
10m 1.60 2.14 2.44 2.82 4.95 5.74
12m 1.31 1.87 2.25 2.58 4.45 5.20

105
Fig.6.20 Variation of FoS for slope angle of 30° (Case 3)
Table 6.17 Variation of FoS for slope angle of 45° (Case 3)
Height
Factor of Safety for i=45°
Lithomargic
clay (LC)
95% LC
+ 5%
GBFS
85% LC
+ 15%
GBFS
75% LC
+ 25%
GBFS
75% LC
+ 25%
GBFS
with
addition
of 2%
cement
75% LC
+ 25%
GBFS
with
addition
of 4%
cement
4m 2.78 3.39 4.01 4.49 7.09 8.17
6m 2.15 2.68 3.21 3.61 5.80 6.60
8m 1.75 2.23 2.70 3.16 5.31 6.03
10m 1.53 1.91 2.41 2.72 4.84 5.50
12m 1.24 1.62 2.09 2.31 4.21 5.02

106
Fig. 6.21 Variation of FoS for slope angle of 45°(Case 3)
Table 6.18 Variation of FoS for slope angle of 60° (Case 3)
Height
Factor of Safety for i=60°
Lithomargic
clay (LC)
95% LC
+ 5%
GBFS
85% LC
+ 15%
GBFS
75% LC
+ 25%
GBFS
75% LC
+ 25%
GBFS
with
addition
of 2%
cement
75% LC
+ 25%
GBFS
with
addition
of 4%
cement
4m 2.64 3.34 3.97 4.35 6.81 7.77
6m 1.93 2.43 3.1 3.54 5.71 6.53
8m 1.54 1.93 2.59 3.1 5.12 5.86
10m 1.31 1.64 2.24 2.6 4.73 5.47
12m 1.09 1.35 1.66 2.09 3.92 4.87

107
Fig.6.22 Variation of FoS for slope angle of 60°(Case 3)
Table 6.19 Variation of FoS for slope angle of 75° (Case 3)
Height
Factor of Safety for i=75°
Lithomargic
clay (LC)
95% LC
+ 5%
GBFS
85% LC
+ 15%
GBFS
75% LC
+ 25%
GBFS
75% LC
+ 25%
GBFS
with
addition
of 2%
cement
75% LC
+ 25%
GBFS
with
addition
of 4%
cement
4m 2.47 3.16 3.87 4.19 6.53 7.52
6m 1.70 2.13 2.90 3.24 5.44 6.19
8m 1.32 1.64 2.24 2.99 5.07 5.67
10m 1.11 1.38 1.89 2.52 4.66 5.42
12m - 1.25 1.41 1.88 3.70 4.63

108
Fig.6.23 Variation of FoS for slope angle of 75° (Case 3)
6.4.5 Effect of stabilization on Factor of Safety (FoS)
The values of factor of safety obtained for case 1, case 2 and case 3 are compared to
understand the effect of stabilization on FoS obtained for embankment slopes (soon
after construction). For a typical case of H=10m, FoS values for all the three cases are
presented in Table 6.20. Graphical representation is provided in figure 6.24 and figure
6.25.

109
Table 6.20. Effect of stabilization on FoS for H=10m
Factor of safety (FoS)
i=30° i=45° i=60° i=75°
Case 1 Lithomargic
clay (LC) 1.60 1.47 1.31 1.10
Case 2 75% LC +
25% GBFS 2.01 1.97 1.87 1.74
Case 2
75% LC +
25% GBFS +
2% cement
3.00 2.96 2.51 2.10
Case 3 75% LC +
25% GBFS 2.82 2.72 2.60 2.52
Case 3
75% LC +
25% GBFS
with addition
of 2% cement
4.95 4.84 4.73 4.66
Case 1: Embankment of lithomargic clay resting on lithomargic clay
Case 2: Embankment with stabilized soil and resting on lithomargic clay.
Case 3: Embankment and soil below embankment, stabilized for a depth of half the
embankment height.
From Table 6.20 and figure 6.24 and figure 6.25, it is clear that there is good
improvement in FoS values from case 1 to case 2. It further improves for case 3. For
example, considering i=60°for H=10m, for case 1, FoS is 1.31, which increases to 1.87
when embankment is made up of 75% lithomargic clay + 25% GBFS (increase by
42.7%). By adding 2% cement to optimum mix, FoS increases to 2.51 (total increase is
91.6%). For case 3 (embankment and soil below embankment stabililzed for depth of
half the embankment height), considering i=60°and H=10m, FoS value for 75% soil +
25% GBFS mix is 2.60 (increase by 98.5% compared to case 1) and by adding 2%
cement, FoS value increases to 4.73 (increase by 261% compared to case 1).

110
Fig. 6.24 Variation of FoS for different cases for 75% LC + 25% GBFS
Fig. 6.25 Variation of FoS for different cases for 75% LC + 25% GBFS with addition
of 2% cement

111
CHAPTER 7
MANUFACTURE AND TESTING OF COMPRESSED
STABILIZED EARTH BLOCKS
7.1 INTRODUCTION
Stabilization is a process of mixing admixtures with soil to improve its volume stability,
strength, permeability and durability. Amongst the variety of soil stabilizers used,
cement has been the most popular stabilizer in the manufacture of compressed
stabilized earth blocks (CSEBs). Compressed earth block or pressed soil block is a
building material made primarily from damp soil compressed at high pressure to form
blocks. These blocks uses a mechanical press to form blocks from inorganic and non-
expansive soil. If the blocks are stabilized with cement, they are called as compressed
stabilized earth block (Nagarajet al. 2014).
Attempts to utilize GBFS in combination with cement as a stabilizer to achieve
desirable properties of CSEBs have not been reported. As GBFS is known to impart
strength in the long term, its utilization in some proportions as a replacement to cement
may be beneficial. Utilization of granulated blast furnace slag (GBFS) not only helps
in the bulk utilization in production of CSEBs due to its latent pozzolanic properties
but also helps in the increase in the rate of disposal of these slags. Since the rate of
hydration and pozzolanic reactions is slow in GBFS, it can be improved with the
addition of cement. Hence, an attempt has been made to understand the role of slag in
combination with cement as a stabilizer for improving the long term properties of
CSEBs to optimize the use of stabilizer and improve the strength of blocks. This work
is aimed at contributing towards improvising the existing technology of manufacture of
unfired earth blocks and in the reduction of cement utilization.
7.2 MATERIALS USED
Lithomargic clay, lateritic soil, granulated blast furnace slag and ordinary Portland
cement are used in the manufacture of compressed stabilized earth blocks.

112
7.2.1 Soils: Two different types of soils were used in the current study, as these were
the locally available soils. One is lateritic soil which is reddish/brownish in colour
having hard and porous nature, while the other being lithomargic clay, which is whitish,
pinkish/yellowish in colour, mainly consisting of silt/sand particles. Lithomargic clay
is found below hard lateritic soil at depths varying from 2-5m throughout the
southwestern belt of India. The properties of these soils obtained from laboratory testing
are provided in Table 7.1 and their particle distribution curves are presented in figure
7.1.
Table 7.1 Properties of lithomargic clay and lateritic soil
Sl.
No. Properties
Lithomargic
clay Lateritic soil
1
Particle size distribution
Gravel size (%)
Sand size (%)
Silt size (%)
Clay size (%)
02
10
59
29
04
60
20
16
2
Atterberg’s limits
Liquid limit, wL (%)
Plastic limit, wp (%)
Shrinkage limit, ws (%)
Plasticity index, IP (%)
47
31
28
16
44
32
30
12
3 IS Classification MI SM-SC
4 Specific Gravity 2.52 2.62
5
Compaction characteristics
(Standard Proctor Test)
Maximum dry unit weight γd (kN/m3)
Optimum moisture content (%)
14.2
28
16.9
21
6 Unconfined compressive strength (kPa) 232 406

113
7.2.2 Granulated Blast Furnace Slag (GBFS): The slag obtained from Kirloskar
Ferrous Industries Limited was used. Its properties are reported in chapter 4.
7.2.3 Ordinary Portland Cement (OPC): 53 grade cement was used for the study.
Fig. 7.1 Grain size distribution of lateritic soil, lithomargic clay and GBFS
7.3 MANUFACTURE AND TESTING
Screening: The soil was loosened in a uniform manner by removing any roots, leaves,
twigs etc. i.e. any undesirable materials.
Drying: The soil was dried in the oven for 24 hours at 110 +/- 5°C to remove any
moisture.
Pulverizing: The soil was broken down to a size passing through 4.75mm sieve, since
the particles retained on them were considered as not suitable for block preparation.
Mixing: The requisite quantities of the materials i.e. soil, GBFS and cement was
calculated. Weigh batching was done to control the block density. Mixing was done
properly to ensure good quality blocks. Dry materials were mixed thoroughly to get a
homogeneous mix. The amount of water that was required to obtain a good quality

114
block was determined by making a good intact ball without sticking to the hand from
initial trials. Requisite quantity of potable water was added to this mix by spraying and
then turned over many times until all the required water was added. The process is
repeated until all the particles were uniformly wetted. Figure 7.2 shows the cleaning
and lubricating the block mould. Dry mixing of all the constituents and addition of
water to the dry mix are shown in figures 7.3 and 7.4 respectively.
Compression: Block making machine was used for compressing the block. Generally
the single acting ram generates a compaction pressure in the range of 2-3MPa.This
process consists of compressing the wet mix after it has been placed in the mould,
through static compression to get constant volume blocks. The compressed block was
then removed from the machine. The ejected samples were weighed and labeled
according to their mix. The size of the blocks obtained is of 30.5 cm x 14.3 cm x 10.5
cm. Figure 7.5 shows the method of compressing the block by pulling down the lever
arm. After compression process is complete, soil blocks were ejected as shown in figure
7.6
Curing: Blocks were cured for 28 days. Figure 7.7 shows the storage and curing of the
prepared blocks.
Testing: Compression tests were carried out in a compression testing machine. Both
wet and dry compression tests were carried out. After 26 days of curing, the blocks
were immersed in water for 2 days (6 blocks for each combination) and then the blocks
were removed from water. The surfaces of the blocks were wiped dry and their mass
and dimensions were measured. Dry compressive strength test were conducted on
another set of similar samples after 28 days of curing (without immersion in water).
The samples were then placed in the compression testing machine and loaded. Iron
plates of 10mm thick were placed on either surfaces of the block before the application
of load, as shown in figure 7.8.
Tests for water absorption were carried out on another set of similar samples (six blocks
for each combination). The blocks were kept in oven for drying (figure 7.9) and their
weight were taken accurately. Then the blocks were submerged in clean water for one
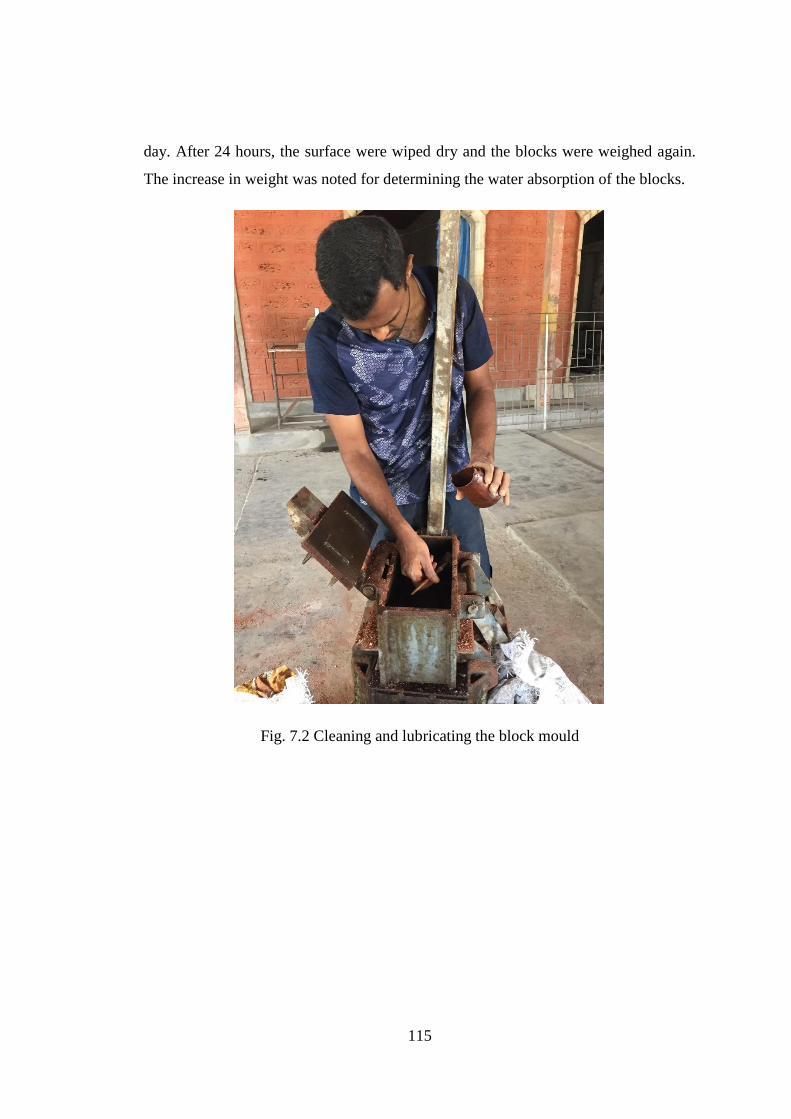
115
day. After 24 hours, the surface were wiped dry and the blocks were weighed again.
The increase in weight was noted for determining the water absorption of the blocks.
Fig. 7.2 Cleaning and lubricating the block mould
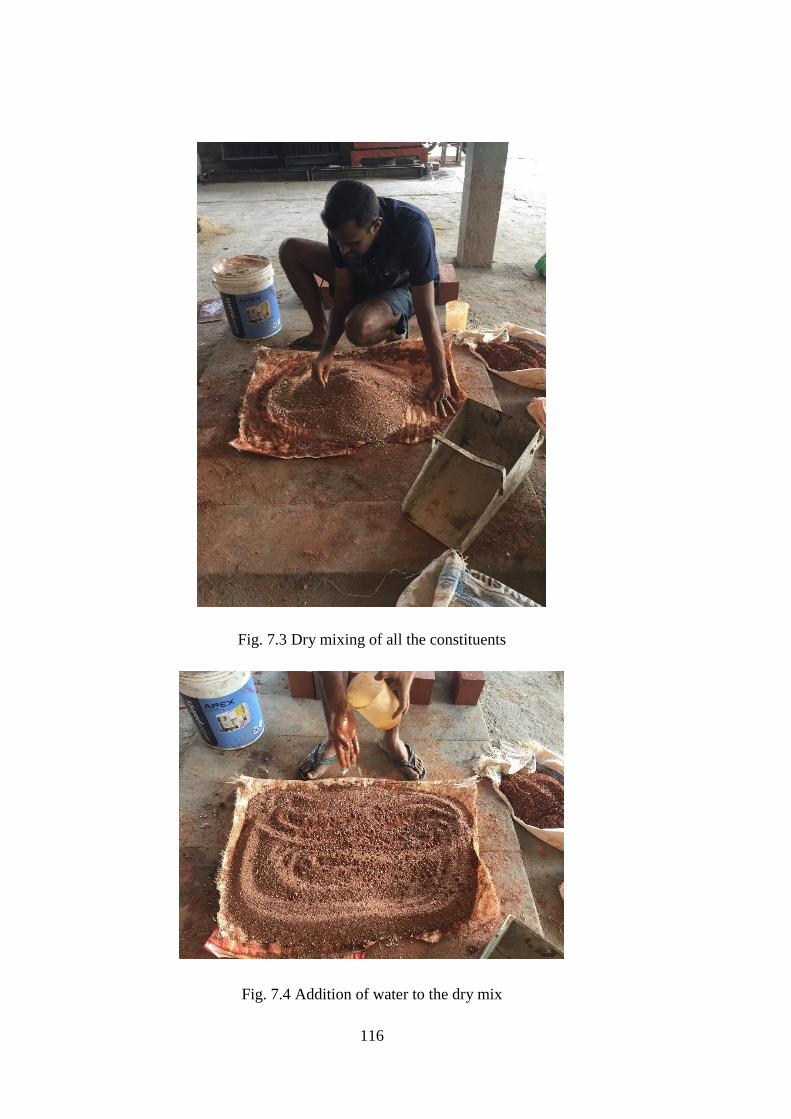
116
Fig. 7.3 Dry mixing of all the constituents
Fig. 7.4 Addition of water to the dry mix

117
Fig. 7.5 Compressing the block by pulling down the lever arm
Fig. 7.6 Ejecting the soil block after compression process
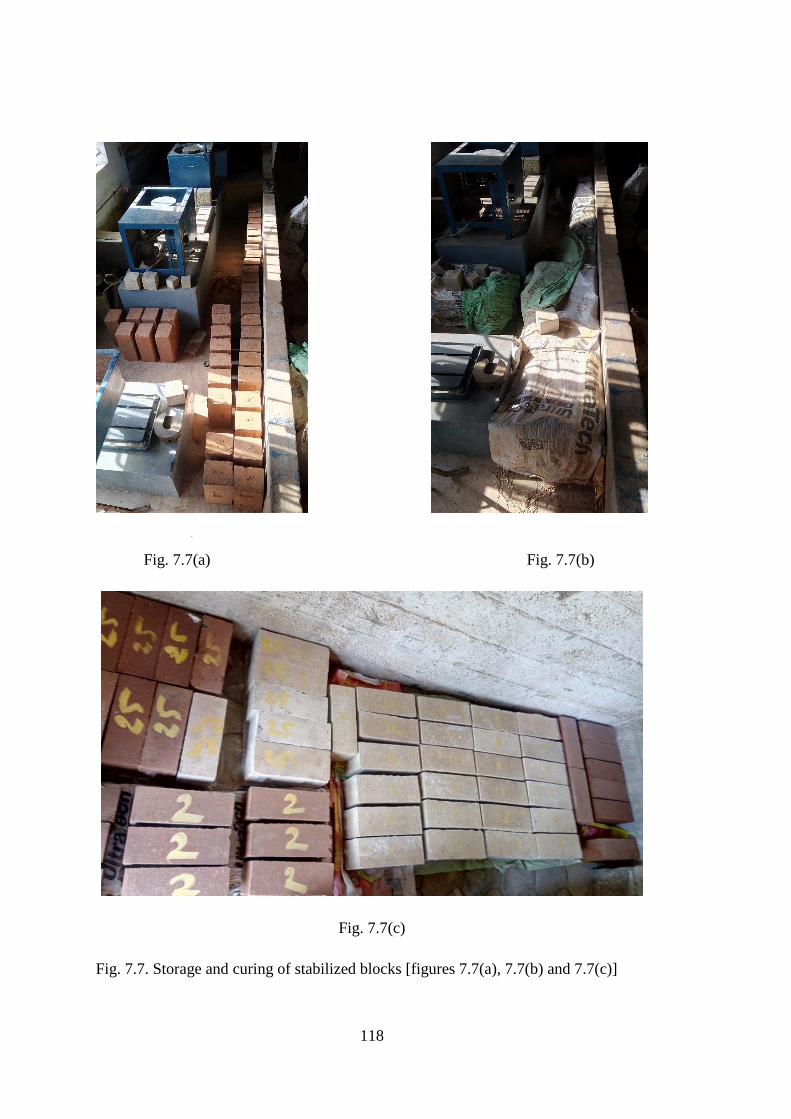
118
Ff
Fig. 7.7(a) Fig. 7.7(b)
Fig. 7.7(c)
Fig. 7.7. Storage and curing of stabilized blocks [figures 7.7(a), 7.7(b) and 7.7(c)]

119
Fig. 7.8 Testing for compressive strength in a compression testing machine
Fig. 7.9 Placement of soil blocks in hot air oven for water absorption test.

120
7.4 RESULTS AND DISCUSSION
Results of various tests related to manufacture and testing of CSEBs are presented and
discussed in the subsequent section.
7.4.1 Effect of GBFS on properties of lateritic soil
Various tests were conducted on lateritic soil and lateritic soil + GBFS mixes to decide
the optimum percentage of GBFS replacing the lateritic soil. Results of various tests
are presented in Table 7.2
Table 7.2. Properties of lateritic soil when replaced by GBFS
Sl.
No. Properties
Percentage of GBFS replacing lateritic soil
0% 10% 15% 20% 25% 30%
1 Liquid limit, wL (%) 44 42 40.2 39.2 38.4 37.1
2 Plastic limit, wp (%) 32 30 28.6 NP NP NP
3 Plasticity Index, IP (%) 12 12 11.6 - - -
4 Specific gravity, G 2.62 2.53 2.49 2.45 2.41 2.37
5 Maximum dry unit weight,γd
(kN/m3) 16.9 16.8 16.8 16.7 16.5 16.3
6 Optimum moisture content
(%) 21 20 19.5 19 18.4 18
7 UCS at 7 days curing (kPa) 406 480 551 589 549 511
8 UCS at 28 days curing (kPa) 406 772 869 938 899 786
From Table 7.2, it is observed that the soil mixture becomes non plastic beyond 15%
replacement of soil by GBFS. Variation of UCS with percentage of GBFS replacing
lateritic soil is shown in figure 7.10 for both 7 days and 28 days cured samples. From
figure 7.10, it is observed that at 20% replacement of lateritic soil by GBFS, the
Unconfined Compressive Strength (UCS) is maximum and hence this percentage of
replacement is taken as optimum for manufacture of soil blocks. Laboratory test on
lithomargic clay and lithomargic clay + GBFS mixes are already presented in Chapter
4.

121
Fig. 7.10. Variation of UCS with different percentage of GBFS replacement.
7.4.2 Test results of compressed stabilized lithomargic clay blocks
Table7.3.Compressive strength and water absorption test results for stabilized
lithomargic clay blocks
Series
28 days cured samples
Dry
compressive
strength
(MPa)
Wet
compressive
strength(MP
a)
Water
absorption
(%)
Lithomargic clay 1.05 - -
75% Lithomargic clay + 25%
GBFS 1.61 - -
75% Lithomargic clay + 25%
GBFS with addition of 6% cement 3.48 2.74 13.9
75% Lithomargic clay + 25%
GBFS with addition of 8% cement 4.75 3.20 13.4
75% Lithomargic clay + 25%
GBFS with addition of 10%
cement
5.15 3.63 12.96
75% Lithomargic clay + 25%
GBFS with addition of 12%
cement
5.55 3.94 12.51

122
Results of compressive strength and water absorption tests on compressed stabilized
lithomargic clay blocks are presented in Table 7.3. Dry compression tests were
conducted on lithomargic clay blocks and on 75% lithomargic clay + 25% GBFS
blocks. Wet compression tests and water absorption tests could not be conducted, since
upon immersion in water there was complete disintegration of the block materials.
However, when soil is replaced by 25% GBFS, we see an improvement in dry strength
from 1.05MPa to 1.61MPa due to the hydration and pozzolanic reactions between the
alumino silicates of soil and the CaO from GBFS forming a strong bond between the
soil mixtures. With the addition of cement to the mix, a larger improvement in both the
wet and dry compressive strength is observed. Increase in cement content increases the
compressive strength of the blocks. This is due to the hydration products of cement,
which fills the pores of the soil matrix and enhances the stiffness of its structure forming
large bonds connecting the soil particles (Ramirez et al. 2012, Walker and Stace 1997,
Reddy et al. 2007).
The wet compressive strength is about 21.3% to 32.6% lower than that of dry
compressive strength as seen in Table 7.3 and figure 7.11. This reduction is due to the
large amount of finer particles present in the mix i.e. the weakening effect of the bond
between the soil particles and the cement paste and may be because of the development
of the pore water pressures and the liquefaction of the unstabilized soil particles
(Ramirez et al. 2012). For various mixes, water absorption varies from 13.9% to
12.51% (Table 7.3). It is also observed that the water absorption slightly decreases with
increase in the cement content. This is due to the reduction in void spaces between the
soil particles, which are filled up by the gel formation from the pozzolanic and
hydration products of GBFS and cement. Finally, it is concluded that the blocks made
of 75% lithomargic clay + 25% GBFS with addition of 10% cement can be utilized in
load bearing masonry construction as it fulfills the criteria in terms of wet compressive
strength i.e. >3.5MPa and water absorption i.e. < 15% as per the Indian Standard (IS)
specifications.

123
Fig. 7.11. Variation of dry and wet compressive strength of stabilized lithomargic clay
blocks
7.4.3 Test results of compressed stabilized lateritic soil blocks
Table 7.4. Compressive strength and water absorption test results for stabilized lateritic
blocks
Series
28 days cured samples
Dry compressive
strength (MPa)
Wet compressive
strength(MPa)
Water absorption
(%)
Lateritic soil 1.52 - -
80% Lateritic soil +
20% GBFS 2.13 - -
80% Lateritic soil +
20% GBFS with
addition of 2% cement
3.08 2.52 12.9
80% Lateritic soil +
20% GBFS with
addition of 4% cement
3.91 3.09 12.4
80% Lateritic soil +
20% GBFS with
addition of 6% cement
4.70 3.61 11.7
80% Lateritic soil +
20% GBFS with
addition of 8% cement
5.25 4.19 10.9

124
Fig. 7.12 Variation of dry and wet compressive strength of stabilized lateritic blocks
Compressive stabilized earth blocks made up of lateritic soil, GBFS and cement were
tested for dry and wet compressive strength and water absorption. Results of
compressive strength and water absorption tests on compressed stabilized lateritic soil
blocks are presented in Table 7.4 and figure 7.12. Initially, when only the lateritic
blocks were tested for their dry compressive strength, it gave a value of 1.52MPa, which
is greater than that of lithomargic clay blocks (1.05MPa). The amount of sand fraction
is more in lateritic soil and hence a good gradation helps it in the well interlocking of
the particles with one another i.e. finer particles will fill the void of the coarser particles,
thereby resulting in a denser and rigid soil matrix. The wet compression tests and water
absorption tests could not be conducted as the soil block lost its shape after saturation.
Similar trend was observed with blocks stabilized with GBFS. With the replacement of
optimum percentage of GBFS (20%) to the soil mass, the dry compressive strength
increased to 2.13MPa. GBFS contains CaO, it undergoes a slow pozzolanic reaction
with aluminum silicates resulting in agglomeration of the soil particles and thus the
improvement in strength is observed. This slow pozzolanic reaction may prove to be
helpful in the long-term strength of the mix.
Addition of the cement accelerates the pozzolanic reactions within the soil mix. With
the increase in cement content, the quantity of C2S and C3S increases which leads to
the increase in CSH, CAH and CASH gels. These are the binding products of cement

125
hydration, which reduces the porosity and increases the density of the soil matrix. The
strength reduction after 2 days soaking was found to be in the range of 18.2%-23.2%.
This lower percentage of reduction in strength was due to the lesser amount of finer
particles in the soil mix and due to the effectiveness of cement for coarse grained
particles. Water absorption values are also included in Table 7.4. Water absorption
values for various combinations varies from 12.9% to 10.9%. Furthermore, the decrease
in water absorption was due to the reduction in pore voids by the accumulation of the
hydration and pozzolanic products between these voids resulting in more denser and
lesser connectivity in these voids (Oti et al. 2009, Kaniraj and Havanagi 1999, Tripura
and Singh 2015, Reddy and Kumar 2011). Blocks made of lateritic soil and optimum
GBFS (20% replacement) with addition of 6% cement fulfills the criteria to be used in
load bearing masonry construction. [i.e. wet compressive strength ≥3.5MPa and water
absorption <15%].

126

127
CHAPTER 8
SUMMARY AND CONCLUSIONS
8.1 SUMMARY
In this work, an attempt has been made to study the effect of granulated blast furnace
slag (GBFS) and cement in stabilizing lithomargic clay and its use in few engineering
applications.
Lithomargic clay during its initial characterization showed the need for its stabilization.
GBFS is a material, which is an industrial by-product and available in large quantities.
The main objective was to improve the strength properties of lithomargic clay using
GBFS and cement. Experimental investigations were carried out to check the
effectiveness of GBFS in stabilizing lithomargic clay. Lithomargic clay when stabilized
with optimum percentage of GBFS, i.e. (75% lithomargic clay + 25% GBFS) gave good
improvement in the strength properties. The pozzolanic reaction between granulated
blast furnace slag and soil is due to the free CaO content in GBFS. Compared to cement
stabilization, the strength gain in GBFS stabilized soil was lesser. To further improve
the strength properties of soil-GBFS mix, small percentage (i.e. 2% and 4%) of cement
was added. The improvement in strength properties was due to the pozzolanic and
hydration reactions, which was observed through SEM and XRD analyses. Major
cementitious compounds like CSH, CAH, CASH were responsible for binding the soil
particles. Additionally, to apply the experimental results to engineering applications,
PLAXIS software was used to study two problems namely, load settlement analyses of
strip footings resting on lithomargic clay and stabilized lithomargic clay and the
stability analyses of an embankment slope (soon after construction). It was found that
the settlement decreased and load carrying capacity increased for a strip footing when
resting on stabilized soil. The factor of safety for an embankment slope improved with
use of GBFS and cement. Production of Compressed Stabilized Earth Blocks (CSEBs)
requires large quantities of cement. Use of GBFS in the manufacture of CSEBs
decreases the quantity of required cement. From the experimental investigation, it was
found that two locally available soils namely, lateritic soil and lithomargic clay,

128
stabilized by optimum GBFS and a small amount of cement can be effectively used in
the manufacture of CSEBs. These CSEBs can be effectively used in construction as
load bearing walls.
8.2 CONCLUSIONS
Based on the detailed study carried out in this work, following conclusions are drawn:
The optimum percentage replacement of lithomargic clay by granulated blast
furnace slag is 25%.
The unconfined compressive strength increases by 65.9% and 206.9% when
lithomargic clay is replaced by 25% GBFS for 7 days cured samples and 28
days cured samples respectively.
For 7 days and 28 days cured samples, the cohesion increased up to 25%
replacement of soil by GBFS and further decreased at higher percentages (35%
and 45%) of replacement of soil by GBFS. For 7 days cured samples, increase
in cohesion when lithomargic clay is replaced by 25% GBFS is found to be
156.5% (i.e. 23kPa to 59kPa), whereas at 28 days curing, it is 260.9% (23kPa
to 83kPa).
The friction angle increases for all percentages of replacement of lithomargic
clay by GBFS. At 7 days curing, frictional angle increased from 19°to 27.5°when
soil is replaced by 25% GBFS and increase is found to be from 19°to 29° for 28
days cured samples.
Large improvement in unconfined compressive strength is observed due to
cement stabilization. For lithomargic clay stabilized by the addition of 8%
cement, percentage improvement in unconfined compressive strength is
235.7%.
With addition of 4% cement to soil + optimum GBFS mix, the cohesion and
frictional angle increases. At 28days curing period, the cohesion and friction
angle values improved by 361% and 48.2% respectively with addition of 4%
cement to 75% soil + 25% GBFS mix.
From SEM studies, it is concluded that there is reduction of void/pore spaces
due to the accumulation of cementitious matrix. This resulted in the change in

129
morphology of the material through pozzolanic and hydration reaction products.
Hence, improvement in strength is observed.
From EDS analysis, it is concluded that the strength improvement is achieved
with the increase in Ca:Si and decrease in Al:Ca ratios when lithomargic clay is
stabilized using GBFS and cement.
XRD studies revealed that the compounds such as CASH, CSHH, CAOH,
gyrolite, gismondine are responsible in binding the soil particles together to
form a hardened skeleton matrix.
From load settlement analysis, it is concluded that the net allowable pressure
increases with increase in the depth of stabilized area below the footing. For 2m
wide strip footing (B=2m), net allowable pressure increases by 91.1% when 1B
depth soil below the footing is replaced by 75% soil + 25% GBFS mix with
addition of 4% cement. Improvement is 194.6% when depth of stabilized area
is 2B below the footing.
From stability analysis of an embankment slope, improvement in FoS is
observed (for all slopes angles and slope heights) by stabilization using GBFS
and cement. For H=10m and i=60°, there is an improvement of 91.6% when
embankment of stabilized soil (75% soil + 25% GBFS with addition of 2%
cement) resting on lithomargic clay and 261% when embankment of stabilized
soil resting on H/2 depth of stabilized soil (75% soil + 25% GBFS with addition
of 2% cement).
Compressed Stabilized Earth Blocks (CSEBs) prepared using 75% lithomargic
clay + 25% GBFS with addition of 10% cement are suitable for the construction
of load bearing walls.
Compressed Stabilized Earth Blocks (CSEBs) prepared using 80% lateritic soil
+ 20% GBFS with addition of 6% cement are suitable for the construction of
load bearing walls.
8.3 LIMITATIONS OF PRESENT WORK
In this study, the effect of stabilization was investigated considering curing periods as
28 days. Due to pozzolanic reactions, there is considerable improvement in strength

130
properties up to curing periods of 28 days. However, beyond 28 days further possible
increase in strength is not investigated.
8.4 SCOPE FOR FUTURE WORK
To study the effect of GBFS in stabilization of different soils like marine clay,
red earth etc.
To study the activation of GBFS with other additives such as lime, alkali
activators like NaOH etc.

131
REFERENCES
Al-Mukhtar, M., Khattab, S. and Alcover, J.F. (2012). “Microstructure and
geotechnical properties of lime-treated expansive clayey soil.” Engineering Geology
139-140, 17–27.
Athulya, G. K., Dutta, S. and Mandal, J.N. (2016). “Performance evaluation of
stabilised soil–slag mixes as highway construction material.” International Journal of
Geotechnical Engineering, 11 (1), 51-61.
Bahar,R., Benazzoug,M. and Kenai,S. (2004). “Performance of compacted cement-
stabilised soil.” Cement and Concrete Composites, 26, 811–820.
Chew, S.H., Kamruzzaman, A.H.M. and Lee, F.H. (2004). “Physicochemical and
engineering behavior of cement treated clays.” Journal of Geotechnical and
Geoenvironmental Engineering, 130 (7), 696-706.
Cokca, E., Yazici, V. and Ozaydin, V. (2009). “Stabilization of expansive clays using
granulated blastfurnace slag (gbfs) and gbfs-cement.” Geotechnical and Geological
Engineering, 27, 489–499.
Cristelo, N., Glendinning, S., Fernandes, L. and Pinto, A.T. (2013). “Effects of alkaline-
activated fly ash and Portland cement on soft soil stabilization.” Acta Geotechnica, 8,
395–405.
Dash, S.K. and Hussain, M. (2012). “Lime stabilization of soils: reappraisal.” Journal
of Materials in Civil Engineering, 24(6), 707-714.
Dermatas, D. and Meng, X. (2003). “Utilization of fly ash for
stabilization/solidification of heavy metal contaminated soils.” Engineering Geology,
70, 377-394.
El-Garhy, B. and Elsawy, M. (2017). “Effect of different parameters on the behavior of
strip footing resting on weak soil improved by granular piles.” Geo-Engineering, 8(4).

132
Goodarzi, A.R. and Salimi, M. (2015). “Stabilization treatment of a dispersive clayey
soil using granulated blastfurnace slag and basic oxygen furnace slag.” Applied Clay
Science, 108, 61–69.
Gruskovnjak, A., Lothenbach, B., Holzer, L., Figi, R. and Winnefeld, F. (2006).
“Hydration of alkali-activated slag: comparison with ordinary Portland cement.”
Advances in cement research, 18(3), 119-128.
Hegde, R. A. and Daware, S.N (2010). “Effect of alternate wetting and drying on
laterite and their engineering behaviour, Indian Geotechnical Conference, GEOtrendz,
321-324.
Higgins, D. D., (2007). “GGBS and sustainability.” Construction Materials., 160 (3),
99–101.
Higgins, D.D. (2005). “Soil stabilisation with ground granulated blastfurnace slag.” UK
Cementitious Slag Makers Association (CSMA).
Holliday,L., Ramseyer,C., Reyes,M. and Butko,D. (2016).”Building with compressed
earth block within the building code.” Journal of Architecture Engineering, 22 (3).
Horpibulsuk, S., Rachan, R., Chinkulkijniwat, A., Raksachon, Y. and Suddeepong, A.
(2010). “Analysis of strength development in cement-stabilized silty clay from
microstructural considerations.” Construction and Building Materials, 24, 2011–2021.
Indian Minerals Yearbook (2015) Part-II: Metals and alloys 54th edition Slag-Iron and
Steel Government of India Minerals of mines Indian Bureau of Mines.
James, J.,Pandian, P.K., Deepika,K., Venkatesh, J.M., Manikandan, V. and
Manikumaran, P. (2016). “Cement stabilized soil blocks admixed with sugarcane
bagasse ash.” Journal of Engineering, vol. 2016.
Jaritngami, S., Somchainuek, O. and Tannerananoni, P. (2014). “Feasibility of laterite-
cement mixture as pavement base course aggregate.” International Journal of Science
and Technology, Transactions of Civil Engineering, 38, 275-284.
133
Jayanthi, P.N.V. and Singh, D.N. (2016). “Utilization of sustainable materials for soil
stabilization: state-of-the-art.” Advances in Civil Engineering Materials, ASTM, 5 (1),
46-79.
Jha, A.K. and Sivapullaiah, P.V. (2014). “Mineralogical and microstructural induced
compressibility behavior of lime stabilized expansive soil.” Kathmandu, Nepal
International Symposium Geohazards: Science, Engineering and Management, 502-
513.
Jha, A.K. and Sivapullaiah, P.V. (2015). “Mechanism of improvement in the strength
and volume change behavior of lime stabilized soil.” Engineering Geology, 198, 53–
64.
Jha, A.K. and Sivapullaiah, P.V. (2015). “Susceptibility of strength development by
lime in gypsiferous soil—A micro mechanistic study.” Applied Clay Science, 115, 39–
50.
Jiang, L., Modmoltin, C., and Onitsuka, K. (2004). “Stabilization effects of surplus soft
clay with cement and gbf slag,” Journal of Environmental Science (China), 16 (3), 397–
403.
Kaniraj, S. R. and Havanagi,V. G. (1999) “Compressive strength of cement stabilized
fly ash-soil mixtures.” Cement and Concrete Research, 29, 673–677.
Kavak, A. and Bilgen, G. (2016). “Reuse of ground granulated blast furnace slag
(ggbfs) in lime stabilized embankment materials” IACSIT International Journal of
Engineering and Technology, 8 (1), 11-14.
Keramatikerman, M., Chegenizadeh, A. and Nikraz, H. (2016). “Effect of GGBFS and
lime binders on the engineering properties of clay.” Applied Clay Science, 132–
133,722–730.
Kim, H.S., Park, J.W., An, Y.J., Bae, J.S. and Han, C. (2011). “Activation of ground
granulated blast furnace slag cement by calcined alunite.” Materials Transactions, 52
(2), 210-218.

134
Kolias, S., Kasselouri-Rigopoulou, V. and Karahalios, A. (2005). “Stabilisation of
clayey soils with high calcium fly ash and cement.” Cement & Concrete Composites,
27, 301–313.
Konsta-Gdoutos, M. S. and Shah, S. P. (2003). “Hydration and properties of novel
blended cements based on cement kiln dust and blast furnace slag.” Cement and
Concrete Research, 33, 1269–1276.
Kumar, B. V., Teja, M. and Kumar, G. K. (2015). “Comparative studies of black cotton
soil with RBI grade 81 and ground granulated blast furnace slag.” 50th Indian
Geotechnical Conference, Pune, Maharashtra.
Kwon,H. M., Le, A. T. and Nguyen, N. T. (2010). “Influence of soil grading on
properties of compressed cement-soil.” KSCE Journal of Civil Engineering, 14(6), 845-
853.
Lizarazo-Marriaga, J., Claisse, P. and Ganjian, E. (2011). “Effect of steel slag and
Portland cement in the rate of hydration and strength of blast furnace slag
pastes.” Journal of Materials in Civil Engineering, 23(2), 153-160.
Manjunath, K.V., Shekhar, H., Kumar, M., Kumar, P. and Kumar, R. (2012).
“Stabilization of black cotton soil using ground granulated blast furnace slag.”
Proceedings of International Conference on Advances in Architecture and Civil
Engineering, Paper ID GET114, 1, 387-390.
Manso, J. M., Lopez, V. O., Polanco J. A. and Setién, J. (2013). “The use of ladle
furnace slag in soil stabilization.” Construction and Building Materials, 40, 126–134.
Mishra, M. K. and Karanam, U. M. R. (2006). “Geotechnical characterization of fly ash
composites for backfilling mine voids.” Geotechnical and Geological Engineering,
24(6), 1749-1765.
Morel, J. C., Pkla, A. and Walker, P. (2007). “Compressive strength testing of
compressed earth blocks.” Construction and Building Materials, 21, 303–309.

135
Muntohar, A. S. (2011). “Engineering characteristics of the compressed-stabilized earth
brick.” Construction and Building Materials, 25, 4215–4220.
Nagaraj, H. B., Rajesh, A. and Sravan, M. V. (2016). “Influence of soil gradation,
proportion and combination of admixtures on the properties and durability of CSEBs.”
Construction and Building Materials, 110, 135–144.
Nagaraj, H. B., Sravan, M. V., Arun, T. G. and Jagadish, K. S. (2014). “Role of lime
with cement in long-term strength of Compressed Stabilized Earth Blocks.”
International Journal of Sustainable Built Environment, 3, 54–61.
Nayak, S. and Padmaja, G. (2006). “Slope stability coefficients for steep homogeneous
soil slopes.” Indian Geotechnical Journal, 36 (4), 373-382.
Nayak, S. and Sarvade, P. G. (2012). “Effect of cement and quarry dust on shear
strength and hydraulic characteristics of lithomargic clay.” Geotechnical and
Geological Engineering, 30, 419–430.
Nontananandh, S., Boonyong, S. and Yoobanpot, T. (2005). “Investigations on reaction
products in soil cement.” GTE–13-16.
http://www.gerd.eng.ku.ac.th/Paper/Paper_Other/NCCE10/GTE03.pdf (27th June
2017).
O¨nera, M., Erdog˘dub, K. and Gu¨nlu, A. (2003). “Effect of components fineness on
strength of blast furnace slag cement.” Cement and Concrete Research, 33, 463–469.
Oner, A. and Akyuz, S. (2007). “An experimental study on optimum usage of GGBS
for the compressive strength of concrete.” Cement and Concrete Composites, 29, 505–
514.
Ornek, M., Demir, A., Laman, M. and Yildiz, A. (2012). “Numerical analysis of
circular footings on natural clay stabilized with a granular fill.” Acta Geotechnica
Slovenica, 1, 61-75.

136
Oti, J. E., Kinuthia, J. M. and Bai, J. (2009). “Unfired clay bricks: from laboratory to
industrial production.” Proceedings of the institution of civil engineers, Engineering
Sustainability 162 (ES4), 229–237, DOI: 10.1680/ensu.2009.162 .4.229.
Oti, J. E., Kinuthia, J. M. and Bai, J. (2009). “Compressive strength and microstructural
analysis of unfired clay masonry bricks.” Engineering Geology, 109, 230–240.
Oti, J. E., Kinuthia, J. M. and Bai, J. (2009). “Engineering properties of unfired clay
masonry bricks, Engineering Geology, 107, 130–139.
Ouf, M. S. (2012). “Effect of using pozzolanic materials on the properties of egyptian
soils.” Life Science Journal, 9(1), 554-560.
Oyelami, C. A. and Van Rooy, J. L. (2016). “Geotechnical characterisation of lateritic
soils from south-western Nigeria as materials for cost-effective and energy-efficient
building bricks.” Environmental Earth Science, 75, 1475.
Pacheco-Torgal, F., Castro-Gomes, J. and Jalali, S. (2008). “Alkali-activated binders:
A review Part 1. Historical background, terminology, reaction mechanisms and
hydration products.” Construction and Building Materials, 22, 1305–1314.
Pathak, A. K., Pandey, V., Murari, K. and Singh, J. P. (2014). “Soil stabilisation using
ground granulated blast furnace slag.” International Journal of Engineering Research
and Applications, 4 (5), 164-171.
Rabbani, P., Daghigh, Y., Atrechian, M. R., Karimi, M. and Tolooiyan, A. (2012). “The
potential of lime and grand granulated blast furnace slag (ggbfs) mixture for
stabilisation of desert silty sands.” Journal of Civil Engineering Research, 2 (6), 108-
119.
Rahman, M.Z. (2012). “Slope stability analysis and road safety evaluation.” Master’s
thesis submitted to Division of Mining & Geotechnical Engineering Department of
Civil, Luleå University of Technology (LTU), Luleå, Sweden.

137
Ramesh, H. N. and Venkataraja Mohan, S. D. (2011). “Compaction characteristics of
alkalis treated expansive and non expansive soil contaminated with acids.” Proceedings
of Indian Geotechnical Conference, Kochi (Paper No. L-254), 733-736.
Ramesh, H. N., Nanda, H. S. and Manoj Krishna, K.V. (2009). “Effect of sodium salts
on the shrinkage characteristics of lime treated and neyveli fly ash treated shedi soil.”
Indian Geotechnical Conference, Guntur, India, 459-461.
Ramesh, H. N., Nanda, H. S. and Manoj Krishna, K.V. (2011). “Effect of soaking on
the strength behaviour of shedi soil treated with nfa.” Proceedings of Indian
Geotechnical Conference, Kochi, (Paper No. L-295), 753-754.
Ramesh, H. N., Nanda, H. S. and Manoj Krishna, K.V. (2013). “Effect of sodium
sulphate on the index properties and compaction behaviour of neyveli fly ash- shedi
soil mixtures.” IOSR Journal of Mechanical and Civil Engineering, 6 (3), 56-62.
Ramirez, R. A., Garcia, P. M., Reyes, J. M., Juarez, D. C. A. and Ponce, Y. G. (2012).
“The use of sugarcane bagasse ash and lime to improve the durability and mechanical
properties of compacted soil blocks.” Construction and Building Materials, 34, 296–
305.
Ravi Shankar, A. U. and Suresha, S. N. (2006). “Strength behaviour of geogrid
reinforced shedi soil subgrade and aggregate system.” Road Materials and Pavement
Design, 7(3), 313-330.
Ravi Shankar, A. U., Prashanth, S. K. and Chandrashekar, A. (2013). “Geotechnical
investigation of shedi soil blended with pond ash, lime and coir.” Indian Highways,
41(1), 60-72.
Reddy, B. V. V. and Kumar, P. P. (2011). “Cement stabilised rammed earth. Part B:
compressive strength and stress–strain characteristics.” Materials and Structures, 44,
695–707.
Reddy, B. V. V., Lal, R. and Rao, K. S. N. (2007). “Enhancing bond strength and
characteristics of soil-cement block masonry.” Journal of Materials in Civil
Engineering, 19(2), 164-172.

138
Sarvade, P. G. and Nayak, S. (2014). Studies on the utilization of quarry dust to improve
the geotechnical properties of lithomargic clay.” International Journal of Advanced
Structures and Geotechnical Engineering, 03 (1), 54-59.
Sharma, A. K. and Sivapullaiah, P. V. (2012). “Improvement of strength of expansive
soil with waste granulated blast furnace slag.” International proceedings of
GeoCongress ASCE, 3920-3928.
Sharma, A. K. and Sivapullaiah, P. V. (2016). “Ground granulated blast furnace slag
amended fly ash as an expansive soil stabilizer.” Soils and Foundations, 56(2), 205–
212.
Sharma, A. K. and Sivapullaiah, P. V. (2011). “Soil stabilisation with waste materials
based binder.” Proceedings of Indian Geotechnical Conference, Kochi, (Paper No. H-
119) 413-416.
Sharma, A. K. and Sivapullaiah, P. V. (2016). “Compressibility and deformation
studies of compacted fly ash/GGBS mixtures.” Proceedings of the 17th Nordic
Geotechnical Meeting Challenges in Nordic Geotechnic.
Sharma, A. K. and Sivapullaiah, P. V. (2016). “Fly ash and ggbs mixtures for
geotechnical and geo-environmental applications.” Geo-Chicago, GSP 272, 121-130.
Sharma, A. K. and Sivapullaiah, P. V. (2016). “Strength development in fly ash and
slag mixtures with lime.” Ground Improvement, 169, GI3, 194–205.
Sharma, N. K., Swain, S. K. and Sahoo, U. C. (2012). “Stabilization of a clayey soil
with fly ash and lime: a micro level investigation.” Geotechnical and Geological
Engineering, 30, 1197–1205.
Shruthi, P. J. and Kishor Kumar, B. R. (2015). “Study on behaviour of lithomargic clay
with various admixtures.” International Journal for Research in Applied Science and
Engineering Technology, 3 (2), 126-133.

139
Singh, S. P., Tripathy, D. P. and Ranjith, P. G. (2008). “Performance evaluation of
cement stabilized fly ash–GBFS mixes as a highway construction material.” Waste
Management 28, 1331–1337.
Sivapullaiah, P. V. (2013). “Use of solid waste to enhance properties of problematic
soils of Karnataka.” Report on Research Project to CiSTUP, IISc. Bangalore.
Sivrikaya, O., Yavascan, S., and Cecen, E. (2014). “Effects of ground granulated
blastfurnace slag on the index and compaction parameters of clayey soils.” Acta
Geotechnica Slovenica, 1, 19-27.
Song, S., Sohn, D., Jennings, H. M. and Mason, T. O. (2000). “Hydration of alkali-
activated ground granulated blast furnace slag.” Journal of Materials Science, 35, 249–
257.
Suganya, K. and Sivapullaiah, P. V. (2013). “Mechanisms of binder interactions and
their role in strengthening Kuttanad clay.” Proceedings of the 18th International
Conference on Soil Mechanics and Geotechnical Engineering, Paris.
Suresh, P. S. P., Kumar, P. and Rajasekhar, K. (2009). “Laboratory investigation of
shedi soil stabilized with pond ash and coir.” Indian Geotechnical Conference, Guntur,
India, 428-430.
Swamy, R., Sarvade, P. G. and Nayak, D. (2015). “Utilization of ggbs and lime to
improve the compaction and unconfined strength properties of marine clay.” Asian
Journal of Engineering and Technology, 3 (4), 424-429.
Taallah, B., Guettala, A., Guettala, S. and Kriker, A. (2014). “Mechanical properties
and hygroscopicity behavior of compressed earth block filled by date palm fibers.”
Construction and Building Materials, 59, 161–168.
Takhelmayum, G., Savitha, A. L. and Gudi, K. (2013). “Experimental studies on soil
stabilization using fine and coarse ggbs.” International Journal of Emerging
Technology and Advanced Engineering, 3 (3), 917-921.

140
Tripura, D. D. and Singh, K. D. (2015). “Characteristic properties of cement-stabilized
rammed earth blocks.” Journal of Materials in Civil Engineering, 27 (7).
Veith, G. (2000). “Green, ground and great: soil stabilization with slag.” Building
Research and Information, 28 (1), 70-72.
Walker, P. and Stace, T. (1997). “Properties of some cement stabilised compressed
earth blocks and mortars.” Materials and Structures, 30, 545-551.
Walker, P. J. (1995). “Strength, Durability and shrinkage characteristics of cement
stabilised soil blocks.” Cement & Concrete Composites, 17, 301-310.
Wild, S., Kinuthia, J. M., Jones, G. I. and Higgins, D. D. (1998). “Effects of partial
substitution of lime with ground granulated blast furnace slag (GGBS) on the strength
properties of lime-stabilised sulphate-bearing clay soils.” Engineering Geology, 51, 37–
53.
Wild, S., Kinuthia, J. M., Robinson, R. B. and Humphreys, I. (1996). “Effects of ground
granulated blast furnace slag (ggbs) on the strength and swelling properties of lime-
stabilized kaolinite in the presence of sulphates.” Clay Minerals, 31, 423-433.
Yi, Y., Gu, L. and Liu, S. (2015). “Microstructural and mechanical properties of marine
soft clay stabilized by lime-activated ground granulated blast furnace slag.” Applied
Clay Science, 103, 71–76.
Yi, Y., Li, C. and Liu, S. (2014). “Alkali-activated ground-granulated blast furnace slag
for stabilization of marine soft clay.” Journal of Materials in Civil Engineering, 27 (4),
1-7.
Yi, Y., Liska, M. and Tabbaa, A. A. (2014). “Properties of two model soils stabilized
with different blends and contents of GGBS, MgO, Lime, and PC.” Journal of
Materials in Civil Engineering, 26 (2), 267-274.
Yi, Y., Zhenga, X., Liu, S. and Al-Tabbaa, A. (2015). “Comparison of reactive
magnesia- and carbide slag-activated ground granulated blast furnace slag and Portland
cement for stabilisation of a natural soil.” Applied Clay Science, 111, 21–26.

141
LIST OF PUBLICATIONS
Sekhar, D. C., Nayak, S. and Preetham, H. K. (2017). “Influence of granulated blast
furnace slag and cement on the strength properties of lithomargic clay.” Indian
Geotechnical Journal, 47(3), 384-392, DOI:10.1007/s40098-017-0228-8.
Sekhar, D. C. and Nayak, S. (2017). “SEM and XRD investigations on lithomargic clay
stabilized using granulated blast furnace slag and cement.” International Journal of
Geotechnical Engineering, DOI:10.1080/19386362.2017.1380355.
Sekhar, D. C., Nayak, S., Reva Venu, V. M. and Preetham, H. K. (2017). “Investigation
on granulated blast furnace slag as an effective stabilizer for lithomargic clay.”
International Conference on Geotechniques for Infrastructure Projects, 27th and 28th
February, Thiruvananthapuram, Kerala, India.
Sekhar, D. C. and Nayak, S. “Utilization of granulated blast furnace slag and cement in
the manufacture of compressed stabilized earth blocks”. Construction and Building
Materials, Elsevier publications. Under Review [Manuscript no. CONBUILDMAT-D-
17-02175].

142

143
CURRICULUM VITAE
DARSHAN C SEKHAR
#320, 1st cross, C.T.Bed,
Thyagarajanagar 3rd Block,
Bangalore-560028
Email: [email protected]
Mobile: +91-9663876959
Education:
Qualification Institution University/Board Aggregate
Ph.D.
(Geotechnical
Engineering)
National Institute of
Technology,
Karnataka,
Surathkal, Mangalore
NITK, Surathkal
(2017) -
M.E.
(Geotechnical
Engineering)
University
Visvesvaraya
College of
Engineering,
Bangalore
UVCE, Bangalore University
(2013) Distinction
B.E. (Civil
Engineering)
Global Academy of
Technology,
Bangalore
Visvesvaraya Technological
University (2011)
First Class
with
Distinction
12th (PUC)
Vijaya Composite
PU College,
Bangalore
Board of Pre-University
Education, Karnataka (2007) First Class
10th (SSLC) Vijaya High School,
Bangalore
Karnataka Secondary
Education Examination
Board (2005)
Distinction
Work Experience:
Currently working as assistant professor in the department of civil engineering at The
National Institute of Engineering, Mysore. Previously worked in a BRNS research
project titled “Development of Probabilistic design and analysis procedures in
radioactive waste disposal in NSDF and design of NSDF closure” as Senior Research
Fellow from December 2013 to July 2014 at department of Civil Engineering, Indian
Institute of Science, Bangalore under the supervision of Prof. G.L. Sivakumar Babu.