Unconfined Compressive Strength of Compacted Disturbed ... · Unconfined Compressive Strength of...
10
ORIGINAL ARTICLE Unconfined Compressive Strength of Compacted Disturbed Cement-Stabilized Soft Clay Mohamed Ayeldeen 1 • Yuki Hara 2 • Masaki Kitazume 2 • Abdelazim Negm 3 Received: 26 May 2016 / Accepted: 19 July 2016 / Published online: 26 September 2016 Ó Springer International Publishing Switzerland 2016 Abstract Pneumatic flow mixing method is a new land reclamation method, developed in Japan to meet the per- sistent lack of space. In this method dredged soft soil is mixed with a small amount of stabilizing material (such as cement) during transporting the soft soil in a pipe using compressed air to be used for land reclamation. In some cases, the soil/cement mixture is stored in temporary place for days and then transported and compacted at the required place. Basically, the cement chemical reaction starts immediately after the mixing with the soft soil and the mixture starts to gain its strength, therefore disturbing the mixture after days from the mixing influences the mixture strength. However, the soil/cement mixture is still able to gain extra strength after disturbance, transportation, and compaction. This study aims to evaluate the effect of dynamic compaction on the shear strength of disturbed cemented soft soil mixture experimentally. The mixture was fully disturbed after one week from mixing with cement. Three cement/soil ratios were used in this study under different dynamic compaction energies. Unconfined compression test was conducted at various curing times for both disturbed and non-disturbed specimens. Keywords Pneumatic flow mixing Stabilized soft clay Compaction Unconfined compressive strength Soil disturbance List of Symbols aw Cement ratio E 50 Modulus of deformation t Curing time q un Unconfined compressive strength q un_Non Unconfined compressive strength for non- disturbed cemented clay q un_Non_t Unconfined compressive strength for non- disturbed cemented clay at curing time t q un_D Unconfined compressive strength for disturbed cemented clay q un_D_T Unconfined compressive strength for disturbed cemented clay without compaction q un_D_T_t Unconfined compressive strength for disturbed cemented clay without compaction at curing time t q un_D_comp Unconfined compressive strength for compacted disturbed cemented clay q un_D_comp_t Unconfined compressive strength for compacted disturbed cemented clay at curing time i Increasing factor (i=q un_D_comp_t / q un_D_T_28 ) G s Average specific gravity for the specimen c w Water unit weight c t Total unit weight after curing c d Dry unit weight after curing e Void ratio after curing time R 2 Coefficient of determination & Mohamed Ayeldeen [email protected] 1 Structural Engineering Department, Faculty of Engineering, Tanta University, Tanta, Egypt 2 Civil and Environmental Engineering Department, Tokyo Institute of Technology, Tokyo, Japan 3 Civil Engineering Department, Faculty of Engineering, Zagazig University, Zagazig, Egypt 123 Int. J. of Geosynth. and Ground Eng. (2016) 2:28 DOI 10.1007/s40891-016-0064-4
Transcript of Unconfined Compressive Strength of Compacted Disturbed ... · Unconfined Compressive Strength of...
ORIGINAL ARTICLE
Unconfined Compressive Strength of Compacted DisturbedCement-Stabilized Soft Clay
Mohamed Ayeldeen1 • Yuki Hara2 • Masaki Kitazume2 • Abdelazim Negm3
Received: 26 May 2016 / Accepted: 19 July 2016 / Published online: 26 September 2016
� Springer International Publishing Switzerland 2016
Abstract Pneumatic flow mixing method is a new land
reclamation method, developed in Japan to meet the per-
sistent lack of space. In this method dredged soft soil is
mixed with a small amount of stabilizing material (such as
cement) during transporting the soft soil in a pipe using
compressed air to be used for land reclamation. In some
cases, the soil/cement mixture is stored in temporary place
for days and then transported and compacted at the
required place. Basically, the cement chemical reaction
starts immediately after the mixing with the soft soil and
the mixture starts to gain its strength, therefore disturbing
the mixture after days from the mixing influences the
mixture strength. However, the soil/cement mixture is still
able to gain extra strength after disturbance, transportation,
and compaction. This study aims to evaluate the effect of
dynamic compaction on the shear strength of disturbed
cemented soft soil mixture experimentally. The mixture
was fully disturbed after one week from mixing with
cement. Three cement/soil ratios were used in this study
under different dynamic compaction energies. Unconfined
compression test was conducted at various curing times for
both disturbed and non-disturbed specimens.
Keywords Pneumatic flow mixing � Stabilized soft clay �Compaction � Unconfined compressive strength � Soildisturbance
List of Symbols
aw Cement ratio
E50 Modulus of deformation
t Curing time
qun Unconfined compressive strength
qun_Non Unconfined compressive strength for non-
disturbed cemented clay
qun_Non_t Unconfined compressive strength for non-
disturbed cemented clay at curing time t
qun_D Unconfined compressive strength for
disturbed cemented clay
qun_D_T Unconfined compressive strength for
disturbed cemented clay without
compaction
qun_D_T_t Unconfined compressive strength for
disturbed cemented clay without compaction
at curing time t
qun_D_comp Unconfined compressive strength for
compacted disturbed cemented clay
qun_D_comp_t Unconfined compressive strength for
compacted disturbed cemented clay at
curing time
i Increasing factor (i = qun_D_comp_t/
qun_D_T_28)
Gs Average specific gravity for the specimen
cw Water unit weight
ct Total unit weight after curing
cd Dry unit weight after curing
e Void ratio after curing time
R2 Coefficient of determination
& Mohamed Ayeldeen
1 Structural Engineering Department, Faculty of Engineering,
Tanta University, Tanta, Egypt
2 Civil and Environmental Engineering Department, Tokyo
Institute of Technology, Tokyo, Japan
3 Civil Engineering Department, Faculty of Engineering,
Zagazig University, Zagazig, Egypt
123
Int. J. of Geosynth. and Ground Eng. (2016) 2:28
DOI 10.1007/s40891-016-0064-4
Introduction
Soft soil deposits can be found in many places all over the
world especially coastal areas, which are recognized by the
high compressibility and low shear strength. Where it
became essential to find appropriate method to improve the
softy soil characterizations to meet the needed engineering
requirements for construction. One of the new methods
used to improve the soft soil for land reclamation is
pneumatic flow mixing method, which depends on mixing
the dredged soft soil with cement during transporting the
soil through pipes to the construction site [1–4]. However,
in some cases the soil/cement mixture has to be stored in
other place for days and then transported again to the
construction site. In that case the soil/cement mixture
become disturbed, where the cement chemical reaction
already started as soon as the cement has been mixed with
the soil. The disturbance process, which is necessary to
transport the mixture after days to the site, shall change the
mixture behaviour especially after using compaction to
place the mixture in its final site [5].
At the beginning, mixing the clay with cement destroy
the natural clay cementation between the clay particles and
replace that with cement admixed clay. Many investiga-
tions have been done to understand the behaviour of
cement admixed clay under different variables such as
water content, cement ratio, and curing time [6–18]. It was
revealed that the strength and deformation characteriza-
tions are manly depending on the fabric (clay cluster) and
the cementation, while the main role for cementation is to
weld the clay particles together after destroying the natural
cementation. The shear strength increases with increasing
the bond between the particles which depending on dif-
ferent factor such as cement ratio and curing time [6].
For some cases of pneumatic flow mixing method, the
cemented soft clay has to be transported from its initial
place to the construction site after several days. In this case,
disturbing the soil shall breakdown the welding connec-
tions formed between the particles, however another con-
nection shall form again after setting up and compacting
the soil in the final site. Hence the chemical reaction of the
cement already started once the cement has been mixed
with the soil, the efficiency of the connections reformed
after the disturbance is affected by the time period spent
from mixing paste till the disturbance and setting up again.
The longer this period is, the weaker this reformed con-
nection will be. In this study the disturbed period has
chosen to be as long as possible, to represent optimum
reduction of the soil strength after disturbance, where the
chosen period is 7 days from mixing the paste till the
disturbance and the molding. According to the literature,
the cement mixture gains about 65–75 % of its nominated
strength (nominated strength is the strength after 28 curing
days) after 7 days, i.e. the disturbance after 7 days will
breakdown about 65–75 % from the formed connections
[19, 20]. However, even after disturbing the paste, the
pervious cemented formed elements attached to the clay
particles shall still help to increase the final shear strength.
The remaining chemical cement chemical reaction shall
also help in increasing the final shear strength of the paste,
especially with the effect of compaction which will reduce
the gaps between the soil particles and helping the for-
mation of new connections. For soft clay improvement,
normally, the clay mix with medium to high cement ratio.
The mean effective yield stress of the cemented clay is
higher than the confining pressure developed from the
overburden pressure and external loads, therefore the
induced cementation will be the major responsible of the
shear resistance. Thus, using unconfined compression
strength shall be appropriate to study the behaviour of the
compacted cement-stabilized soft clay [7].
This study is an attempt to understand and evaluate the
unconfined compressive strength of compacted disturbed
cement-stabilized soft clay. Three cement/clay ratios were
used in this study (5, 10 and 15 %). Different compaction
energies were used to compact the disturbed soil, while
tapping was used for non-disturbed soil. Unconfined
compression test was performed for both disturbed and
non-disturbed specimens after different curing times.
Artificial Neural network model was developed to correlate
the increasing in compressive stress due to the effect of
compaction energy and curing time.
Materials and Test Procedure
Material Properties and Specimen Preparation
In order to have a clear understanding of the effect of
compaction on the mechanical properties of disturbed
cement-stabilized soft clay, Kaolin clay (wL of 77.5 % and
wP of 30.3 %) and ordinary Portland cement were used in
this study. Kaolin clay was mixed with tap water for one
hour in a vacuum mixer at a water content ratio of 120 %.
Ordinary Portland cement was added after to the slurry at
cement content varying from 5 to 15 %, and both clay
slurry and ordinary Portland cement were mixed for
10 min. Cement content, aw, can be defined as the ratio
between the weight of cement and the weight of clay in dry
case. The paste was then split in two parts (one part for
non-disturbed specimens and the other for disturbed spec-
imens). For non-disturbed specimens, the paste was used
immediately after mixing and molded by tapping in a
28 Page 2 of 10 Int. J. of Geosynth. and Ground Eng. (2016) 2:28
123
plastic mold, 50 mm diameter and 100 mm height at three
layers [21]. Each layer was tapped 100 times to grantee the
homogeneity of the specimens. The non-disturbed speci-
mens were kept in humidity curing chamber and were
tested after 7, 28, 35 and 42 days from mixing the paste.
For disturbed specimens, the paste was kept airtight in
plastic bag for 7 days before it fully disturbed for 5 min in
the mechanical mixer. Specimens were molded in the same
plastic molds as in the non-disturbed case, however various
dynamic compaction energies were used to mold the dis-
turbed specimens. The molds were filled at three layers;
each layer was dynamically compacted by 1 kg cylinder
hummer falling free from a height of 1 m. Different
numbers of blows (5, 10, 20 and 40) were used to compact
each layer to obtain different compaction energies. The
tapping technique was also used to compact disturbed
specimens at compaction energy of zero. The specimens
were kept also in humidity curing chamber and were tested
after 28, 35 and 42 days from the initial mixing.
Test Procedure
Unconfined compressive strengths were obtained using a
strain rate of approximately 1 %/min for all specimens
were obtained—according to ASTM D2166-06-. Correc-
tions to the cross-sectional area were made prior to cal-
culating the compressive stress on the specimen rendering
to the standard. All tests were accomplished three times at
least for each case. Curing time was a fundamental
parameter for understanding the behavior of compacted
disturbed cemented-soft clay; therefore, experimental
schedule was arranged to perform the tests at different time
periods (7, 28, 35, and 42 days) from mixing the clay with
the cement.
Results and Discussion
Effect of Disturbance on the Stress Strain Behaviour
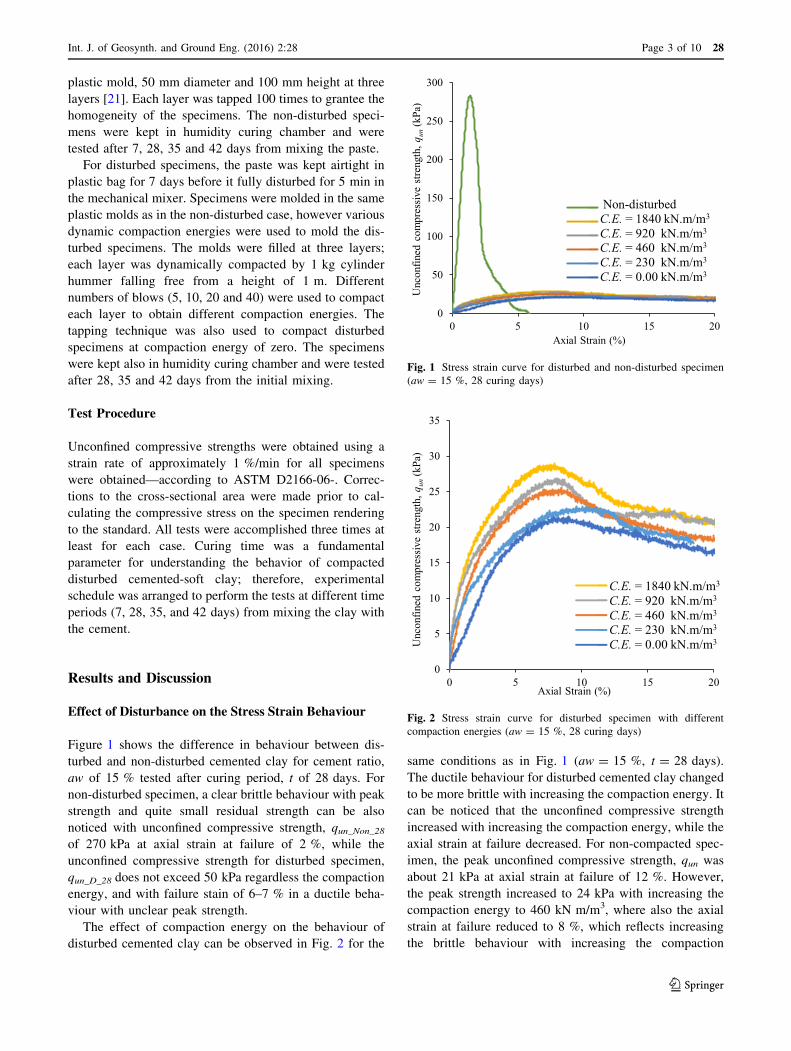
Figure 1 shows the difference in behaviour between dis-
turbed and non-disturbed cemented clay for cement ratio,
aw of 15 % tested after curing period, t of 28 days. For
non-disturbed specimen, a clear brittle behaviour with peak
strength and quite small residual strength can be also
noticed with unconfined compressive strength, qun_Non_28of 270 kPa at axial strain at failure of 2 %, while the
unconfined compressive strength for disturbed specimen,
qun_D_28 does not exceed 50 kPa regardless the compaction
energy, and with failure stain of 6–7 % in a ductile beha-
viour with unclear peak strength.
The effect of compaction energy on the behaviour of
disturbed cemented clay can be observed in Fig. 2 for the
same conditions as in Fig. 1 (aw = 15 %, t = 28 days).
The ductile behaviour for disturbed cemented clay changed
to be more brittle with increasing the compaction energy. It
can be noticed that the unconfined compressive strength
increased with increasing the compaction energy, while the
axial strain at failure decreased. For non-compacted spec-
imen, the peak unconfined compressive strength, qun was
about 21 kPa at axial strain at failure of 12 %. However,
the peak strength increased to 24 kPa with increasing the
compaction energy to 460 kN m/m3, where also the axial
strain at failure reduced to 8 %, which reflects increasing
the brittle behaviour with increasing the compaction
0
50
100
150
200
250
300
0 5 10 15 20
Unc
onfin
ed c
ompr
essiv
e st
reng
th, q
un(k
Pa)
Axial Strain (%)
Non-disturbedC.E.= 1840 kN.m/m3C.E.= 920 kN.m/m3C.E.= 460 kN.m/m3C.E.= 230 kN.m/m3C.E.= 0.00 kN.m/m3
Non-disturbedC.E. = 1840 kN.m/m3
C.E. = 920 kN.m/m3
C.E. = 460 kN.m/m3
C.E. = 230 kN.m/m3
C.E. = 0.00 kN.m/m3
Fig. 1 Stress strain curve for disturbed and non-disturbed specimen
(aw = 15 %, 28 curing days)
0
5
10
15
20
25
30
35
0 5 10 15 20
Unc
onfin
ed c
ompr
essiv
e st
reng
th, q
un(k
Pa)
Axial Strain (%)
C.E. = 1840 kN.m/m3C.E. = 920 kN.m/m3C.E. = 460 kN.m/m3C.E. = 230 kN.m/m3C.E. = 0.00 kN.m/m3
C.E. = 1840 kN.m/m3
C.E. = 920 kN.m/m3
C.E. = 460 kN.m/m3
C.E. = 230 kN.m/m3
C.E. = 0.00 kN.m/m3
Fig. 2 Stress strain curve for disturbed specimen with different
compaction energies (aw = 15 %, 28 curing days)
Int. J. of Geosynth. and Ground Eng. (2016) 2:28 Page 3 of 10 28
123
energy. The brittle behaviour became more clear for
specimen compacted with higher dynamic energy, at
compaction energy of 1840 kN m/m3, the peak unconfined
compressive strength reached 28 kPa with axial strain at
failure of 6 %. Increasing the brittle behaviour can be
explained due to understanding the effect of compaction
energy on the soil unit weight as will be presented in
Fig. 6, where increasing the soil unit weight will reflect as
a reduction in the soil deformation and increasing in the
brittle behaviour.
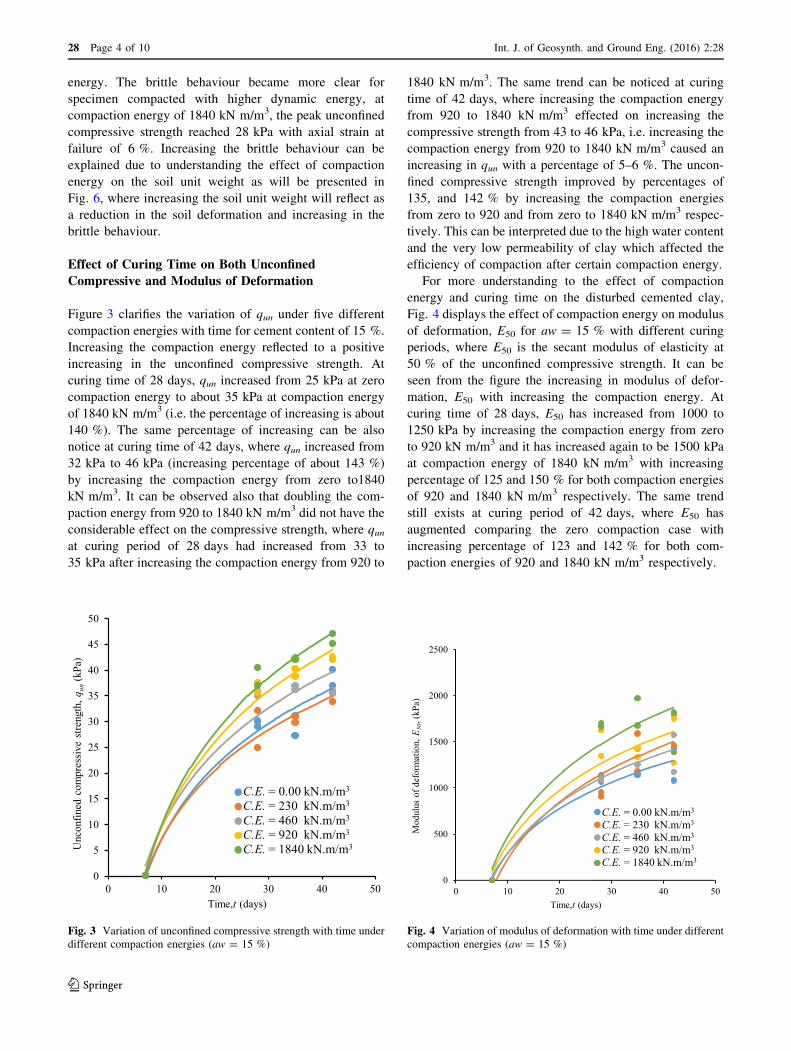
Effect of Curing Time on Both Unconfined
Compressive and Modulus of Deformation
Figure 3 clarifies the variation of qun under five different
compaction energies with time for cement content of 15 %.
Increasing the compaction energy reflected to a positive
increasing in the unconfined compressive strength. At
curing time of 28 days, qun increased from 25 kPa at zero
compaction energy to about 35 kPa at compaction energy
of 1840 kN m/m3 (i.e. the percentage of increasing is about
140 %). The same percentage of increasing can be also
notice at curing time of 42 days, where qun increased from
32 kPa to 46 kPa (increasing percentage of about 143 %)
by increasing the compaction energy from zero to1840
kN m/m3. It can be observed also that doubling the com-
paction energy from 920 to 1840 kN m/m3 did not have the
considerable effect on the compressive strength, where qunat curing period of 28 days had increased from 33 to
35 kPa after increasing the compaction energy from 920 to
1840 kN m/m3. The same trend can be noticed at curing
time of 42 days, where increasing the compaction energy
from 920 to 1840 kN m/m3 effected on increasing the
compressive strength from 43 to 46 kPa, i.e. increasing the
compaction energy from 920 to 1840 kN m/m3 caused an
increasing in qun with a percentage of 5–6 %. The uncon-
fined compressive strength improved by percentages of
135, and 142 % by increasing the compaction energies
from zero to 920 and from zero to 1840 kN m/m3 respec-
tively. This can be interpreted due to the high water content
and the very low permeability of clay which affected the
efficiency of compaction after certain compaction energy.
For more understanding to the effect of compaction
energy and curing time on the disturbed cemented clay,
Fig. 4 displays the effect of compaction energy on modulus
of deformation, E50 for aw = 15 % with different curing
periods, where E50 is the secant modulus of elasticity at
50 % of the unconfined compressive strength. It can be
seen from the figure the increasing in modulus of defor-
mation, E50 with increasing the compaction energy. At
curing time of 28 days, E50 has increased from 1000 to
1250 kPa by increasing the compaction energy from zero
to 920 kN m/m3 and it has increased again to be 1500 kPa
at compaction energy of 1840 kN m/m3 with increasing
percentage of 125 and 150 % for both compaction energies
of 920 and 1840 kN m/m3 respectively. The same trend
still exists at curing period of 42 days, where E50 has
augmented comparing the zero compaction case with
increasing percentage of 123 and 142 % for both com-
paction energies of 920 and 1840 kN m/m3 respectively.
0
5
10
15
20
25
30
35
40
45
50
0 10 20 30 40 50
Unc
onfin
ed c
ompr
essiv
e st
reng
th, q
un(k
Pa)
Time,t (days)
C.E. = 0.00 kN.m/m3C.E. = 230 kN.m/m3C.E. = 460 kN.m/m3C.E. = 920 kN.m/m3C.E. = 1840 kN.m/m3
C.E. = 0.00 kN.m/m3
C.E. = 230 kN.m/m3
C.E. = 460 kN.m/m3
C.E. = 920 kN.m/m3
C.E. = 1840 kN.m/m3
Fig. 3 Variation of unconfined compressive strength with time under
different compaction energies (aw = 15 %)
0
500
1000
1500
2000
2500
0 10 20 30 40 50
Mod
ulus
of d
efor
mat
ion,
E50
, (kP
a)
Time,t (days)
C.E. = 0.00 kN.m/m3C.E. = 230 kN.m/m3C.E. = 460 kN.m/m3C.E. = 920 kN.m/m3C.E. = 1840 kN.m/m3
C.E. = 0.00 kN.m/m3
C.E. = 230 kN.m/m3
C.E. = 460 kN.m/m3
C.E. = 920 kN.m/m3
C.E. = 1840 kN.m/m3
Fig. 4 Variation of modulus of deformation with time under different
compaction energies (aw = 15 %)
28 Page 4 of 10 Int. J. of Geosynth. and Ground Eng. (2016) 2:28
123
Relationship Between Unconfined Compressive
Strength and Modulus of Deformation for Both
Disturbed and Non-Disturbed Specimens
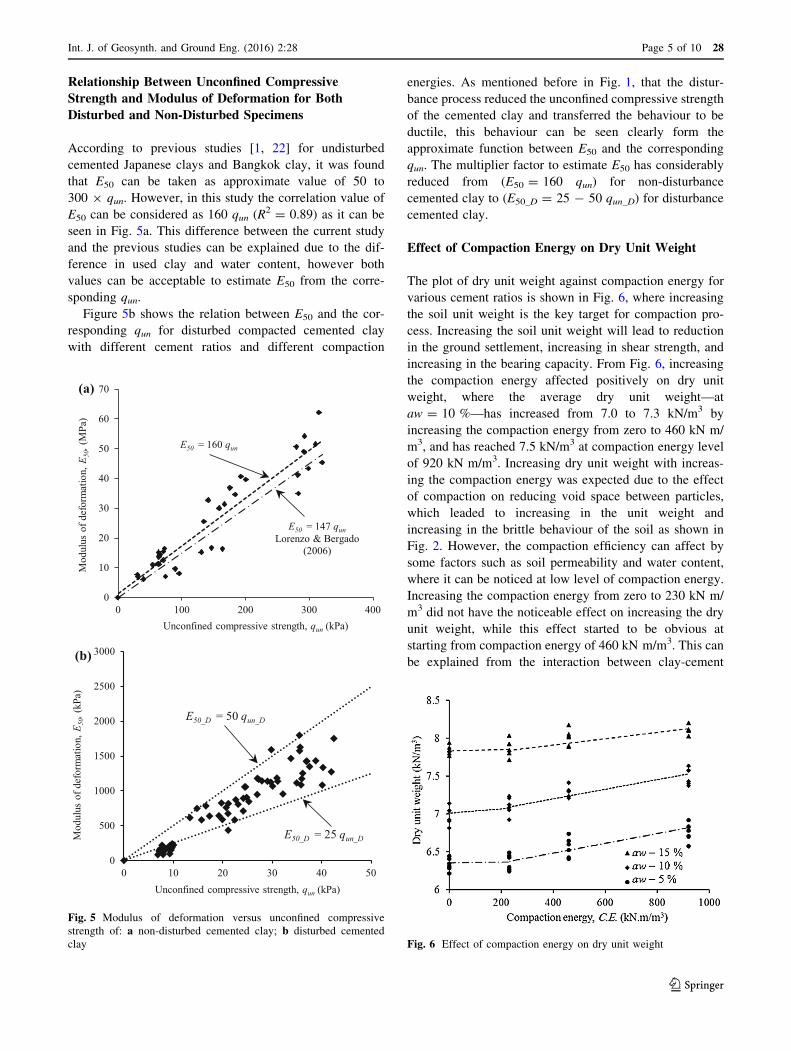
According to previous studies [1, 22] for undisturbed
cemented Japanese clays and Bangkok clay, it was found
that E50 can be taken as approximate value of 50 to
300 9 qun. However, in this study the correlation value of
E50 can be considered as 160 qun (R2 = 0.89) as it can be
seen in Fig. 5a. This difference between the current study
and the previous studies can be explained due to the dif-
ference in used clay and water content, however both
values can be acceptable to estimate E50 from the corre-
sponding qun.
Figure 5b shows the relation between E50 and the cor-
responding qun for disturbed compacted cemented clay
with different cement ratios and different compaction
energies. As mentioned before in Fig. 1, that the distur-
bance process reduced the unconfined compressive strength
of the cemented clay and transferred the behaviour to be
ductile, this behaviour can be seen clearly form the
approximate function between E50 and the corresponding
qun. The multiplier factor to estimate E50 has considerably
reduced from (E50 = 160 qun) for non-disturbance
cemented clay to (E50_D = 25 - 50 qun_D) for disturbance
cemented clay.
Effect of Compaction Energy on Dry Unit Weight
The plot of dry unit weight against compaction energy for
various cement ratios is shown in Fig. 6, where increasing
the soil unit weight is the key target for compaction pro-
cess. Increasing the soil unit weight will lead to reduction
in the ground settlement, increasing in shear strength, and
increasing in the bearing capacity. From Fig. 6, increasing
the compaction energy affected positively on dry unit
weight, where the average dry unit weight—at
aw = 10 %—has increased from 7.0 to 7.3 kN/m3 by
increasing the compaction energy from zero to 460 kN m/
m3, and has reached 7.5 kN/m3 at compaction energy level
of 920 kN m/m3. Increasing dry unit weight with increas-
ing the compaction energy was expected due to the effect
of compaction on reducing void space between particles,
which leaded to increasing in the unit weight and
increasing in the brittle behaviour of the soil as shown in
Fig. 2. However, the compaction efficiency can affect by
some factors such as soil permeability and water content,
where it can be noticed at low level of compaction energy.
Increasing the compaction energy from zero to 230 kN m/
m3 did not have the noticeable effect on increasing the dry
unit weight, while this effect started to be obvious at
starting from compaction energy of 460 kN m/m3. This can
be explained from the interaction between clay-cement
0
10
20
30
40
50
60
70
0 100 200 300 400
Mod
ulus
of d
efor
mat
ion,
E50
,(M
Pa)
Unconfined compressive strength, qun (kPa)
E50 = 147 qunLorenzo & Bergado
(2006)
E50 = 160 qun
0
500
1000
1500
2000
2500
3000
0 10 20 30 40 50
Mod
ulus
of d
efor
mat
ion,
E50
,(kP
a)
Unconfined compressive strength, qun (kPa)
E50_D = 50 qun_D
E50_D = 25 qun_D
(a)
(b)
Fig. 5 Modulus of deformation versus unconfined compressive
strength of: a non-disturbed cemented clay; b disturbed cemented
clay Fig. 6 Effect of compaction energy on dry unit weight
Int. J. of Geosynth. and Ground Eng. (2016) 2:28 Page 5 of 10 28
123
clusters and water inside the soil gaps. When cement mixed
with soft clay, cement and clay particles group together to
form a large clay-cement clusters, reducing the soil per-
meability [23]. Where low compaction energies (less than
230 kN m/m3) are not enough to push the water trapped
inside the soil matrixes to get outside, which will reduce
the pore holes’ size and increase the unit weight. While for
high compaction energies (more than 230 kN m/m3),
increasing the compaction energy will increase the amount
of water expels from inside the soil pore holes, which will
increase the soil unit weight as well. Cement content
affected the dry unit weight, where increasing the cement
content was followed by raising in the dry unit weight. Dry
unit weight increased from 6.7 to 7.5 kN/m3 by increasing
aw from 5 to 10 %, and to 8.1 kN/m3 at aw of 15 %. This
can be explained due to increasing the cemented poz-
zolanic formations inside the soil gaps, which increased by
increasing the cement ratio.
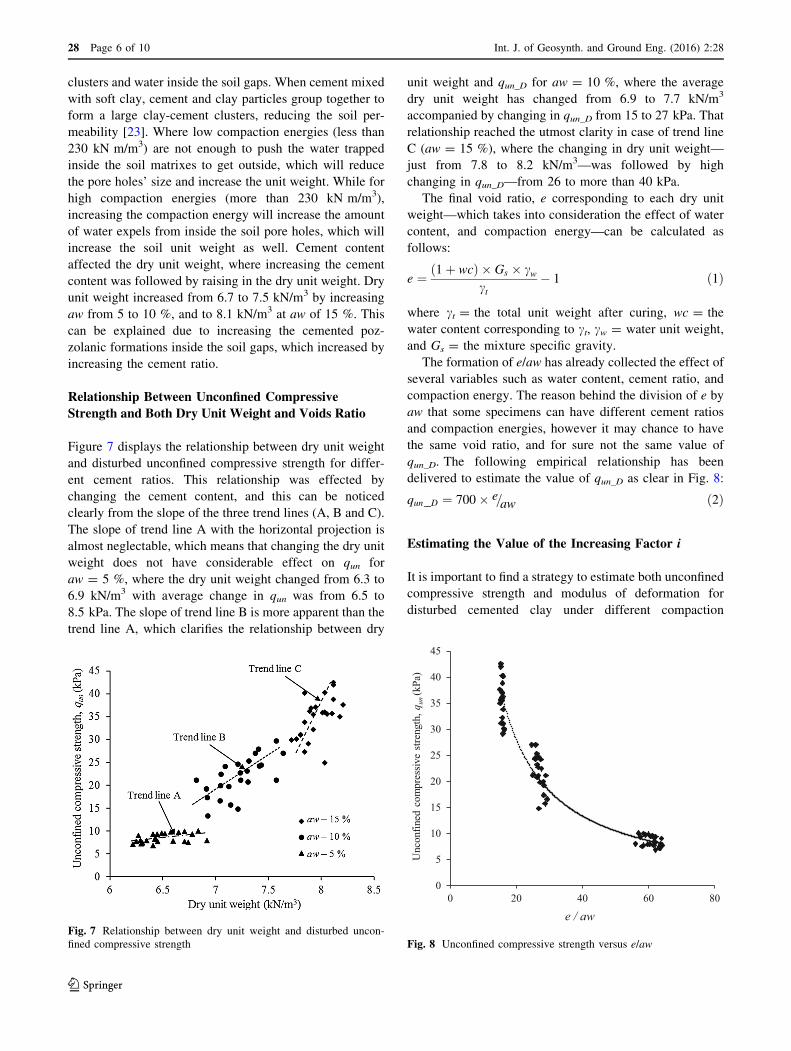
Relationship Between Unconfined Compressive
Strength and Both Dry Unit Weight and Voids Ratio
Figure 7 displays the relationship between dry unit weight
and disturbed unconfined compressive strength for differ-
ent cement ratios. This relationship was effected by
changing the cement content, and this can be noticed
clearly from the slope of the three trend lines (A, B and C).
The slope of trend line A with the horizontal projection is
almost neglectable, which means that changing the dry unit
weight does not have considerable effect on qun for
aw = 5 %, where the dry unit weight changed from 6.3 to
6.9 kN/m3 with average change in qun was from 6.5 to
8.5 kPa. The slope of trend line B is more apparent than the
trend line A, which clarifies the relationship between dry
unit weight and qun_D for aw = 10 %, where the average
dry unit weight has changed from 6.9 to 7.7 kN/m3
accompanied by changing in qun_D from 15 to 27 kPa. That
relationship reached the utmost clarity in case of trend line
C (aw = 15 %), where the changing in dry unit weight—
just from 7.8 to 8.2 kN/m3—was followed by high
changing in qun_D—from 26 to more than 40 kPa.
The final void ratio, e corresponding to each dry unit
weight—which takes into consideration the effect of water
content, and compaction energy—can be calculated as
follows:
e ¼ 1þ wcð Þ � Gs � cwct
� 1 ð1Þ
where ct = the total unit weight after curing, wc = the
water content corresponding to ct, cw = water unit weight,
and Gs = the mixture specific gravity.
The formation of e/aw has already collected the effect of
several variables such as water content, cement ratio, and
compaction energy. The reason behind the division of e by
aw that some specimens can have different cement ratios
and compaction energies, however it may chance to have
the same void ratio, and for sure not the same value of
qun_D. The following empirical relationship has been
delivered to estimate the value of qun_D as clear in Fig. 8:
qun D ¼ 700� e=aw ð2Þ
Estimating the Value of the Increasing Factor i
It is important to find a strategy to estimate both unconfined
compressive strength and modulus of deformation for
disturbed cemented clay under different compaction
Fig. 7 Relationship between dry unit weight and disturbed uncon-
fined compressive strength
0
5
10
15
20
25
30
35
40
45
0 20 40 60 80
Unc
onfin
ed c
ompr
essiv
e st
reng
th, q
un(k
Pa)
e / aw
Fig. 8 Unconfined compressive strength versus e/aw
28 Page 6 of 10 Int. J. of Geosynth. and Ground Eng. (2016) 2:28
123
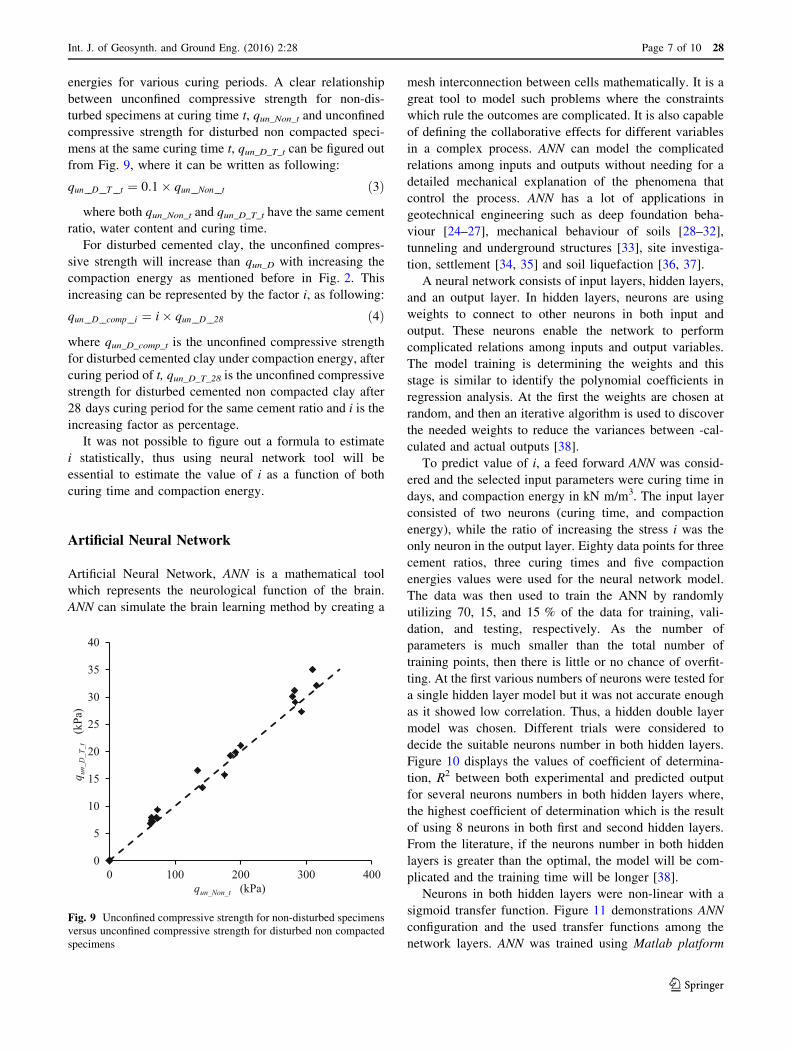
energies for various curing periods. A clear relationship
between unconfined compressive strength for non-dis-
turbed specimens at curing time t, qun_Non_t and unconfined
compressive strength for disturbed non compacted speci-
mens at the same curing time t, qun_D_T_t can be figured out
from Fig. 9, where it can be written as following:
qun D T t ¼ 0:1� qun Non t ð3Þ
where both qun_Non_t and qun_D_T_t have the same cement
ratio, water content and curing time.
For disturbed cemented clay, the unconfined compres-
sive strength will increase than qun_D with increasing the
compaction energy as mentioned before in Fig. 2. This
increasing can be represented by the factor i, as following:
qun D comp i ¼ i� qun D 28 ð4Þ
where qun_D_comp_t is the unconfined compressive strength
for disturbed cemented clay under compaction energy, after
curing period of t, qun_D_T_28 is the unconfined compressive
strength for disturbed cemented non compacted clay after
28 days curing period for the same cement ratio and i is the
increasing factor as percentage.
It was not possible to figure out a formula to estimate
i statistically, thus using neural network tool will be
essential to estimate the value of i as a function of both
curing time and compaction energy.
Artificial Neural Network
Artificial Neural Network, ANN is a mathematical tool
which represents the neurological function of the brain.
ANN can simulate the brain learning method by creating a
mesh interconnection between cells mathematically. It is a
great tool to model such problems where the constraints
which rule the outcomes are complicated. It is also capable
of defining the collaborative effects for different variables
in a complex process. ANN can model the complicated
relations among inputs and outputs without needing for a
detailed mechanical explanation of the phenomena that
control the process. ANN has a lot of applications in
geotechnical engineering such as deep foundation beha-
viour [24–27], mechanical behaviour of soils [28–32],
tunneling and underground structures [33], site investiga-
tion, settlement [34, 35] and soil liquefaction [36, 37].
A neural network consists of input layers, hidden layers,
and an output layer. In hidden layers, neurons are using
weights to connect to other neurons in both input and
output. These neurons enable the network to perform
complicated relations among inputs and output variables.
The model training is determining the weights and this
stage is similar to identify the polynomial coefficients in
regression analysis. At the first the weights are chosen at
random, and then an iterative algorithm is used to discover
the needed weights to reduce the variances between -cal-
culated and actual outputs [38].
To predict value of i, a feed forward ANN was consid-
ered and the selected input parameters were curing time in
days, and compaction energy in kN m/m3. The input layer
consisted of two neurons (curing time, and compaction
energy), while the ratio of increasing the stress i was the
only neuron in the output layer. Eighty data points for three
cement ratios, three curing times and five compaction
energies values were used for the neural network model.
The data was then used to train the ANN by randomly
utilizing 70, 15, and 15 % of the data for training, vali-
dation, and testing, respectively. As the number of
parameters is much smaller than the total number of
training points, then there is little or no chance of overfit-
ting. At the first various numbers of neurons were tested for
a single hidden layer model but it was not accurate enough
as it showed low correlation. Thus, a hidden double layer
model was chosen. Different trials were considered to
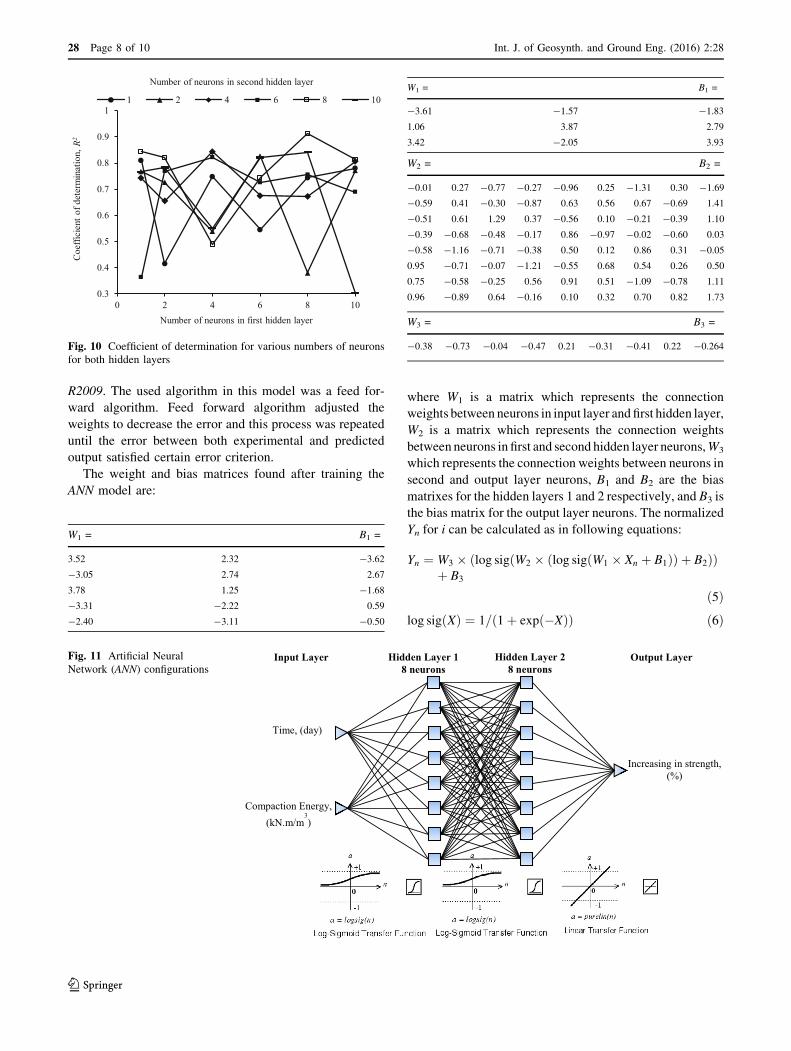
decide the suitable neurons number in both hidden layers.
Figure 10 displays the values of coefficient of determina-
tion, R2 between both experimental and predicted output
for several neurons numbers in both hidden layers where,
the highest coefficient of determination which is the result
of using 8 neurons in both first and second hidden layers.
From the literature, if the neurons number in both hidden
layers is greater than the optimal, the model will be com-
plicated and the training time will be longer [38].
Neurons in both hidden layers were non-linear with a
sigmoid transfer function. Figure 11 demonstrations ANN
configuration and the used transfer functions among the
network layers. ANN was trained using Matlab platform
0
5
10
15
20
25
30
35
40
0 100 200 300 400
q un_
D_T
_t(k
Pa)
qun_Non_t (kPa)
Fig. 9 Unconfined compressive strength for non-disturbed specimens
versus unconfined compressive strength for disturbed non compacted
specimens
Int. J. of Geosynth. and Ground Eng. (2016) 2:28 Page 7 of 10 28
123
R2009. The used algorithm in this model was a feed for-
ward algorithm. Feed forward algorithm adjusted the
weights to decrease the error and this process was repeated
until the error between both experimental and predicted
output satisfied certain error criterion.
The weight and bias matrices found after training the
ANN model are:
W1 = B1 =
3.52 2.32 -3.62
-3.05 2.74 2.67
3.78 1.25 -1.68
-3.31 -2.22 0.59
-2.40 -3.11 -0.50
W1 = B1 =
-3.61 -1.57 -1.83
1.06 3.87 2.79
3.42 -2.05 3.93
W2 = B2 =
-0.01 0.27 -0.77 -0.27 -0.96 0.25 -1.31 0.30 -1.69
-0.59 0.41 -0.30 -0.87 0.63 0.56 0.67 -0.69 1.41
-0.51 0.61 1.29 0.37 -0.56 0.10 -0.21 -0.39 1.10
-0.39 -0.68 -0.48 -0.17 0.86 -0.97 -0.02 -0.60 0.03
-0.58 -1.16 -0.71 -0.38 0.50 0.12 0.86 0.31 -0.05
0.95 -0.71 -0.07 -1.21 -0.55 0.68 0.54 0.26 0.50
0.75 -0.58 -0.25 0.56 0.91 0.51 -1.09 -0.78 1.11
0.96 -0.89 0.64 -0.16 0.10 0.32 0.70 0.82 1.73
W3 = B3 =
-0.38 -0.73 -0.04 -0.47 0.21 -0.31 -0.41 0.22 -0.264
where W1 is a matrix which represents the connection
weights between neurons in input layer and first hidden layer,
W2 is a matrix which represents the connection weights
between neurons in first and second hidden layer neurons,W3
which represents the connection weights between neurons in
second and output layer neurons, B1 and B2 are the bias
matrixes for the hidden layers 1 and 2 respectively, and B3 is
the bias matrix for the output layer neurons. The normalized
Yn for i can be calculated as in following equations:
Yn ¼ W3 � log sig W2 � log sig W1 � Xn þ B1ð Þð Þ þ B2ð Þð Þþ B3
ð5Þlog sig Xð Þ ¼ 1= 1þ exp �Xð Þð Þ ð6Þ
0.3
0.4
0.5
0.6
0.7
0.8
0.9
1
0 2 4 6 8 10
Coe
ffici
ent o
f det
erm
inat
ion,
R2
Number of neurons in first hidden layer
Number of neurons in second hidden layer
1 2 4 6 8 10
Fig. 10 Coefficient of determination for various numbers of neurons
for both hidden layers
Time, (day)
Compaction Energy, (kN.m/m
3)
Increasing in strength, (%)
Input Layer Hidden Layer 18 neurons
Hidden Layer 28 neurons
Output LayerFig. 11 Artificial Neural
Network (ANN) configurations
28 Page 8 of 10 Int. J. of Geosynth. and Ground Eng. (2016) 2:28
123
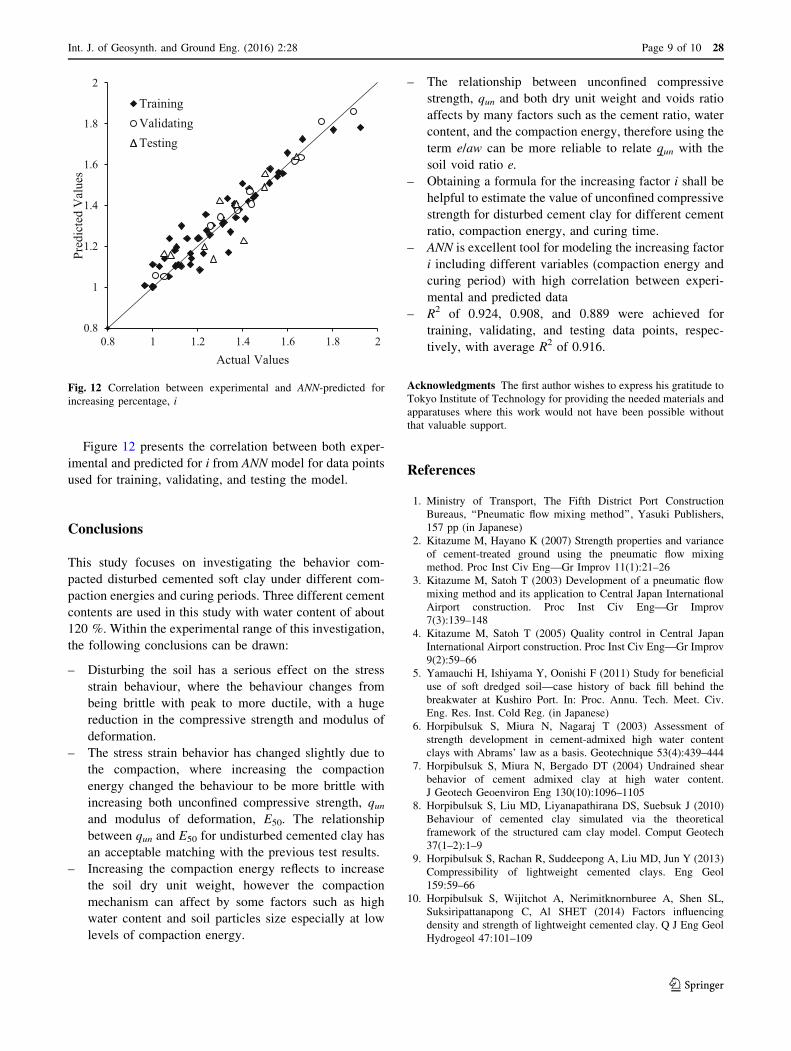
Figure 12 presents the correlation between both exper-
imental and predicted for i from ANN model for data points
used for training, validating, and testing the model.
Conclusions
This study focuses on investigating the behavior com-
pacted disturbed cemented soft clay under different com-
paction energies and curing periods. Three different cement
contents are used in this study with water content of about
120 %. Within the experimental range of this investigation,
the following conclusions can be drawn:
– Disturbing the soil has a serious effect on the stress
strain behaviour, where the behaviour changes from
being brittle with peak to more ductile, with a huge
reduction in the compressive strength and modulus of
deformation.
– The stress strain behavior has changed slightly due to
the compaction, where increasing the compaction
energy changed the behaviour to be more brittle with
increasing both unconfined compressive strength, qunand modulus of deformation, E50. The relationship
between qun and E50 for undisturbed cemented clay has
an acceptable matching with the previous test results.
– Increasing the compaction energy reflects to increase
the soil dry unit weight, however the compaction
mechanism can affect by some factors such as high
water content and soil particles size especially at low
levels of compaction energy.
– The relationship between unconfined compressive
strength, qun and both dry unit weight and voids ratio
affects by many factors such as the cement ratio, water
content, and the compaction energy, therefore using the
term e/aw can be more reliable to relate qun with the
soil void ratio e.
– Obtaining a formula for the increasing factor i shall be
helpful to estimate the value of unconfined compressive
strength for disturbed cement clay for different cement
ratio, compaction energy, and curing time.
– ANN is excellent tool for modeling the increasing factor
i including different variables (compaction energy and
curing period) with high correlation between experi-
mental and predicted data
– R2 of 0.924, 0.908, and 0.889 were achieved for
training, validating, and testing data points, respec-
tively, with average R2 of 0.916.
Acknowledgments The first author wishes to express his gratitude to
Tokyo Institute of Technology for providing the needed materials and
apparatuses where this work would not have been possible without
that valuable support.
References
1. Ministry of Transport, The Fifth District Port Construction
Bureaus, ‘‘Pneumatic flow mixing method’’, Yasuki Publishers,
157 pp (in Japanese)
2. Kitazume M, Hayano K (2007) Strength properties and variance
of cement-treated ground using the pneumatic flow mixing
method. Proc Inst Civ Eng—Gr Improv 11(1):21–26
3. Kitazume M, Satoh T (2003) Development of a pneumatic flow
mixing method and its application to Central Japan International
Airport construction. Proc Inst Civ Eng—Gr Improv
7(3):139–148
4. Kitazume M, Satoh T (2005) Quality control in Central Japan
International Airport construction. Proc Inst Civ Eng—Gr Improv
9(2):59–66
5. Yamauchi H, Ishiyama Y, Oonishi F (2011) Study for beneficial
use of soft dredged soil—case history of back fill behind the
breakwater at Kushiro Port. In: Proc. Annu. Tech. Meet. Civ.
Eng. Res. Inst. Cold Reg. (in Japanese)
6. Horpibulsuk S, Miura N, Nagaraj T (2003) Assessment of
strength development in cement-admixed high water content
clays with Abrams’ law as a basis. Geotechnique 53(4):439–444
7. Horpibulsuk S, Miura N, Bergado DT (2004) Undrained shear
behavior of cement admixed clay at high water content.
J Geotech Geoenviron Eng 130(10):1096–1105
8. Horpibulsuk S, Liu MD, Liyanapathirana DS, Suebsuk J (2010)
Behaviour of cemented clay simulated via the theoretical
framework of the structured cam clay model. Comput Geotech
37(1–2):1–9
9. Horpibulsuk S, Rachan R, Suddeepong A, Liu MD, Jun Y (2013)
Compressibility of lightweight cemented clays. Eng Geol
159:59–66
10. Horpibulsuk S, Wijitchot A, Nerimitknornburee A, Shen SL,
Suksiripattanapong C, Al SHET (2014) Factors influencing
density and strength of lightweight cemented clay. Q J Eng Geol
Hydrogeol 47:101–109
0.8
1
1.2
1.4
1.6
1.8
2
0.8 1 1.2 1.4 1.6 1.8 2
Pred
icte
d V
alue
s
Actual Values
TrainingValidatingTesting
Fig. 12 Correlation between experimental and ANN-predicted for
increasing percentage, i
Int. J. of Geosynth. and Ground Eng. (2016) 2:28 Page 9 of 10 28
123
11. Horpibulsuk S, Liu MD, Liyanapat hirana J, Suebsuk DS (2010)
Behavior of cemented clay simulated via the theoretical frame-
work of the structured cam clay model. Comput Geotech 37:1–9
12. Horpibulsuk S, Rachan R, Suddeepong A, Chinkulkijniwat A
(2011) Strength development in cement admixed Bangkok clay:
laboratory and field investigations. Soils Found 51:239–251
13. Horpibulsuk S, Suddeepong A, Chinkulkijniwat A, Liu MD
(2012) Strength and compressibility of lightweight cemented
clays. J Appl Clay Sci 69:11–21
14. Horpibulsuk S, Chinkulkijniwat A, Cholphatsorn A, Suebsuk J,
Liu MD (2012) Consolidation behavior of soil cement column
improved ground. Comput Geotech 43:37–50
15. Askarani KK, Pakbaz MS (2016) Drained shear strength of over-
consolidated compacted soil-cement. J Mater Civ Eng 28(5)
16. Pakbaz R, Alipour MS (2012) Influence of cement addition on the
geotechnical propertis of an Iranian clay. J Appl Clay Sci 67:1–4
17. Pakbaz MS, Farzi M (2015) Comparison of the effect of mixing
methods (dry versus wet) on mechanical and hydraulic properties
of treated soil with cement lime. J Appl Clay Sci 105:156–169
18. Boroumandzadeh B, Pakbaz MS (2012) Evaluation of effect of
cementation on drained shear strength of over consolidated clay
soils. World Appl Sci J 16(10):1375–1379
19. Neville AM (1997) Properties of concrete: fourth and final edi-
tion. Wiley
20. ECP 203 (2009) Egyptian code for designing and executing the
building works, 2nd edn. HBRC, Egypt
21. J. G. Society (2009) Practice for making and curing stabilized soil
specimens without compaction. JGS 0821-2009 Jpn Geotech Soc
1:426–434 (in Japanese)22. Lorenzo GA, Bergado DT (2006) Fundamental characteristics of
cement-admixed clay in deep mixing. J Mater Civ Eng
18(2):161–174
23. Horpibulsuk S, Rachan R, Raksachon Y (2009) Role of fly ash on
strength and microstructure devlopment in blended cement sta-
bilized silty clay. Soils Found 49(1):85–98
24. Abu-Kiefa MA (1998) General regression neural networks for
driven piles in cohesionless soils. J Geotech Geoenviron Eng
124(12):1177–1185
25. Lee I-M, Lee J-H (1996) Prediction of pile bearing capacity using
artificial neural networks. Comput Geotech 18(3):189–200
26. Teh CI, Wong KS, Goh ATC, Jaritngam S (1997) Prediction of
pile capacity using neural networks. J Comput Civ Eng
11(2):129–138
27. Das SK, Basudhar PK (2006) Undrained lateral load capacity of
piles in clay using artificial neural network. Comput Geotech
33(8):454–459
28. Penumadu D, Zhao R (1999) Triaxial compression behavior of
sand and gravel using artificial neural networks (ANN). Comput
Geotech 24(3):207–230
29. Ellis GW, Yao C, Zhao R, Penumadu D (1995) Stress–strain
modeling of sands using artificial neural networks. J Geotech Eng
121(5):429–435
30. Chittoori B, Puppala AJ (2011) Quantitative estimation of clay
mineralogy in fine-grained soils. J Geotech Geoenviron Eng
137(11):997–1008
31. Das SK, Basudhar PK (2008) Prediction of residual friction angle
of clays using artifical neural network. Eng Geol
100(3–4):142–145
32. Das SK (2012) Artificial neural networks in geotechnical engi-
neering: modeling and application issues, Chapter 10. Meta-
heuristics Water, Geotech. Transp. Eng., pp 231–270
33. Benardos AG, Kaliampakos DC (2004) Modelling TBM perfor-
mance with artificial neural networks. Tunn Undergr Sp Technol
19:597–605
34. Shahin MA, Jaksa MB, Maier HR (2001) Artificial neural net-
work applications in geotechnical engineering. Aust Geomech
36(1):49–62
35. Sivakugan N, Eckersley JD, Li (1998) Settlement predictions
using neural networks. Aust Civ Eng Trans CE40:49–52
36. Goh ATC (1994) Seismic liquefaction potential assessed by
neural network. J Geotech Geoenviron Eng 120(9):1467–1480
37. Goh ATC (1996) Neural-network modeling of CPT seismic liq-
uefaction data. J Geotech Eng 122(1):70–73
38. Nasr N, Hafez H, El Naggar MH, Nakhla G (2013) Application of
artificial neural networks for modeling of biohydrogen produc-
tion. Int J Hydrogen Energy 38(8):3189–3195
28 Page 10 of 10 Int. J. of Geosynth. and Ground Eng. (2016) 2:28
123