Studies on an Actinomycete Producing a Melanin … Science Journal 2013;10(1) 1437 Studies on an...
12
Life Science Journal 2013;10(1) http://www.lifesciencesite.com 1437 Studies on an Actinomycete Producing a Melanin Pigment Inhibiting Aflatoxin B 1 Production by Aspergillus flavus Mohamed Tawfiek Shaaban, Sabha Mahmoud Mabrouk El-Sabbagh, and Asmaa Alam Botany Department, Faculty of Science, Menoufia University, Egypt [email protected] Abstract: Thirty different isolates of actinomycetes collected from different localities in Gharbia Governorate, Egypt were tested for melanin pigment production. Only one isolate produced melanin and identified as Streptomyces torulosus. The selected actinomycete isolate was grown under different cultural conditions and it was found that starch-nitrate medium was the optimum for the growth of selected isolate at pH 7.0 after 10 days of incubation at 30˚C. Increasing the L-tyrosine concentration in tyrosine liquid medium induced tyrosinase and enhanced the growth of the isolate and the ability of pigment production. The pigment was purified, characterized by physical and chemical properties and identified as melanin. In vitro aflatoxin B 1 production by Aspergillus flavus was reduced with the increase of pure melanin pigment concentration up to 0.1g/100 ml culture (0.1%), after that the aflatoxin B 1 production was completely inhibited with the increase of pure melanin pigment concentrations as compared with the control. In Vivo studies, the aflatoxin B 1 concentration in wheat grains reduced with the increase of pure melanin pigment as compared with control. [Mohamed Tawfiek Shaaban, Sabha Mahmoud Mabrouk El-Sabbagh and Asmaa Alam. Studies on an Actinomycete Producing a Melanin Pigment Inhibiting Aflatoxin B 1 Production by Aspergillus flavus. Life Sci J 2013; 10(1):1437-1448]. (ISSN: 1097-8135). http://www.lifesciencesite.com. 214 Keywords: Streptomyces torulosus, melanin pigment, physical analysis, aflatoxin B 1 inhibition. 1. Introduction Some actinomycetes are capable of producing dark-brown substances in the culture media, generally referred to as melanin or melanoid pigments. These brown-black metabolic polymers are important as a useful criterion in taxonomic studies (Dastager et al., 2006). Melanins are negatively charged composed of multi-functional polymers and polyphenolic compounds that are produced by various microorganisms by fermentative oxidation. They have also radio protective and antioxidant properties that can effectively protect the living organisms from ultraviolet radiation (Dastager et al., 2006; Frases et al., 2007). Melanins are frequently used in medicine, pharmacology and cosmetic preparations. Melanin’s ability to undergo polymerization is interesting in industry for its nano- technology uses in bio-plastics and biopolymers (Nakato, 2006). The biosynthesis of melanin pigment in microorganisms takes place through different pathways, similarly to higher organisms. Melanin pigment can be made using L-tyrosine as precursor through the action of tyrosinase. Tyrosinase is a copper protein that belongs to the group of polyphenol oxidases. Tyrosinase transform the tyrosine into L-DOPA (3, 4-dihydroxyphenyl-L- alanine), which is further converted into dopachrome and autooxidized to indol-5, 6-quinone. The later is spontaneously polymerized into DOPA-melanin which gives dark brown (Mencher and Heim, 1962; Margalith, 1992). Melanin is an amorphous, dark-colored pigment, insoluble in most solvents, bleached by oxidizing agents, and soluble in alkali and phenols (Krysciak, 1985). The aflatoxins are secondary metabolites produced by Aspergillus flavus, A. parasiticus, and A. nomius (Heathcote and Hibbert, 1978; Cotty et al., 1994). The first two species are widely distributed in nature and are able to grow on a wide variety of natural substances including foodstuffs and animal feeds causing serious economic losses. Among the major known types of aflatoxins are aflatoxin B 1 ; aflatoxin B 2 , aflatoxin G 1 and aflatoxin G 2 (Nesbitt et al., 1962; Betina, 1989). Aflatoxins are most noteworthy of all mycotoxins due to their association with liver cancer in man (Purchase, 1971). The inhibition of aflatoxin B 1 (AFB 1 ) biosynthesis by A. flavus by phenolic compounds acetosyringone, syringaldehyde, and sinapinic acid was studied by Hua et al. (1999). Melanin was degraded by white rot fungi (Sporotrichum pruinosum) and the enzyme responsible for melanin degradation by P. chrysosporium was manganese peroxidase, which is one of the ligninolytic enzymes (Butler and Day, 1998). The aim of this work was: to investigate the production and purification of melanin pigment by some actinomycetes isolates, to characterize the
Transcript of Studies on an Actinomycete Producing a Melanin … Science Journal 2013;10(1) 1437 Studies on an...

Life Science Journal 2013;10(1) http://www.lifesciencesite.com
1437
Studies on an Actinomycete Producing a Melanin Pigment Inhibiting Aflatoxin B1 Production by Aspergillus flavus
Mohamed Tawfiek Shaaban, Sabha Mahmoud Mabrouk El-Sabbagh, and Asmaa Alam
Botany Department, Faculty of Science, Menoufia University, Egypt
[email protected] Abstract: Thirty different isolates of actinomycetes collected from different localities in Gharbia Governorate, Egypt were tested for melanin pigment production. Only one isolate produced melanin and identified as Streptomyces torulosus. The selected actinomycete isolate was grown under different cultural conditions and it was found that starch-nitrate medium was the optimum for the growth of selected isolate at pH 7.0 after 10 days of incubation at 30˚C. Increasing the L-tyrosine concentration in tyrosine liquid medium induced tyrosinase and enhanced the growth of the isolate and the ability of pigment production. The pigment was purified, characterized by physical and chemical properties and identified as melanin. In vitro aflatoxin B1 production by Aspergillus flavus was reduced with the increase of pure melanin pigment concentration up to 0.1g/100 ml culture (0.1%), after that the aflatoxin B1 production was completely inhibited with the increase of pure melanin pigment concentrations as compared with the control. In Vivo studies, the aflatoxin B1 concentration in wheat grains reduced with the increase of pure melanin pigment as compared with control. [Mohamed Tawfiek Shaaban, Sabha Mahmoud Mabrouk El-Sabbagh and Asmaa Alam. Studies on an Actinomycete Producing a Melanin Pigment Inhibiting Aflatoxin B1 Production by Aspergillus flavus. Life Sci J 2013; 10(1):1437-1448]. (ISSN: 1097-8135). http://www.lifesciencesite.com. 214 Keywords: Streptomyces torulosus, melanin pigment, physical analysis, aflatoxin B1 inhibition. 1. Introduction
Some actinomycetes are capable of producing dark-brown substances in the culture media, generally referred to as melanin or melanoid pigments. These brown-black metabolic polymers are important as a useful criterion in taxonomic studies (Dastager et al., 2006). Melanins are negatively charged composed of multi-functional polymers and polyphenolic compounds that are produced by various microorganisms by fermentative oxidation. They have also radio protective and antioxidant properties that can effectively protect the living organisms from ultraviolet radiation (Dastager et al., 2006; Frases et al., 2007). Melanins are frequently used in medicine, pharmacology and cosmetic preparations. Melanin’s ability to undergo polymerization is interesting in industry for its nano-technology uses in bio-plastics and biopolymers (Nakato, 2006).
The biosynthesis of melanin pigment in microorganisms takes place through different pathways, similarly to higher organisms. Melanin pigment can be made using L-tyrosine as precursor through the action of tyrosinase. Tyrosinase is a copper protein that belongs to the group of polyphenol oxidases. Tyrosinase transform the tyrosine into L-DOPA (3, 4-dihydroxyphenyl-L-alanine), which is further converted into dopachrome and autooxidized to indol-5, 6-quinone. The later is spontaneously polymerized into DOPA-melanin
which gives dark brown (Mencher and Heim, 1962; Margalith, 1992).
Melanin is an amorphous, dark-colored pigment, insoluble in most solvents, bleached by oxidizing agents, and soluble in alkali and phenols (Krysciak, 1985).
The aflatoxins are secondary metabolites produced by Aspergillus flavus, A. parasiticus, and A. nomius (Heathcote and Hibbert, 1978; Cotty et al., 1994). The first two species are widely distributed in nature and are able to grow on a wide variety of natural substances including foodstuffs and animal feeds causing serious economic losses. Among the major known types of aflatoxins are aflatoxin B1; aflatoxin B2, aflatoxin G1 and aflatoxin G2 (Nesbitt et al., 1962; Betina, 1989).
Aflatoxins are most noteworthy of all mycotoxins due to their association with liver cancer in man (Purchase, 1971). The inhibition of aflatoxin B1 (AFB1) biosynthesis by A. flavus by phenolic compounds acetosyringone, syringaldehyde, and sinapinic acid was studied by Hua et al. (1999).
Melanin was degraded by white rot fungi (Sporotrichum pruinosum) and the enzyme responsible for melanin degradation by P. chrysosporium was manganese peroxidase, which is one of the ligninolytic enzymes (Butler and Day, 1998).
The aim of this work was: to investigate the production and purification of melanin pigment by some actinomycetes isolates, to characterize the

Life Science Journal 2013;10(1) http://www.lifesciencesite.com
1438
produced melanine through its physical and chemical properties and to compare those results with synthetic DOPA melanin. Attempts were carried out also to use the produced melanin pigment to inhibit the aflatoxin B1 production by Aspergillus flavus. 2. Material and Methods Sources of microorganisms:
Aspergillus flavus was friendly provided by Prof. Dr. Hamdy Ali Emara, Prof. of microbiology, Microbiology Department, Soil, Water, and Environment Institute, Agriculture Research Center, Giza, Egypt. This fungus was maintained on Czapek’s Dox agar (Allen, 1950). Isolation of actinomycetes:
The used actinomycetes were isolated from soil samples collected from different localities in Tanta (Gharbia Governorate, Egypt). Soil samples were taken at 5 cm depth, and then kept in clean plastic bags. Over the surface of solidified starch nitrate agar plates, 0.2 ml of the soil dilution were spread out with a sterilized glass rod. The plates were then incubated at 30°C for 7 days. Determination of mycelial growth:
Dry cell weight was estimated by the method described by Gauvreau and Waring (1982). Characteristics of the actinomycetes strain produced melanin pigment:
For complete identification of the melanin producing isolate, several cultural, morphological and biochemical properties were examined. The criteria described in keys of identification (Kuster, 1972; Nonomura, 1974; Szabo et al., 1975; Szabo and Csortos, 1975) were followed. Bergey's Manual of Systematic Bacteriology (Holt et al., 1994) and Bergey's Manual of Systematic Bacteriology (Williams et al., 1989) were followed for the identification.
To determine the mol. % G +C values of DNA, the isolation of DNA was carried out according to the method described by Colwell and Grigorova (1987), and the determination of the base composition by the absorbance's ratio (ε260/ ε280) at pH 3.0 according to method described by Fredericq et al. (1961).
The procedure of extraction of polar lipids is based on the methods of Bligh and Dyer (1959) modified by Card (1973). 100 mg of dried cells were suspended in 2 ml of 0.3% saline. 20 ml of methanol were added and the mixture was boiled at 100 oC for 5 min in a screw-capped tube. After cooling, 10 ml chloroform and 6 ml of the saline were added to the tube. The mixture was shaken for three hours and the debris removed by filtration. 10 ml each of chloroform and saline are added to the mixture to separate the two layers. The chloroform layer is collected, concentrated to dryness, and re-dissolved in 100 µl of chloroform-methanol (2:1, v/v) and
applied on Gas chromatography. This work was done in Al-Azhar University, The Regional Center for Mycology and Biotechnology, Cairo, Egypt.
Cell-wall sugar analysis was carried out by the method described by Staneck and Roberts (1974). Fatty acid pattern was carried out by the method described in Current Methods for Classification and Identification of Microorganisms (Colwell and Grigorova, 1987). This work was done in Agricultural Research Center, Cairo, Egypt. Screening for production of melanin pigment:
Melanin pigment was estimated by adding 2 ml of the culture to 1 ml of 0.4% substrate solution (L-tyrosine). The reaction mixture was incubated at 37ºC for 30 min and red coloration resulting from dopachrome formation was observed and read spectrophotometrically at 480 nm (UV-1601, Shimadzu). If no coloration appeared within this period, the reaction mixture was further incubated for as long as 2 h. (Scribners et al., 1973). Extraction and purification of melanin pigment:
Melanin was extracted according to Rowley and Pirt (1972) and Gadd (1982). The purification process involved the elimination (by hydrolysis) of carbohydrates, proteins and lipids associated with the crude residue (Harki et al., 1997). Preparation of standard melanin:
Standard melanin was purchased from Sigma Company. Standard melanin solution mg/ml was prepared by dissolving 0.05 g of melanin in 2 ml of 1 M NaOH. Optimization of culture conditions for melanin production:
To find out the best melanin production by the actinomycetes isolate, we studied the effect of different media, incubation period, pH, temperature, carbon and nitrogen sources. Separation and analysis of melanin:
The method described by Engstrom et al. (1993) was followed for melanin separation by thin layer chromatography (TLC). After TLC separation, the zone of melanin was outlined, scratched and dissolved in 1 M NaOH and its absorbance was measured at wave lengths ranged from 200 to 700 nm. An authentic sample was used as reference blank. UV analysis was carried out with Perken Elmer Lambda 48 UV/Vis spectrophotometer, and IR sample analysis was achieved by Nicolet IR 200 Spectrophotometer. Physical and chemical properties of melanin:
The dried extracted melanin was subjected to various physical and chemical tests according to Thomas (1955).
In vitro, the effect of pure melanin on the growth of Aspergillus flavus and production of aflatoxin B1 (AFB1)

Life Science Journal 2013;10(1) http://www.lifesciencesite.com
1439
Different concentrations of pure melanin pigment (0.05, 0.1, 0.2, 0.3, 0.4 and 0.5 g) were added to 250 ml Elenmeyer flasks containing 100 ml of Czapek’s Dox medium, each flask was inoculated with 1 ml spore suspension (containing 1×10⁶ spore/ml) of Aspergillus flavus. After incubation at 25°C for 10 days, the culture media were centrifuged at 10.000 rpm for 30 min, mycelia were harvested and the filtrate was assayed for aflatoxin B1. Production and growth of Aspergillus flavus were also measured by the method adopted from Kane and Mullins (1973). In Vivo, the effect of pure melanin on cereals aflatoxin B1 :
Grains of wheat were soaked in water for approximately 2 hours. Portions of 15 g of the soaked wheat were introduced into Erlenmeyer's flasks followed by sterilization at 121°C for 15 min in an autoclave. Different concentrations of pure melanin pigment [0.05, 0.1, 0.3, 0.5, 1.0, 2.0, 3.0 and 4.0 g (w/w)] were added to 15 g of the sterilized wheat grains which were inoculated by 106 spores/g of the Aspergillus flavus (a control group was not inoculated). The amount of aflatoxin B1 in the wheat was determined after 10 days of incubation at 25°C.
The Extraction of aflatoxin B1 from Aspergillus flavus was carried out according to Schuller et al. (1983) and A.O.A.C (1984). Purification of the final extracts were carried out according to Takeda et al. (1979). Detection and determination of aflatoxin B1
Thin layer chromatography (TLC) was used for identifying and estimating aflatoxin B1 in the extract as described by FAO and UNEP (1989) and FAO (1990). The quantities of aflatoxin B1 was determined by reading the silica gel plates quantitatively by fluorodensitometer (TLD-100 vitatron), following the method described by Shannon et al. (1983) and FAO (1990).
Standard aflatoxin B1 was purchased from Sigma Company. Standard solutions (10 µg/ml) was prepared by dissolving 1mg in a small volume of Benzene: Acetonitrile (98: 2, v/v) then completed to 100 ml with the same solvent mixture. 3. Results Isolation of actinomycetes and screening for production of melanin pigment:
Thirty isolates of actinomycetes were isolated form agricultural soils collected from different
localities in Gharbia Governorate, Egypt, grown on starch nitrate agar and screened for the production of melanin pigment. One strain only produced melanin. Characterization and identification of the selected isolate:
The results obtained in tables (1, 2, 3 and 4) show that the selected isolate was in the grey series on the tested media, the colonies showed good growth on yeast extract-malt extract agar (ISP 2) and oatmeal agar (ISP 3) with white aerial mycelium, yellow substrate mycelium, and no diffusible pigment produced. Inorganic salts-starch agar (ISP 4) showed good growth, grey aerial mycelium, yellow substrate mycelium and no diffusible pigment. On glycerol-asparagine agar (ISP 5) the growth was good with grey aerial mycelium, yellow substrate mycelium and no diffusible pigment. The dark brown melanoid pigments were formed in peptone yeast iron agar, starch nitrate agar and tyrosine agar. The isolate utilized various carbon sources for growth as glucose, arabinose, xylose, inositol, mannose and fructose, while sucrose, rhamnose, rhafinnose and cellulose were not utilized. The isolate utilized various nitrogen sources for growth [L-asparagine, KNO3, NaNO3, peptone, (NH4)2SO4 and NH4Cl]. Degradation of starch, casein, xanthine, tyrosine and urea were observed but the selected isolate does not degrade gelatine. The isolate tolerated up to 2.5 NaCl, produced H2S, and reduced nitrate and was able to inhibit B. subtilus, E. coli and C. albicans.
Light microscopic examination showed dichotomously branched and coiled spore chains (Photo 1). Scanning electron microscope (Photo 2) showed knobby spore surface (spiny and warty). Sensitivity to antibiotics and growth inhibitors were shown in table (2) A whole cell hydrolysate analysis revealed the presence of LL-diaminopimelic acid with Rf value of 0.29. The spore chains were in spiral form with10 to 20 spores or more per chain. Cells are aerobic, Gram positive, non acid fast, the wall have a type PII phospholipid pattern containing phosphatidylethanolamine. The culture was susceptible to streptomycin (10 µg/ml). Growth was best on starch nitrate medium at 30°C. The fatty acid profiles revealed that tetradecanoic acid (14:0), and hexadecanoic acid (16:0) were the predominant fatty acids. No diagnostic sugars detected in whole cell hydrolysate. Mol % G+C was 71.0.
Table (1): Cultural characteristics of the actinomycetes isolate grown on different agar media for 14 days at 30 oC. Media used Growth Aerial mycelium Substrate mycelium Soluble pigment Yeast extract-malt extract agar Good White Yellow None Inorganic salt starch agar Good Grey Yellow None Oat meal agar Good White Yellow None Glycerol-asparagine agar Good Grey Yellow None

Life Science Journal 2013;10(1) http://www.lifesciencesite.com
1440
Table (2): physiological characteristics of the selected isolate. Test Reaction Test Reaction Melanin pigment. Nitrate reduction. H2S production. Gelatin hydrolysis. Starch hydrolysis. Xanthine degradation. L-Tyrosin degradation. Casein degradation. Acid fast stain
+ ve + ve + ve - ve + ve + ve + ve + ve - ve
Growth at 45oC NaCl-tolerance (2-5 %w/v) Sensitivity to growth inhibitors: a-Sodium-azide 0.01% b-Phenol 0.1% Resistance to Streptomycin (25µg ml-1) Urea hydrolysis
- ve 2.5 %
+ ve + ve - ve + ve
Table (3): Biochemical characteristics of the selected isolate.
Tested material Reaction Cell wall chemotype. Whole cell sugar pattern. Phospholipids. PE (phosphatidylethanolamine) Pl (phosphatidylinositol) PIM (phosphatidylinositolmonoside) DPG(diphoshatidylgycerol) PG (phosphatidylglycerol) PS (phosphaditylserine Fatty acids pattern:- Dodecanoic acid (C12:0) Tetradecanoic acid (C14:0) Pentadecenoic acid (C15:0) Hexadecanoic acid (C16:0) Hexadecenoic acid (C16:l) Heptadecanoic acid (C17:0) Octadecanoic acid (C18:0) Octadecadienoic acid (C18:1)
I (LL-Diaminopimelic acid). No diagnostic sugar. + - - - - - 2.0 % 19.2 % 2.8 % 40.1 % 2.7 % 1.6 % 7.6 % 3.0%
(+): detected and (-): not detected. Table (4): Utilization of different carbon and nitrogen sources by the selected isolate. Source Utilization D- Glucose D- Xylose Sucrose L- Arabinose L-Rhmonose Raffinose Soluble starch Cellulose Mannose Inositol D-Fructose K NO3 L- asparagine Na NO3 Peptone (NH4)2SO4 NH4Cl
+ + - + - - + - + + + + + + + + +
Photo (1): Spore chains of the selected isolate examined by light microscope from 7 days old culture on starch nitrate agar (× 400).
Photo (2): Spore view of the selected isolate under scanning electron microscope from 14 days old culture on starch nitrate agar (× 15.000).

Life Science Journal 2013;10(1) http://www.lifesciencesite.com
1441
Effect of different media on growth and melanin production:
As shown in figure (1), starch nitrate medium was the most suitable medium followed by tyrosine medium, glucose-peptone medium and glycerol-asparagine medium respectively after incubation at 30°C for 10 days in dark on a shaker at 160 rpm.
0
0.5
1
1.5
2
2.5
Tyrosine medium
Starch-nitrate medium
Glycerol-aspargine medium
Glucose-peptone medium
Media
Melanin production (O. D. at 480 nm) Dry weight
Figure (1): Effect of different media on the dry weight (mg/ml) and melanin pigment production (O.D. at 480 nm) by the selected isolate.
Effect of incubation period on growth and melanin production:
The results showed that the pigment production was greatly affected by different incubation periods (3, 7, 10, 12 days) at 30°C on rotary shaker at 160 rpm. There was a clear gradual increasing in pigment production with increasing the incubation period. Also the growth of the selected strain, increased with increasing the incubation period up to10 days which proved to be the optimum incubation period for growth (Figure 2).
0
0,5
1
1,5
2
2,5
3 7 10 12Days
Melanin production (O. D. at 480 nm) Dry weight
Figure (2): Effect of different incubation periods on the dry weight (mg/ml) and melanin pigment production (O.D. at 480 nm) by the selected isolate. Effect of different pH values on growth and melanin production:
The effect of pH on melanin production by tested isolate was studied using buffered starch nitrate. Citrate phosphate buffer pH 4.0, phosphate
buffer pH 6.0 and, pH 7.0, Tris-HCl buffer pH 8.0 and pH 9.0 were used. After inoculation and incubation at 30°C on rotary shaker at 160 rpm for 10 days, the melanin pigment production and growth were measured. The results showed that the growth and pigment production of the experimental organism increased with the increasing of pH value up to pH 7.0 which represented the optimum pH value for melanin production after which the pigment production decreased. The growth increased with increasing the pH value up to pH 8.0 after which growth decreased (Figure 3).
00.5
11.5
22.5
pH5 pH6 pH7 pH8 pH9pH Values
Melanin production (O. D. at 480 nm) Dry weight
Figure (3): Effect of various pH values on the dry weight and the melanin pigment production (O.D. at 480 nm) by the selected isolate. Effect of different temperatures on growth and melanin production:
The results showed that the optimum temperature for the growth and the melanin production was 30˚C (Figure 4).
0
0.5
1
1.5
2
2.5
25 30 40
Temperature (˚C)
Melanin production (O. D. at 480 nm) Dry weight
Figure (4): Effect of different temperature on the dry weight (mg/ml) and the melanin pigment production (O.D. at 480 nm) by the selected isolate. Effect of different carbon sources on growth and melanin production:
Starch, in starch nitrate medium pH 7.0, was substituted with 20g ⁄ L of other carbon sources: fructose, glycerol, sucrose, and glucose. The results presented in (Figure 5) showed that the starch was the

Life Science Journal 2013;10(1) http://www.lifesciencesite.com
1442
most suitable carbon source for growth and melanin production followed by glycerol, fructose, sucrose and glucose respectively.
00.5
11.5
22.5
Carbon sources
Melanin production (O. D. at 480 nm) Dry weight
Figure (5): Effect of different carbon sources on the dry weight (mg/ml) and the melanin pigment production (O.D. at 480 nm) by the selected isolate. Effect of different nitrogen sources on growth and melanin production:
Potassium nitrate, in the starch nitrate medium (pH 7.0), was substituted with equimolecular weights of various nitrogenous compounds (tryptone, NaNO3, NH4Cl, and peptone) have been utilized. The results represented in figure 6 show that the highest values of growth and melanin pigment production was recorded with potassium nitrate as a nitrogen source. Sodium nitrate increased the pigment production but less than potassium nitrate and was followed by peptone. The lowest amounts of the pigment were recorded with ammonium chloride (NH4Cl) and tryptone. The highest growth was recorded with sodium nitrate, followed by ammonium chloride and peptone.
0
0.5
1
1.5
2
2.5
KNO3 NH4Cl NaNO3 Pept. Trypt.
Nitrogen Sources
Melanin production (O. D. at 480 nm) Dry weight
Figure (6): Effect of different nitrogen sources on the dry weight (mg/ml) and the melanin pigment production (O.D. at 480 nm) by the selected isolate. Effect of different concentrations of L–Tyrosine on growth and melanin production:
The effect of different concentrations of L-Tyrosine on the growth and the melanin production
of the selected isolate were studied on tyrosine medium. The results presented in figure 7 indicated that the pigment production, growth and tyrosinase activity increased with the increase of L–Tyrosine concentrations.
0
5
10
15
20
25
30
35
1.5 1.8 2.1 2.4 2.7L-Tyrosine concentrations (g/L)
Melanin production (O. D. at 480 nm)Dry weightTyrosinase activ ity (U/ml)
Figure (7): Effect of different concentrations of L-Tyrosine on the dry weight (mg/ml), production of melanin (O.D. at 480 nm) and tyrosinase activity. Physical and chemical properties of melanin extracted from the selected isolate :
The extracted pigment was insoluble in hydrochloric acid and organic solvents, (acetone, chloroform and ethanol) or mixtures of these solvents. It was decolorized by oxidizing agents (H2O2 and NaOCl), gave positive reactions with polyphenol compounds and produced flocculent brown precipitates with FeCl3 1% (w ⁄ v) as shown in table 5. Table (5): Characters of the pure extracted melanin in comparison to an authentic melanin sample.
Authentic melanin
Extracted melanin Characters
Black Dark brown Color of solution in 1M NaOH
SolubleInsoluble Solubility in water.
Soluble Insoluble
Solubility in organic solvent like: (ethanol-chloroform-methanol–acetone-acetate).
Soluble Soluble Solubility in KOH for 2 hrs at 100 ◦C.
Precipitated Precipitated Precipitation in 3N HCl.
Reddish brown
Reddish brown
Reaction for polyphenol test
Precipitated Precipitated Reaction with FeCl3(1% w/v)
Decolorization Decolorization Reaction with H2O2. Separation of melanin by TLC:
After purification, the melanin was washed and dried over anhydrous Na2SO4. The dried melanin

Life Science Journal 2013;10(1) http://www.lifesciencesite.com
1443
was dissolved in 1M NaOH solution. The dissolved dye was spotted on TLC plates 0.25 mm (Merck) coated with silica gel F60 G254 using solvent system of petroleum ether, ethyl acetate, (95%) ethanol, ammonia (4: 4: 6: 1, V ⁄ V) for separation. Pigments gave one band with Rf 0.89. Spectra of melanin produced by the tested actinomycete isolate:
The purified melanin pigment was dried over anhydrous Na2SO4 for overnight at 21˚C then dissolved in 1M NaOH and analyzed by UV spectrophotometer. The purified melanin pigment from the selected isolate showed peaks at 280nm.
Infra-red analysis : The precipitated melanin has peaks with wave numbers appeared at 3380 cm-1, 3285cm-1, 2925 cm-1, 2850 cm-1, 1724 cm-1,1631cm-1, 1378 cm-1, 698cm-1, 667cm-1 and 616 cm-1 (Figure 8), whereas the authentic melanin recoded peaks at wave numbers 3395cm-1, 3279c m-1, 2928cm-1, 2848cm-1, 1712cm-1, 1627cm-1, 1395 cm-1, 779 cm-1 , 648 cm-1 and 584 cm-
1 as shown in fig (9). The wave number occurred can be ascribed
to the following: 3380 cm-1 and 3285cm-1 attributed to OH and NH groups, 2925 cm-1 and 2850 cm-1 due to C-H or H-C=O groups, 1724cm-1 due to C=O group, 1631 due to bending of secondary NH group,1456 cm-1 due to C = N, and 896.737 cm-1 due to C – C bond.
Figure. (8): FT-IR spectrum, transmittance (T%) of the extracted melanin of the selected actinomycetes isolate and synthetic melanin.
Figure. (9): FT-IR spectrum of authentic DOPA.
Life Science Journal 2013;10(1) http://www.lifesciencesite.com
1444
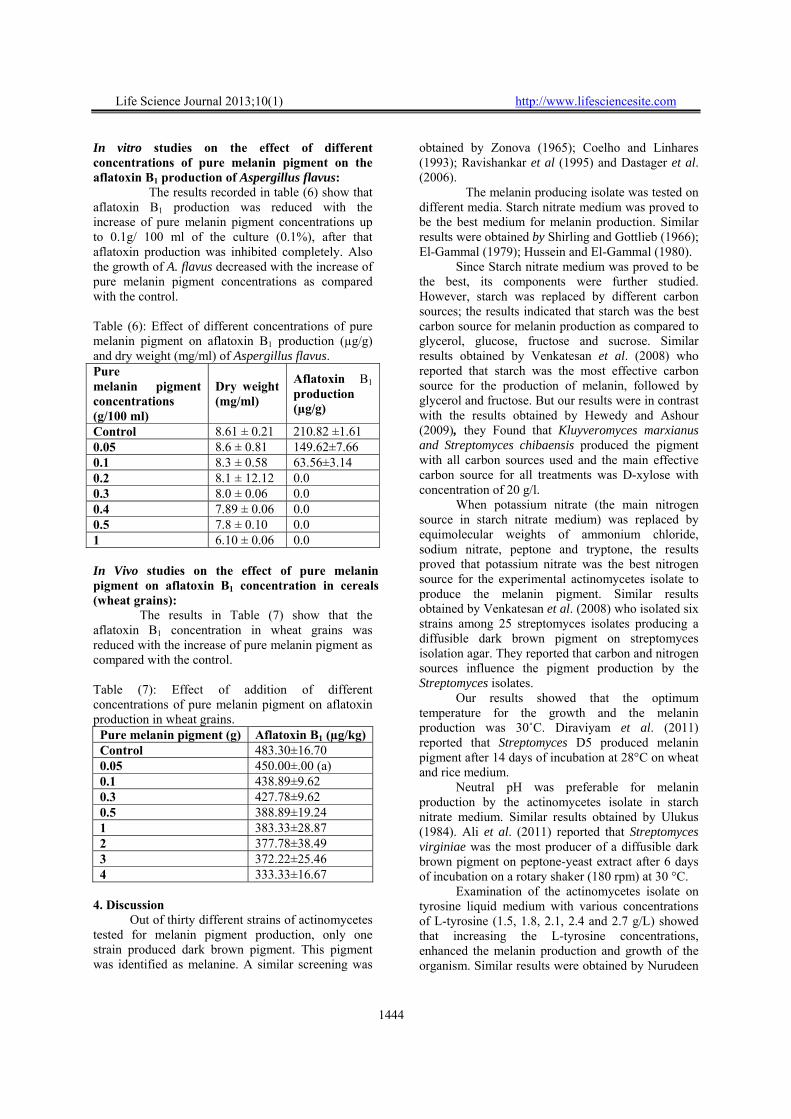
In vitro studies on the effect of different concentrations of pure melanin pigment on the aflatoxin B1 production of Aspergillus flavus:
The results recorded in table (6) show that aflatoxin B1 production was reduced with the increase of pure melanin pigment concentrations up to 0.1g/ 100 ml of the culture (0.1%), after that aflatoxin production was inhibited completely. Also the growth of A. flavus decreased with the increase of pure melanin pigment concentrations as compared with the control.
Table (6): Effect of different concentrations of pure melanin pigment on aflatoxin B1 production (µg/g) and dry weight (mg/ml) of Aspergillus flavus. Pure melanin pigment concentrations (g/100 ml)
Dry weight (mg/ml)
Aflatoxin B1 production (µg/g)
Control 8.61 ± 0.21 210.82 ±1.61 0.05 8.6 ± 0.81 149.62±7.66 0.1 8.3 ± 0.58 63.56±3.14 0.2 8.1 ± 12.12 0.0 0.3 8.0 ± 0.06 0.0 0.4 7.89 ± 0.06 0.0 0.5 7.8 ± 0.10 0.0 1 6.10 ± 0.06 0.0 In Vivo studies on the effect of pure melanin pigment on aflatoxin B1 concentration in cereals (wheat grains):
The results in Table (7) show that the aflatoxin B1 concentration in wheat grains was reduced with the increase of pure melanin pigment as compared with the control. Table (7): Effect of addition of different concentrations of pure melanin pigment on aflatoxin production in wheat grains.
Pure melanin pigment (g) Aflatoxin B1 (µg/kg) Control 483.30±16.70 0.05 450.00±.00 (a) 0.1 438.89±9.62 0.3 427.78±9.62 0.5 388.89±19.24 1 383.33±28.87 2 377.78±38.49 3 372.22±25.46 4 333.33±16.67
4. Discussion
Out of thirty different strains of actinomycetes tested for melanin pigment production, only one strain produced dark brown pigment. This pigment was identified as melanine. A similar screening was
obtained by Zonova (1965); Coelho and Linhares (1993); Ravishankar et al (1995) and Dastager et al. (2006). The melanin producing isolate was tested on different media. Starch nitrate medium was proved to be the best medium for melanin production. Similar results were obtained by Shirling and Gottlieb (1966); El-Gammal (1979); Hussein and El-Gammal (1980).
Since Starch nitrate medium was proved to be the best, its components were further studied. However, starch was replaced by different carbon sources; the results indicated that starch was the best carbon source for melanin production as compared to glycerol, glucose, fructose and sucrose. Similar results obtained by Venkatesan et al. (2008) who reported that starch was the most effective carbon source for the production of melanin, followed by glycerol and fructose. But our results were in contrast with the results obtained by Hewedy and Ashour (2009), they Found that Kluyveromyces marxianus and Streptomyces chibaensis produced the pigment with all carbon sources used and the main effective carbon source for all treatments was D-xylose with concentration of 20 g/l.
When potassium nitrate (the main nitrogen source in starch nitrate medium) was replaced by equimolecular weights of ammonium chloride, sodium nitrate, peptone and tryptone, the results proved that potassium nitrate was the best nitrogen source for the experimental actinomycetes isolate to produce the melanin pigment. Similar results obtained by Venkatesan et al. (2008) who isolated six strains among 25 streptomyces isolates producing a diffusible dark brown pigment on streptomyces isolation agar. They reported that carbon and nitrogen sources influence the pigment production by the Streptomyces isolates.
Our results showed that the optimum temperature for the growth and the melanin production was 30˚C. Diraviyam et al. (2011) reported that Streptomyces D5 produced melanin pigment after 14 days of incubation at 28°C on wheat and rice medium.
Neutral pH was preferable for melanin production by the actinomycetes isolate in starch nitrate medium. Similar results obtained by Ulukus (1984). Ali et al. (2011) reported that Streptomyces virginiae was the most producer of a diffusible dark brown pigment on peptone-yeast extract after 6 days of incubation on a rotary shaker (180 rpm) at 30 °C.
Examination of the actinomycetes isolate on tyrosine liquid medium with various concentrations of L-tyrosine (1.5, 1.8, 2.1, 2.4 and 2.7 g/L) showed that increasing the L-tyrosine concentrations, enhanced the melanin production and growth of the organism. Similar results were obtained by Nurudeen

Life Science Journal 2013;10(1) http://www.lifesciencesite.com
1445
and Ahern (1979) who noted that the production of extracellular melanins in some organisms increased as the concentration of tyrosine increased up to 0.1 % tyrosine.
Quadri and Agsar (2012) isolated thermo-alkaliphilic Streptomyces strains, able to produce melanin from limestone quarries of the Deccan traps and the maximum synthesis of melanin was recorded by utilizing starch (2.98µg/ml) and tyrosine (3.12µg/ml) as the carbon and nitrogen sources respectively in Shinobu's synthetic tyrosine medium.
The study of Bell and Wheeler (1986) described melanins as dark-brown to black pigments found in animals, plants, bacterial and fungal species and reported that tyrosinase is the key enzyme for producing melanin.
In the present study the obtained pigment responded positively to all physical and chemical tests that are diagnostic for the standard melanin (Thomas, 1955; Sussman et al., 1963; Ellis and Griffitts, 1974; Krysciak, 1985; Butler and Day 1998; Shrishailnath et al., 2010).
The melanin produced by the isolated actinomycetes isolate showed peaks in the UV region of the wave length ranging from 200-260 nm but none in the visible region as reported by Bell and Wheeler(1986) and Shrishailnath et al. (2010).
In the present study, the Infra red (IR) absorption spectra of the melanin produced by the actinomycetes isolate showed that the characteristic absorption bands that would be expected from an aromatic substance and their wave number was similar to the wave number of the melanin precursors. These results agree with the results obtained by Bonner and Duncan (1962); Ellis and Griffitts (1974).
In the present investigation, the UV, visible IR spectra and chemical properties were similar to that of the melanin precursor. So, it could be concluded that the studied structure of melanin produced from the studied actinomycetes isolate was similar to the biosynthesis of dihydroxyphenylalanin (DOPA) melanin from tyrosine.
Through the in vitro studies, we noted that aflatoxin production was reduced with the increase of pure melanin pigment concentrations up to 0.1g/ 100 ml culture, after that aflatoxin production was completely inhibited with the increase of pure melanin pigment concentration as compared with control. Also the growth of A. flavus decreased with the increase of concentration of pure melanin pigment as compared with control.
Melanins are negatively charged composed of multi-functional polymers and polyphenolic compounds. Phenolic compounds are known for their antimicrobial and antifungal activity (Friend, 1979)
and their inhibitory effect on aflatoxin production has also been reported (Sinha and Singh 1981; Bilgrami et al., 1982). Phenolic compounds reduce aflatoxin production by A. flavus and A. parasiticus (Fajardo et al. 1995; Aziz et al., 1998; Hua et al 1999). These compounds inhibited one or more early rather than late steps in the pathway, so accumulation of toxic intermediate formed in the later steps will not occur. Similar results obtained in our in vivo studies where the aflatoxin B1 concentration in wheat has been reduced with the increase of pure melanin pigment as compared with control.
Agricultural crops, especially corn, wheat, cotton, peanuts, and tree nuts infected by Aspergillus flavus and Aspergillus parasiticus, may contaminate by aflatoxins which can present a risk of hepatic carcinogenicity to humans. Inhibition of aflatoxin production is correlated with the amount of phenolic compound as (Gallic acids, tannins and melanin pigment) present. The evidence indicated that phenolic compounds are capable of inhibition of growth of A. flavus and that aflatoxigenicity is phytochemicaly inhibited by biosynthesis and maintenance of high levels of phenolic compounds (Molyneux et al., 2004). Aflatoxin B1 (AFB1) is the most toxic and is usually produced in the greatest quantity, also found in most foods, e.g. cereal grains (maize, wheat, oats, rice), ground nuts, peanut butter, mung beans, Brazil nuts, almonds, cotton seed and meal, cayenne paper, Indian chili powder, bread, eggs, and meat (Halt, 1994; Tseng, 1994; Hafez, 1996).
A comparison of the description of the selected isolate with the descriptions of Streptomyces in Bergey's Manual of Systematic Bacteriology (1989) showed that the selected strain had chemotaxonomic properties, cultural characteristics and morphological criteria that was consistent with the genus Streptomyces. There are 3 species have spiral spore chain, produce melanin pigment and a knobby spore surface that is intermediate between warty and spiny. These are Streptomyces torulosus, Streptomyces lomondensis and S. spinoverrucosus. The Streptomyces lomondensis with blue spore mass, S. spinoverrucosus with green, yellow, red or grey spore mass depending on the medium but S. torulosus is the only one has grey spore mass like our isolate. Comparing fatty acid pattern of our strain with the same fatty acid patterns of some Streptomyces species like S. albus (McNabb et al., 1997), we show similarities in the (14: 0), (16:0), (17:0) that were about 19.2, 40.1and 1.6 % as compared with the S. albus that were about 18.1, 33.1 and 1.5% .
The mol % G + C of the DNA was 71.0, positive Gram stain, acid fast negative, phospholipids was PII, no diagnostic sugar in the whole cell, the

Life Science Journal 2013;10(1) http://www.lifesciencesite.com
1446
cell wall chemotype I contain L-DAP acid. Most of the physiological, biochemical and morphological studies showed similarities between this strain and Streptomyces torulosus, so this isolate was identified as S. torulosus. Corresponding author Mohamed Tawfiek Shaaban Botany Department, Faculty of Science, Menoufia University , Egypt [email protected] References Allen, O. N. (1950). Experiments in soil
bacteriology. Burgess publishing Co., U S A Alexander, M. and Kuo, M. J. (1967). Inhibition of
the lysis of fungi by Melanins. J. Bacteriol., 94(3): 624-629.
Ali, M. A.; Keera, A. A.; Helmy, M. S.; Abd El-Nasser, H. N.; Ahmed, K. A. and El-Hennawi, H. M. (2011). Selection of Pigment (Melanin) production in Streptomyces and their application in Printing and Dyeing of Wool Fabrics. Research Journal of Chemical Science, 1(5): 22-28.
A. O. A. C. (1984). Official Methods of Analysis of Association of Official Analytical Chemists. 14th ed., AOAC, Washington VA., Chapter 26, "Natural Poisons". pp. 480-494.
Aziz, N. H.; Farag, S. E.; Mousa, L. A. A. and Abo-Zaid, M. A. (1998). Comparative antibacterial and antifungal effects of some phenolic compounds. Microbios, 93: 43-54.
Bell, A. and Wheeler, M. M. H. (1986). Biosynthesis and function of fungal melanins. Ann. Rev. Phytopathol, 24: 411-451.
Bergey,s Manual of Systematic Bacteriology. (1989). Edited by Williams, S. T., Sharp E. and Holt, J.G. Baltimore, Hongkong, Sydney. William and Wilkins, 4 pp. 2452-2492.
Betina, V. (1989). Mycotoxins: Chemical, Biological and Environmental Aspects. Elsevier, Amsterdam, pp. 75-79.
Bligh, E. G. and Dyer, W. J. (1959). A rapid method of total lipid extraction and purification. Can. J. Biochem. Physiol., 37: 911- 917.
Bilgrami, K. S.; Sinha, K. K. and Premlata, S. (1982). Prevention of aflatoxin production on some cereals and oil seeds by o-vanillin. Current Science, 51: 138.
Bonner, T. G. and Duncan, A. (1962). Infrared spectra of some melanins. Nature, 194: 1078-1079.
Butler, M. J. and Day, A. W. (1998). Fungal melanins: a review. Can. J. Microbiol., 44: 1115-1136.
Card, G. L. (1973). Metabolism of phosphatidylglycerol, phosphatidylethanolamine, and cardiolipin of Bacillus stearothermophilus. J. Bacteriol., 114 (3): 1125-1137.
Coelho, R. R. R. and Linhares, L. F. (1993). Melanogenic actinomycetes (Streptomyces sp.) from Brazilian soils. Biology and Fertility of Soils, 15(3): 220-224.
Colwell, R. R. and Grigorova, R. (1987). Identification of microorganisms by rapid DNA-DNA hybridization (Tourova TP, Antonov AS. eds). In: Methods in Microbiology. Academic Press Limited, 19: 335-336.
Cotty, P. J.; Bayman, P.; Egel, D.S. and Elias, D. S. (1994). Agriculture, aflatoxins, and Aspergillus. In: Powell, K. A., Fenwick, A., and Peberdy, J. F. (Eds.). The genus Aspergillus. New York. Plenum Press, pp. 1-27.
Dastager, S. G.; Li, W. J.; Dayanand, A.; Tang, S. K.; Tian, X. P.; Zhi, X. Y.; Xu L. H. and Jiang C. L. (2006). Separation, identification and analysis of pigment (melanin) production in Streptomyces. African J. of Biotechnology, 5: 1131-1134.
Diraviyam, T.; Radhakrishnan, M. and Balagurunathan, R. (2011). Antioxidant activity of melanin pigment from Streptomyces species D5 isolated from Desertsoil, Rajasthan, India. Drug Invention Today, 3(3),12-13.
El-Gammal, A. A. (1979). Studies on neomycin produced by Streptomyces fradiae. Egyptian Journal of Microbiology, 14: 103-105.
Ellis, P. H. and Griffitts, D. A. (1974). The location and analysis of melanins in the cell walls of some soil fungi. Can. J. Microbiol., 20: 1379-1386.
Engstrom, K.; Bishammar, S.; Svensson, C.; Bengtsson, M. and Andersson, R. (1993). Anthraquinones from Drechslera species and Bipolaris sorokiniana. Mycol. Res., 97(3): 381-384.
Fajardo, J. E.; Waniska, R. D.; Cuero, R. G. and Pettit, R. E. (1995). Phenolic compounds in peanut seeds: enhanced elicitation by chitosan and effects on growth and aflatoxin B1 production by A. flavus. Food Biotechnol., 9: 59-78.
Food and Agriculture Organization of the United Nations (FAO) and UNEP. (1989). Sampling of Agricultural products and their Analysis for Aflatoxin Determination. Center of International Projects, the USSR State Committee for Environment Protection, Moscow.
FAO. (1990). Manuals of Food Quality Control. 10. Training in Mycotoxins Analysis FAO Food and Nutrition paper 14/10. FAO, Rome.
Frases, S.; Salazar, A.; Dadachova, E. and Casadevall, A. (2007). Cryptococcus neoformans

Life Science Journal 2013;10(1) http://www.lifesciencesite.com
1447
of applied and can utilize the bacterial melanin precursor homogentisic acid for fungal melanogenesis. J. Environ. Microbiol., 73(2): 615-621.
Fredericq, E.; Oth, A. and Fontaine, F. (1961). The ultraviolet spectrum of deoxyribonucleic acids and their constituents. J. Mol. Biol., 3: 11-17.
Friend, J. (1979). Phenolic substances and plant disease. In Biochemistry of Plant Phenolics ed. Swain, T., Harbonne, J. B. and Van Sumere, C. F. New York: Plenum Press. pp. 557-588.
Gadd, G. M. (1982). Effect of media composition and light on colony differentiation and melanin synthesis in Microdochium bolleyi. Trans. Br. Mycol. Soc., 78(1): 115-122.
Gauvreau, D. and Waring, M. J. (1982). Quantitative determination of echinomycin by disc agar diffusion assay. European. J. Appl. Microbiol. Biotechnol., 15: 104-110.
Hafez, A. S. (1996). Ist Inter. Conf. on Environ. Pollution & Health. King Fahd Hospital, Jeddah, Saudi Arabia. 8th-11 January, 1996 (Abstract).
Halt, M. (1994). Aspergillus flavus and aflatoxin B1 in flour production. European J. of Epidemiology, 10: 555-558.
Harki, E.; Talou, T. and Dargent, R. (1997). Purification, characterization and analysis of melanin extracted from Tuber melanosporum vitt., Food Chem., 58: 69-73.
Heathcote, J. G. and Hibbert, J. P. (1978). Aflatoxins: Chemical and Biological Aspects. Elsevier Science Publishing, Inc., New York.
Hewedy, M. A. and Ashour, S. M. (2009). Production of a Melanin like Pigment by Kluyveromyces marxianus and Streptomyces Chibaensis. Australian Journal of Basic and Applied Sciences, 3(2): 920-927.
Holt, J. G.; Krieg, N. R.; Sneath, P. H. A.; Staley, J. T. and Williams, S.T. (1994). Genus Streptomyces. (eds). Bergey’s Manual of Determinative Bacteriology. 9th ed. Williams and Wilkins Baltimore. USA., pp.668-675.
Hua, S. S. T.; Grosjean, O. K. and Baker, J. L. (1999). Inhibition of aflatoxin biosynthesis by phenolic compounds. Letters in Applied Microbiology., 29: 289-291.
Hussein, A. M. and El-Gammal, A. (1980). An antibiotic produced by Streptomyces violaceoniger. Egyptian Journal of Botany, 23(3): 187-190.
Kane, B. E. and Mullins, J. T. (1973). Thermophilic fungi in a municipal waste compost system Mycologia, 65(5): 1087-1100.
Krysciak, J. (1985). Solubility of melanin and humin preparations in polar aromatic solvents. Folia Biol., 33: 195-214.
Kuster, E. (1972). Simple working key for the classification and identification of named taxa included in the international Streptomyces Project. Int. J. Syst. Bacteriol., 22: 139-148.
Margalith, P. (1992). Pigment Microbiology. Chapman and Hall, London.
McNabb, A.; Shutteworth, R.; Bechme, R. and ColBy, W. D. (1997). Fatty acid characterization of rapidly growing pathogenic aerobic actinomycetes as a mean of identification. Journal of Clinical Microbiology, 1361-1368.
Mencher, J. R. and Heim, A. H. (1962). Melanin biosynthesis by Streptomyces lavendulae. J. Gen. Microbiol., 28: 665-670.
Molyneux, R. J.; Mahoney, N. E.; Kim, J. H. and Campbell, B. C. (2004). Inhibition of aflatoxin biosynthesis in Aspergillus flavus by phenolic natural products. United States Department of Agriculture.
Nakato, L. (2006). Melanin and Bio/Nanotechnology. Blackherbals at the Source of the Nile, UG Ltd.
Nesbitt, B. F.; Kelly, J. O.; Sargeant , K. and Sheridan, A. (1962). Aspergillus flavus and turkey X disease. Toxic metabolites of Aspergillus flavus. Nature, 195: 1062-1063.
Nonomura, H. (1974): Key for classification and identification of 458 species of Streptomycetes included in ISP project. J. Ferm. Technol., 52: 78-92.
Nurudeen, T. A. and Ahern, D. G. (1979). Regulation of melanin production by Cryptocccus neoformans. Journal of clinical Microbiology, 10: 724-729.
Purchase, I. F. H. (1971). Symposium on mycotoxins inhuman health. The Macmillan Press, Let., London and Basingstoke.
Quadri, S. R and Agsar, D. (2012). Detection of melanin producing thermo-alkaliphilic Streptomyces from limestone quarries of the Deccan traps. World Journal of Science and Technology., 2(2):08-12.
Ravishankar, J. P.; Muruganandam, V. and Suryanarayanann, T. S. (1995). Isolation and characterization of melanin from a marine fungus. Bot. Mar., 38 (5): 413-416.
Rowley, B. I. and Pirt, S. J. (1972). Melanin production by Aspergillus nidulans in Batch and chemostat culture, Journal of Gen. Microbiol., 72: 553-563.
Schuller, S.P. and Van Egmond, V.H.P. (1983). Proc. Int. Symp. Mycotoxins, Cairo, Egypt, pp. 111-131.
Scribner’s, E.; Terry, T. and Bradley, S. G. (1973). Production of a sporulation pigment by
Life Science Journal 2013;10(1) http://www.lifesciencesite.com
1448
Streptomyces venezuelae. Appl. Microbiol. 25 (6): 873-879.
Shannon, G. M.; Shotwell, O. L. and Kwolek, W. F. (1983): Extraction and thin-layer chromatography of aflatoxin B1 in mixed feeds. J. Assoc. Offic. Anal. Chem., 66: 582-586.
Shirling, E. B. and Gottlieb, D. (1966). Methods for characterization of Streptomyces species. Int. J. of Syst. Bacteriol., 16: 313-340.
Shrishailnath, S.; Kulkarni, G.; Yaligara, V.; Kyoun, L. and Karegoudar, T. B. J. (2010). Purification and Physiochemical Characterization of Melanin Pigment from Klebsiella sp. Microbiol, Biotechnol., Department of Microbiology, Changwon National University, Korea, 20(11): 1513-1520.
Sinha, K. and Singh, P. (1981): Effects of some phenolics on aflatoxin production and growth of Aspergillus parasiticus. Ind. Phytopathol., 34: 530-531.
Staneck, J. L. and Roberts, G. D. (1974). Simplified approach to identification of aerobic actinomycetes by thin layer chromatography. Appl. Microbiol., 28: 226-231.
Sussman, A. S.; Lingappa, Y. and Bernstein, L. A. (1963): Effect of light and media upon growth and melanin formation in Cladosporium mansoni. Mycopathol. Mycol. App., 10: 809-810..
Szabo, I. M. and Csortos, C. S. (1975). A study of the nutrient content of canopy through fall in an Oak forest (Quercetum petraeae-cerris) measured for one year. Acta. Bot. Acad. Sci. Hung., 21: 419-432.
Szabo, I.; Marton, M.; Buti, M. and Fernandez, C. (1975). A diagnostic key for the identification of “species” of the Streptomyces and Streptoverticillium included in the international Streptomyces Project. Acta Bot. Acad. Sci. Hung., 21: 387-418.
Takeda, Y.; Isohata, E.; Amono, R. and Uchiyama, M. (1979). Simultaneous extraction and fractionation and thin layer chromatographic determination of 14 mycotoxins in grains. J. Assoc. Off. Anual. Chem., 62: 573-578.
Thomas, M. (1955): Melanins. (Paech, K. and Tracey. M. U., eds) Modern Methods of plant analysis. 4 springer Verlag-Berlin, 661-675.
Tseng , T. C. (1994). Recent aspects of aflatoxin research in Taiwan J. Toxicology - Toxin Rev, 13: 229-241.
Ulukus, I. (1984). A suitable medium for production of soluble red pigment by some strains of Macrophomin phaseoli (Maub1.). Ashby. J. Turkish-phytopathol., 13: 2-3: 53-61.
Venkatesan, S.; Ganesan, R. and Muthuchelian, K. (2008). Isolation, Identification and Characterization of Melanin Pigment Production in Streptomyces from Megamalai Forest Soil. Ethnobotanical Leaflets, 12: 827-831.
Williams, S. T.; Goodfellow, M. and Alderson, G. (1989). Genus streptomyces, Waksman and Henrici. (1943), In Bergey,s Manual of systematic Bacteriology. Edited by: Williams, S. T., Sharp, M. E., and Holt, J. G. Baltimore Hongkong Sydney. William and Wilkins, 4. pp. 2452-2492.
Zonova, G. M. (1965). Melanoid pigments of Actinomycetes. Mikrobiologiya, 34: 278-283.


![Melanin Translation[1]](https://static.fdocuments.in/doc/165x107/577d22411a28ab4e1e96f1ae/melanin-translation1.jpg)