Student Barometer Entry Wave 2011 All material strictly copyright © IGI Services Ltd 2011 1.
25
Student Barometer Entry Wave 2011 erial strictly copyright © IGI Services Ltd 2011 1
-
Upload
julius-brooks -
Category
Documents
-
view
214 -
download
0
Transcript of Student Barometer Entry Wave 2011 All material strictly copyright © IGI Services Ltd 2011 1.

Student Barometer Entry Wave 2011
All material strictly copyright © IGI Services Ltd 2011 1

Student Barometer Entry Wave 2011
All material strictly copyright © IGI Services Ltd 2011 2
Immigration - resolution of new guidelinesIncreasing diversity; and domestic – international student interactionThe high dollar seems here to stay – ensuring accurate advice regarding fees and costs of living/ accommodation Secure pathways: TNE arrangements and new partnershipsRegional university growth strategiesConsistent local transport concessionsSecuring HDR students
Australian Hot Topics in Education

Student Barometer Entry Wave 2011
All material strictly copyright © IGI Services Ltd 2011 3
Management Summary ISB/SBOverall satisfaction at UQ remains high (86.6%) – ranked in top 8 in Australia (last year top 5)
Good response 30% (2010 38%)Current students main marketing asset (28% actively recommend)Postgraduate population particularly supportive –( HDR 38%)Attracting students - diverse range of markets – reliance on China, Malaysia, Singapore
Diverse range of subjects – spread the riskUQ reputation continues to be a major decision-making factor - word of mouth promotion, staff, students, friends, website, agent, parents – core marketing efforts

Student Barometer Entry Wave 2011
All material strictly copyright © IGI Services Ltd 2011 4
Management Summary ISB/SBLess reliant on agents than competition Application processes are slow, only 55% satisfaction level for HDR (manage expectations)10% student sample looking for further study – opportunity?Strengths – safety; good place to be; library; learning technologies; expert lecturers; program content; laboratories; learning spacesWeaknesses – Host friends; employability/careers; cost of living and accommodation; social activities; response from application to offer; internet on arrival (Opportunities to teach for domestic only)
Student Barometer Entry Wave 2011
All material strictly copyright © IGI Services Ltd 2011 5
Arrival Learning Support
RESPONSE LEARNING LIVING SUPPORT APPENDIXDESTINATION APPLICATION EXPECTATIONS ARRIVAL

Student Barometer Entry Wave 2011
All material strictly copyright © IGI Services Ltd 2011 6
2.3
2.5
2.7
2.9
3.1
3.3
3.5Entry 2008
Entry 2010
Entry 2011
Arrival satisfaction – element year on year comparison (International students)
1:
Ver
y di
ssati
sfied
4: V
ery
satis
fied
RESPONSE LEARNING LIVING SUPPORT APPENDIXDESTINATION APPLICATION EXPECTATIONS ARRIVAL
Student Barometer Entry Wave 2011
All material strictly copyright © IGI Services Ltd 2011 7
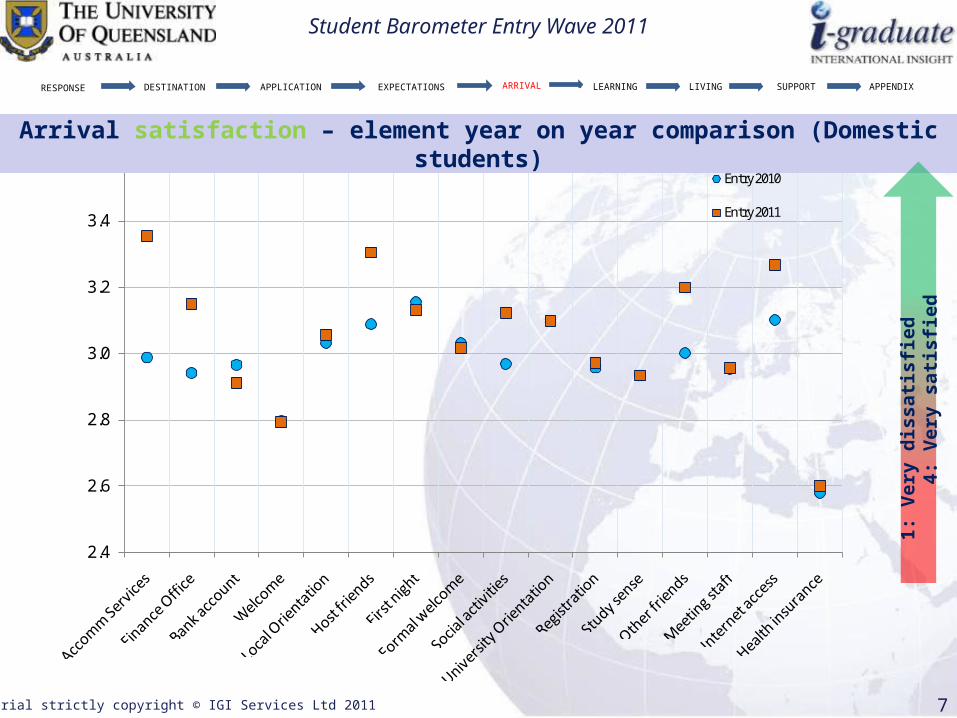
2.4
2.6
2.8
3.0
3.2
3.4
3.6Entry 2010
Entry 2011
Arrival satisfaction – element year on year comparison (Domestic students)
1:
Ver
y di
ssati
sfied
4: V
ery
satis
fied
RESPONSE LEARNING LIVING SUPPORT APPENDIXDESTINATION APPLICATION EXPECTATIONS ARRIVAL
Student Barometer Entry Wave 2011
All material strictly copyright © IGI Services Ltd 2011 11
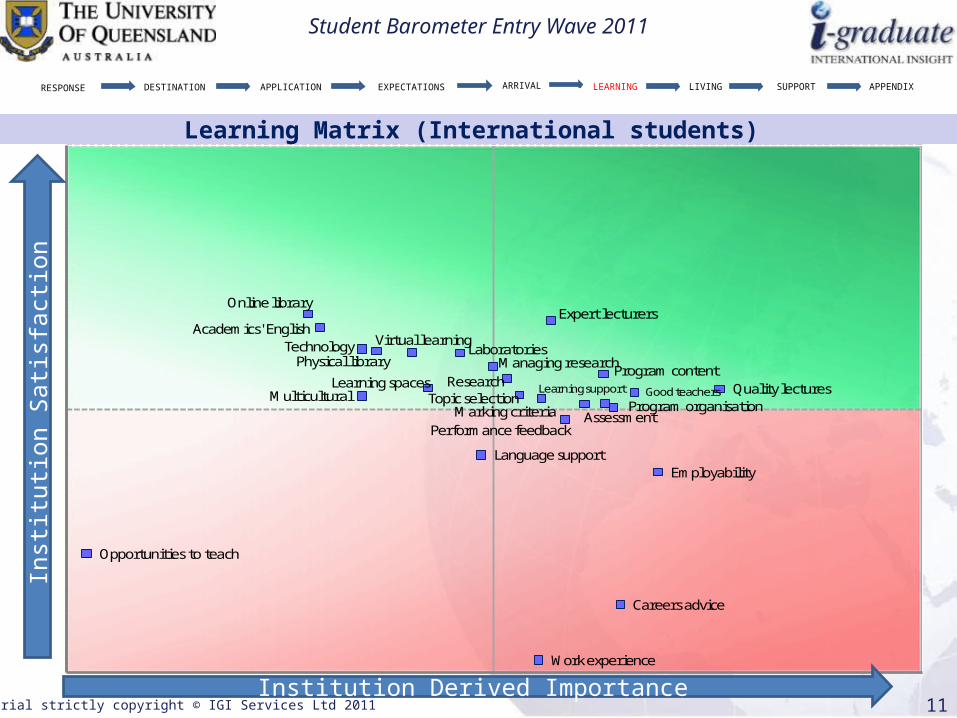
Work experience
Virtual learningTechnology
Research Quality lectures
Performance feedback
Opportunities to teach
Program organisationMulticultural
Language support
Laboratories
Learning spaces Learning support
Physical library
Online library
Topic selection Good teachers
Employability
Expert lecturers
Managing researchProgram content
Careers advice
AssessmentMarking criteria
Academics' English
Institution Derived Importance
Insti
tutio
n Sa
tisfa
ction
Learning Matrix (International students)
RESPONSE LEARNING LIVING SUPPORT APPENDIXDESTINATION APPLICATION EXPECTATIONS ARRIVAL
Student Barometer Entry Wave 2011
All material strictly copyright © IGI Services Ltd 2011 12
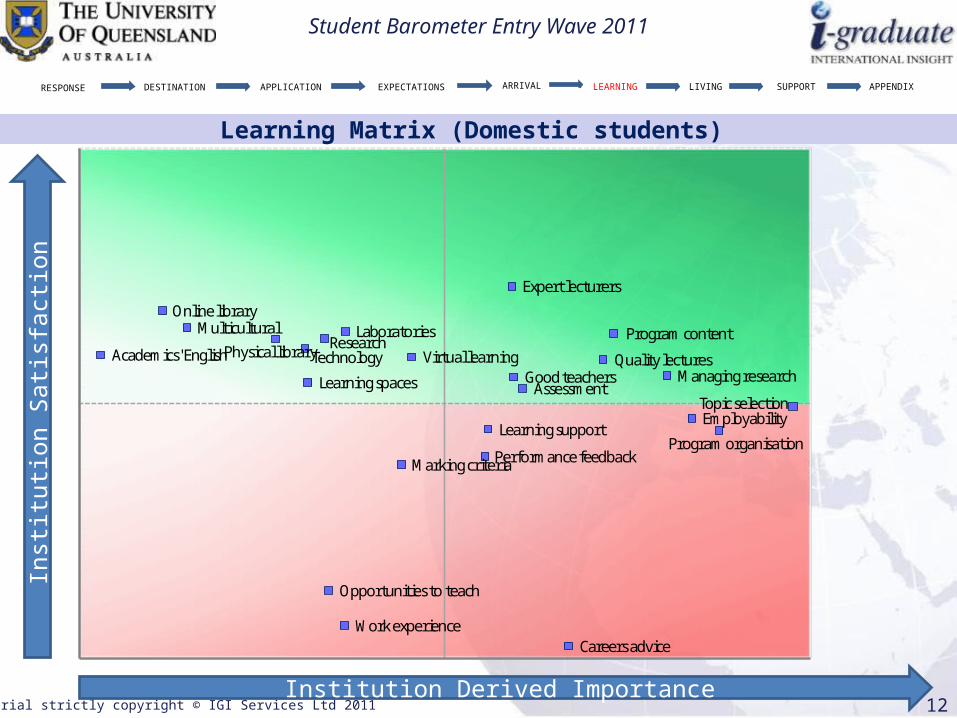
Work experience
Virtual learningTechnologyResearch
Quality lectures
Performance feedback
Opportunities to teach
Program organisation
Multicultural Laboratories
Learning spaces
Learning support
Physical library
Online library
Topic selection
Good teachers
Employability
Expert lecturers
Managing research
Program content
Careers advice
Assessment
Marking criteria
Academics' English
Institution Derived Importance
Insti
tutio
n Sa
tisfa
ction
Learning Matrix (Domestic students)
RESPONSE LEARNING LIVING SUPPORT APPENDIXDESTINATION APPLICATION EXPECTATIONS ARRIVAL

Student Barometer Entry Wave 2011
All material strictly copyright © IGI Services Ltd 2011 1313
Learning element % Satisfaction p-value* UQ vs ISB UQ vs Australia UQ vs Go8
Learning Overall (2415) 83% 0.00 -2% 0% 1%Learning Average 85% 0.00 1% 2% 3%
Benchmarking – Learning (International Students)
*Independent samples t-test, Institution versus Entry ISB, significant differences (p<=0.05) are highlighted in blue**Postgraduate students only
RESPONSE LEARNING LIVING SUPPORT APPENDIXDESTINATION APPLICATION EXPECTATIONS ARRIVAL

Student Barometer Entry Wave 2011
All material strictly copyright © IGI Services Ltd 2011 1414
Learning element % Satisfaction p-value* UQ vs SB
Learning Overall (6250) 88% 0.00 0%Learning Average 86% 0.00 0%
Benchmarking – Learning (Domestic students)
*Independent samples t-test, Institution versus Entry SB, significant differences (p<=0.05) are highlighted in blue**Postgraduate students only
RESPONSE LEARNING LIVING SUPPORT APPENDIXDESTINATION APPLICATION EXPECTATIONS ARRIVAL

Student Barometer Entry Wave 2011
All material strictly copyright © IGI Services Ltd 2011 19
2.4
2.6
2.8
3.0
3.2
3.4
Entry 2008
Entry 2010
Entry 2011
Learning satisfaction – element year on year comparison (International students)
1:
Ver
y di
ssati
sfied
4: V
ery
satis
fied
RESPONSE LEARNING LIVING SUPPORT APPENDIXDESTINATION APPLICATION EXPECTATIONS ARRIVAL

Student Barometer Entry Wave 2011
All material strictly copyright © IGI Services Ltd 2011 20
2.5
2.7
2.9
3.1
3.3
3.5
Entry 2010
Entry 2011
Learning satisfaction – element year on year comparison (Domestic students)
1:
Ver
y di
ssati
sfied
4: V
ery
satis
fied
RESPONSE LEARNING LIVING SUPPORT APPENDIXDESTINATION APPLICATION EXPECTATIONS ARRIVAL
Student Barometer Entry Wave 2011
All material strictly copyright © IGI Services Ltd 2011 21
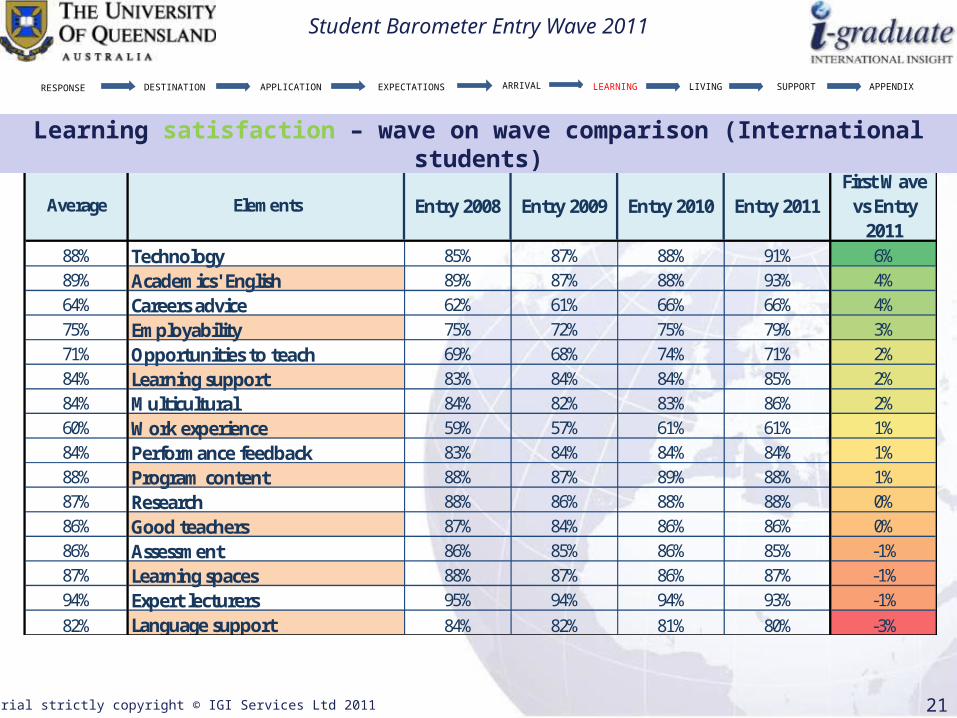
Average Elements Entry 2008 Entry 2009 Entry 2010 Entry 2011First Wave
vs Entry 2011
88% Technology 85% 87% 88% 91% 6%89% Academics' English 89% 87% 88% 93% 4%64% Careers advice 62% 61% 66% 66% 4%75% Employability 75% 72% 75% 79% 3%71% Opportunities to teach 69% 68% 74% 71% 2%84% Learning support 83% 84% 84% 85% 2%84% Multicultural 84% 82% 83% 86% 2%60% Work experience 59% 57% 61% 61% 1%84% Performance feedback 83% 84% 84% 84% 1%88% Program content 88% 87% 89% 88% 1%87% Research 88% 86% 88% 88% 0%86% Good teachers 87% 84% 86% 86% 0%86% Assessment 86% 85% 86% 85% -1%87% Learning spaces 88% 87% 86% 87% -1%94% Expert lecturers 95% 94% 94% 93% -1%82% Language support 84% 82% 81% 80% -3%
Learning satisfaction – wave on wave comparison (International students)
RESPONSE LEARNING LIVING SUPPORT APPENDIXDESTINATION APPLICATION EXPECTATIONS ARRIVAL
Student Barometer Entry Wave 2011
All material strictly copyright © IGI Services Ltd 2011 22
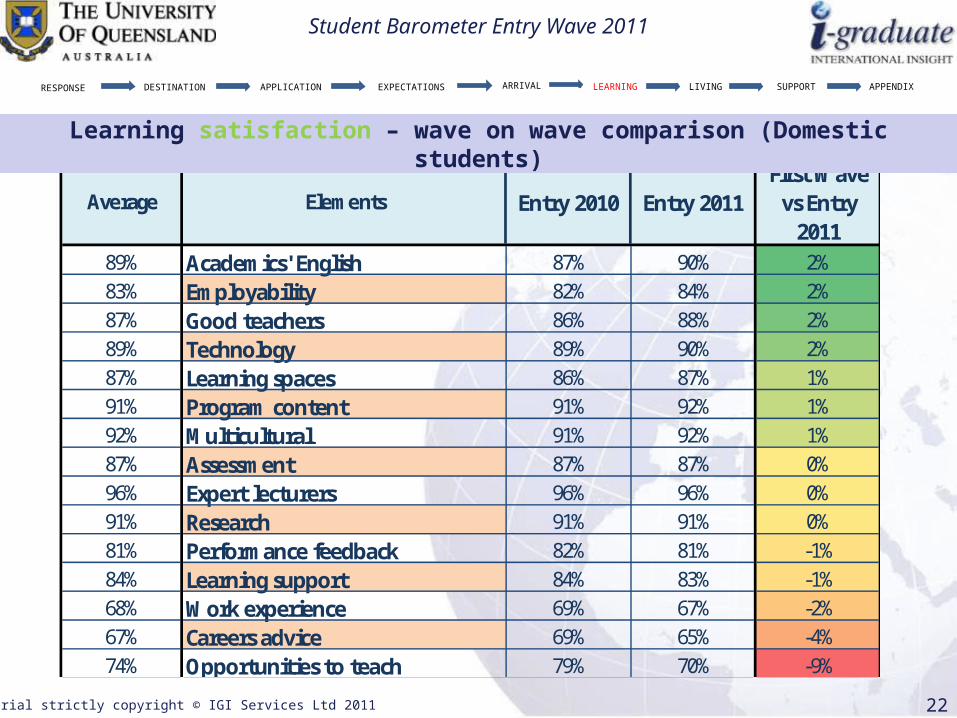
Average Elements Entry 2010 Entry 2011First Wave
vs Entry 2011
89% Academics' English 87% 90% 2%83% Employability 82% 84% 2%87% Good teachers 86% 88% 2%89% Technology 89% 90% 2%87% Learning spaces 86% 87% 1%91% Program content 91% 92% 1%92% Multicultural 91% 92% 1%87% Assessment 87% 87% 0%96% Expert lecturers 96% 96% 0%91% Research 91% 91% 0%81% Performance feedback 82% 81% -1%84% Learning support 84% 83% -1%68% Work experience 69% 67% -2%67% Careers advice 69% 65% -4%74% Opportunities to teach 79% 70% -9%
Learning satisfaction – wave on wave comparison (Domestic students)
RESPONSE LEARNING LIVING SUPPORT APPENDIXDESTINATION APPLICATION EXPECTATIONS ARRIVAL

Student Barometer Entry Wave 2011
All material strictly copyright © IGI Services Ltd 2011 23
SYMBOL FACULTYA Faculty of Arts
B Faculty of Business, Economics, Tourism and Law
C Faculty of Engineering, Architecture and Information Technology
D Faculty of Health Sciences
E Faculty of Social and Behavioural Sciences
F Science (and Natural Resources, Agriculture and Veterninary Science)
Key to Faculties – Learning (International students)
Back to the Table
RESPONSE LEARNING LIVING SUPPORT APPENDIXDESTINATION APPLICATION EXPECTATIONS ARRIVAL

Student Barometer Entry Wave 2011
All material strictly copyright © IGI Services Ltd 2011 2525
60 - 61 62 - 63 64 - 65 66 - 67 68 - 69 70 - 71 72 - 73 74 - 75 76 - 77 78 - 79 80 - 81 82 - 83 84 - 85 86 - 87 88 - 89 90 - 91 92 - 93 94 - 95 96 - 97
Learning Overall ACD @ BF EAcademics' English B @A CEF DAssessment AD @F BCECareers advice A B @ CDFProgram content CD @ABE FEmployability B E @A CF DExpert lecturers @ACDE BFGood teachers C D @AB E FLanguage support B A @CE D FLearning spaces B @E ADF CLearning support D @CF A BEMulticultural B A @ EF CDOpportunities to teach F @D CPerformance feedback D @BCF AEResearch B @ADE CFTechnology DE @AF BCWork experience @ F C DMarking criteria D A @BEF CManaging research E @CF DTopic selection A B @CE DFOnline library E A @BCDF
Physical library DF @BE A CLaboratories C E @DF B AProgram organisation D C @EF A BQuality lectures C D @ E ABFVirtual learning D @ACE F B
51 - 59
E
BAE
Learning satisfaction by Faculty (% satisfied) (International students)
@ = Institution ABC = Faculty
Faculty key
RESPONSE LEARNING LIVING SUPPORT APPENDIXDESTINATION APPLICATION EXPECTATIONS ARRIVAL
Student Barometer Entry Wave 2011
All material strictly copyright © IGI Services Ltd 2011 28Institution Usage
Insti
tutio
n Sa
tisfa
ction
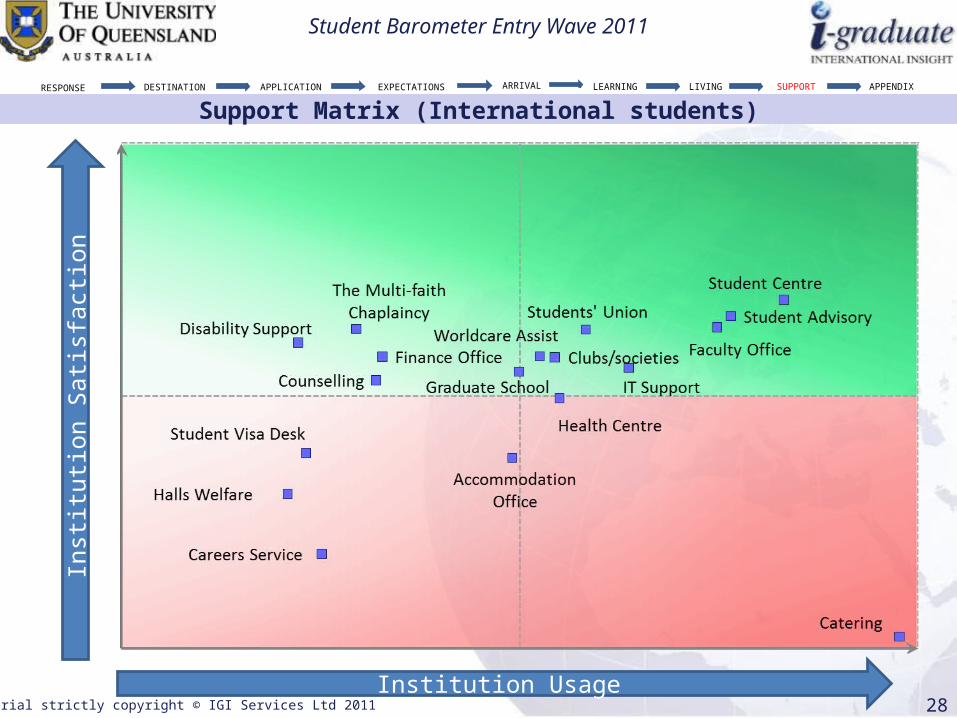
Support Matrix (International students)RESPONSE LEARNING LIVING SUPPORT APPENDIXDESTINATION APPLICATION EXPECTATIONS ARRIVAL
Student Barometer Entry Wave 2011
All material strictly copyright © IGI Services Ltd 2011 29Institution Usage
Insti
tutio
n Sa
tisfa
ction
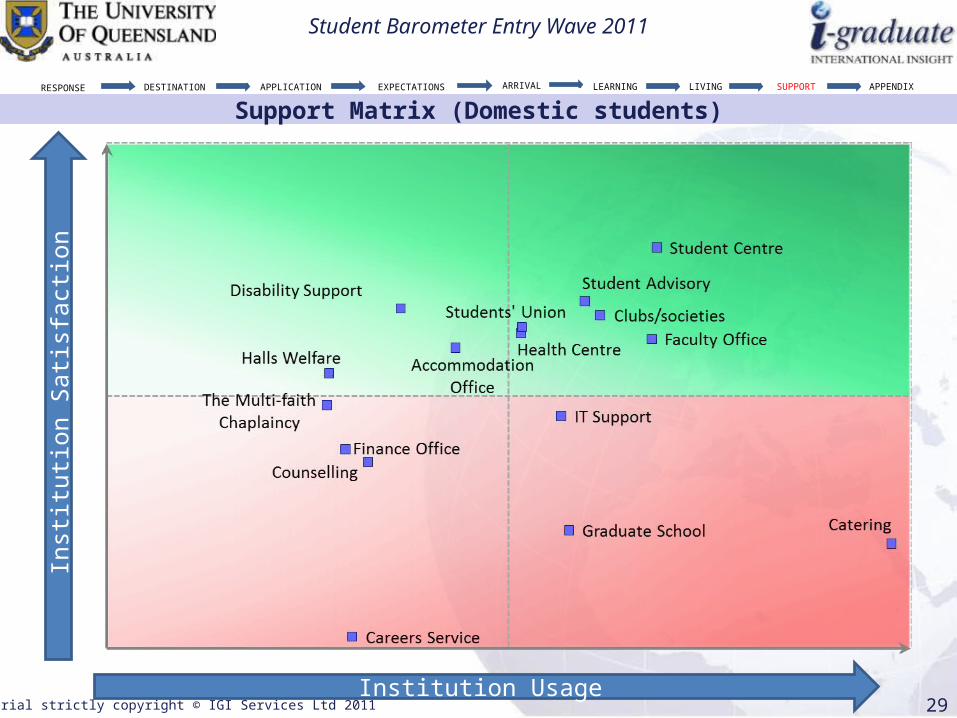
Support Matrix (Domestic students)RESPONSE LEARNING LIVING SUPPORT APPENDIXDESTINATION APPLICATION EXPECTATIONS ARRIVAL

Student Barometer Entry Wave 2011
All material strictly copyright © IGI Services Ltd 2011 3030
% Usage Support element % Satisfaction p-value* UQ vs ISB UQ vs Australia UQ vs Go8
Support Overall (2196) 89% 0.41 1% 2% 2%36% Support Average 89% 0.00 0% 1% 1%
Benchmarking – Support (International Students)
*Independent samples t-test, Institution versus ISB, significant differences (p<=0.05) are highlighted in blue
RESPONSE LEARNING LIVING SUPPORT APPENDIXDESTINATION APPLICATION EXPECTATIONS ARRIVAL

Student Barometer Entry Wave 2011
All material strictly copyright © IGI Services Ltd 2011 3131
% Usage Support element % Satisfaction p-value* UQ vs SBSupport Overall (5465) 90% 0.00 -2%
Benchmarking – Support (Domestic students)
*Independent samples t-test, Institution versus SB, significant differences (p<=0.05) are highlighted in blue
RESPONSE LEARNING LIVING SUPPORT APPENDIXDESTINATION APPLICATION EXPECTATIONS ARRIVAL

Student Barometer Entry Wave 2011
All material strictly copyright © IGI Services Ltd 2011 34
2.5
2.6
2.7
2.8
2.9
3.0
3.1
3.2
3.3
3.4
3.5Entry 2008
Entry 2010
Entry 2011
Support satisfaction – element year on year comparison (International students)
1:
Ver
y di
ssati
sfied
4: V
ery
satis
fied
RESPONSE LEARNING LIVING SUPPORT APPENDIXDESTINATION APPLICATION EXPECTATIONS ARRIVAL

Student Barometer Entry Wave 2011
All material strictly copyright © IGI Services Ltd 2011 35
2.7
2.8
2.9
3.0
3.1
3.2
3.3
3.4
3.5
3.6
Entry 2010
Entry 2011
Support satisfaction – element year on year comparison (Domestic students)
1:
Ver
y di
ssati
sfied
4: V
ery
satis
fied
RESPONSE LEARNING LIVING SUPPORT APPENDIXDESTINATION APPLICATION EXPECTATIONS ARRIVAL

Student Barometer Entry Wave 2011
All material strictly copyright © IGI Services Ltd 2011 36
Average Elements Entry 2008 Entry 2009 Entry 2010 Entry 2011First Wave vs
Entry 2011
71% Catering 66% 68% 76% 73% 7%87% The Multi-Faith Chaplaincy 90% 87% 78% 93% 3%90% Clubs/societies 89% 89% 89% 92% 2%83% Accomm Services 83% 80% 85% 85% 2%91% UQ Union 92% 89% 92% 93% 1%90% Graduate School 90% 90% 91% 1%90% Counselling 90% 89% 89% 90% 0%94% St Services 94% 93% 93% 94% 0%91% IT Support 91% 90% 91% 91% 0%84% Res Coll Welfare Support 83% 86% 83% -1%93% Disability Support 94% 93% -1%90% UQ Health Service 91% 91% 90% 89% -2%89% Finance & Business Serv 95% 82% 86% 92% -4%80% Careers Service 84% 82% 76% 79% -6%
Support satisfaction – wave on wave comparison (International students)
RESPONSE LEARNING LIVING SUPPORT APPENDIXDESTINATION APPLICATION EXPECTATIONS ARRIVAL

Student Barometer Entry Wave 2011
All material strictly copyright © IGI Services Ltd 2011 37
Average Elements Entry 2010 Entry 2011First Wave vs
Entry 2011
91% Accomm Services 90% 92% 2%93% Disability Support 92% 94% 2%93% St Services 92% 94% 2%79% Careers Service 78% 80% 2%83% Graduate School 83% 84% 2%92% UQ Union 92% 93% 1%89% IT Support 88% 89% 1%87% Counselling 86% 87% 1%92% UQ Health Service 92% 93% 1%87% Finance & Business Serv 87% 88% 0%94% Clubs/societies 94% 94% -1%91% The Multi-Faith Chaplaincy 92% 90% -3%85% Catering 86% 84% -3%93% Res Coll Welfare Support 95% 91% -4%
Support satisfaction – wave on wave comparison (Domestic students)
RESPONSE LEARNING LIVING SUPPORT APPENDIXDESTINATION APPLICATION EXPECTATIONS ARRIVAL