STRUCTURAL PERFORMANCE OF SILICATE -LIMESTONE …
79
i STRUCTURAL PERFORMANCE OF SILICATE -LIMESTONE COMPRESSED BRICKS DEFFO DEFFO LEOLEIN ROSTAND CE300-0003/15 A thesis submitted to Pan African University Institute for Basic Sciences Technology and Innovation in partial fulfillment of the requirements for the Engineering degree of Master of Sciences in Civil Engineering (Structures Option)
Transcript of STRUCTURAL PERFORMANCE OF SILICATE -LIMESTONE …

i
STRUCTURAL PERFORMANCE OF SILICATE -LIMESTONE
COMPRESSED BRICKS
DEFFO DEFFO LEOLEIN ROSTAND
CE300-0003/15
A thesis submitted to Pan African University Institute for Basic Sciences Technology and
Innovation in partial fulfillment of the requirements for the Engineering degree of Master of
Sciences in Civil Engineering (Structures Option)

ii
DECLARATION
This thesis is my original work and, has not been submitted for a degree in any other University.
Signed……………………………………….Date …………………………….
Deffo Deffo Leolein Rostand
This thesis has been submitted for examination with our approval as University Supervisors.
Signed……………………………………..Date …………………………….
Prof. Raphael N. Mutuku
Technical University of Mombasa, KENYA
Signed………………………………………..Date …………………………….
Dr. Timothy Nyomboi
MOI UNIVERSITY, KENYA

iii
DEDICATION
This thesis is humbly dedicated to my friends, my beloved family: my mum and my dad.

iv
ACKNOWLEDGEMENTS
I like to thank ALMIGHTY GOD for giving me his grace, strength and health during
my studies
I wish to express my gratitude to:
a. My supervisors (Prof. Raphael Mutuku and Dr. Timothy Nyomboi) for their cooperation,
suggestions and availability during the courses and research works
b. The African Union Commission to have given me the scholarship
c. The Pan African University to have given me the opportunity to access to this scholarship
program.
d. Jomo Kenyatta University of Agriculture and Technology (JKUAT) for having made
available the use of their laboratories for the experimental works.
e. My dear class mates for their collaborations.
f. All those who contributed to the achievement of this research works

v
ABSTRACT
Present concerns for sustainable development have led to a revival of traditional building
practices using natural or recycled resources. Silicate-limestone bricks are alternative building
materials, which are significantly cheaper than using conventional concrete block sand are
environmentally sustainable. The use of limestone, which makes up about 10% of the total
volume of all sedimentary rocks saves environmental pollution, energy and manufacturing cost.
In order to demonstrate silicate limestone as a suitable appropriate construction material, tests on
blocks and walls made from limestone and silicate materials were investigated to establish their
structural performance and suitability for eco-friendly house construction on the Africa
continent.
Water absorption and the density tests of the bricks were done, and the physical properties of
silicate limestone compressed bricks were observed and analyzed as the lime content was varied
between 0 to 100%. The results obtained show that as lime content increases, water absorption
also increases. Nevertheless, the results were within the recommended values i.e. less than
15%.ofmass ratio. The density of bricks decreased when lime contents were added. They were
all considered as heavy blocks because the values were more than 1000kg/m3. From these two
tests, it was noted that above 60% of lime content, the bricks become unstable.
The compressive and flexural tests on the bricks were done using a Universal Testing Machine
for vertical and transversal loading for the determination of the crushing strength. These tests
were done compared to the blocks available on the Kenya market. Compared to the blocks
available in the Kenya market, the silicate limestone had better strength, with the exception of
bricks at 100% of lime content, in which the compressive strength of 1.324 MPa was lower than
the minimum requirement for compressive strength, which is 2.5 MPa.
The tests done on the bricks showed clearly that the optimum percentage of lime replacement in
terms of physical and strength properties was 60%.The silicate limestone bricks wall was made
with this percentage of lime content and compared to clay brick and natural stone blocks wall.
The results of these tests showed that the strength properties of natural stone wall were higher
than those of silicate limestone wall, which is contrary to the results from the compressive
strength of their unit blocks.

vi
TABLE OF CONTENTS
DECLARATION....................................................................................................... ii
DEDICATION.......................................................................................................... iii
ACKNOWLEDGEMENTS .................................................................................... iv
ABSTRACT ............................................................................................................... v
TABLE OF CONTENTS ........................................................................................ vi
LIST OF TABLES .................................................................................................... x
LIST OF FIGURES ................................................................................................. xi
LIST OF PLATES .................................................................................................. xii
ABBREVIATIONS AND ACRONYMS .............................................................. xiii
CHAPTER ONE ....................................................................................................... 1
INTRODUCTION..................................................................................................... 1
1.1 Background to the study .................................................................................... 1
1.2 Problem statement .............................................................................................. 3
1.3 Study justification .............................................................................................. 3
1.4 Significance of the study .................................................................................... 4
1.5 Objectives .......................................................................................................... 4
1.5.1 General objective ......................................................................................... 4
1.5.2 Specific objectives ....................................................................................... 4
1.6 Scope of the study .............................................................................................. 5
CHAPTER TWO ...................................................................................................... 6
LITERATURE REVIEW ........................................................................................ 6
2.1 General ............................................................................................................... 6

vii
2.2 Material used in concrete and brick making ...................................................... 6
2.2.1 Sand.............................................................................................................. 6
2.2.2 Cement ......................................................................................................... 7
2.2.3 Water ............................................................................................................ 7
2.3 Sand Lime Bricks (SLB) .................................................................................... 8
2.3.1 Dense sand-lime bricks ................................................................................ 9
2.3.2 Light sand-lime bricks ................................................................................. 9
2.4 Autoclave process .............................................................................................. 9
2.5 Characteristic properties of sand-lime bricks .................................................. 10
2.6 Theoretical review of different type of stabilized wall panels ......................... 11
2.6.1 The performance of compressed stabilized earth block ............................. 11
2.6.2 Strength and Durability Properties of Cow Dung Stabilized Earth Brick . 12
2.7 Masonry walls panel testing............................................................................. 13
2.7.1 Testing on stabilized laterite quarry dust block wall ................................. 13
2.7.2 Testing on Burnt clay bricks wall panel .................................................... 14
2.8 Critique of the existing literature and research gaps ........................................ 14
CHAPTER THREE ................................................................................................ 15
MATERIALS AND METHODS ........................................................................... 15
3.1 General ............................................................................................................. 15
3.2 Materials properties ......................................................................................... 15
3.2.1 River sand .................................................................................................. 15
3.2.2 Cement ....................................................................................................... 15
3.2.3 Lime ........................................................................................................... 16

viii
3.3 Test on Meru’s sand ......................................................................................... 16
3.3.1 Sieve analysis ............................................................................................. 17
3.3.2 Silt content test ........................................................................................... 17
3.3.3 Water absorption and specify gravity ........................................................ 18
3.4 Production of silicate limestone bricks ............................................................ 19
3.5 Testing on blocks ............................................................................................. 22
3.5.1 Water absorption test ................................................................................. 22
3.5.2 Dry density of blocks ................................................................................. 23
3.5.3 Compressive strength test .......................................................................... 23
3.5.4 Flexural strength test .................................................................................. 25
3.6 Test on panel wall ............................................................................................ 27
CHAPTER FOUR ................................................................................................... 29
RESULTS AND DISCUSSIONS ........................................................................... 29
4.1 Sand properties................................................................................................. 29
4.2 The optimum mix ratio by vibration of control with ordinary Portland cement30
4.3 Effects of silicate-limestone content on physical and strength properties of bricks 31
4.3.1 Water absorption ........................................................................................ 31
4.3.2 Dry density ................................................................................................. 32
4.3.3 Compressive strength of silicate limestone bricks (SLB) .......................... 33
4.3.4 Flexural strength of silicate limestone bricks (SLB) ................................. 33
4.4 Performance comparison of SLB with local blocks in Kenya ......................... 34
4.5 Comparison of the structural performance of the three types of wall tested. .. 36
4.5.1 Load-displacement curves ......................................................................... 37

ix
4.5.2 Compressive capacity of walls................................................................... 37
4.5.3 Stress- strain characteristic of walls ........................................................... 39
4.5.4 Failure patterns of walls ............................................................................. 41
CHAPTER FIVE .................................................................................................... 43
CONCLUSIONS AND RECOMMENDATIONS ................................................ 43
5.1 General ............................................................................................................. 43
5.2 Conclusions ...................................................................................................... 43
5.3 Recommendations ............................................................................................ 43
REFERENCES ........................................................................................................ 44
APPENDICES ......................................................................................................... 46
x
LIST OF TABLES
Figure 1-1: Cycle of lime ............................................................................................. 2
Table 2.1: Sand-lime brick properties ........................................................................ 10
Table 2.2: Properties of compressed stabilized earth blocks VS walling materials .. 11
Table 3.1: Control mixtures with ordinary Portland cement ..................................... 19
Table 3.2: Mix proportion of silicate limestone brick ............................................... 21
Table 4.1: Physical properties of Meru sand ............................................................. 29
Table 4.2: Walls characteristics ................................................................................. 36

xi
LIST OF FIGURES
Figure 1-1: Cycle of lime ............................................................................................. 2
Figure 4.1: Particle sizes distribution curves of Meru sand ....................................... 29
Figure 4-2: Compressive strength curves of control mixes ....................................... 30
Figure 4-3: Water absorption curves of silicate limestone bricks .............................. 31
Figure 4-4: Bar chart of dry density of silicate limestone bricks ............................... 32
Figure 4-5: Compressive strength of SLB with varying lime contents ..................... 33
Figure 4-6: Flexural strength of SLB with varying lime contents ............................. 34
Figure 4-7: Structural performance of SLB and other blocks. ................................... 35
Figure 4-8: Load- deflection curve ............................................................................ 37
Figure 4-9: Maximum stress in the walls ................................................................... 38
Figure 4-10: Stress-vertical strain at the centre of the wall liaison ............................ 39
Figure 4-11: Stress-horizontal strain at the center of the wall ................................... 40

xii
LIST OF PLATES
Figure 1-1: Cycle of lime ............................................................................................. 2
Plate 3.1: Pile of river sand used in the research ....................................................... 15
Plate 3.2: Bag of cement used in the research ........................................................... 16
Plate 3.3: Bag of lime used in the research ................................................................ 16
Plate 3.4: Cube mortars by vibration ......................................................................... 20
Plate 3.5: Silicate limestone bricks and block compression machine ........................ 22
Plate 3.6: Compressive strength in a universal testing machine ................................ 25
Plate 3.7: Test Flexural strength in universal testing machine .................................. 26
Plate 3.8: Test setup for walls in the loading frame ................................................... 28
Plate 4.1: Failure patterns of silicate limestone wall ................................................. 41
Plate 4.2: Failure patterns of Clay bricks wall ........................................................... 42
Plate 4.3: Failure patterns of natural stone wall ......................................................... 42

xiii
ABBREVIATIONS AND ACRONYMS
w/c water to cement ratio
SLB Silicate Limestone Brick
USA United States of America
UK United Kingdom
μm Micrometer (micron)
MPa Mega Pascal
°C Degrees Celcius
% percent
N/mm2
Newton per square millimeters
kN
kilo Newton
kg/m3
kilogram per cubic meters
kg
kilogram
tons tonnes
SGD: Specific gravity on an oven dried basis
SGS: Specific gravity on a saturated and surface dried basis
SGA: Apparent specific gravity
VS: Versus
WA Water absorption

1
CHAPTER ONE
INTRODUCTION
1.1 Background to the study
Within many regions in Africa, there are large quantities of various raw materials such as
bauxite, and clay from which respectively refined materials are made such as aluminum, bricks
and tiles for civil engineering and construction related works but these can be optimally and
economically improved for use in constructions. Materials such as silica, limestone, and sand
when combined with water suitably can yield bricks used in various building construction. The
term “lime” refers to products derived from limestone by heating to various degrees of
temperatures, including quicklime and slaked lime.
Products derived from limestone (CaCO3) possess the unique ability to be processed and resume
their original form. The cycle of the lime is to bake limestone to form quicklime (CaO). Slaked
lime (Ca (OH)2) can be produced by adding water to quick lime. In this state, the carbon dioxide
content in the atmosphere or from industrial processes can then react with slaked lime to
reconvert to limestone. This cycle of continuity is called the cycle of lime. The required time for
lime to return to limestone state using industrial processes ranges from a few minutes to several
years using atmospheric conditions.

2
(www.britishlime.org)
Figure 1-1: Cycle of lime
Slaked lime is used in various applications whose needs are minimizing the environmental
impact of industrial processes; it also allows a stabilization of most metals by converting them
under more stable chemical forms. Silicate is a salt that comes from silica (SiO2) and constitutes
97% of the earth’s crust. It can be found in the material like clay. This ore is almost fire-proof
hence it is important in the manufacture of fire resistant or refractory bricks.
Silicate-limestone bricks are obtained by mixing hydraulic limestone with sand and water in
appropriate proportion or percentages. They are pressed under high hydraulic pressures to form
the required size of bricks/blocks, after that they are autoclaved for a specified time, temperature
and pressure to harden the bricks. Silicate limestone bricks have numerous advantages
(www.kalksandstein.ch)
They offer a good acoustic insulation
They have a good thermal insulation because they respire. This characteristic
contributes to healthy interior climate and prevents nuisances caused by moulds and
humidity.

3
They also accumulate and release heat. In this way, at any season it will always
provide favourable indoor climate
They are fire-proof materials due to the silicates that they contain
And they are sustainable and eco-friendly.
This material is not widely used as a construction alternative in within Africa; however, its
application as an alternative construction material is possible.
1.2 Problem statement
In the construction sector of many developing nations, there are quite a number of persistent
challenges especially in the building construction industry. These issues include exorbitantly
high costs of the construction materials and building process, reduced serviceability, and lack of
or reduced sustainability of the materials used and/or buildings (Ruuska, 2014). Therefore, there
is a need to obtain a material or class of materials that will ultimately minimize the cost of
construction but at the same time maintain the structural safety needed. Furthermore, there is
need to improve sustainability through improving the thermal and acoustic attributes of the
buildings, while concurrently reducing the overall cost of construction through the reduction of
the amount of cement used and replacing it with natural available resources.
To the advantage of several regions in Africa and to the benefit from this research, materials do
exist that are able to solve the shortfalls highlighted above. Nevertheless, these materials have
their related limitations. They include such materials like mud brick, and compressed stabilized
earth block (CSEB) or clay brick, which have the following limitations poor abrasive action of
rain and lack of stability when exposed to excess wet condition. Therefore, this research has
explored the structural performance and possibility of using silicate-limestone to address the
limitations present in the traditional bricks used in the construction industry.
1.3 Study justification
The choice of this research is to study the possible utilization of silicate-limestone in
construction industry and to contribute to sustainable and ecological use of building materials in
the developing world. Limestone, sand and water, are the three natural resources that form the

4
ingredients in the manufacture of silicate limestone bricks. Limestone powder has good
properties, which are:
i. It is fire-proof,
ii. Offers a good acoustic insulation,
iii. It contributes in the control of humidity in the building, and controls heat gain in
buildings.
In order to contribute to the sustainable development, there is a need for alternative cheap,
durable and lightweight but environmentally benign materials in construction. The use of silicate
limestone bricks takes into consideration two key values addressed by the global sustainability
concept (Imbabi,2012) Social value (use of readily available and familiar local materials,);
Environmental value (with the objective of conserving the environment). Silicate limestone
bricks leads to the potential extensive use of a local resource (limestone) as the main building
material with technologies that are energy saving, eco-friendly, and sustainable; since the raw
materials are abundantly available.
1.4 Significance of the study
The importance of this study is to investigate the use of silicate limestone bricks as eco-friendly
and cost effective alternative construction materials.
1.5 Objectives
1.5.1 General objective
The main objective of this study is to investigate the properties and structural performance of
compressed silicate - limestone bricks.
1.5.2 Specific objectives
i) To investigate the effect of varying lime content on the physical and strength properties
of silicate-limestone bricks.
ii) To compare strength performance of silicate limestone bricks with those of clay bricks
and natural stone

5
iii) To determine the structural performance of silicate – limestone wall in comparison with
those clay bricks and natural stone
1.6 Scope of the study
The research focused on the silicate limestone bricks and covered only the technical and physical
analysis of this material. Hence, the physical, mechanical and the structural properties of bricks
and wall made from silicate, hydrated lime powder was the focus of this study.
6
CHAPTER TWO
LITERATURE REVIEW
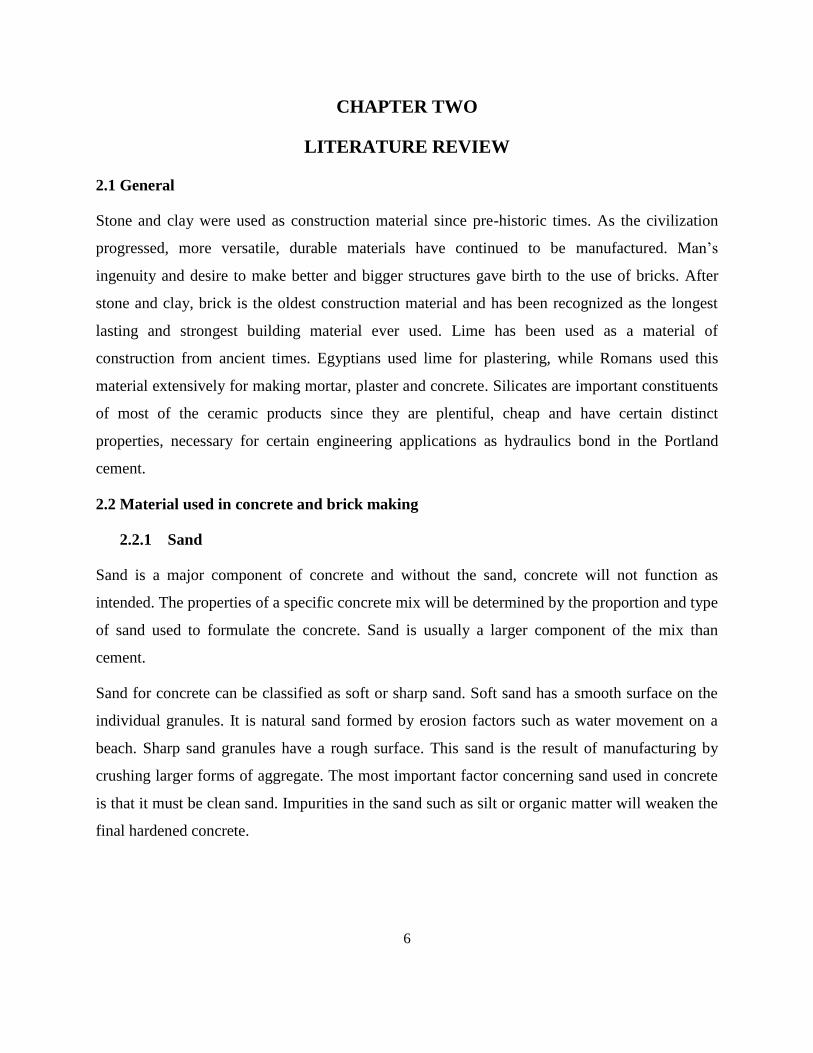
2.1 General
Stone and clay were used as construction material since pre-historic times. As the civilization
progressed, more versatile, durable materials have continued to be manufactured. Man’s
ingenuity and desire to make better and bigger structures gave birth to the use of bricks. After
stone and clay, brick is the oldest construction material and has been recognized as the longest
lasting and strongest building material ever used. Lime has been used as a material of
construction from ancient times. Egyptians used lime for plastering, while Romans used this
material extensively for making mortar, plaster and concrete. Silicates are important constituents
of most of the ceramic products since they are plentiful, cheap and have certain distinct
properties, necessary for certain engineering applications as hydraulics bond in the Portland
cement.
2.2 Material used in concrete and brick making
2.2.1 Sand
Sand is a major component of concrete and without the sand, concrete will not function as
intended. The properties of a specific concrete mix will be determined by the proportion and type
of sand used to formulate the concrete. Sand is usually a larger component of the mix than
cement.
Sand for concrete can be classified as soft or sharp sand. Soft sand has a smooth surface on the
individual granules. It is natural sand formed by erosion factors such as water movement on a
beach. Sharp sand granules have a rough surface. This sand is the result of manufacturing by
crushing larger forms of aggregate. The most important factor concerning sand used in concrete
is that it must be clean sand. Impurities in the sand such as silt or organic matter will weaken the
final hardened concrete.

7
2.2.2 Cement
Cement is a binding material, for the constructional purposes the cement is restricted to the
bonding materials used with stones, sand, bricks, and building blocks (Rajput 2000).
Good cement possesses the following properties:
a. Provides strength to masonry
b. Possesses good plasticity
c. Stiffens or hardens early
d. Easily workable
e. An excellent building material
f. Good moisture- resistant
Ordinary Portland Cement (OPC) is most common in use in the construction, it is an extremely
fine ground product obtained by burning together at high temperatures (14500C) specifically
proportioned amount of calcareous and argillaceous raw materials and adding gypsum in small
quantities (3 to 4%) (Fopossi, 2014). Ordinary Portland Cement has the followings properties:
a. It has medium rate of strength development and heat generation
b. It has adequate resistance dry shrinkage and cracking, but has less resistance to chemical
attack.
OPC is suitable for use in general concrete construction when there is no exposure to sulfate in
the soil, and it is used in small structures where heat of hydration will not cause any defect.
(Rajput, 2000)
2.2.3 Water
Water is one of the most important elements in concrete production. Water is needed for the
hydration process by reacting with the cement to produce concrete. There has to be a sufficient
amount of water available so that the reaction can take its full course but if too much water is
added, this will in fact decrease the strength of the concrete (Neville, 2011).The quality and
quantity of water has much effect on the strength of mortar and cement concrete in construction
work.
8
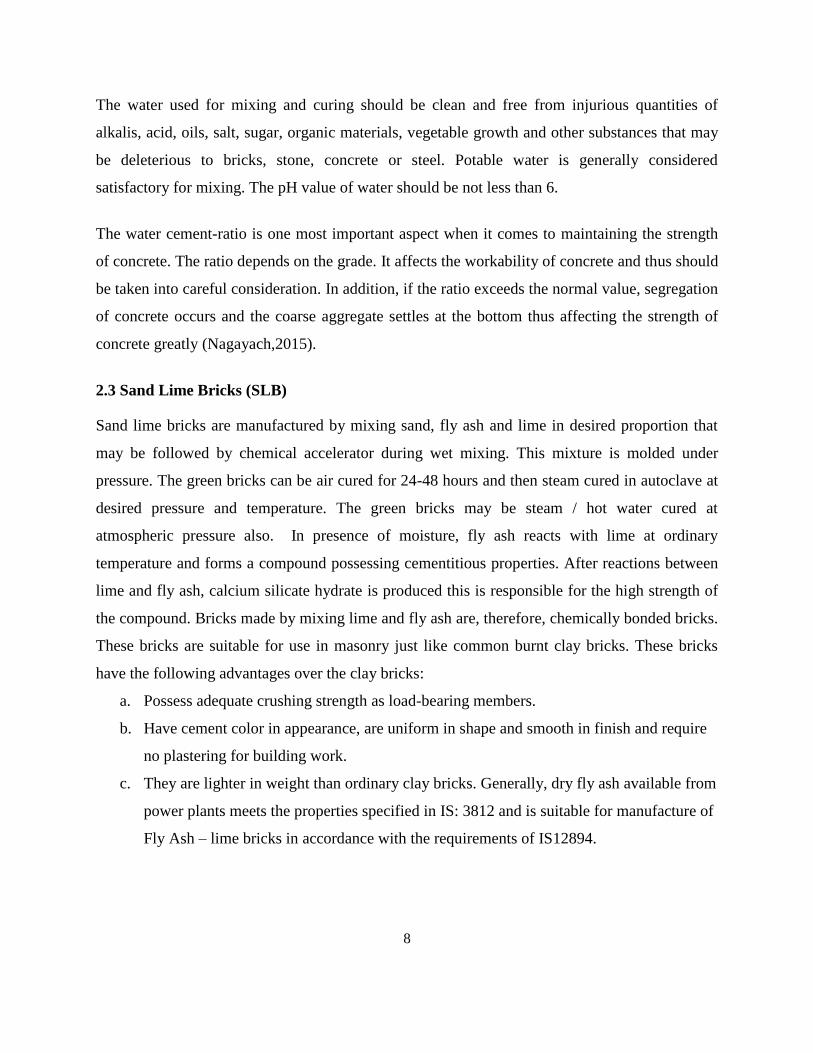
The water used for mixing and curing should be clean and free from injurious quantities of
alkalis, acid, oils, salt, sugar, organic materials, vegetable growth and other substances that may
be deleterious to bricks, stone, concrete or steel. Potable water is generally considered
satisfactory for mixing. The pH value of water should be not less than 6.
The water cement-ratio is one most important aspect when it comes to maintaining the strength
of concrete. The ratio depends on the grade. It affects the workability of concrete and thus should
be taken into careful consideration. In addition, if the ratio exceeds the normal value, segregation
of concrete occurs and the coarse aggregate settles at the bottom thus affecting the strength of
concrete greatly (Nagayach,2015).
2.3 Sand Lime Bricks (SLB)
Sand lime bricks are manufactured by mixing sand, fly ash and lime in desired proportion that
may be followed by chemical accelerator during wet mixing. This mixture is molded under
pressure. The green bricks can be air cured for 24-48 hours and then steam cured in autoclave at
desired pressure and temperature. The green bricks may be steam / hot water cured at
atmospheric pressure also. In presence of moisture, fly ash reacts with lime at ordinary
temperature and forms a compound possessing cementitious properties. After reactions between
lime and fly ash, calcium silicate hydrate is produced this is responsible for the high strength of
the compound. Bricks made by mixing lime and fly ash are, therefore, chemically bonded bricks.
These bricks are suitable for use in masonry just like common burnt clay bricks. These bricks
have the following advantages over the clay bricks:
a. Possess adequate crushing strength as load-bearing members.
b. Have cement color in appearance, are uniform in shape and smooth in finish and require
no plastering for building work.
c. They are lighter in weight than ordinary clay bricks. Generally, dry fly ash available from
power plants meets the properties specified in IS: 3812 and is suitable for manufacture of
Fly Ash – lime bricks in accordance with the requirements of IS12894.

9
2.3.1 Dense sand-lime bricks
The mixture of silicate and lime generally does not constitute hydraulic binder at ambient
temperature. However, at high temperature and pressure, as obtained in an autoclave, they are
able to form a good binder. The first patents regarding the manufacture of bricks sand-lime, by
Michael (1886)was obtained by a carefully balanced mixture of lime and crushed silica, followed
by pressure molding and treatment with steam. The first industrial application was made in
Germany around 1894. The highest producers of dense brick sand-lime are Russia, Germany,
and France (Djouhri Mohamed, 2007).
The mixture consists of quicklime (CaO) (5-12 %), clean sand (88-95%) and the water (4-8 % of
the mass of dry matter). The mixture is subjected to a pressure of 15-45 MPa depending on the
type of pressure machine. Afterwards, the brick is removed from the machine and treated in an
autoclave at a pressure of 0.8-1.2 MPa and temperature of 170-190oC for 6-14 h. (Hakkoum,
2015).
2.3.2 Light sand-lime bricks
The light sand-lime bricks are made from the same materials as the dense sand-lime, but with an
added component, aluminum powder, producing hard artificial voids, in form gas bubbles
obtained by chemical reaction. They belong to the class of materials called improperly aerated
concrete or concrete gas.
These materials are obtained by autoclaving a mixture of sand siliceous (60 to 65%), lime and
cement (35 to 40 % overall).Numerous voids are being created in the mixture by gassing
resulting from addition of aluminum powder at the time of mixing (Samri, 2008).
The Swedish,Ja Eriksson, who was considered as an expert on the use of these products, held
patents from 1923 and in 1929. These products were first marketed in Sweden in 1924, in
Denmark in 1928 and in the USSR in 1930. The main producers are Russia, Japan, Germany and
Great Britain (Djouhri Mohamed, 2007).
2.4 Autoclave process
Under normal conditions, the lime mixed with the sand hardens very slowly. The elements
obtained after curing have strength ranging from 1 to 2 MPa and are easily diluted in the

10
presence of water. But in the presence of saturated steam at a temperature of 170°C, the silica
sand becomes chemically active and begins to react rapidly with the lime, according to reaction
(I.1), forming a calcium hydro silicate which is solid and water resistant.
Ca (OH)2 + SiO2+ (n-1)H2O x CaO + y SiO2 + n H2O (I.1)
The increased temperature and vapor pressure is followed by the dissolution of components. The
solubility of the constituents varies with temperature i.e., the solubility of Ca (OH)2 decreases
with increasing temperature while SiO2increases (Saadieh, 2014).
2.5 Characteristic properties of sand-lime bricks
Sand-lime bricks in general have very good behavior to frost. Their non-frost resistance makes
them noninflammable at temperatures up to 550°C. The sand-lime bricks were in general use as
well as clay brick but with certain restrictions. It is prohibited to use the sand-lime bricks for
laying foundations because they are less water resistant than clay brick. Table 2.1 shows the
sand-lime brick properties.
Table 2.1: Sand-lime brick properties
Type of brick SL Light sand lime brick Sand-lime brick
Density δ (kg/m3) 300-800 800-2 200
Compressive strength fc
(MPa) 1.5-7 7-60
Thermal conductivity λ
(W/m.0C)
0.08 for δ = 300 kg/m3
1.16 to 1.63 for
1700<δ<2100
Water absorption (%) 4-8 -
Acoustic insulation (dB) 48 -
Source: Djouhri Mohamed, (2007)

11
2.6 Theoretical review of different type of stabilized wall panels
2.6.1 The performance of compressed stabilized earth block
Cement is readily available in most urban areas, and usually available in semi-urban areas, as it
is one of the major components for any building construction. Cement is a suitable stabilizer for
use with soil in the production of compressed stabilized soil block. Normally the amount of
cement used is small but sufficient to improve the engineering properties of the soil and further
improved action exchange of clay (Gregory, 2012). Cement stabilized soils have the following
improved properties:
Decreased cohesiveness (Plasticity)
Decreased volume expansion or compressibility
Increased strength
Soil cement blocks (SCB) are also known as stabilized mud blocks (SMB) or stabilized
compressed earth block (SCEB). The new development with earth construction started with the
technology of compressed stabilized earth blocks (CSEB) (Asmamaw, 2007).The compressed
earth block is a modern descendent of molded earth block, more commonly known as the adobe
block (Sadek and Hashim, 2010).Compressed earth blocks represent a considerable improvement
over traditional earth building techniques. The quality of the block depends on the properties and
mix of soil types, the amount of force applied for compaction, and the addition of chemical or
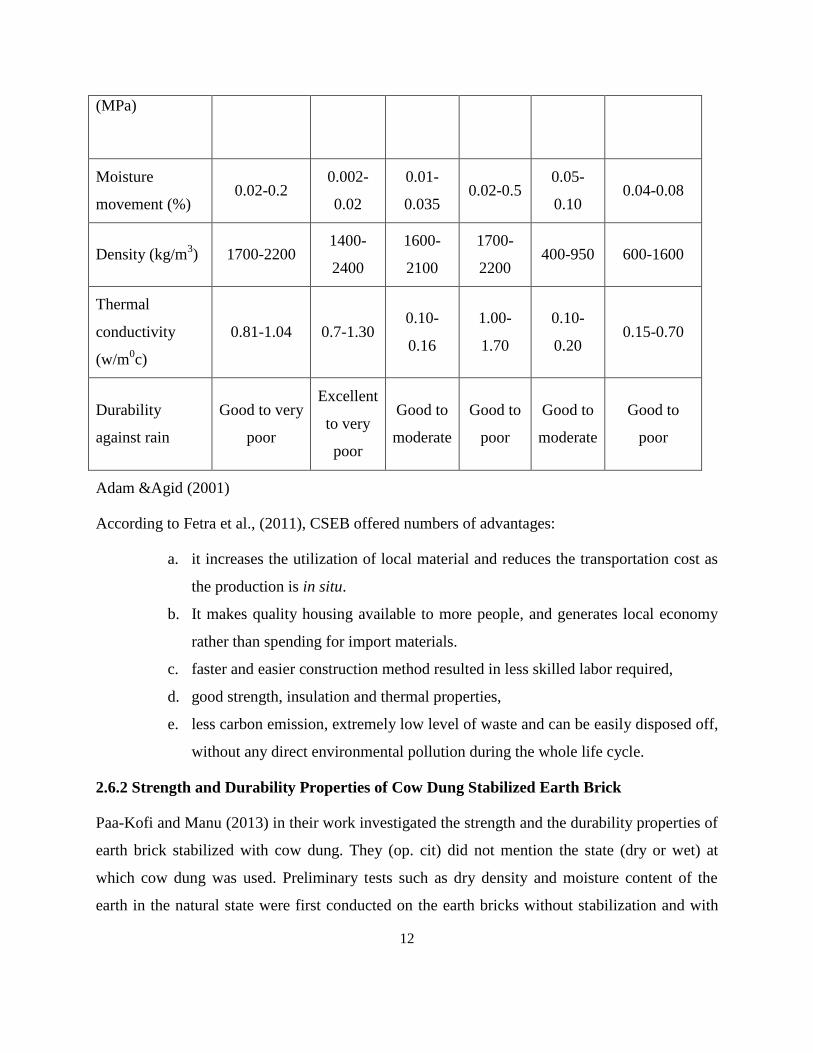
natural products to further stabilize and strengthen the blocks (UN-HABITAT, 2009). Adam and
Agid (2001), describe in the Table 2.2 that when guaranteed by quality control, compressed earth
block products can very easily bear comparison with other materials such as the sand-cement
block or the fired brick.
Table 2.2: Properties of compressed stabilized earth blocks VS walling materials
Property
Compressed
stabilized
earth blocks
Fired
clay
bricks
Calcium
silicate
brick
Dense
concrete
block
Aerated
concrete
blocks
Lightweight
concrete
block
Wet
compressive 1-40 5-60 10-55 7-50 2-6 2-20
12
(MPa)
Moisture
movement (%) 0.02-0.2
0.002-
0.02
0.01-
0.035 0.02-0.5
0.05-
0.10 0.04-0.08
Density (kg/m3) 1700-2200
1400-
2400
1600-
2100
1700-
2200 400-950 600-1600
Thermal
conductivity
(w/m0c)
0.81-1.04 0.7-1.30 0.10-
0.16
1.00-
1.70
0.10-
0.20 0.15-0.70
Durability
against rain
Good to very
poor
Excellent
to very
poor
Good to
moderate
Good to
poor
Good to
moderate
Good to
poor
Adam &Agid (2001)
According to Fetra et al., (2011), CSEB offered numbers of advantages:
a. it increases the utilization of local material and reduces the transportation cost as
the production is in situ.
b. It makes quality housing available to more people, and generates local economy
rather than spending for import materials.
c. faster and easier construction method resulted in less skilled labor required,
d. good strength, insulation and thermal properties,
e. less carbon emission, extremely low level of waste and can be easily disposed off,
without any direct environmental pollution during the whole life cycle.
2.6.2 Strength and Durability Properties of Cow Dung Stabilized Earth Brick
Paa-Kofi and Manu (2013) in their work investigated the strength and the durability properties of
earth brick stabilized with cow dung. They (op. cit) did not mention the state (dry or wet) at
which cow dung was used. Preliminary tests such as dry density and moisture content of the
earth in the natural state were first conducted on the earth bricks without stabilization and with

13
15%, 20%, 25%, and 30% cow dung stabilization to ascertain the optimum water content for
each batch.
Afterwards investigation was conducted on bricks with 0%, 15%, 20%, 25%, and 30% of cow
dung by weight of earth material and its effect on the dry density, compressive strengths,
abrasive resistance and water absorption coefficients at the optimum moisture contents were
analyzed after 28days. From the test conducted, they found out that:
a. a better compressive strength at the dry state and after 10 minutes of immersion in water
is obtained with cow dung stabilization at content of 20% by weight of earth; bricks
stabilized with 20% cow dung contents by weight of earth has a dry and wet compressive
strength of 6.64 and 2.27MPa respectively;
b. an increase of about 25% in the dry compressive strength of bricks stabilized with 20%
cow dung content over that of the plain earth brick without stabilizer and also the
abrasive resistance increased with increase in the cow dung content up to 20%.
Because of the high decrease in compressive strength after 10 minutes of immersion in water,
Paa-Kofi (2013) recommends that appropriate construction specification is necessary to prevent
cow dung stabilized earth bricks from coming into any prolonged direct contact with rainwater.
2.7 Masonry walls panel testing
2.7.1 Testing on stabilized laterite quarry dust block wall
Musiomi (2009) worked on stabilized laterite quarry dust block wall. Stabilized laterized quarry
dust masonry blocks were made by mixing cement; with quarry dust from hard rock i.e. ballast,
quarry dust from soft rock and laterite in appropriate proportions to produce blocks. The
variables investigated included the strength of mortar joint, the effect of reinforcement on wall
behavior and the effect of size of the panel on wall behavior. The laterized quarry dust blocks
and conventional blocks were used to build masonry wall panels.
From the results obtained, it is noted that the effect of strength of the mortar joint on the behavior
of walls is similar for both the alternative and conventional block walls. In addition, the effect of
bedding joint reinforcement on behavior of walls was found to be similar for alternative and
conventional wall panels.

14
However, the compressive strengths of reinforced and unreinforced conventional block walls
were 3.25 and 3.18 N/mm2
respectively. The corresponding values for alternative block walls
were 1.37 and 1.38 N/mm2 (Musiomi, 2009). In both wall types, the effect of bedding joint
reinforcement delayed the formation of the first crack in the wall panels and reduced final crack
width at failure load of the walls. They also found out that the compressive strengths of
conventional block walls were generally higher than the alternative block walls. The results in
this study revealed that when alternative blocks are used, it is possible to achieve strength and
ductility in wall panels at the same time.
2.7.2 Testing on Burnt clay bricks wall panel
Juzar et al (2013) determined the compressive and flexural strength of a wall panel constructed
using an ancient mixture (consisting of paddy -husk- ash, Calicut roof tile powder, hydrated lime
powder and anthill clay) and compared the results to a standard masonry wall (burnt clay).
The result obtained shows that the wall constructed using the ancient mixture fractured to a force
of 15kN, while the masonry wall cracked at a load of approximately 19kN. They therefore
concluded that the panel built using the ancient mixture behaved very similarly to the masonry
wall.
2.8 Critique of the existing literature and research gaps
The use of autoclave machine is the only method of production of silicate limestone blocks. This
machine is not affordable for countries with low income, that is why the blocks are too expensive
in the market, and they are not used in Africa. In this research, the method to make the silicate
limestone bricks will be the same as the process to make earth compressed blocks, which takes
less time, energy and cost like autoclave machine. The relative performance of silicate limestone
bricks will be better than the conventional blocks as concrete blocks and earth compressed
blocks.

15
CHAPTER THREE
MATERIALS AND METHODS
3.1 General
This chapter discusses in detail the sources, properties of materials used and the methods applied
in the manufacture of bricks and the testing program. Materials used include sand, lime, cement,
and natural stone (machine cut) from a local factory and clay bricks from Kenya Clay products.
Material properties were determined according to our research objectives. All the laboratory test
on the material were carried out at Jomo Kenyatta University of Agriculture and Technology
(JKUAT) Civil Engineering laboratories, Kenya
3.2 Materials properties
3.2.1 River sand
The sand used in the experimental study was river sand obtained from Meru County, Kenya.
Sieve analysis, water absorption, moisture content and specific gravity tests were done according
to BS1377–1:1990. Plate 3.1 below shows a heap of the sand obtained for this research study.
The river sand was sieved through 5 mm sieve before used.
Plate 3.1: Pile of river sand used in the research
3.2.2 Cement
Cement used was Ordinary Portland Cement (OPC) of class 42.5 as per KS EAS 18-1 (2001)
from Bamburi Cement Factory, in Kenya. OPC was selected because it has a good binding

16
capacity and widely available in Kenya. Plate 3.2 below shows the bag of cement used in the
research study.
Plate 3.2: Bag of cement used in the research
3.2.3 Lime
Lime used in the experimental study was hydrated lime from Coast Calcium Company sourced
from Hardwares around Juja and Thika. They are widely available in any part of Kenya. Plate
3.3 below shows the bag of lime used in the research study.
Plate 3.3: Bag of lime used in the research
3.3 Test on Meru’s sand
The tests as sieve analysis, silt content test, water absorption and specific gravity were done in
this research.

17
3.3.1 Sieve analysis
The goal of this test was to determine the particle size distribution of aggregates by sieving
analysis. This test was performed and used to determine the grading and fineness modulus of fine
aggregate (BS 812-103.1, 1985). The sieve sizes used for this test were, 10, 5, 2.36, 1.18, 0.6,
0.3, 0.15mm and pan. An approximately 1 kg of sand was taken from the original sample by
quartering. The sieves were dried and cleaned before their use. The sieving process was done
manually and the procedure was as given below:
Procedure
The required sample was weighed
The sieves were arranged on top of each other with the largest mesh size on the top and
the weighed sample was put into sieve.
The arranged sets of sieves were shaken horizontally with a jerking motion in all
directions for at least 2 minutes. All material passing were ensured fallen in to tray.
Any material retained on the sieve was weighed.
Material collected was passed in the tray through the sieve of the next smaller mesh size,
and any material retained was weighed.
The procedure was repeated for the remaining sieves in the order of diminishing size.
The results were recorded and tabulated; cumulative weight passing through each sieve was
calculated as a percentage of the total sample to the nearest whole number. The grading curve
was also plotted in the grading chart.
3.3.2 Silt content test
The objective was to determine the cleanliness of the sand. The silt content tests for fine
aggregate (sand) were done in accordance to the BS 812 (1990) standard. It is recommended to
wash the sand or reject if the silt content exceeds a value of 6% (Neville, 2011). The silt content
of the sand was determined using following procedure in accordance to the BS.

18
Procedure
A solution of sodium of chloride was prepared, about two tea spoonful of salt was added
to 1 liter of water (1% solution).
50 ml of this solution was poured into 250 ml measuring cylinder,
The sand was added gradually until the volume was 100ml, then the volume was made up
to 150ml by addition of more salt solution.
The mixture was shaken vigorously until adherent silt particle had been dispersed, and
then cylinder was placed on a level bench and it was gently tapped until the surface of
aggregate was level.
The silt being of finer particles than sand was settle above the sand in a form of layer and
the measurement of its thickness was made.
3.3.3 Water absorption and specify gravity
The goal was to determine the specific gravity and the water absorption values of sand. The
following procedure was used to determine the specific gravity and the water absorption.
Procedure
The washed sample was transferred to the tray and the water was added to ensure that the
sample was completely immersed.
After immersion, bubbles were removed of entrapped air by gentle agitation with a rod.
The sample was kept immersed in water for 24 hours.
After that the water from the sample was drained by decantation through a 0.075mm test
sieve. Then the saturated and surface dry sample was weighed (C).
The sand was placed in the pycnometer and it was filled with water. The cone into place
was screwed and any trapped air was eliminated by rotating on its sides.
The bottle on the outside was dried and it was weighed (A).
The sample into the tray had been empty; the pycnometer was refilled with water to the
same level as before. It was dried on the outside and weighed (B)
.The water from the sample was drained by decantation. The sample was dried at a
temperature of 1050C for 24 hours, during which period it was stirred occasionally to
facilitate drying. The sample was cooled by air and weighed (D).

19
Calculations
a. Specific gravity on an oven dried basis
SGD=
……………………………………………………3.1
b. Specific gravity on a saturated and surface dried basis
SGS=
……………………………………………………...3.2
c. Apparent specific gravity
SGA=
……………………………………………………..3.3
d. Water absorption (% of dry mass)
WA=
…………………………………………..….. 3.4
3.4 Production of silicate limestone bricks
In order to produce the silicate limestone compressed bricks, two steps were done: The first step
consisted to determine the optimum mix ratio (in term of mass) of control mixture, which
contained cement, sand and water. The table 3.1 below shows the outline of process of mixture
proportions.
Table 3.1: Control mixtures with ordinary Portland cement
Sample Cement
ratio
Sand
ratio
Water/ceme
nt ratio
Number of
samples
A 1 3 0.4 5
B 1 3 0.5 5
C 1 3 0.6 5
D 1 3 0.7 5
E 1 3 0.8 5
F 1 4 0.4 5

20
G 1 4 0.5 5
H 1 4 0.6 5
I 1 4 0.7 5
J 1 4 0.8 5
K 1 5 0.4 5
L 1 5 0.5 5
M 1 5 0.6 5
N 1 5 0.7 5
O 1 5 0.8 5
The process was done by making cubes (100mm) of mortar by vibrating and in varying sand and
water cement ratio, after that the samples were cured under water and tested after 7days.Plate 3.4
below shows mortar cubes used in the research study.
Plate 3.4: Cube mortars by vibration
After the optimum ratio of mortar was determined, it was applied as the ratio of silicate
limestone bricks. The second step consisted of replacing the cement in the composition with lime
ranging from 0 to 100%while sand and water cement ratio are fixed (table 3.2). The compaction
machine was used to produce the silicate limestone bricks, which gave the bricks of
140x140x290 mm.

21
Table 3.2: Mix proportion of silicate limestone brick
Sample
Binder
Sand (S)
Water
/cement
ratio
Number
of sample Cement
(OPC)
Limestone
Powder (LP)
1 0% 100% Fixed Fixed 5
2 20% 80% Fixed Fixed 5
3 40% 60% Fixed Fixed 5
4 60% 40% Fixed Fixed 5
5 80% 20% Fixed Fixed 5
6 100% 0% Fixed Fixed 5
The stages of production of bricks are as follows:
- Mix the Limestone powder, silicate sand and cement using by hand in the mixing tray.
- Pour the appropriate amount of water in the mix.
- Fill the mixture in the compression machine and press until the arm reaches the
maximum pressure.
- Remove the sample from the compression machine and put them on the ground.
- Cover them with tissues and spray water on them during 7, 14 and 28 days depending on
testing day.
Plate 3.5 below shows the silicate limestone products and the compression machine used for its
making.

22
(a) Silicate limestone bricks (b) compression machine
Plate 3.5: Silicate limestone bricks and block compression machine
3.5 Testing on blocks
3.5.1 Water absorption test
The tests to determine the water absorption was carried out in accordance to BS EN 772 Part 11
(2010). The coefficient of water absorption characterizes the stability of materials in water. It is
determined from ratio of dry strength to wet strength (Chaibeddra. S.& F. Kharchi, 2013). The
aim of the water absorption test was to determine the percentage of moisture absorption capacity
of the brick samples.
Procedure
The specimens were placed inside the oven for a period of 48 hours.
After removing in the oven, the specimens were removed and cooled for 12 hours.
The dry weight of each specimen was measured (Wd) using an electronic weighing
machine.
Immediately after dry bricks were weighed, they were immersed in water for 24 hours,
after which they were removed and weighed again (Ww).
The percentage moisture absorption by weight was calculated as follow:
…………………………………………………3.5
Where

23
Mc=percentage moisture absorption (%)
Ww= mass of wetted sample
Wd=mass of dry sample
This test was done after spraying the bricks for a period of 28 days.
3.5.2 Dry density of blocks
According to TahminaBanu, Md., (2013), after 7 days of curing period bricks were dried at
1100C for 24 hours and then allowed to cool to room temperature. Dry weight Wd (kg) was
determined.
Procedure
The specimens were placed inside the oven for a period of 48 hours
After removing in the oven, the specimens were removed and cooled for 12 hours.
The dry weight of each specimen was measured (Wd) using an electronic weighing
machine.
The volume of each specimen was calculated (V)
The dry density of specimen was calculated as follows:
……………………………………………..………..3.6
Where:
dd=dry density (kg/m3)
Wd=mass of dry sample
V=volume of sample
This test was done after spraying the bricks for a period of 28 days.
3.5.3 Compressive strength test
The compressive strength tests of the blocks were carried out using a Universal Testing Machine
according to BS 1881 part 166: 1983. The compression loading was applied continuously to
failure at a uniform rate of 0.2 MPa/sec using block specimens at 7, 14 and 28 days. A total of 10

24
specimens for each block type were tested in compression for each age. See plates 3.6(a) to 3(d)
for the experimental setups and tests.
Remark: for clay bricks (interlocking blocks), layers of mortar were placed on the top and
bottom of brick to have flat area.
Procedure
The compression machine was set and all the necessary information such as width and
length of blocks, the rate at which the load was applied to the block.
The block was aligned in the Universal Testing Machine (UTM).
After the load set up, the maximum load at which the brick crushed and the respective
compressive strength were recorded automatically.
The compressive strength of each specimen was then calculated using the formula:
……………………………………………………………………3.7
Where:
Cd=Compressive strength in N/mm2
WD=Total load at which the dry specimen was failed in Newtons
A=The surface area on which the load was applied in mm2
(a) Silicate limestone brick (c) Concrete block

25
(b) Natural stone (d) Clay brick
Plate 3.6: Compressive strength in a universal testing machine
3.5.4 Flexural strength test
The flexural strengths of the blocks were tested in the Universal Testing Machine according to
BS 6073-1, 2008 using transversal loading as shown in the plate3.7 (a) to(d). A total of 10
specimens of each block type were tested at age of 14 and 28 days.
Remark: for clay bricks (interlocking blocks), layers of mortar (75 mm of width) were placed
transversally on top of the brick to have flat area.
Procedure
The blocks were weighed and the dimensions were recorded:
The Universal Testing Machine was set and all the necessary information recorded such
as width, length and height of blocks, the rate at which the load was applied transversally
at the mid span of block.
The block was aligned in the Universal Testing Machine (UTM).
After the load set up, the maximum load at which the brick crushed and the respective
flexural strength were recorded automatically.
This test was done after spraying the bricks with water, to increase their strength, for a period of
14 days and 28 days respectively. The flexural strength of each specimen was then calculated
using the formula:
……………………………………………………………………3.8

26
Where:
= Flexural strength in MPa
= Total load at which the dry specimen failed in N
= the length of the specimen in mm
= the width of the specimen in mm
= the height of the specimen in mm
(a) Silicate limestone brick (b) Concrete block
(c) Clay brick (d) Natural stone
Plate 3.7: Test Flexural strength in universal testing machine

27
3.6 Test on panel wall
The tests to determine the structural capacities of the wall were performed in accordance to BS
5628 part 1 (1992). Lime silicate bricks made from 60% replacement of cement were used to
make the test wall. In addition, two other walls made of natural stone blocks and clay bricks
were tested for comparison.
The equipment and accessories used were load cell, data logger, strain gauges, hydraulic loading
jack, transducers, steel plate.
Three (03) walls for each type of blocks were made and the averages were recorded.
Procedure
The set up area was prepared
Elevation of the wall was done by the superposition of bricks and mortar
corresponding to the strength of unit block
After one week age of curing by spraying water, a steel plate was positioned on the
wall in order to transfer the applied load uniformly along the length of the wall
Loading jack was positioned on the steel plate and a load cell placed against the
loading jack and the frame.
The transducer was attached at one side of the wall with aim of determining the
deflection produced in response to the respective applied load.
Strains gauges were attached at the center of the wall to measure the strain in both X
and Y directions.
The loading jack was slightly pumped and released to firm up the set up.
Loading data recording
Loading was carried out by applying gradual increments of load through the hydraulic
loading jack, for every increment, the loads, displacements, strains were printed in the data
logger. Plate 3.8 shows the set-up of walls in the loading frame

28
(a) Clay wall (b) Silicate Limestone wall
(c) Natural stone wall
Plate 3.8: Test setup for walls in the loading frame

29
CHAPTER FOUR
RESULTS AND DISCUSSIONS
4.1 Sand properties
The results of the river sand were satisfactory as shown in Table 4.1 below and the grading was
within the lower and the upper limits as shown in Figure 4.1. It reveals that sand from Meru can
be used to produce concrete of good quality. The detailed data of sand properties are represented
in Appendix A.
Table 4.1: Physical properties of Meru sand
Designation Results Limit Remarks Code
Silt content 3.56 % <6% good BS 1377 – 1:1990.
Water absorption 0.1% <3% Good BS 1377 – 1:1990.
Fineness modulus 2.86 2.6-2.9 Good BS 1377 – 1:1990.
Figure 4.1: Particle sizes distribution curves of Meru sand
0
20
40
60
80
100
0.1 1 10
Cu
mm
ula
tive
pas
sing (
%)
Sieve size (mm)
Particle size distribution of Meru's sand
Meru's Sand % max limit

30
4.2 The optimum mix ratio by vibration of control with ordinary Portland cement
Table B2 represented in appendix B shows the compressive strength in MPa of the bricks made
from the different mix ratio (in term of mass) at 7 days of curing of control mixture, which is
constituted of sand, cement and water. The goal of this section was to determine the optimum
ratio of cement, sand and water /cement ratio which were to serve as control in the study. This
was achieved by compressive strength of the control closed to 8.5MPa at 7 days which
correspond to 13 MPa at 28 days according to the guidance on the selection and specification of
concrete blocks in masonry construction can be found in BS 5628: Part 3 and BS EN 771-3
respectively.
Figure 4-2 below shows that the ratio 1:5:0.4 was the optimum ratio in term of the compressive
strength, which is 8.74 MPa, close to the 8.5 MPa, the control. The compressive strength curves
for the control mix are represented in the Figure 4-2. The detailed data are presented in Appendix
B.
Figure 4-2: Compressive strength curves of control mixes
0
5
10
15
20
25
0.4 0.5 0.6 0.7 0.8
Com
pre
ssiv
e st
rength
(M
Pa)
Water / cement ratios
Compressive strength for control mixes
1;3 1;4 1;5

31
4.3 Effects of silicate-limestone content on physical and strength properties of bricks
4.3.1 Water absorption
Figure4-3 below shows the results from water absorption test performed for different percentage
proportions of lime ranging from 0 to 100% at 7,14 and 28 days properties of the blocks.
Figure 4-3: Water absorption curves of silicate limestone bricks
It is noted that the water absorption of the silicate limestone bricks decreases with time and
increases when we added lime. That means that lime absorbs more water than cement.
From the Figure it is observed that from 0% up to 60% of lime content, the curves remain stable
and at 14 and 28 days there is no variation.
It is also noted that the values of water absorption of silicate limestone bricks ranging from 0 to
100% of lime content at 28 days are within the recommended values which is 20% according to
the Standard IS 456 (2000). This means that they can be used in a capillary environment,
provided with protection against water damage. The detailed data of water absorption are
presented in Appendix C.
0
4
8
12
16
20
0% 20% 40% 60% 80% 100%
Wat
er a
bso
rpti
on
(%
)
Percentage of replacement of lime
Water absorption
7 days 14 days 28 days

32
4.3.2 Dry density
Figure 4-4 below shows the results from dry density test performed for different percentage of
lime content, ranging from 0 to 100% at 7, 14 and 28 days.
Figure 4-4: Bar chart of dry density of silicate limestone bricks
From this figure, the dry density decreases when the percentage of lime increases, which is
expected since the lime is less heavy than cement.
From 0% to 60% the trend is stable because the slope is too slow.
The variation of density for 20% to 0% does not vary much from these result though at
60% the density is slightly lower
From 60% to 80% the trend is unstable due to the higher slope. This is due to the density
of lime which is higher than the density of the cement and the lime is more compressible
than the cement.
From 80 % to 100%, the trend becomes again stable because the slope is slow.
The silicate limestone bricks with variation from 0% to 100% are considered as High
density according to Chanakya Arya (2009), bricks with a gross density of less than or
equal to 1000 kg/m3 are classified as LD (low density) units and those with a gross
density exceeding 1000 kg/m3 as HD (high density) units.
1600
1650
1700
1750
1800
1850
1900
0% 20% 40% 60% 80% 100%
Dry
den
sity
(kg/m
3)
Percentage of replacement of lime
Dry density
7 days 14 days 28 days

33
The detailed data of dry density are presented in Appendix D
In conclusion, it is good to have bricks which are less heavy and stable so that their handling
during the construction will be easy to the workers, so SLB 60% is the best type of silicate
limestone bricks compared to the others in term of dry density because they are more stable.
4.3.3 Compressive strength of silicate limestone bricks (SLB)
Figure 4-5 below shows the results for compression strength performed for percentage
proportional compositions ranging from 0 to 100% by mass of lime content at 7, 14 and 28 days.
Figure 4-5: Compressive strength of SLB with varying lime contents
It was noted:
The strength decreases when the percentage of lime increases, which means the strength
of lime is lower than the strength of the cement used for making the blocks.
From 60% to 80%, the slope is too high compared to the other, which means the lime is
predominant than the cement.
4.3.4 Flexural strength of silicate limestone bricks (SLB)
0
2
4
6
8
10
12
14
0% 20% 40% 60% 80% 100%Com
pre
ssiv
e st
rength
(M
Pa)
Percentage of lime content
Compressive strength of the block
28 days 14 days 7 days

34
Figure 4-6 below shows the results from flexural strength performed for percentage proportional
composition ranging from 0 to 100% at 14 and 28 days.
Figure 4-6: Flexural strength of SLB with varying lime contents
It was noted that:
The strength decreases when the percentage of lime increases which means the lime is
weaker than cement in the bending that is why the values of flexural strength reduce with
increase percentage of lime.
From the curve at 28 days, the slope of the curve is lowest from 40% to 60%, which
means the optimum ratio of lime content in block seems stable within this interval.
4.4 Performance comparison of SLB with local blocks in Kenya
Figure 4-7 shows the strength (compressive and flexural strengths) performance of silicate
limestone bricks prepared with various percentages of lime ranging from 0 to 100%. The blocks
were compared to those available in the Kenyan market such as concrete blocks, natural stone
(machine cut) blocks and clay bricks.
0
1
2
3
4
5
6
0% 20% 40% 60% 80% 100%
Fle
xu
ral st
ren
gth
(M
Pa)
Percentage of lime
Flexural strength
14 days 28 days

35
Figure 4-7: Structural performance of SLB and other blocks.
It was noted that:
The compressive strength of blocks is greater than their flexural strength, except for clay
brick, which the flexural strength is higher than compressive strength. This is due to the
section depth
In terms of compressive strength silicate limestone blocks with up to 80% of lime content
have better strength characteristics than clay brick, but the clay brick has a better flexural
strength than SLB from 40% up to 100% of lime.
Silicate limestone bricks up to 60% of lime have better strength characteristics than
natural stone (machine cut), in term of compressive and flexural strength.
Natural stone is very weak in flexure due to their composition i.e. they are not
homogenous. The silicate limestone with 100% of lime has better bending strength than
natural stone, which means that natural stones should not be used as flexural structural
element such as beams, slabs and columns. They are low load bearing elements as in wall
infills.
The concrete block used in Kenya has a very good compressive strength but they are
weaker than silicate limestone bricks with 40% of lime. This is due to its composition
because the ratio of concrete block was 1:5:6 (cement: sand: ballast) .The cement used in
0
2
4
6
8
10
12
SLB 0% SLB 20% SLB 40% SLB 60% SLB 80% SLB 100% Concrete
Block
Natural
stone
Clay Brick
Str
ength
of
bri
ck (
MP
a)
Type of blocks
Compressive -Flexural strengths
Compressive Strength at 28days (MPa) Flexural Strength at 28 days (MPa)

36
making blocks has a strength of 32.5MPa which is less than the cement in making of
Silicate limestone bricks (42.5 Mpa). Nevertheless, the use of this concrete is for the non-
load bearing structures.
Silicate limestone brick has 6 MPa and 3Mpa respectively for compressive and flexural
strength.These values were obtained at 60% of lime.
The detailed data of strength performance of blocks are presented in Appendix E
4.5 Comparison of the structural performance of the three types of wall tested.
The result of panel wall tested in axial compression are presented in this chapter. Three types of
panel wall were built, cured and tested at 7 days. Silicate limestone wall was built with 60% of
lime; wall two was built with the clay bricks from Kenya Clay product and wall three was built
with the conventional stone blocks from Juja, Kenya. The walls were loaded up to the maximum
load that leads to failure. The main objective of the compressive test was to compare the
structural behavior of the wall. For the entire wall, the proportion of mortar mix depended on
compressive strength of each brick and block corresponding to the table 1, BS 5628. The silicate
limestone and clay wall had a dimension of 600 x 750x 140mm while the conventional stone
blocks wall has a dimension of 600 x 800 x 140mm and clay wall has a dimension of 600 x800
x155 mm. Table 4-2 below shows the dimensions of the tested walls, strength of blocks and
mortar mix proportions.
Table 4.2: Walls characteristics
Walls designation Strength of block
(MPa) Wall size (mm)
Mortar ratio
(Table 1)
Silicate limestone bricks
(60% of lime) 6.08 600 x 750 x 140 1:3
Natural stone 3.77 600 x 800 x 140 1:5
Clay brick 1.80 600 x 800 x 155 1:7

37
4.5.1 Load-displacement curves
Figure 4-8 shows load-displacement characteristics of the various walls prepared in this research.
Figure 4-8: Load- deflection curve
It represents the load-deflection curve of the wall and shows that, at application of 75.52kN load,
the displacement in silicate limestone was 5.48 mm while for natural stone wall, the
displacement was 9.89 mm at anapplied load of 165.92 kN. For the clay wall, at a load of 59.68
kN, the displacement is 8.26 mm. Figure 4-8 reveals also that the wall made of silicate limestone
bricks had higher stiffness compared to the other two types of walls, which was due to the higher
homogeneity of its composition made by compaction and the compressive strength of the unit
brick which was higher than the other unit blocks. The detailed data of load- displacement test
are presented in Appendix F.
4.5.2 Compressive capacity of walls
Figure 4-9 shows the maximum stress of each wall. The stress was calculated using the relation
in equation (4.1).
………………………………………………………………4.1
Where:
0
20
40
60
80
100
120
140
160
180
0 2 4 6 8 10 12 14
Lo
ad (
kN
)
Displacement (mm)
Load - deflection curve
Silicate limestone wall Clay wall Natural stone wall

38
CD = Compressive strength in N/mm2
WD = Total load at which the dry specimen was failed in Newtons
A = the surface area on which the load was applied in mm2
Figure 4-9: Maximum stress in the walls
The maximum stress in each type of wall was 0.90 N/mm2, 0.64 N/mm
2 and 1.98 N/mm
2
respectively for silicate limestone wall, clay wall and natural stone wallas presented in Figure 4-
9.
It was observed that the maximum compressive stress of the walls was lower than that of the
individual bricks. Hemant&al, (2007) examined the relationship between the compressive
strength of a masonry and the brick units, and concludes that walls prisms have low compressive
strength than bricks units due to non linearity and composite behavior of masonry prisms.
The current situation is similar to that of Hemant&al.(2007), our study also suggests that the
composite nature of the masonry wall reduces the ultimate load carrying capacity of the wall.
The wall made of natural stone gives the highest strength however; the compressive strength of
its unit block is lower than silicate limestone brick. Many factors can explain it:
The bonding inside the silicate limestone brick were not stable
0.0
0.5
1.0
1.5
2.0
Silicate Limestone
Wall
Clay Wall Natural stone Wall
Max
imu
m A
ver
age
stre
ss
(MP
a)
Wall designation

39
The geometry model of blocks are not the same, the dimensions 140x140x290 mm;
150x200x390 mm and 150x300x115 mm are respectively for silicate limestone brick,
natural stone and clay bricks. It was observed that the natural stone had highest volume
and clay brick, lowest volume.
The number of layers of mortar is different for each wall. For the silicate limestone wall,
the number of layer was 4, for the clay brick was 5 and the natural stone, the number was
3.
The depth of mortar to obtain the desired height of wall, which was 750mm was different
for each wall.
4.5.3 Stress- strain characteristic of walls
The Figures 4-10 and 4-11 show respectively the vertical and the horizontal stress-strain curves
at the center of each type of wall. The stress-strain curve represents the relationship between the
applied load and the result deformations in the wall. Stress / strain curve characteristic shows the
behavior of the wall panel throughout the loading period (Musiomi, 2009).
Figure 4-10: Stress-vertical strain at the centre of the wall liaison
0.0
0.5
1.0
1.5
2.0
0 500 1000 1500 2000 2500 3000
Str
ess
(MP
a)
Vertical Strain (10˄-6)
Stress-Vertical Strain
Silicate limestone wall Clay wall
Natural stone wall
40
Figure 4-10 above shows that:
a) The first crack of natural stone appeared at approximatively2 N/mm2 corresponding to a
strain of 15µ, which is negligible while the first crack of silicate limestone appeared at
0.5 N/mm2 with a strain of 100 µ, this first stage which means silicate limestone wall is
weaker than stone wall due its quick deformation.
b) It shows also that after the first crack the natural stone wall and clay wall collapsed while
the silicate limestone continued to increase with increasing strain, which means the
silicate limestone has highest ductility. Natural stone wall is a non-ductile structure as
compared to clay and limestone structure. This is due to the properties of binders (cement
and lime) in the silicate limestone bricks.
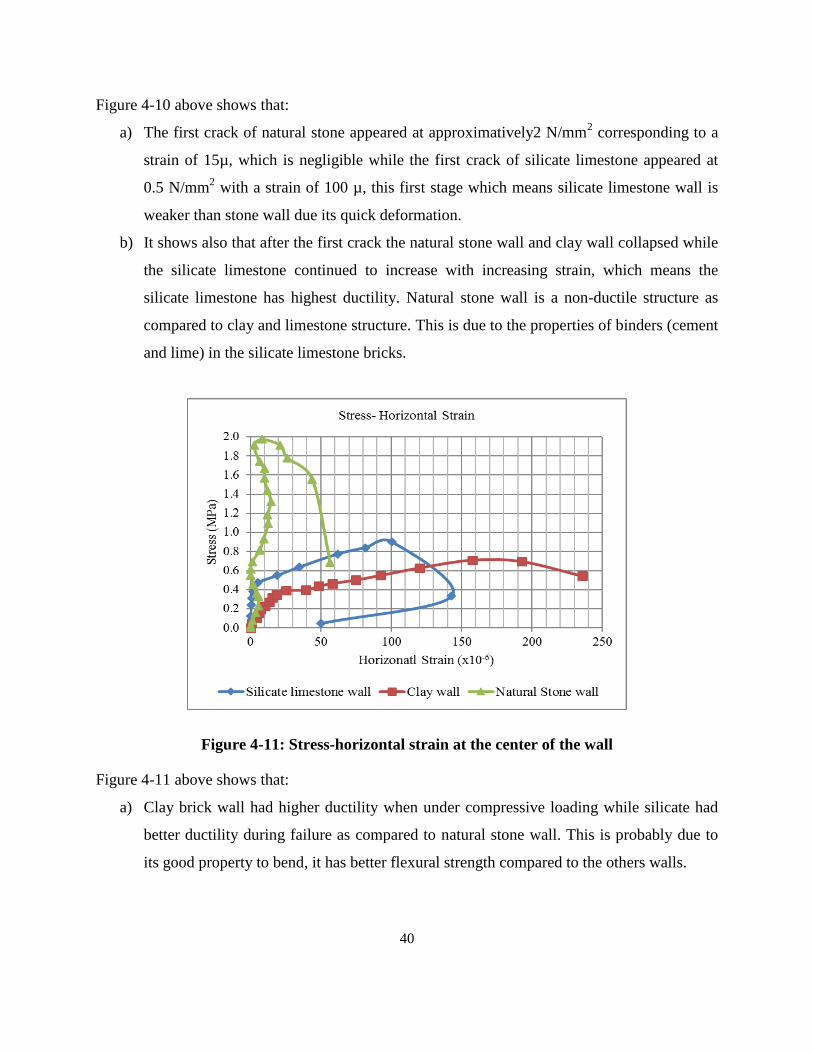
Figure 4-11: Stress-horizontal strain at the center of the wall
Figure 4-11 above shows that:
a) Clay brick wall had higher ductility when under compressive loading while silicate had
better ductility during failure as compared to natural stone wall. This is probably due to
its good property to bend, it has better flexural strength compared to the others walls.

41
b) Clay brick wall had highest ductility than the natural stone wall. This is probably due to
its good property to bend, it has better flexural strength compared to the others walls.
c) The walls have a better strain in the X direction (horizontal) than Y direction (vertical),
probably due the height of wall, which was higher than the length (H=0.8 L=0.6).
4.5.4 Failure patterns of walls
Plate 4-1 below shows some transversal cracks on faces of silicate limestone wall. This failure
was predominantly by shear and was due to the combination of tensile cracks parallels to the axis
of loading and shear failure along lines of weakness.
Plate 4.1: Failure patterns of silicate limestone wall
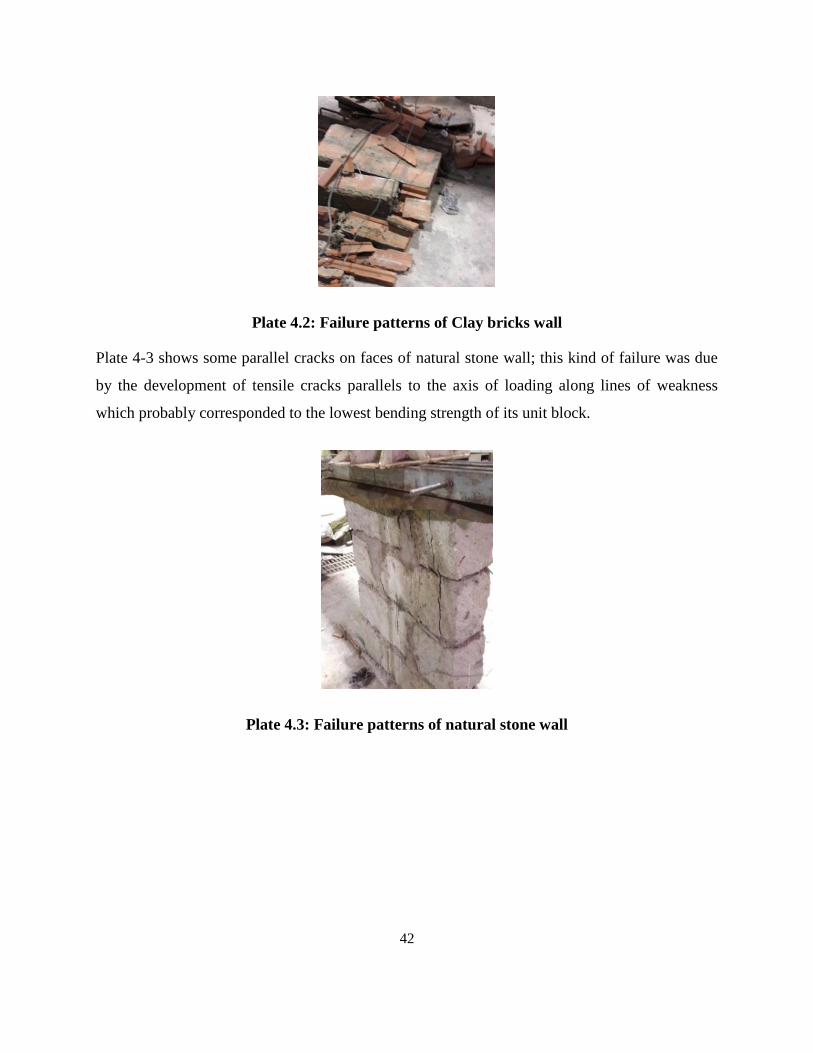
Plate 5-2 shows how the clay wall collapsed, it exploded and this kind of failure was due to the
voids inside the brick, which could not limit the compressive capacity of the blocks. That is why
there was no apparition of preventives cracks before explosion of wall.
42
Plate 4.2: Failure patterns of Clay bricks wall
Plate 4-3 shows some parallel cracks on faces of natural stone wall; this kind of failure was due
by the development of tensile cracks parallels to the axis of loading along lines of weakness
which probably corresponded to the lowest bending strength of its unit block.
Plate 4.3: Failure patterns of natural stone wall

43
CHAPTER FIVE
CONCLUSIONS AND RECOMMENDATIONS
5.1 General
The key objective of this research study was to investigate the properties and structural
performance of compressed silicate limestone bricks. To achieve that investigation was done on
the effect of varying lime composition on the physical properties of silicate limestone bricks.
Afterwards a comparison of strength properties (compression and flexural strength) of these
bricks was done with those available in the Kenyan market. Finally, the silicate limestone wall
was structurally tested and compared with natural stone and clay bricks walls.
5.2 Conclusions
a) The investigation done in varying lime composition in silicate limestone bricks shows
that as the proportion of lime increases, the physical and mechanical properties of bricks
become weak.
b) In comparison with the blocks used in the local market, it is found that Silicate Limestone
Bricks with 60% of lime content is the optimum replacement as alternative blocks in
terms of its strength properties.
c) The walls constructed with stone blocks perform better structurally than those made with
limestone bricks with 60% of lime content.
5.3 Recommendations
From this study, it is recommended that:
1) To avert housing collapses in the country, the silicate limestone compressed brick with
the mix of 20% cement and 80% of lime should be used for partitioning and unexposed
works.
2) To use the silicate limestone bricks as an external wall it is necessary to use a good
mortar which has better waterproof properties.
3) Further research work should be carried out to establish the effect of environment (wind,
acoustic, thermal) on the compressed silicate limestone bricks.

44
REFERENCES
Chaibeddra, S., &Kharchi, F. (2013).Sustainability of Stabilized Earth Blocks to Water
Erosion. International Journal of Engineering and Innovative Technology (IJEIT), 2(9).
Arya, C. (2009). Design of structural elements: Concrete, steelwork, masonry and timber
designs to British standards and Eurocodes. CRC Press.
Asmamaw T. (2007). Study of compressed cement stabilised soil block as an
alternative wall making material. Master thesis, the Schools of Graduate Studies of Addis
Ababa University
E. O Aiyewalehinmi & M. O. Tanimola. (2013). Strength Properties of Commercially Produced
Sandcrete block in Akure: Ondo State. 2, 22-33.
Fopossi, A. J., Mutuku, R. N., & Ngapgue, F. (2014). Effects of Stabilizers on Water Absorption
of Compressed Earth Blocks made from Mangu Soil.
Hakkoum, S. (2015). Etude des caracterisques thermiques et mecaniques des briques en terre
cuite traditionelles dans les regions de la wilaya de Ouargala. MAGISTER, Génie Civil
Option Geo-materiaux.
Guettala A. A. Abibsi & H. Houari. (2006). Durability Study of Stabilised Earth Concrete.
Journal of Construction and Building Materials, 20, 119-127.
Imbabi, M. S., Carrigan, C., & McKenna, S. (2012). Trends and developments in green cement
and Concrete technology. International Journal of Sustainable Built Environment, 1(2), 194-
216.
Lamia Bouchhima, Mohamed Jamel Rouis & Mohamed Choura. (2013). Engineering Properties
of Wade Sand-Lime-Cement-Phosphogypsum Building Brick Grade MW. International
Journal of Engineering and Advanced Technology (IJEAT), 2(4). Retrieved April 2013
Mohamed, D. (2007). Confection d’une brique à base de sable de dunes. MAGISTER,
Aménagement Hydraulique et Génie Civil.
45
Murat Algin and Paki Turgut. (2007). Cotton and limestone powder wastes as brick material.
Harran University, Engineering Faculty, Civil Engineering Department, Sanliurfa,
Turkey.
Musembe, T. M. (2013). Laterized Quarry Dust and Recycled Concrete as Alternative Building
Materials (Doctoral dissertation).
Olaniyan O. S., R. A. Olaoye O. M. Okeyinka and D. B. Olaniyan. (2011). Soil Stabilization
Techniques Using Sodium Hydroxide Additives. International Journal of Civil and
Environmental Engineering (IJCEE), 11(6), 9-22.
Ruuska, A., & Häkkinen, T. (2014). Material efficiency of building construction. Buildings,
4(3), 266-294.
Sadek Deboucha and Roslan Hashim. (2010). A review on bricks and stabilized compressed
earth blocks. Scientific Research and Essays, 6(3), 499-506.
Samri, D. (2008). Analyse physique et caractérisation hygrothermique des matériaux de
construction: Approche expérimentale et modélisation numérique (Doctoral dissertation, INSA
Lyon).
Banu, T., Billah, M. M., Gulshan, F., & Kurny, A. S. W. (2013). Experimental studies on fly ash-
sand-lime bricks with gypsum addition. American Journal of Materials Engineering and
Technology, 1(3), 35-40.
UN Habitat. (2008). Global Housing Demand at Critical Levels.
Yalley, P. P. K., & Manu, D. (2013). Strength and Durability Properties of Cow Dung Stabilised
Earth Brick. Civil and Environmental Research, 3(13), 117-125.

46
APPENDICES
Appendix A: Sieve Analysis of sand
Sieve size Wtcumul retained % Retained % passing
10 5.17 0.52 99.48
5 35.50 3.55 96.45
2.36 79.17 7.92 92.08
1.18 321.67 32.17 67.83
0.6 645.17 64.52 35.48
0.3 804.83 80.48 19.52
0.15 965.33 96.53 3.47
Pan 992.33 99.23 0.77
Total
Appendix B: Mortar mix
Table B1: Control mixture for each date
Control mixture ( Cement: Sand : Water) at 7 days by vibration
Sample
Marking
Casting
Date
Testing
date
Age
(days) Weight (g) Load (kN)
Crushing
Strength
(Mpa)
Cube size
(mm3)
1;3:0.7 6/5/2016 13/5/2016 7
2276.5 172.02 17.202
100x100x100 2284 147.73 14.773
2322 175.298 17.53
1;3:0.8 6/5/2016 13/5/2016 7
2140 112.948 11.295
100x100x100 2093.5 108.913 10.891
2248.5 104.652 10.465
1;3:0.9 6/5/2016 13/5/2016 7
2208.5 102.242 10.224
100x100x100 2195.5 98.767 9.877
2181 91.536 9.154
2133.5 11.0258 11.026
1;3:0.6 10/5/2016 16/5/2016 7
2279 171.404 17.17
100x100x100 2335 203.876 20.388
2330 175.439 17.544

47
1;3:0.5 10/5/2016 16/5/2016 7
2385.5 236.935 23.693
100x100x100 2358.5 229.286 22.929
2339.5 165.745 16.575
1;3:0.4 10/5/2016 16/5/2016 7
2173 241.894 24.189
100x100x100 2232.5 206.565 20.657
2239 105.353 10.535
1;4:0.4 16/5/2016 23/5/2016 7
2279.5 171.6 17.160
100x100x100 2228 175.747 17.575
2171 196.787 19.679
1;4:0.5 16/5/2016 23/5/2016 7
2362.5 128.307 12.831
100x100x100 2376 239.904 23.990
2367 197.964 19.796
1;4:0.6 16/5/2016 23/5/2016 7
2298.5 143.554 14.355
100x100x100 2340 139.974 13.997
2361.5 148.374 14.837
1;4:0.7 16/5/2016 23/5/2016 7
2279 122.814 12.281
100x100x100 2234 124.944 12.494
2169 116.928 11.693
1;4:0.8 16/5/2016 23/5/2016 7
2169 64.882 6.488
100x100x100 2204 78.615 7.862
2239 70.628 7.063
1;5:0.4 18/5/2016 25/5/2016 7
2259 88.705 8.871
100x100x100 2153.5 95.011 9.501
2250.5 78.615 7.862
1;5:0.5 18/5/2016 25/5/2016 7
2124 95.908 9.591
100x100x100 2262.5 100.448 10.045
2184.5 92.293 9.229
1;5:0.6 18/5/2016 25/5/2016 7
2266.5 75.084 7.508
100x100x100 2283 82.455 8.246
2175 84.165 8.417
1;5:0.7 18/5/2016 25/5/2016 7
2351.5 99.86 9.986
100x100x100 2304 90.022 9.002
2313 91.148 9.115
1;5:0.8 18/5/2016 25/5/2016 7
2237 54.456 5.446
100x100x100 2202 62.416 6.242
2291.5 69.114 6.911

48
Table B2: Summarize of control mixture
Where, w/c: water cement ratio and, s/c: sand cement ratio
Appendix C: Water absorption
Table C1: Water aborption of bricks at 7 days
Water absorption ( Lime:Cement: Sand : Water) at 7 days
Sample
Marking
(
%perce
ntage of
lime)
Casting Date Testing
date
Age
(days)
Dry Weight
Wi (g)
Wet
WeightWw(g
)
Water
absorption
(Ww-
Wi)*100/Wi
%
0% 13/6/2016 23/6/2016 7
10246 11166 9.0
10365 11289.5 8.9
10609.5 11565 9.0
10361 11326.5 9.3
20% 13/6/2016 23/6/2016 7
10013 11090 10.8
9759.5 10839 11.1
9994 11121 11.3
9690 10740.5 10.8
40% 13/6/2016 23/6/2016 7
9214 10294 11.7
9091 10138.5 11.5
8870 9926 11.9
9519 10687.5 12.3
60% 13/6/2016 23/6/2016 7
9942.5 11145 12.1
8984.5 10023.5 11.6
9896 11063.5 11.8
9301 10363 11.4
80% 13/6/2016 23/6/2016 7 8339.5 9589 15.0

49
8754.5 10049.5 14.8
8703 9967 14.5
8547.5 9899 15.8
100% 13/6/2016 23/6/2016 7
9115 10714 17.5
9124 10569.5 15.8
8954.5 10463.5 16.9
Table C2: Water absorption of bricks at 14 days
Water absorption ( Lime:Cement: Sand : Water) at 14 days
Sample
Marking(
%percentage
of lime)
Casting Date Testing
date
Age
(days)
Dry Weight Wi
(g)
Wet
WeightWw(g)
Water
absorption
(Ww-
Wi)*100/Wi %
0% 16/6/2016 30/6/2016 14
10777 11703.5 8.6
10363 11403.5 10.0
9950.5 10782.5 8.4
11276.5 12063.5 7.0
10067 10944.5 8.7
20% 16/6/2016 30/6/2016 14
10653.5 11553.5 8.4
9944 11040.5 11.0
9857 10770 9.3
10049 10776 7.2
40% 16/6/2016 30/6/2016 14
10490 11416 8.8
10385 11325.5 9.1
9451 10469.5 10.8
1026.5 1137.5 10.8
60% 16/6/2016 30/6/2016 14
10399 11486 10.5
9818 10890.5 10.9
10506 11736.5 11.7
80% 16/6/2016 30/6/2016 14
8915 10175.5 14.1
8237 9445.5 14.7
9036 10384.5 14.9
9325 10672 14.4
100% 13/6/2016 23/6/2016 14
10272 11689 13.8
8941 10334.5 15.6
9177.5 10612.5 15.6
9173 10448.5 13.9
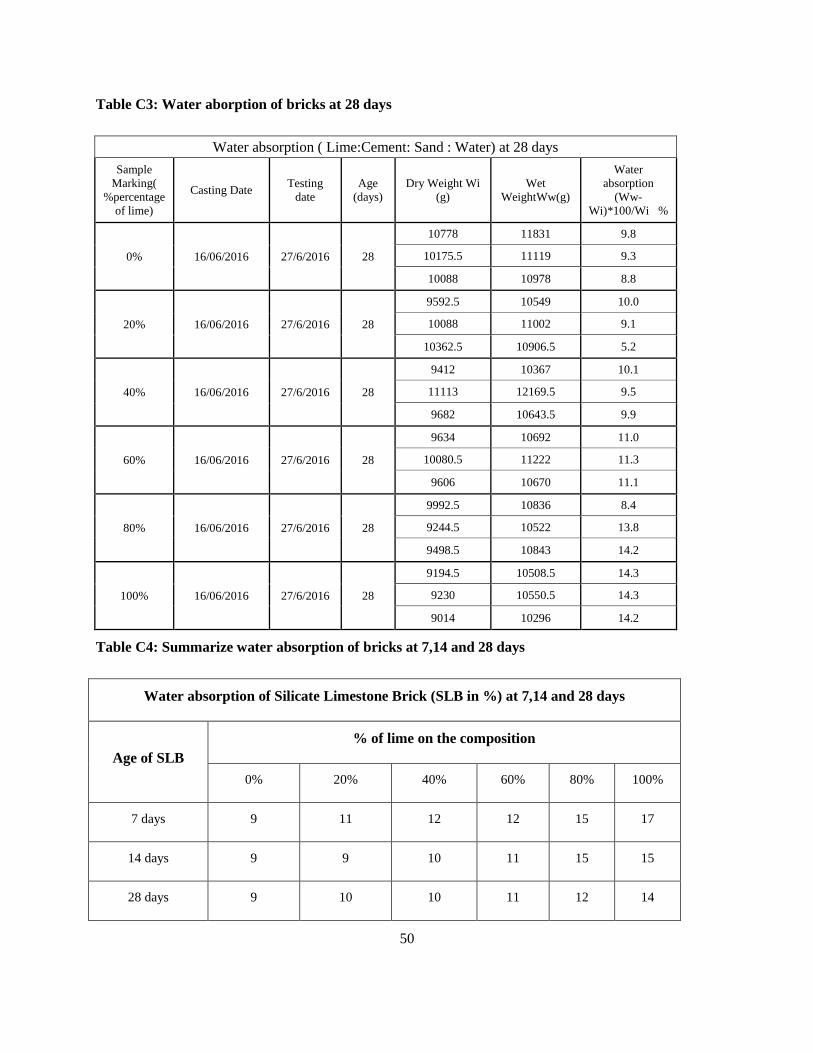
50
Table C3: Water aborption of bricks at 28 days
Water absorption ( Lime:Cement: Sand : Water) at 28 days
Sample
Marking(
%percentage
of lime)
Casting Date Testing
date
Age
(days)
Dry Weight Wi
(g)
Wet
WeightWw(g)
Water
absorption
(Ww-
Wi)*100/Wi %
0% 16/06/2016 27/6/2016 28
10778 11831 9.8
10175.5 11119 9.3
10088 10978 8.8
20% 16/06/2016 27/6/2016 28
9592.5 10549 10.0
10088 11002 9.1
10362.5 10906.5 5.2
40% 16/06/2016 27/6/2016 28
9412 10367 10.1
11113 12169.5 9.5
9682 10643.5 9.9
60% 16/06/2016 27/6/2016 28
9634 10692 11.0
10080.5 11222 11.3
9606 10670 11.1
80% 16/06/2016 27/6/2016 28
9992.5 10836 8.4
9244.5 10522 13.8
9498.5 10843 14.2
100% 16/06/2016 27/6/2016 28
9194.5 10508.5 14.3
9230 10550.5 14.3
9014 10296 14.2
Table C4: Summarize water absorption of bricks at 7,14 and 28 days
Water absorption of Silicate Limestone Brick (SLB in %) at 7,14 and 28 days
Age of SLB
% of lime on the composition
0% 20% 40% 60% 80% 100%
7 days 9 11 12 12 15 17
14 days 9 9 10 11 15 15
28 days 9 10 10 11 12 14

51
Appendix D: Dry density
Table D1: Dry density of bricks at 7 days
Dried Density test at 7 days
Sample
Marking(
%percentage
of lime)
Casting
Date
Testing
date
Age
(days)
Dry Weight
Wi (g)
Size Volume
(cm3)
Dried
Density
(kg/m3) X (cm) Y
(cm)
Z
(cm)
0% 13/6/2016 23/6/2016 7
10246 28.7 13.5 14 5424.3 1889
10365 28.6 13.8 14 5525.52 1876
10609.5 28.7 14 14 5625.2 1886
10361 28.7 13.5 14 5424.3 1910
20% 13/6/2016 23/6/2016 7
10013 28.7 14 14 5625.2 1780
9759.5 28.7 13.3 14 5343.94 1826
9994 28.9 13.5 14 5462.1 1830
9690 28.7 13.3 14 5343.94 1813
40% 13/6/2016 23/6/2016 7
9214 28.8 12.5 14 5040 1828
9091 28.8 12.7 14 5120.64 1775
8870 28.9 12.5 14 5057.5 1754
9519 28.9 13 14 5259.8 1810
60% 13/6/2016 23/6/2016 7
9942.5 28.8 13.7 14 5523.84 1800
8984.5 28.8 12.5 14 5040 1783
9896 28.9 13.7 14 5543.02 1785
9301 28.7 12.5 14 5022.5 1852
80% 13/6/2016 23/6/2016 7
8339.5 28.9 12.5 14 5057.5 1649
8754.5 28.9 12.8 13.9 5141.888 1703
8703 28.9 13 14 5259.8 1655
8547.5 28.8 12.5 14 5040 1696
100% 13/6/2016 23/6/2016 7
9115 28.9 14 13.8 5583.48 1632
9124 28.8 14 14 5644.8 1616
8954.5 28.9 13.8 14 5583.48 1604

52
Table D2: Dry density of bricks at 14 days
Dried Density test at14 days
Sample
Marking(
%percentage
of lime)
Casting
Date
Testing
date
Age
(days)
Dry Weight
Wi (g)
Size Volume
(cm3)
Dried
Density
(kg/m3) X (cm) Y
(cm)
Z
(cm)
0% 16/6/2016 30/6/2016 14
10777 29 14 14 5684 1896
10363 29 14 14 5684 1823
9950.5 29 14 14 5684 1751
11276.5 29 14 14 5684 1984
10067 29 14 14 5684 1771
20% 16/6/2016 30/6/2016 14
10653.5 29 14 14 5684 1874
9944 29 14 14 5684 1749
9857 29 14 14 5684 1734
10049 29 14 13 5278 1904
40% 16/6/2016 30/6/2016 14
10490 29 14 14 5684 1846
10385 29 14 14 5684 1827
9451 29 14 13 5278 1791
1026.5 29 14 14 5684 181
60% 16/6/2016 30/6/2016 14
10399 29 14 14 5684 1830
9818 29 14 13.5 5481 1791
10506 29 14 14 5684 1848
80% 16/6/2016 30/6/2016 14
8915 29 14 13 5278 1689
8237 29 14 12 4872 1691
9036 29 14 14 5684 1590
9325 29 13.8 13.5 5402.7 1726
100% 13/6/2016 23/6/2016 14
10272 29 14 15 6090 1687
8941 29 14 13 5278 1694
9177.5 29 14 13.5 5481 1674
9173 29 14 13.5 5481 1674

53
Table D3: Dry density of bricks at 28 days
Dried Density test at28 days
Sample
Marking(
%percentage
of lime)
Casting
Date
Testing
date
Age
(days)
Dry Weight
Wi (g)
Size
Volume
(cm3)
Dried
Density
(kg/m3) X (cm)
Y
(cm)
Z
(cm)
0% 16/6/2016 27/7/2016 28
10778 29 14 14.5 5887 1831
10175.5 29 14 14 5684 1790
10088 29 14 14 5684 1775
20% 16/6/2016 30/6/2016 28
9592.5 29 14 13 5278 1817
10088 29 14 13.8 5602.8 1801
10362.5 29 14 13.5 5481 1891
40% 16/6/2016 30/6/2016 28
9412 29 14 13 5278 1783
11113 29 14 14.5 5887 1888
9682 29 14 13 5278 1834
60% 16/6/2016 30/6/2016 28
9634 29 14 13 5278 1825
10080.5 29 14 14 5684 1773
9606 29 14 13 5278 1820
80% 16/6/2016 30/6/2016 28
9992.5 29 14 14 5684 1758
9244.5 29 14 14 5684 1626
9498.5 29 14 14 5684 1671
100% 13/6/2016 23/6/2016 28
9194.5 29 14 13.8 5602.8 1641
9230 29 14 13.6 5521.6 1672
9014 29 14 13 5278 1708
Table D4: Summarize dry density of bricks at 7, 14 and 28 days
Dry density of SLB (kg/m3) at 7, 14 and 28 days
Age of SLB
% of lime on the composition
0% 20% 40% 60% 80% 100%
7 days 1890 1812 1792 1789 1676 1618
14 days 1845 1815 1821 1823 1674 1682

54
28 days 1799 1836 1835 1806 1685 1674
Appendix E: Strength of brick
Table E1: Compressive strength of silicate limestone bricks at 7 days
Compressive strength of bricks at 7 days
Sample
Marking(
%percentage
of lime)
Casting
Date
Testing
date
Age
(days)
Weight
(g) Load (kN)
Crushing
strength
(MPa) Size
0% 9/6/2016 16/6/2016 7
10321.5 230 5.665
140x290x140 10524.5 230 5.665
10973.5 240 5.911
10518 160 3.941
0% 10/6/2016 17/6/2016 7
10588 190 4.680
140x290x140 9777.5 170 4.187
10784.5 150 3.695
20% 9/6/2016 16/6/2016 7
10206.5 270 6.650
140x290x140 10375 215 5.296
10048 270 6.650
10471.5 200 4.926
20% 9/6/2016 16/6/2016 7
10030.5 200 4.926
140x290x140 10175.5 180 4.433
9968 190 4.680
9137.5 190 4.680
40% 9/6/2016 16/6/2016 7
11019.5 100 2.463
140x290x140 9585.5 110 2.709
10633 100 2.463
10214 120 2.956
40% 9/6/2016 16/6/2016 7
11012.5 190 4.680
140x290x140
10224.5 160 3.941
10283 250 6.158
10453.5 210 5.172
10412.5 180 4.433
60% 9/6/2016 16/6/2016 7 10274 115 2.833 140x290x140

55
10194 170 4.187
10042.5 180 4.433
9954.5 175 4.310
60% 9/6/2016 16/6/2016 7
11073 150 3.695
140x290x140
10711 150 3.695
10068.5 140 3.448
9862.5 150 3.695
9983.5 140 3.448
80% 9/6/2016 16/6/2016 7
9025.5 120 2.956
140x290x140 9603 95 2.340
9060 110 2.709
10242.5 110 2.709
80% 9/6/2016 16/6/2016 7
9497 60 1.478
140x290x140 10740 60 1.478
10483.5 70 1.724
9974.5 65 1.601
100% 9/6/2016 16/6/2016 7
10941.5 25 0.616
140x290x140 11284 0 0.000
10355 0 0.000
Table E2: Compressive strength of silicate limestone bricks at 14 days
Compressive strength of bricks at 14 days
Sample
Marking(
%percentage
of lime)
Casting
Date
Testing
date
Age
(days)
Weight
(g) Load (kN)
Crushing
strength
(MPa) Size
/0% 16/6/2016 30/6/2016 14
11294 400 9.852
140x290x140 10261.5 250 6.158
11802.5 361 8.892
10519.5 308 7.586
0% 17/6/2016 1/7/2016 14
12035.5 440 10.837
140x290x140 11261.5 310 7.635
12182.5 360 8.867
11215.5 280 6.897
20% 16/6/2016 30/6/2016 14
10639.5 270 6.650
140x290x140 10458 265 6.527
10176 275 6.773

56
10466 340 8.374
10802 225 5.542
20% 17/6/2016 1/7/2016 14
11882 310 7.635
140x290x140 11361.5 340 8.374
11819.5 340 8.374
11456 340 8.374
40% 16/6/2016 30/6/2016 14
11519 340 8.374
140x290x140 10941.5 410 10.099
10809.5 250 6.158
10413.5 270 6.650
40% 17/6/2016 1/7/2016 14
11717.5 260 6.404
140x290x140 11106.5 270 6.650
11040.5 240 5.911
11441.5 200 4.926
60% 16/6/2016 30/6/2016 14
9887 110 2.709
140x290x140
10637 110 2.709
10243 120 2.956
10799.5 185 4.557
11677 195 4.803
60% 17/6/2016 1/7/2016 14
11309.5 210 5.172
140x290x140 10510 240 5.911
10759 110 2.709
11135 160 3.941
80% 16/6/2016 30/6/2016 14
9766 75 1.847
140x290x140 10940 70 1.724
10940 70 1.724
10576.5 65 1.601
80% 17/6/2016 1/7/2016 14
10682.5 50 1.232
140x290x140
11421.5 70 1.724
10341.5 60 1.478
10525 75 1.847
10601.5 60 1.478
100% 9/6/2016 16/6/2016 14
9028.5 25 0.616
140x290x140 10261.5 20 0.493
9203 20 0.493
9813 20 0.493

57
100% 17/6/2016 1/7/2016 14
10874 20 0.493
140x290x140 10812 17 0.419
10050 15 0.369
10800 23 0.567
Table E3: Compressive strength of silicate limestone bricks at 28 days.
Compressive strength of bricks at 14 days
Sample
Marking(
%percentage
of lime)
Casting
Date
Testing
date
Age
(days)
Weight
(g) Load (kN)
Crushing
strength
(MPa) Size
0% 11/6/2016 9/7/2016 28
11528 580 14.286
140x290x140 9802 420 10.345
10400 420 10.345
10871.5 440 10.837
20% 11/6/2016 9/7/2016 28
11192 385 9.483
140x290x140 10307.5 455 11.207
10754.5 460 11.330
10623.5 300 7.389
40% 11/6/2016 9/7/2016 28
11849 305 7.512
140x290x140 12686 380 9.360
11554 330 8.128
9853 415 10.222
60% 11/6/2016 9/7/2016 28
10733.5 180 4.433
140x290x140
11700 270 6.650
11339 270 6.650
10198 250 6.158
10819.5 265 6.527
80% 11/6/2016 9/7/2016 28
9942 135 3.325
140x290x140
10340.5 130 3.202
10529 125 3.079
11662.5 110 2.709
9050 110 2.709
100% 11/6/2016 9/7/2016 28 9998 50 1.232
140x290x140 10329.5 55 1.355

58
9512 60 1.478
10032 50 1.232
Table E4: Compressive strength of natural stone
Sample Marking(
%percentage of lime) Weight (g) Load (kN) Crushing strength
(MPa) Size
Natural stone
17000 210 3.797
140x395x200 17000 205 3.707
17000 220 3.978
17000 200 3.617
Table E5: Compressive strength of concrete block
Sample Marking(
%percentage of lime) Weight (g) Load (kN) Crushing strength
(MPa) Size
Concrete block
14700 380 6.960
140x395x200
15400 255 4.670
15800 320 5.861
15900 380 6.960
18 980 705 12.912
Table E6: Compressive strength of clay brick
Sample Marking(
%percentage of lime) Weight (g) Load (kN) Crushing strength
(MPa) Size
CB
6772.5 73.29 1.576
140x395x200
6910 114.322 2.459
6918.5 76.317 1.641
6960.5 69.283 1.490
6725.5 79.709 1.714
6547 79.036 1.700
6706 93.021 2.000

59
Table E7: Flexural strength of silicate limestone bricks at 14 days
Sample
Marking(
%percentage
of lime)
Casting
Date
Testing
date
Age
(days) Weight (g) Load (kN)
Crushing
Strength
(Mpa)
mold size
(mm3)
0% 27/6/2016 12/7/2016 14
556.5 1.98 4.641
40x40x160
507 1.54 3.609
531.5 1.94 4.547
526 1.9 4.453
446.5 1.54 3.609
494.5 1.76 4.125
20% 27/6/2016 12/7/2016 14
577 1.9 4.453
40x40x160 531 2.14 5.016
590.5 2.12 4.969
40% 27/6/2016 12/7/2016 14
517.5 1.48 3.469
40x40x160 505 1.1 2.578
490 1.32 3.094
60% 27/6/2016 12/7/2016 14
492 0.88 2.063
40x40x160 486.5 0.56 1.313
551.5 0.92 2.156
80% 27/6/2016 12/7/2016 14
504.5 0.6 1.406
40x40x160 448 0.5 1.172
480 0.5 1.172
475.5 0.54 1.266
100% 27/6/2016 12/7/2016 14
527.5 0 0.000
40x40x160 492 0 0.000
499 0.14 0.328

60
Table E8: Flexural strength of silicate limestone bricks at 28 days
Sample
Marking(
%percentage
of lime)
Casting
Date
Testing
date
Age
(days) Weight (g) Load (kN)
Crushing
Strength
(Mpa)
mold size
(mm3)
0% 23/6/2016 21/7/2016 28
588 2.7 6.328
40x40x160
568.5 2.08 4.875
581.5 2.48 5.813
560.5 2.6 6.094
582 3.2 7.500
582 1.68 3.938
546.5 1.7 3.984
547.5 2.26 5.297
20% 23/6/2016 21/7/2016 28
508 1.66 3.891
40x40x160
511 2 4.688
539.5 2 4.688
565.5 1.8 4.219
550.5 2 4.688
40% 23/6/2016 21/7/2016 28
576.5 1.8 4.219
40x40x160
503.5 1.5 3.516
517.5 1.32 3.094
540 1.44 3.375
549 1.34 3.141
60% 23/6/2016 21/7/2016 28
547 0.9 2.109
40x40x160 529 0.98 2.297
508 0.82 1.922
80% 23/6/2016 21/7/2016 28
565 1.72 4.031
40x40x160 524 1.64 3.844
441 0.54 1.266
100% 23/6/2016 21/7/2016 28
435 0 0.000
40x40x160 492 0.3 0.703
508 0.35 0.820
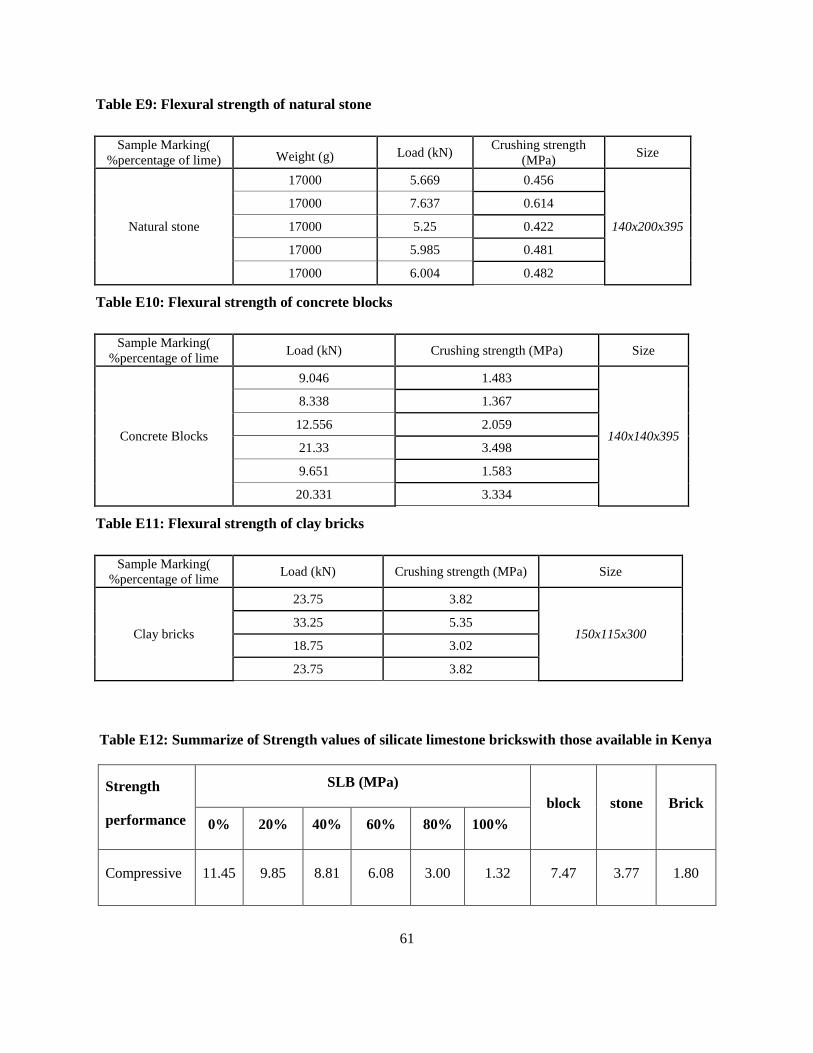
61
Table E9: Flexural strength of natural stone
Sample Marking(
%percentage of lime) Weight (g) Load (kN) Crushing strength
(MPa) Size
Natural stone
17000 5.669 0.456
140x200x395
17000 7.637 0.614
17000 5.25 0.422
17000 5.985 0.481
17000 6.004 0.482
Table E10: Flexural strength of concrete blocks
Sample Marking(
%percentage of lime Load (kN) Crushing strength (MPa) Size
Concrete Blocks
9.046 1.483
140x140x395
8.338 1.367
12.556 2.059
21.33 3.498
9.651 1.583
20.331 3.334
Table E11: Flexural strength of clay bricks
Sample Marking(
%percentage of lime Load (kN) Crushing strength (MPa) Size
Clay bricks
23.75 3.82
150x115x300 33.25 5.35
18.75 3.02
23.75 3.82
Table E12: Summarize of Strength values of silicate limestone brickswith those available in Kenya
Strength
performance
SLB (MPa)
block stone Brick
0% 20% 40% 60% 80% 100%
Compressive 11.45 9.85 8.81 6.08 3.00 1.32 7.47 3.77 1.80

62
Strength.
Flexural
Strength.
5.48 4.57 3.47 3.05 2.11 0.76 2.22 0.49 4.00
Appendix F: Strength of walls
Table F1: Maximum compressive strength of walls
Designation Max Stress (N/mm2)
Silicate Limestone Wall (60%) 0.90
Clay Wall 0.64
Natural stone Wall 1.98

63
Table F2: Load-displacement values
Silicate
limestone
Wall
Displacement
(mm) 0.33 0.81 1.63 2.41 3.00 3.44 3.85 4.63 5.07 5.48 6.33 7.26
Load (kN) 10.4 20.32 26.08 31.84 39.68 46.08 53.6 65.12 70.56 75.52 28.16 4
Clay Wall Displacement
(mm) 0.44 0.93 1.44 1.81 2.37 2.89 3.41 3.89 4.52 5.11 5.37 5.74 6.37
Load (kN) 4 8.8 13.12 16.48 19.36 22.72 26.4 29.28 32.8 33.44 36.8 39.04 42.24
Stone Wall Displacement
(mm) 0.07 0.56 1.00 1.22 1.59 1.78 2.26 3.22 3.93 4.63 5.22 5.59 6.15
Load (kN) 1.92 6.56 13.6 19.04 27.68 30.72 38.56 46.24 51.52 58.24 68.32 78.08 92.16
Silicate
limestone
Wall
Displacement
(mm)
Load (kN)
Clay Wall Displacement
(mm) 7.04 7.67 8.26 8.63 8.74
Load (kN) 46.24 52.8 59.68 58.4 45.6
Stone Wall Displacement
(mm) 6.52 7.00 7.41 7.89 8.30 8.70 9.41 9.89 10.37 10.52 10.89
Load (kN) 99.52 111.2 120.96 131.52 140.16 146.24 160.48 165.92 160.64 149.44 130.88

64
Table F3: Stress strain vertical
Silicate
limestone
Wall
Strain
(10-6
) 7.55 18.87 35.38 75.94 101.89 2075.47 2910.38 2263.21 1783.49 1489.62 661.32 53.77
Stress
(MPa) 0.12 0.24 0.31 0.38 0.47 0.55 0.64 0.78 0.84 0.90 0.34 0.05
Clay
Wall
Strain
(10-6
) 53.30 113.21 172.17 211.32 237.74 271.70 313.21 352.83 394.81 414.62 445.75 470.28
Stress
(MPa) 0.05 0.10 0.16 0.20 0.23 0.27 0.31 0.35 0.39 0.40 0.44 0.46
Stone
Wall
Strain
(10-6
) 0.47 0.47 0.00 0.00 0.47 0.94 0.94 0.94 0.94 0.00 0.00 1.42
Stress
(MPa) 0.02 0.08 0.16 0.23 0.33 0.37 0.46 0.55 0.61 0.69 0.81 0.93
Silicate
limestone
Wall
Strain
(10-6
)
Stress
(MPa)
Clay Wall
Strain
(10-6
) 505.19 547.64 610.85 648.11 579.72 397.17
Stress
(MPa) 0.50 0.55 0.63 0.71 0.70 0.54
Stone
Wall
Strain
(10-6
) 5.66 10.85 15.57 19.34 23.11 25.47 28.30 15.57 14.62 3.77 183.49 327.36 372.17
Stress
(MPa) 1.10 1.18 1.32 1.44 1.57 1.67 1.74 1.91 1.98 1.91 1.78 1.56 0.69

65
Table F4:Stress strain Horizontal
Silicate
limestone
Wall
Strain
(10-6
) 0.00 0.47 0.94 1.89 5.19 18.87 34.91 62.26 81.60 100.47 142.92 50.00
Stress
(MPa) 0.12 0.24 0.31 0.38 0.47 0.55 0.64 0.78 0.84 0.90 0.34 0.05
Clay
Wall
Strain
(10-6
) 0.94 4.25 6.13 7.55 10.38 13.21 15.57 18.40 25.47 39.62 48.58 58.02
Stress
(MPa) 0.05 0.10 0.16 0.20 0.23 0.27 0.31 0.35 0.39 0.40 0.44 0.46
Stone
Wall
Strain
(10-6
) 0.00 1.42 3.77 5.66 5.66 4.25 1.89 0.00 0.00 1.42 6.60 9.43
Stress
(MPa) 0.02 0.08 0.16 0.23 0.33 0.37 0.46 0.55 0.61 0.69 0.81 0.93
Silicate
limestone
Wall
Strain
(10-6
)
Stress
(MPa)
Clay
Wall
Strain
(10-6
) 75.00 92.45 120.28 157.55 192.45 235.85
Stress
(MPa) 0.50 0.55 0.63 0.71 0.70 0.54
Stone
Wall
Strain
(10-6
) 12.74 12.26 14.62 12.26 9.91 9.91 6.60 2.83 8.49 21.23 26.42 43.87 56.60
Stress
(MPa) 1.10 1.18 1.32 1.44 1.57 1.67 1.74 1.91 1.98 1.91 1.78 1.56 0.69


![Limestone, Chert, or Limestone? [2013225_fieldtrip]](https://static.fdocuments.in/doc/165x107/558421bfd8b42a86478b4731/limestone-chert-or-limestone-2013225fieldtrip.jpg)