
Structural Interpretation of Lineaments Uses Satellite...
17
Journal of Geographic Information System, 2017, 9, 440-455 http://www.scirp.org/journal/jgis ISSN Online: 2151-1969 ISSN Print: 2151-1950 DOI: 10.4236/jgis.2017.94027 August 3, 2017 Structural Interpretation of Lineaments Uses Satellite Images Processing: A Case Study in North-Eastern Tunisia Sarra Ouerghi Hermi 1,2 , Ranya Fadlalla Abdalla Elsheikh 1,3 , Maher Aziz 4 , Samir Bouaziz 2 Abstract Keywords 1. Introduction
-
Upload
phungtuyen -
Category
Documents
-
view
228 -
download
0
Transcript of Structural Interpretation of Lineaments Uses Satellite...
Journal of Geographic Information System, 2017, 9, 440-455 http://www.scirp.org/journal/jgis
ISSN Online: 2151-1969 ISSN Print: 2151-1950
DOI: 10.4236/jgis.2017.94027 August 3, 2017
Structural Interpretation of Lineaments Uses Satellite Images Processing: A Case Study in North-Eastern Tunisia
Sarra Ouerghi Hermi1,2, Ranya Fadlalla Abdalla Elsheikh1,3, Maher Aziz4, Samir Bouaziz2
1Department of Geography, Faculty of Arts & Humanities, King Abdulaziz University, Jeddah, KSA 2Laboratoire 3E “Eau-Energie-Environnement” (LRAD-10-02), Ecole Nationale d’Ingénieurs, Sfax, Tunisie 3GIS Department, School of Survey, Sudan University of Science and Technology, Sudan 4Department of Geomatics, Faculty of Environmental Design, King Abdulaziz University, Jeddah, KSA
Abstract This paper presents a lineament detection method using multi-band remote sensing images. The main objective of this work is to design an automatic im-age processing tool for lineament mapping from Landsat-7 ETM + satellite data. Five procedures were involved: 1) The Principal Component Analysis; 2) image enhancement using histogram equalization technique 3) directional Sobel filters of the original data; 4) histogram segmentation and 5) binary im-age generation. The applied methodology was contributed in identifying sev-eral known large-scale faults in the Northeast of Tunisia. The statistical and spatial analyses of lineament map indicate a difference of morphological ap-pearance of lineaments in the satellite image. Indeed, all the lineaments present a specific organization. Five groups were classified based on three orientations: NE-SW, E-W and NW-SE. The overlapping of lineament map with the geologic map confirms that these lineaments of diverse directions can be identified and recognized on the field as a fault. The identified lineaments were linked to a deep faults caused by tectonic movements in Tunisia. This study shows the performance of the satellite image processing in the analysis and mapping of the accidents in the northern Atlas.
Keywords Northeast of Tunisia, Landsat-7 ETM + Satellite Data, Directional Sobel Filters, Lineaments, Image Processing
1. Introduction
Aerial-photography can obtain Geological, structures information and some
How to cite this paper: Hermi, S.O., El-sheikh, R.F.A., Aziz, M. and Bouaziz, S. (2017) Structural Interpretation of Linea-ments Uses Satellite Images Processing: A Case Study in North-Eastern Tunisia. Jour- nal of Geographic Information System, 9, 440-455. https://doi.org/10.4236/jgis.2017.94027 Received: March 15, 2017 Accepted: July 31, 2017 Published: August 3, 2017 Copyright © 2017 by authors and Scientific Research Publishing Inc. This work is licensed under the Creative Commons Attribution International License (CC BY 4.0). http://creativecommons.org/licenses/by/4.0/
Open Access
S. O. Hermi et al.
441
enigmatic phenomena, which were totally invisible from the field. The satellite images cover wide range of the area in the short period of time. This fact leads to a better knowledge on the earth’s surface studies which become less complicated.
The remote sensing has shown a great promise to the researchers in the geo-logical map ping and earth exploration [1] [2] [3]. Fault detection is an impor-tant element in the field of structural, economic and environmental geology [4] [5]. Currently, in remote sensing there are many approaches to identify mor-phological and structural lineaments. The approaches correspond to the inter-pretation of the geomorphologic signatures from high-spatial resolution images, such as Landsat 7. In this paper, combined remote sensing applications through the processing of the Landsat-7 Enhance Thematic Mapper Plus (ETM+) and field observation were used to identify the faults and to estimate their directions in North-Eastren Tunsia. All the visible information on the image was inter-preted. Geological structures of north-eastern Tunisia were extracted using de-tectable lineaments analysis on the satellite images. The method of associating the remote sensing with the geological and geo-morphological studies could provide considerable contribution on the lineament detection techniques.
2. Material and Method 2.1. Study Area
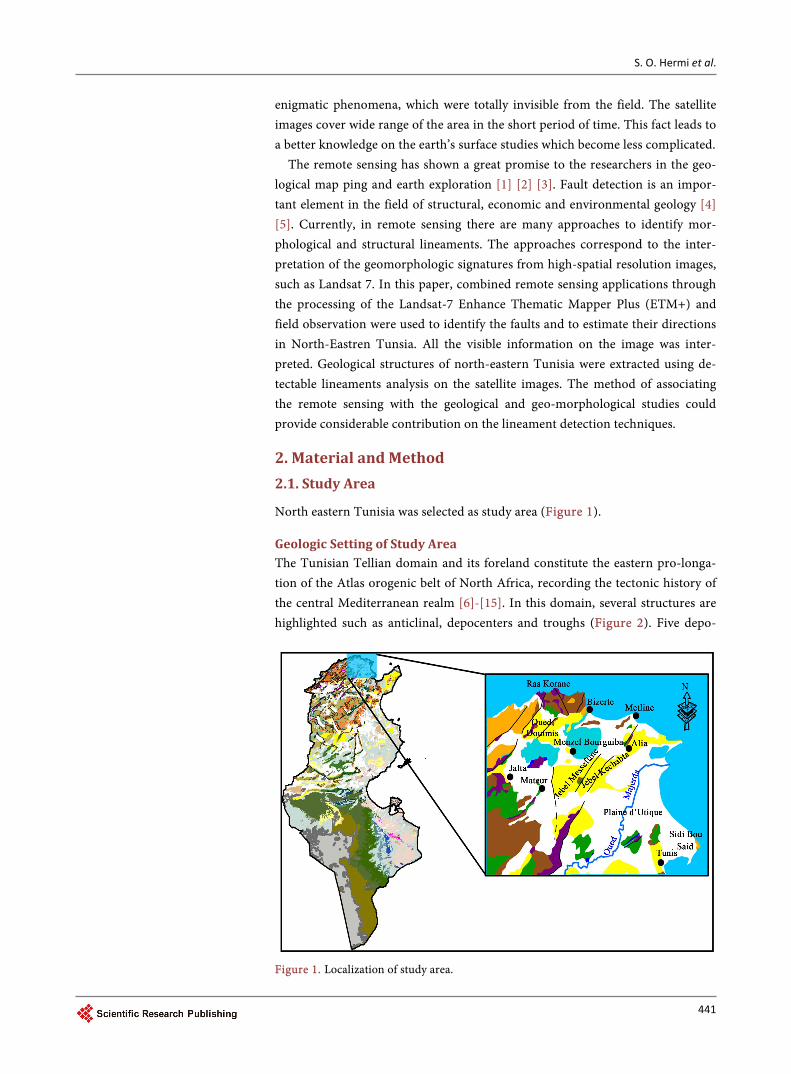
North eastern Tunisia was selected as study area (Figure 1).
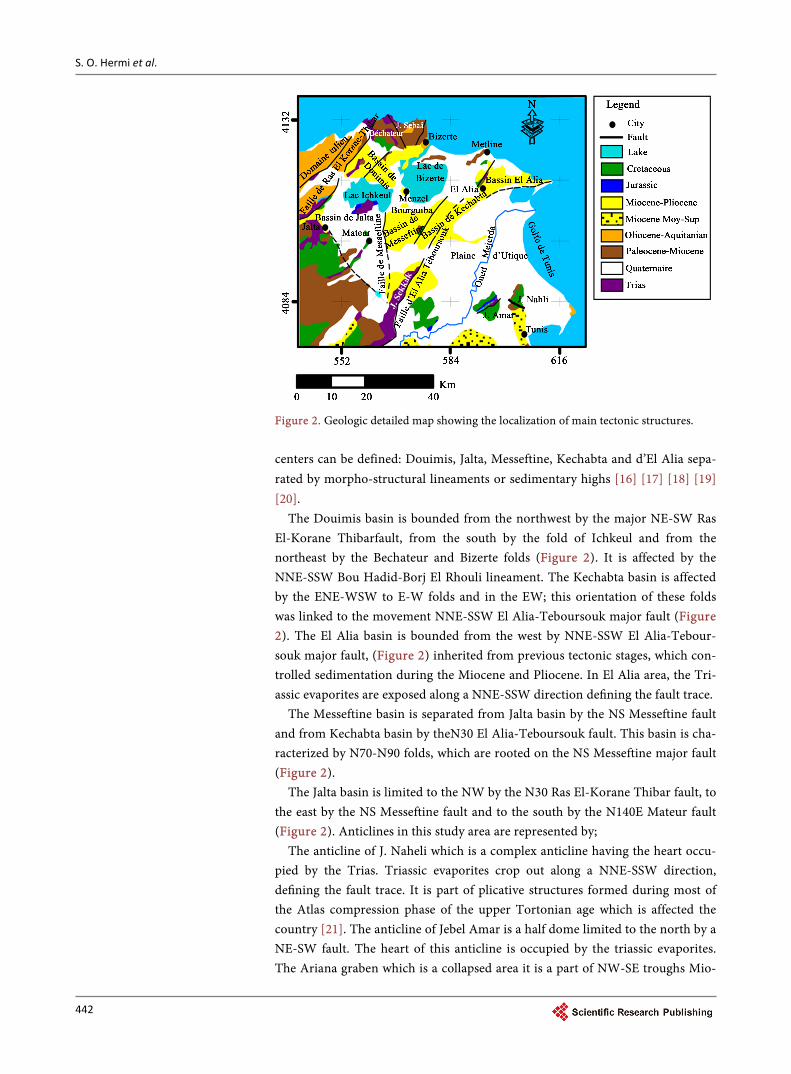
Geologic Setting of Study Area The Tunisian Tellian domain and its foreland constitute the eastern pro-longa- tion of the Atlas orogenic belt of North Africa, recording the tectonic history of the central Mediterranean realm [6]-[15]. In this domain, several structures are highlighted such as anticlinal, depocenters and troughs (Figure 2). Five depo-
Figure 1. Localization of study area.
S. O. Hermi et al.
442
Figure 2. Geologic detailed map showing the localization of main tectonic structures. centers can be defined: Douimis, Jalta, Messeftine, Kechabta and d’El Alia sepa-rated by morpho-structural lineaments or sedimentary highs [16] [17] [18] [19] [20].
The Douimis basin is bounded from the northwest by the major NE-SW Ras El-Korane Thibarfault, from the south by the fold of Ichkeul and from the northeast by the Bechateur and Bizerte folds (Figure 2). It is affected by the NNE-SSW Bou Hadid-Borj El Rhouli lineament. The Kechabta basin is affected by the ENE-WSW to E-W folds and in the EW; this orientation of these folds was linked to the movement NNE-SSW El Alia-Teboursouk major fault (Figure 2). The El Alia basin is bounded from the west by NNE-SSW El Alia-Tebour- souk major fault, (Figure 2) inherited from previous tectonic stages, which con-trolled sedimentation during the Miocene and Pliocene. In El Alia area, the Tri-assic evaporites are exposed along a NNE-SSW direction defining the fault trace.
The Messeftine basin is separated from Jalta basin by the NS Messeftine fault and from Kechabta basin by theN30 El Alia-Teboursouk fault. This basin is cha-racterized by N70-N90 folds, which are rooted on the NS Messeftine major fault (Figure 2).
The Jalta basin is limited to the NW by the N30 Ras El-Korane Thibar fault, to the east by the NS Messeftine fault and to the south by the N140E Mateur fault (Figure 2). Anticlines in this study area are represented by;
The anticline of J. Naheli which is a complex anticline having the heart occu-pied by the Trias. Triassic evaporites crop out along a NNE-SSW direction, defining the fault trace. It is part of plicative structures formed during most of the Atlas compression phase of the upper Tortonian age which is affected the country [21]. The anticline of Jebel Amar is a half dome limited to the north by a NE-SW fault. The heart of this anticline is occupied by the triassic evaporites. The Ariana graben which is a collapsed area it is a part of NW-SE troughs Mio-
S. O. Hermi et al.
443
Pliocene-Quaternary filling characteristics of the foreland of the Alps chain of Tunisia [21] [22] [23]. It is bounded by normal faults trending N140 to N160. The subsidence’s basins characterizing the study area include those of Oued Gueniche in the NW, El Mabtouha plainin the South and Utique plain, Lake of Porto.
2.2. Data
The lineaments’ detection of satellite images can be influenced by some climatic factors, hydraulic factors and the illumination source during data acquisition. In addition, the visual quality of an image depends on the spectral bands, the date when it was taken and the scale [24]. Sensor calibration can affect the geometry of the image. The data was derived from the Landsat 7 ETM + satellite that are the bands diversity provides to the interpreter a wealth of manipulated informa-tion (7 spectral bands). The Landsat system is the one that holds the record of the continuous observation of the Earth surface (from a polar orbit). Landsat sa-tellites are mainly used for environmental monitoring, disaster assessment, land use, regional planning, mapping, urban management, petroleum and mineral exploration.
Nowadays, Landsat ETM has 8 bands, from visible (band 1, band 2 and band 3) to near-and mid-infrared (band 4, band 5 and band 7) to the thermal radia-tion (band 6). The spatial resolution is about 15 meters for the panchromatic band (band 8) and about 10 meters for band 1 to band 5 and band 7. The ther-mal band (band 6) provides a resolution of 60 meters (Table 1).
The image used in this study was taken on 31 May 2001 at 04: 07 am. Landsat data have the advantage of illustrated out the lineaments clearly due to the low value of the solar angle (=122.1057953 SUN_AZIMUTH and SUN_ELEVATION = 65.0615912), the deletion of restrictive spatial detail and the regional coverage [25].
The composition of bands 1, 2 and 3 were implemented to illustrate the shades that define the topography and the drainage network that often controll- ed by geological structures. Table 1. The eight channels of the Landsat ETM image.
Bands Wavelength Resolution Color
TM1 0.45 - 0.5 µm 30 m Bleu
TM2 0.52 - 0.6 µm 30 m green
TM3 0.63 - 0.69 µm 30 m red
TM4 0.75 - 0.9 µm 30 m Near Infrared (NIR)
TM5 1.5 - 1.7 µm 30 m Shortwave Infrared (SWIR)
TM6 10.4 - 12.5 µm 60 m Thermal
TM7 2.08 - 2.35 µm 30 m Shortwave Infrared (SWIR)
8 520 - 900 nm 15 m Panchromatic (green-red-IR)
S. O. Hermi et al.
444
2.3. Methdology
The availability of multispectral information and image enhancement techniques provide more flexible methods to analyze reliable lineament and fracture traces. The methodology presented in this paper for the identification of lineaments with possible structural origin has been divided into two phases. The first one includes the enhancements facilitating the human interpretation using Laplacian filter and Sobel filter. Their advantages and weaknesses are explained in detail by [26]. Most image processing softwares incorporates this kind of treatment. The second phase of treatment is to extract and trace the lineaments automatically, from the image directly or from a binary image. The operation is more complex and, therefore, the programs able to execute it successfully are very few. In gen-eral, the literature suggests different step by step procedures leading to the trac-ing of lineaments [27]-[33]. These procedures generally involve the detection and edge enhancement or gradients followed by a filter as a means to classify the pixels indicating the presence of lineament pixels and indicating the absence of lineament. Some work focuses specifically on methods for analyzing lineaments cards [34] [35].
2.3.1. Geometric Correction The main reasons of deformations while recording images by the sensors are the earth curvature, the altitude variation of soil, at mopheric refraction, measure-ment systems errors and the movements of the platform. Therefore it is neces-sary to conduct a geometric correction to bring the image to a planimetric reali-ty. The image was adjusted to the same type of the topographic map projection (UTM zone 32 N for Tunisia) to correct residual image distortions and accu-rately calibrate it with the corresponding topographic base. The method consists on selecting a set of reference points on the topographic map. The intersections of roads, bridges, rivers and lakes borders were selected as control points. The GCP Works module allows a successive elimination of the points that increase the average positioning error. Finally, some points spread evenly throughout the image were preserved. The screen visualization of the image superimposed on the digital topographic map reveals the quality of the correction operation.
2.3.2. The Principal Component Analysis The Principal Component Analysis is an effective technique to accentuate a multispectral image for a geological interpretation [36]. It reduces the informa-tion contained in several bands, sometimes highly correlated (Thus, the redun-dancy of information), into a smaller number of components. These typically represent up to 97% of the total variance of the original data set [37]. Sometimes the information in 5 or 6 bands is reduced by the Principal Component Analysis in only 3 components. This analysis allows, among others, to create colored compounds of the first three colored components that make up an excellent product for visual interpretation, increasing the contrast between various objects on the ground. Visual examination of the ETM image allows finding the same lineaments on each of these images. These images are very similar. Principal
S. O. Hermi et al.
445
Component Analysis was used to preserve the maximum information about the lineaments. The Principal Component Analysis is a transformation that provides a reduced number of bands while maintaining the maximum information [38]. The main components were calculated from 6 spectral bands ETM. Statistical calculations were applied to six bands of the satellite are presented in Table 2 and Table 3.
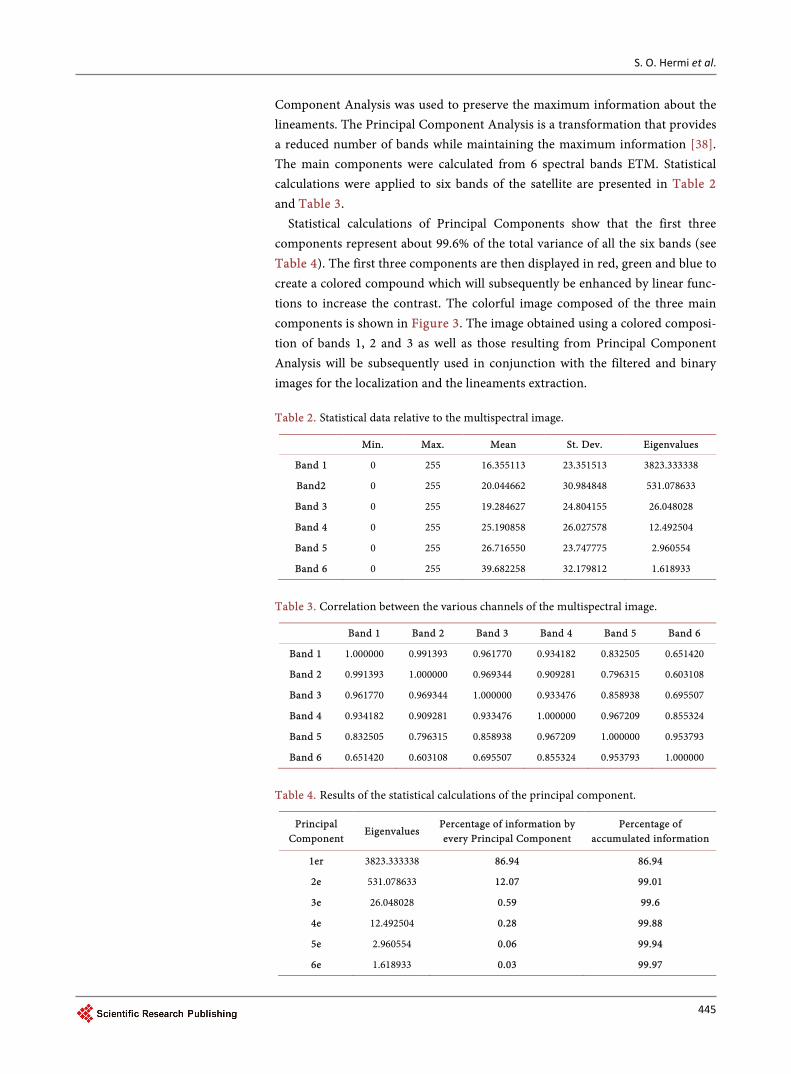
Statistical calculations of Principal Components show that the first three components represent about 99.6% of the total variance of all the six bands (see Table 4). The first three components are then displayed in red, green and blue to create a colored compound which will subsequently be enhanced by linear func-tions to increase the contrast. The colorful image composed of the three main components is shown in Figure 3. The image obtained using a colored composi-tion of bands 1, 2 and 3 as well as those resulting from Principal Component Analysis will be subsequently used in conjunction with the filtered and binary images for the localization and the lineaments extraction. Table 2. Statistical data relative to the multispectral image.
Min. Max. Mean St. Dev. Eigenvalues
Band 1 0 255 16.355113 23.351513 3823.333338
Band2 0 255 20.044662 30.984848 531.078633
Band 3 0 255 19.284627 24.804155 26.048028
Band 4 0 255 25.190858 26.027578 12.492504
Band 5 0 255 26.716550 23.747775 2.960554
Band 6 0 255 39.682258 32.179812 1.618933
Table 3. Correlation between the various channels of the multispectral image.
Band 1 Band 2 Band 3 Band 4 Band 5 Band 6
Band 1 1.000000 0.991393 0.961770 0.934182 0.832505 0.651420
Band 2 0.991393 1.000000 0.969344 0.909281 0.796315 0.603108
Band 3 0.961770 0.969344 1.000000 0.933476 0.858938 0.695507
Band 4 0.934182 0.909281 0.933476 1.000000 0.967209 0.855324
Band 5 0.832505 0.796315 0.858938 0.967209 1.000000 0.953793
Band 6 0.651420 0.603108 0.695507 0.855324 0.953793 1.000000
Table 4. Results of the statistical calculations of the principal component.
Principal Component
Eigenvalues Percentage of information by every Principal Component
Percentage of accumulated information
1er 3823.333338 86.94 86.94
2e 531.078633 12.07 99.01
3e 26.048028 0.59 99.6
4e 12.492504 0.28 99.88
5e 2.960554 0.06 99.94
6e 1.618933 0.03 99.97
S. O. Hermi et al.
446
Figure 3. Image in compound colored formed by the three first principal component.
2.3.3. Enchantement of Lineaments by Filtering The purpose of this step is to increase the visibility of lineaments. Various types of filtering are used in remote sensing. Grayscale filtering techniques can be used on remote sensing multispectral image to enhance or extract contours, for ho-mogenize areas disturbed by noise or to manipulate morphology shapes. These are local transformations of images, they operate on neighborhoods points.
1) Spatial Filtering Spatial filtering is a technique that aims to eliminate the noise contained in the
data; noise is defined as any non-useful data that masks information and that came from the acquisition system and external sources such as the atmosphere or the relief. This type of operation indicates discontinuities between textures re-flecting the morphostructural features, tectonic or contours.
2) Directional Filter of Sobel Directional filters enhance the lineaments perception causing an optical sha-
dow effect focused on the image as if it was illuminated by grazing light [39]. Moreover, these types of filter enhance detecting the lineaments which are not
favored by the illumination source [40]. The enhancement of lineaments was therefore made from directional filters using the Sobel operator. In this study the image used for the filtering is the one of the Principal Component Analysis combination. The Sobel filter is a selective variety of directional filters where the values of the convolution matrix are determined according to the distance from the central pixel. In other words, the more central points in the matrix (line or column) are involved greatly than the ones of the extreme parts in directional gradient measure [41]. It has been shown by [42] that the response of the pulse of this filter was relatively independent of the orientation of lineaments. It can detect both the lineaments vertically, horizontally and with a degree of 45˚ with
S. O. Hermi et al.
447
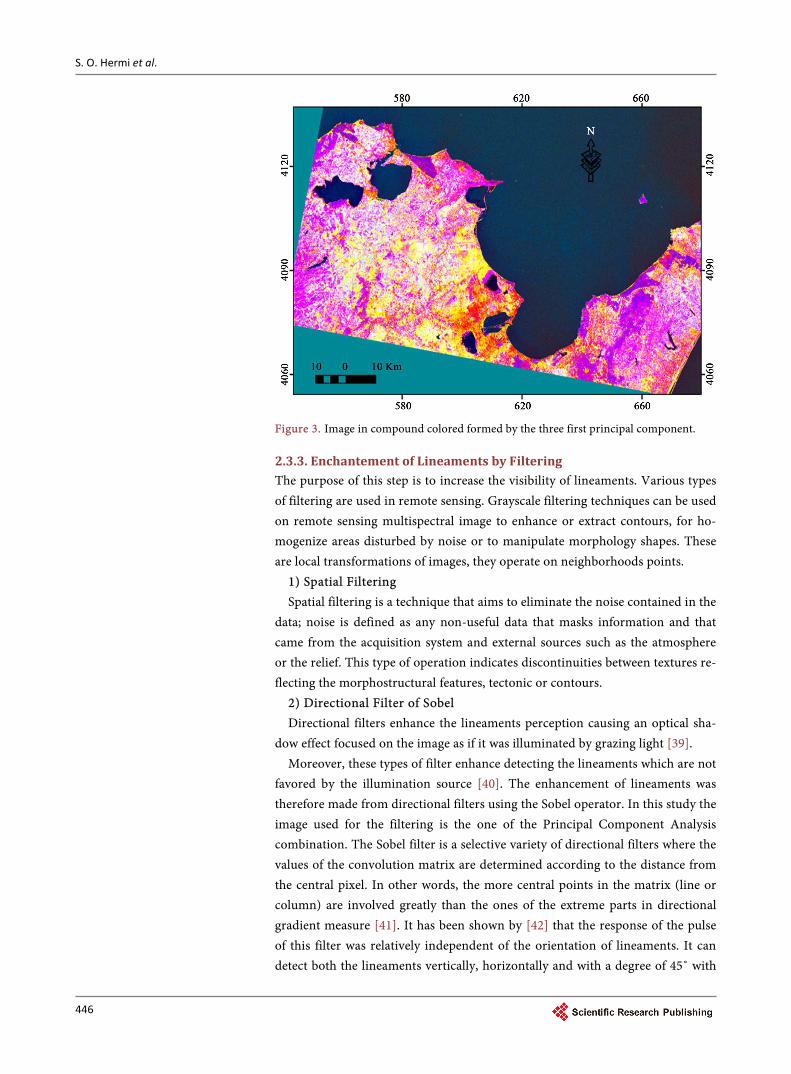
respect to the gradient filter. The size of the filters depends on the needs. Only the lineaments which the size is greater than half of the convolution window are detected [43]. In this study, a filter of 5 by 5 was used (Figure 4). A four derived images were generated (Figure 5) from four directional Sobel filters (NW, EW, SW and NS). This allows to detect lineaments in all possible directions.
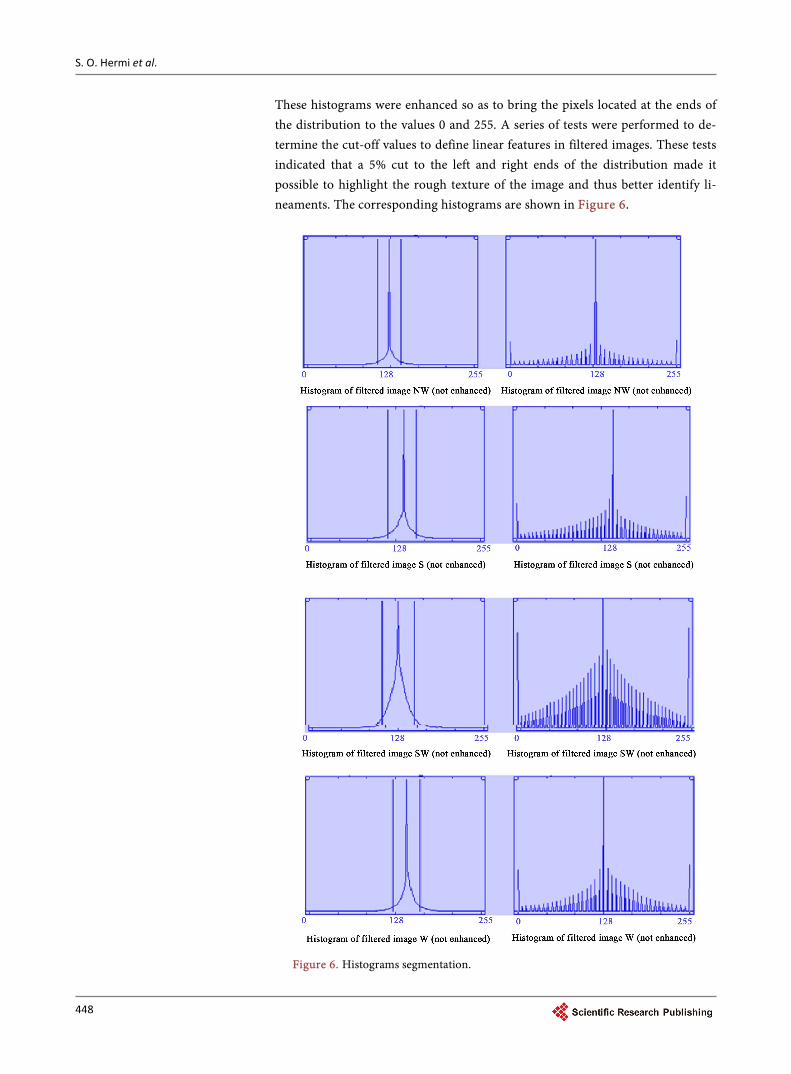
2.3.4. Histogram Segmentation The distribution histograms of the images obtained after directional filtering is in the form of normal curves divided into 2 parts. The first central portion represents the frequency of the pixels associated to homogeneous areas of the satellite image and corresponds to small changes in the gradient of the bright-ness. The second part, represented by the ends of the distribution corresponds to the frequency of pixels for which the filter has detected a strong transition gray level in the image (presence of lineaments). To identify the preferred orienta-tions in the study area, histograms were created from raw data of filtered images.
Figure 4. Directional filters sobel.
Figure 5. Binary images.
S. O. Hermi et al.
448
These histograms were enhanced so as to bring the pixels located at the ends of the distribution to the values 0 and 255. A series of tests were performed to de-termine the cut-off values to define linear features in filtered images. These tests indicated that a 5% cut to the left and right ends of the distribution made it possible to highlight the rough texture of the image and thus better identify li-neaments. The corresponding histograms are shown in Figure 6.
Figure 6. Histograms segmentation.

S. O. Hermi et al.
449
2.3.5. Binary Image Creation The images obtained after the Sobel filter applications had uniform values which manifested by visually shade of gray. The linéamentaires structures are thus confused in this gray background. Therefore, a “binarization” of images was made to optimize contrast by eliminating the hue and keep only elements de-tected by the Sobel filters. This approach has also been used by several research-ers to highlight the lineaments [37]. The test series showed that the 5% of thre-shold of the upper and lower section of the gray levels of the histogram represent significant limitations for creating binary image. The binary image is created by assigning the value 0 to the pixels for which the gradient is below the threshold and by assigning the value 255 to the other pixels of image. This gives us an im-age with two gray levels: Lineaments in black (0) and the background of the im-age in white (255). The binary images are shown in Figure 5.
3. Results 3.1. Lineaments Mapping
Sudden intensity variations on the Landsat image filtered emphasize the high spatial frequencies and are used to enhance the discontinuities in the images and therefore the mapping of linements.
All kinds of human activities generate an amount of linear phenomena mak-ing visual search of geological lineaments very difficult. These linear phenomena act as a noise masking geological information. In order to maintain the objectiv-ity of the process, no confrontation or checks are made with data from classical geology before treatment of four images has been completed. Once the operation is completed, the maps are displayed on a computer screen to confront the li-neaments layer with roads layer, with drainage network layer and with geological formations layer. Only visibly lineaments from artificial sources and lineaments of human parts are eliminated.
3.2. The Lineaments Map Analysis
The result of the processing of satellite images is a map showing 3454 lineaments with total length is 1713 km.
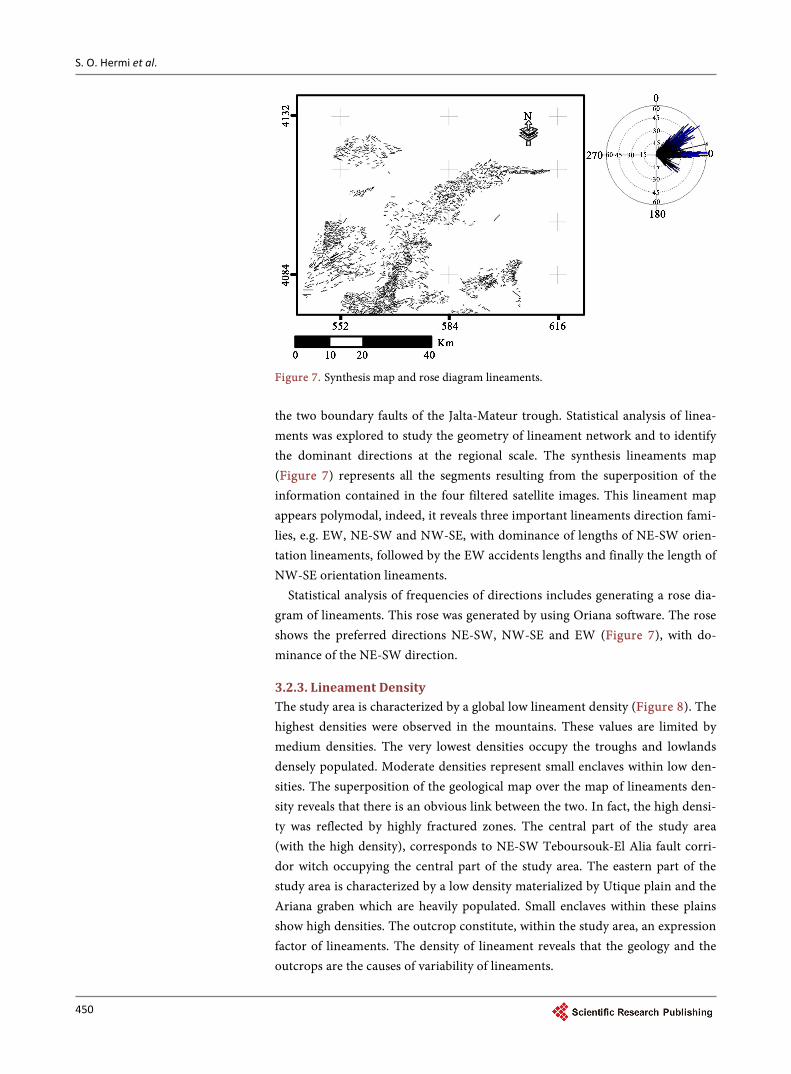
3.2.1. Visual Recognition By Visual analysis of lineaments map (Figure 7), all the lineaments presented an organization that not arbitrary. There are grouped into three directions, one in the NE-SW direction, the other in the direction nearly east-west and one in the NW-SE direction. A check with the geological map confirms that the various li-neaments directions are often congruent with faults and lithological contacts.
3.2.2. Lineaments Map Statistics It is very relevant to divide the geological map in the three directions that were described above. There have, NE-SW alignment of Jebel Sekkak, jebel Kechabta, Jebel Meseftine, El Alia and Raf Raf massif, EW alignment materialized largely by Jebel Amar and Jebel Nahli and finally the NW-SE alignment materialized by
S. O. Hermi et al.
450
Figure 7. Synthesis map and rose diagram lineaments. the two boundary faults of the Jalta-Mateur trough. Statistical analysis of linea-ments was explored to study the geometry of lineament network and to identify the dominant directions at the regional scale. The synthesis lineaments map (Figure 7) represents all the segments resulting from the superposition of the information contained in the four filtered satellite images. This lineament map appears polymodal, indeed, it reveals three important lineaments direction fami-lies, e.g. EW, NE-SW and NW-SE, with dominance of lengths of NE-SW orien-tation lineaments, followed by the EW accidents lengths and finally the length of NW-SE orientation lineaments.
Statistical analysis of frequencies of directions includes generating a rose dia-gram of lineaments. This rose was generated by using Oriana software. The rose shows the preferred directions NE-SW, NW-SE and EW (Figure 7), with do-minance of the NE-SW direction.
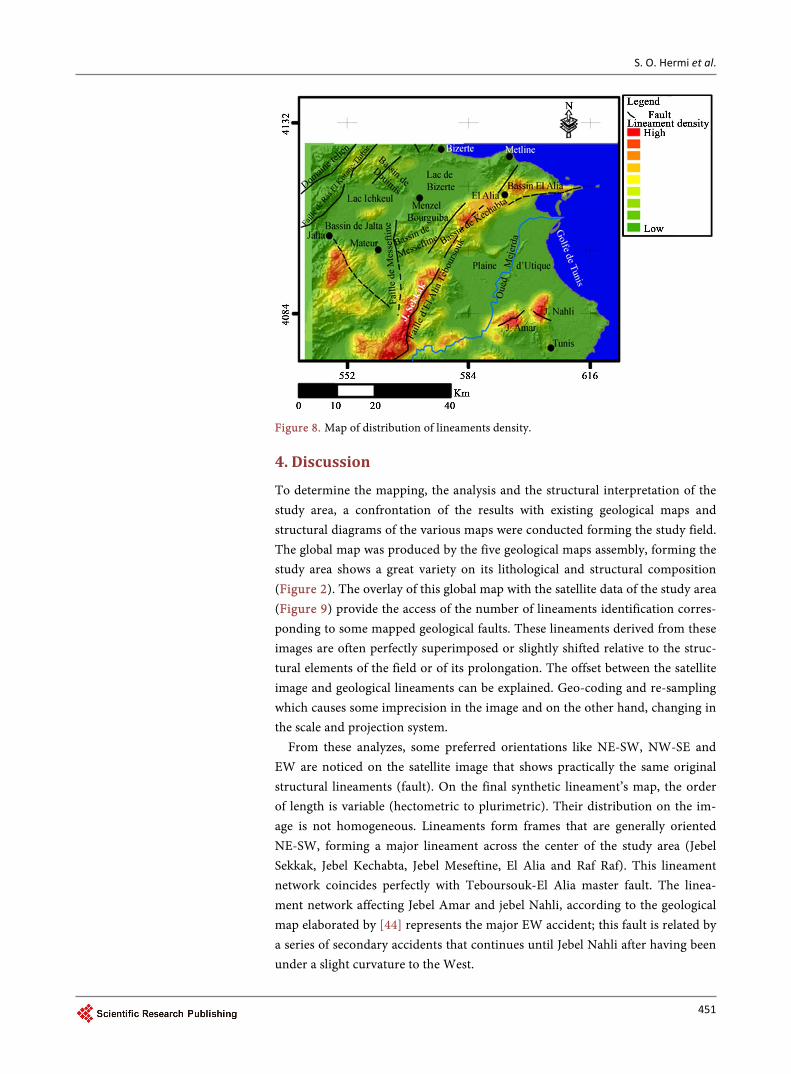
3.2.3. Lineament Density The study area is characterized by a global low lineament density (Figure 8). The highest densities were observed in the mountains. These values are limited by medium densities. The very lowest densities occupy the troughs and lowlands densely populated. Moderate densities represent small enclaves within low den-sities. The superposition of the geological map over the map of lineaments den-sity reveals that there is an obvious link between the two. In fact, the high densi-ty was reflected by highly fractured zones. The central part of the study area (with the high density), corresponds to NE-SW Teboursouk-El Alia fault corri-dor witch occupying the central part of the study area. The eastern part of the study area is characterized by a low density materialized by Utique plain and the Ariana graben which are heavily populated. Small enclaves within these plains show high densities. The outcrop constitute, within the study area, an expression factor of lineaments. The density of lineament reveals that the geology and the outcrops are the causes of variability of lineaments.
S. O. Hermi et al.
451
Figure 8. Map of distribution of lineaments density.
4. Discussion
To determine the mapping, the analysis and the structural interpretation of the study area, a confrontation of the results with existing geological maps and structural diagrams of the various maps were conducted forming the study field. The global map was produced by the five geological maps assembly, forming the study area shows a great variety on its lithological and structural composition (Figure 2). The overlay of this global map with the satellite data of the study area (Figure 9) provide the access of the number of lineaments identification corres-ponding to some mapped geological faults. These lineaments derived from these images are often perfectly superimposed or slightly shifted relative to the struc-tural elements of the field or of its prolongation. The offset between the satellite image and geological lineaments can be explained. Geo-coding and re-sampling which causes some imprecision in the image and on the other hand, changing in the scale and projection system.
From these analyzes, some preferred orientations like NE-SW, NW-SE and EW are noticed on the satellite image that shows practically the same original structural lineaments (fault). On the final synthetic lineament’s map, the order of length is variable (hectometric to plurimetric). Their distribution on the im-age is not homogeneous. Lineaments form frames that are generally oriented NE-SW, forming a major lineament across the center of the study area (Jebel Sekkak, Jebel Kechabta, Jebel Meseftine, El Alia and Raf Raf). This lineament network coincides perfectly with Teboursouk-El Alia master fault. The linea-ment network affecting Jebel Amar and jebel Nahli, according to the geological map elaborated by [44] represents the major EW accident; this fault is related by a series of secondary accidents that continues until Jebel Nahli after having been under a slight curvature to the West.

S. O. Hermi et al.
452
Figure 9. Synthesis map of lineaments superimposed over the geological map of the study area.
5. Conclusions
The pretreatment application techniques enhanced the radiometric images, and it becomes more expressive and more refined from a structural mapping. Several studies [45] showed that Landsat images contribute to the recognition of the discontinuous reservoirs and also to the mapping of major regional accidents. The simple methodological approach based on the use of directional filters (So-bel filter) and histograms segmentation has contributed to the development of a specific lineament map. A statistical analysis of these lineaments using direc-tional diagram rose showed a particular distribution of orientation according to the preferred direction NE-SW followed by these of EW to NW-SE. The con-frontation of these results with surface geological data (geological maps) shows that:
1) The lineaments in the satellite images have been identified and recognized in the field as faults.
2) The major part of the identified lineaments across the study area is related to deep faults in relation with large tectonic movements.
These results show the importance of lineament analysis in mapping of acci-dents in Septentrional Atlas of Tunisia.
References [1] Sulaksana, N. and Helman, A. (2014) The Analysis of Remote Sensing Imagery for
Predicting Structural Geology in Berau Basin East Kalimantan. International Jour-nal of Science and Research, 3, 18-21.
[2] Abdullah, A., Nassr, S. and Ghaleeb, A. (2013) Remote Sensing and Geographic In-formation System for Fault Segments Mapping a Study from Taiz Area, Yemen. Journal of Geological Research, 2013, Article ID: 201757.
[3] Papadaki, E.S., Mertikas, S.P. and Sarris, A. (2011) Identification of Lineaments
S. O. Hermi et al.
453
with Possible Structural Origin Using ASTER Images and DEM Derived Products in Western Crete, Greece. EARSeL eProceedings, 10, 10.
[4] Colwell, R.N., Ulaby, F.T., Simonett, D.S., Estes, J.E. and Thorley, G.A. (1983) Ma-nual of Remote Sensing, Vol. 2: Interpretation and Applications. 2nd Edition, American Society of Photogrammetry and Remote Sensing, 1728-1755, Sheridan Press, 2440 p.
[5] Drury, S.A. (1987) Image Interpretation in Geology. Kluwer Academic Publishers, 66-148.
[6] Caire, A. (1970) Tectonique de la Méditerranée centrale. Annales de la Société géo-logique du Nord, 307-346.
[7] Cohen, C.R. (1980) Plate Tectonic Model for the Oligocene-Miocene Evolution of the Western Mediterranean. Tectonophysics, 68, 283-311.
[8] Wildi, W. (1983) La chaîne tello-rifaine (Algérie, Maroc, Tunisie): Structure, Strati- Graphie et évolution du Trias au Miocène. Revue de Géologie dynamique et de Géographie Physique, 24, 201-297.
[9] Rehault, J.P., Boillot, G. and Mauffret, A. (1984) The Western Mediterranean Basin Geological Evolution. Marine Geology, 55, 447-477.
[10] Zargouni, F. (1985) Tectonique de l’Atlas méridional de Tunisie, évolution géométrique et cinématique des structures en zone de cisaillement. Thèse ès- Sciences, Université Louis Pasteur de Strasbourg.
[11] Dercourt, J., Zonenshain, L.P., Ricou, L.E., Kazmin, V.G., Le Pichon, X., Knipper, A.M., Grandjacquet, C., et al. (1986) The Geological Evolution of the Téthys Belt from Atlantic to Pamir since Liassic. Tectonophysics, 123, 241-315.
[12] Ben Ayed, N. (1993) Évolution tectonique de l’avant pays de la chaîne alpine de Tunisie du début Mésozoïque à l’Actuel. Annales des Mines et de Géologie, 32.
[13] Pepe, F., Sulli, A., Bertotti, G. and Catalano, R. (2005) Structural Highs Formation and Their Relationship to Sedimentary Basins in the North Sicily Continental Mar-gin (Southern Tyrrhenian Sea): Implication for the Drepano Thrust Front. Tecto-nophysics, 409, 1-18.
[14] Boukhalfa, K., Ben Ismail-Lattrache, K., Riahi, S., Soussi, M. and Khomsi, S. (2009) Analyse Biostratigraphique et sédimentologique des séries éo-oligocènes et mio- cènes de la Tunisie septentrionale: Implications stratigraphiques et géodynamiques. Comptes Rendus Geoscience, 341, 49-62.
[15] Riahi, S., Soussi, M., Boukhalfa, K., Ben Ismail Lattrache, K., Dorrik, S., Khomsi, S. and Bedir, M. (2010) Stratigraphy, Sedimentology and Structure of the Numidian Flysch Thrust Belt in Northern Tunisia. Journal of African Earth Sciences, 57, 109- 126.
[16] Kacem, J. (2004) Étude sismotectonique et évaluation de l’aléa sismique régional du Nord-Est de la Tunisie: Apport de la sismique réflexion dans l’identification des sources sismogéniques. Thèse de Doctorat, Université de Tunis El Manar, Tunisie.
[17] El Euch, N. (2007) Sédimentologie et stratigraphie séquentielle du Miocène moyen à supérieur de la Tunisie nord orientale (Cap Bon, bassin de Kechabta et Golfe de Tunis). Thèse de Doctorat, Université de Tunis-El Manar, Tunisie.
[18] Melki, F., Zouaghi, T., Ben Chelbi, M., Bédir, M. and Zargouni, F. (2009) Mesozoic and Cenozoic Tectono-Sedimentary Events and Geodynamic Evolution of the Al-pine Margin in the North-Eastern Tunisia Offshore (Gulf of Tunis) Using the Sub-surface Data. 4ème Congrès Maghrébin de Géophysique Appliquée, Hammamet, 26-28 Mars 2009.
[19] Melki, F., Zouaghi, T., Ben Chelbi, M., Bedir, M. and Zargouni, F. (2010) Tecto-
S. O. Hermi et al.
454
no-Sedimentary Events and Geodynamic Evolution of the Mesozoic and Cenozoic Basins of the Alpine Margin, Gulf of Tunis, North-Eastern Tunisia Offshore. Comptes Rendus Geoscience, 342, 741-753.
[20] Zouaghi, T., Bédir, M., Melki, F., Gabtni, H., Gharsalli, R., Bessioud, A. and Zargouni, F. (2010) Neogene Sediment Deformations and Tectonic Features of Northeastern Tunisia: Evidence for Paleoseismicity. Arabian Journal of Geos-ciences, 4, 1301-1314.
[21] Ben Ayed, N. (1986) Evolution tectonique de l’avant pays de la chaîne alpine de Tunisie du début du Mésozoïque à l’Actuel. Thèse Doctorat d’Etat, Université de Paris Sud, Paris.
[22] Chihi, L. (1995) Les fossés néogènes à quaternaires de la Tunisie et de la mer pélagienne: Etude structurale et leur signification dans le cadre géodynamique de la Méditerranée centrale. Thèse Doctorat Ès Science Géologique, Université de Tunis El Manar, Tunisie.
[23] Dlala, M. (1995) Evolution géodynamique et tectoniques superposes en Tunisie: Sur l’implication tectonique récente et la sismicité. Thèse d’Etat, Université de Tunis El Manar, Tunisie.
[24] Tanguay, M.G. and Seuthé, C. (1983) Base d’un guide d’utilisation des images Landsat en géologie. 8ème Symposium canadien de télédétection et au 4ème Congrès de L’Association québécoise de télédétection, Montréal, 3-6 Mai 1983.
[25] Sabins, F.F. (1986) Remote Sensing Principles and Interpretation. Waveland Pr Inc., New York.
[26] Russ, J.C. (1995) The Image Processing Handbook. CRC Press, Boca Raton.
[27] Chatterjee, R.S., Roy, J. and Bhattacharya, A.K. (1996) Mapping Geological Features of the Jharia Coalfield from Landsat-5 TM Data. International Journal of Remote Sensing, 17, 3257-3270. https://doi.org/10.1080/01431169608949142
[28] Lord, J., Oliver, G.H.J. and Soulsby, J.A. (1996) Landsat MSS Imagery of a Lower Cretaceous Regional Dyke Swarm, Damaraland, Namibia: A Precursor to the Split-ting of Western Gondwana. International Journal of Remote Sensing, 17, 2945- 2954. https://doi.org/10.1080/01431169608949120
[29] Arlegui, L.E. and Soriano, M.A. (1998) Characterizing Lineaments from Satellite Images and Field Studies in the Central Ebro Basin (NE Spain). International Jour-nal of Remote Sensing, 19, 3169-3185. https://doi.org/10.1080/014311698214244
[30] Budkewitsch, P., Newton, G. and Hynes, A.J. (1994) Characterization and Extrac-tion of Linear Features from Digital Images. Journal Canadien de télédétection, 20, 268-279.
[31] Moore, G.K. and Waltz, F.A. (1983) Objective Procedure for Lineament Enhance-ment and Extraction. Photogrammetric engineering and Remote Sensing, 49, 641-647.
[32] Mah, A., Taylor, G.R., Lennox, P. and Balia, L. (1995) Lineament Analysis of Land-sat Thematic Mapper Images, Northern Territory, Australia. Photogrammetric en-gineering and Remote Sensing, 61, 761-773.
[33] Babu Madhavan, B., Venkatararnan, G., Shah, S.D. and Krishna Mohan, B. (1997) Revealing the Geology of the Great Nicobar Island, Indian Ocean, by the Interpreta-tion of Airborne Synthetic Aperture Radar Images. International Journal of Remote Sensing, 18, 2723-2742. https://doi.org/10.1080/014311697217305
[34] Mostafa, M.E. and Zakir, F.A. (1996) New Enhancement Techniques for Azimuthal Analysis of Linearnents for Detecting Tectonic Trends in and around the Afro-

S. O. Hermi et al.
455
Arabian Shield. International Journal of Remote Sensing, 17, 2923-2943. https://doi.org/10.1080/01431169608949119
[35] Karpuz, M.R., Roberts, D., Olesen, O., Gabrielsen, R.H. and Herrevold, T. (1993) Application of Multiple Data Sets to Structural Studies on Varanger Peninsula, Northern Norway. International Journal of Remote Sensing, 14, 979-1003. https://doi.org/10.1080/01431169308904390
[36] Biémi, J., Gwyn, Q.H.J., Deslandes, S. and Jourda, P. (1991) Géologie et réseaux de linéarnents, région du bassin versant de la Marahoué, Côte d’Ivoire: Cartographie à l’aide des données Landsat-TM et du champ magnétique total. In: Gagnon, P., Ed., Télédétection et gestion des ressources, Vol. 7, Association québécoise de télédé- tection, 134-145.
[37] Deslandes, S. and Gwyn, Q.H.J. (1991) Évaluation de Spot et Seasat pour la cartographie des linéaments: Comparaison basée sur l’analyse de spectre de Fourier. Journal canadien de télédétection, 17, 98-110.
[38] Daultrey, S. (1976) Principal Components Analysis. Geo Abstracts Ltd., Norwich.
[39] Marion, A. (1987) Introduction aux techniques de traitement d’image. Eyrolles, Paris.
[40] Drury, S.A. (1986) Remote Sensing of Geological Structure in Temperate Agricul-tural Terrain. Geological Magazine, 123, 113-121. https://doi.org/10.1017/S0016756800029770
[41] Deslandes, S. (1986) Évaluation des images Spot et Seasat pour la cartographie des linéaments du secteur des Monts Stoke, au Québec une comparaison basée sur l’analyse du spectre de Foumer. Mémoire de maîtrise, Université de Sherbrooke.
[42] Abdou, L.E. and Pratt, W.K. (1979) Quantitative Design and Evaluation of En-hancement/Thresholding Edge Detectors. Proceeding of the Institute of Electrical and Electronics Engineers, 67, 753-763. https://doi.org/10.1109/PROC.1979.11325
[43] Colwell, R. (1983) Manual of Remote Sensing. Vol. 1 and 2. American Society of Photogrammetry and Remote Sensing, Falls Church.
[44] Jauzein, A. (1967) Contribution à l’étude géologique des confins de la dorsale tunisienne (Tunisie Septentrionale). Thèse ès Sciences-Annales des Mines et de Géologie, Tunis.
[45] Savané, I. (1997) Contribution à l’étude géologique et hy-drogéologique des aquifères discontinus du socle cristallin d’Odienné (Nord-Ouest de la Côte d’Ivoire) Apport de la Télédétection et d’un système d’information hydrogéolo-gique à référence spatiale. Thèse Université de Cocody, Abidjan.

Submit or recommend next manuscript to SCIRP and we will provide best service for you:
Accepting pre-submission inquiries through Email, Facebook, LinkedIn, Twitter, etc. A wide selection of journals (inclusive of 9 subjects, more than 200 journals) Providing 24-hour high-quality service User-friendly online submission system Fair and swift peer-review system Efficient typesetting and proofreading procedure Display of the result of downloads and visits, as well as the number of cited articles Maximum dissemination of your research work
Submit your manuscript at: http://papersubmission.scirp.org/ Or contact [email protected]


![REVIEW OF IMAGE ENHANCEMENT … ENHANCEMENT USING HISTOGRAM EQUALIZATION Histogram equalization [11] is a common technique for enhancing the appearance of images. Suppose we have an](https://static.fdocuments.in/doc/165x107/5cccf48b88c9932b558cddc3/review-of-image-enhancement-enhancement-using-histogram-equalization-histogram-equalization.jpg)


