Structural Integrity of the Contralesional Hemisphere ...
11
Structural Integrity of the Contralesional Hemisphere Predicts Cognitive Impairment in Ischemic Stroke at Three Months Rosalia Dacosta-Aguayo 2 , Manuel Gran ˜a 2 , Marina Ferna ´ ndez-Andu ´ jar 1,4 , Elena Lo ´ pez-Cancio 3 , Cynthia Ca ´ ceres 3 , Nu ´ ria Bargallo ´ 5,6 , Maite Barrios 7 , Immaculada Clemente 1,4 , Pere Toran Monserrat 9 , Maite Alzamora Sas 9 , Antoni Da ´ valos 3 , Tibor Auer 8. , Maria Mataro ´ 1,4 * . 1 Department of Psychiatry and Clinical Psychobiology, University of Barcelona, Barcelona, Spain, 2 Group of Computational Intelligence, University of the Basque Country UPV/EHU, San Sebastian, Spain, 3 Department of Neurosciences, Hospital Germans Trias i Pujol, Universitat Auto ` noma de Barcelona, Barcelona, Spain, 4 Institute for Brain, Cognition and Behaviour (IR3C), Barcelona, Spain, 5 Diagnostic Center for Image, Clinic Hospital, Barcelona, Spain, 6 Imatge Platform of IDIBAPS, Barcelona, Spain, 7 Department of Methodology of Behavioral Sciences, University of Barcelona, Spain, 8 MRC Cognition and Brain Sciences Unit, Cambridge, England, 9 Primary Healthcare Research Support Unit Metropolitana Nord, Institut Universitari d’Investigacio ´ en Atencio ´ Prima `ria (2IDIAP) Jordi Gol, Santa Coloma de Gramenet, Spain Abstract After stroke, white matter integrity can be affected both locally and distally to the primary lesion location. It has been shown that tract disruption in mirror’s regions of the contralateral hemisphere is associated with degree of functional impairment. Fourteen patients suffering right hemispheric focal stroke (S) and eighteen healthy controls (HC) underwent Diffusion Weighted Imaging (DWI) and neuropsychological assessment. The stroke patient group was divided into poor (SP; n = 8) and good (SG; n = 6) cognitive recovery groups according to their cognitive improvement from the acute phase (72 hours after stroke) to the subacute phase (3 months post-stroke). Whole-brain DWI data analysis was performed by computing Diffusion Tensor Imaging (DTI) followed by Tract Based Spatial Statistics (TBSS). Assessment of effects was obtained computing the correlation of the projections on TBSS skeleton of Fractional Anisotropy (FA) and Radial Diffusivity (RD) with cognitive test results. Significant decrease of FA was found only in right brain anatomical areas for the S group when compared to the HC group. Analyzed separately, stroke patients with poor cognitive recovery showed additional significant FA decrease in several left hemisphere regions; whereas SG patients showed significant decrease only in the left genu of corpus callosum when compared to the HC. For the SG group, whole brain analysis revealed significant correlation between the performance in the Semantic Fluency test and the FA in the right hemisphere as well as between the performance in the Grooved Pegboard Test (GPT) and theTrail Making Test-part A and the FA in the left hemisphere. For the SP group, correlation analysis revealed significant correlation between the performance in the GPT and the FA in the right hemisphere. Citation: Dacosta-Aguayo R, Gran ˜ a M, Ferna ´ndez-Andu ´jar M, Lo ´ pez-Cancio E, Ca ´ceres C, et al. (2014) Structural Integrity of the Contralesional Hemisphere Predicts Cognitive Impairment in Ischemic Stroke at Three Months. PLoS ONE 9(1): e86119. doi:10.1371/journal.pone.0086119 Editor: Thiruma V. Arumugam, National University of Singapore, Singapore Received September 18, 2013; Accepted December 10, 2013; Published January 24, 2014 Copyright: ß 2014 Dacosta-Aguayo et al. This is an open-access article distributed under the terms of the Creative Commons Attribution License, which permits unrestricted use, distribution, and reproduction in any medium, provided the original author and source are credited. Funding: This project has been made possible primarily through the efforts of the authors’ recruited patients and healthy controls participants who voluntarily accepted to enroll in this project. This study was supported by the grants PSI2009-11519 to MM, the grant Formacio ´ Personal Investigador (FPI), BES-2010-031833 to MF from the Ministry of Science and Innovation (MICINN), grant TIN2011-23823 from the Ministry of Economy and Competitiveness (MINECO) and UFI 11/07 to MG, Spain. The funders had no role in study design, data collection and analysis, decision to publish, or preparation of the manuscript. Competing Interests: The authors have declared that no competing interests exist. * E-mail: [email protected] . These authors contributed equally to this work. Introduction Stroke and cerebrovascular disease is a major cause of mortality and disability worldwide [1]. Approximately 64% of patients who have experienced stroke have some degree of cognitive impair- ment and up to a third of them develop dementia [2]. With cerebral ischemia, reductions in cerebral blood flow disrupt energy metabolism resulting in perturbation of ionic pumps and disruption of ionic homeostasis [3]. Cytotoxic edema occurrence produces both a decrease in the extracellular volume fraction and changes in membrane permeability [4]. These events reduce white matter (WM) integrity locally, at the primary lesion location, due to tissue damage or remotely as a consequence of anterograde Wallerian (WD) and/or retrograde axonal degener- ation [5]. Furthermore, reduced WM integrity has been found to be associated with cognitive impairment [6,7,8]. The role of the non-injured hemisphere in stroke recovery is still controversial. Some imaging studies suggest that contralesional functional networks are significantly involved in post-stroke functional recovery [33,71]; although the interpretation of the results regarding to their positive or negative implication in patient’s recovery is disputed (for a review of the literature see 71). At a structural level, some diffusion tensor imaging (DTI) studies report increased anisotropy in the contralesional hemisphere (e.g. thalamus) after stroke [24,25], structural remodeling in ipsilateral and contralesional corticospinal tracts [25] and changes in the number of neural pathways in areas both ipsilateral and contralateral to the stroke [34]. Studies of tract’s fractional PLOS ONE | www.plosone.org 1 January 2014 | Volume 9 | Issue 1 | e86119
Transcript of Structural Integrity of the Contralesional Hemisphere ...

Structural Integrity of the Contralesional HemispherePredicts Cognitive Impairment in Ischemic Stroke atThree MonthsRosalia Dacosta-Aguayo2, Manuel Grana2, Marina Fernandez-Andujar1,4, Elena Lopez-Cancio3,
Cynthia Caceres3, Nuria Bargallo5,6, Maite Barrios7, Immaculada Clemente1,4, Pere Toran Monserrat9,
Maite Alzamora Sas9, Antoni Davalos3, Tibor Auer8., Maria Mataro1,4*.
1Department of Psychiatry and Clinical Psychobiology, University of Barcelona, Barcelona, Spain, 2Group of Computational Intelligence, University of the Basque Country
UPV/EHU, San Sebastian, Spain, 3Department of Neurosciences, Hospital Germans Trias i Pujol, Universitat Autonoma de Barcelona, Barcelona, Spain, 4 Institute for Brain,
Cognition and Behaviour (IR3C), Barcelona, Spain, 5Diagnostic Center for Image, Clinic Hospital, Barcelona, Spain, 6 Imatge Platform of IDIBAPS, Barcelona, Spain,
7Department of Methodology of Behavioral Sciences, University of Barcelona, Spain, 8MRC Cognition and Brain Sciences Unit, Cambridge, England, 9 Primary Healthcare
Research Support Unit Metropolitana Nord, Institut Universitari d’Investigacio en Atencio Primaria (2IDIAP) Jordi Gol, Santa Coloma de Gramenet, Spain
Abstract
After stroke, white matter integrity can be affected both locally and distally to the primary lesion location. It has been shownthat tract disruption in mirror’s regions of the contralateral hemisphere is associated with degree of functional impairment.Fourteen patients suffering right hemispheric focal stroke (S) and eighteen healthy controls (HC) underwent DiffusionWeighted Imaging (DWI) and neuropsychological assessment. The stroke patient group was divided into poor (SP; n = 8)and good (SG; n = 6) cognitive recovery groups according to their cognitive improvement from the acute phase (72 hoursafter stroke) to the subacute phase (3 months post-stroke). Whole-brain DWI data analysis was performed by computingDiffusion Tensor Imaging (DTI) followed by Tract Based Spatial Statistics (TBSS). Assessment of effects was obtainedcomputing the correlation of the projections on TBSS skeleton of Fractional Anisotropy (FA) and Radial Diffusivity (RD) withcognitive test results. Significant decrease of FA was found only in right brain anatomical areas for the S group whencompared to the HC group. Analyzed separately, stroke patients with poor cognitive recovery showed additional significantFA decrease in several left hemisphere regions; whereas SG patients showed significant decrease only in the left genu ofcorpus callosum when compared to the HC. For the SG group, whole brain analysis revealed significant correlation betweenthe performance in the Semantic Fluency test and the FA in the right hemisphere as well as between the performance in theGrooved Pegboard Test (GPT) and theTrail Making Test-part A and the FA in the left hemisphere. For the SP group,correlation analysis revealed significant correlation between the performance in the GPT and the FA in the right hemisphere.
Citation: Dacosta-Aguayo R, Grana M, Fernandez-Andujar M, Lopez-Cancio E, Caceres C, et al. (2014) Structural Integrity of the Contralesional HemispherePredicts Cognitive Impairment in Ischemic Stroke at Three Months. PLoS ONE 9(1): e86119. doi:10.1371/journal.pone.0086119
Editor: Thiruma V. Arumugam, National University of Singapore, Singapore
Received September 18, 2013; Accepted December 10, 2013; Published January 24, 2014
Copyright: � 2014 Dacosta-Aguayo et al. This is an open-access article distributed under the terms of the Creative Commons Attribution License, which permitsunrestricted use, distribution, and reproduction in any medium, provided the original author and source are credited.
Funding: This project has been made possible primarily through the efforts of the authors’ recruited patients and healthy controls participants who voluntarilyaccepted to enroll in this project. This study was supported by the grants PSI2009-11519 to MM, the grant Formacio Personal Investigador (FPI), BES-2010-031833to MF from the Ministry of Science and Innovation (MICINN), grant TIN2011-23823 from the Ministry of Economy and Competitiveness (MINECO) and UFI 11/07 toMG, Spain. The funders had no role in study design, data collection and analysis, decision to publish, or preparation of the manuscript.
Competing Interests: The authors have declared that no competing interests exist.
* E-mail: [email protected]
. These authors contributed equally to this work.
Introduction
Stroke and cerebrovascular disease is a major cause of mortality
and disability worldwide [1]. Approximately 64% of patients who
have experienced stroke have some degree of cognitive impair-
ment and up to a third of them develop dementia [2].
With cerebral ischemia, reductions in cerebral blood flow
disrupt energy metabolism resulting in perturbation of ionic
pumps and disruption of ionic homeostasis [3]. Cytotoxic edema
occurrence produces both a decrease in the extracellular volume
fraction and changes in membrane permeability [4]. These events
reduce white matter (WM) integrity locally, at the primary lesion
location, due to tissue damage or remotely as a consequence of
anterograde Wallerian (WD) and/or retrograde axonal degener-
ation [5]. Furthermore, reduced WM integrity has been found to
be associated with cognitive impairment [6,7,8].
The role of the non-injured hemisphere in stroke recovery is still
controversial. Some imaging studies suggest that contralesional
functional networks are significantly involved in post-stroke
functional recovery [33,71]; although the interpretation of the
results regarding to their positive or negative implication in
patient’s recovery is disputed (for a review of the literature see 71).
At a structural level, some diffusion tensor imaging (DTI) studies
report increased anisotropy in the contralesional hemisphere (e.g.
thalamus) after stroke [24,25], structural remodeling in ipsilateral
and contralesional corticospinal tracts [25] and changes in the
number of neural pathways in areas both ipsilateral and
contralateral to the stroke [34]. Studies of tract’s fractional
PLOS ONE | www.plosone.org 1 January 2014 | Volume 9 | Issue 1 | e86119

anisotropy (FA) asymmetries have concluded that the contrale-
sional corticospinal tract may play a role in motor recovery after
unilateral stroke [72,73,74,23].
Animal studies of ischemic stroke often use FA to study the
temporal evolution of WM changes [9,10,11,12]. From these
studies it has been established that disruption of the brain tissue
microstructure results in a significant reduction in the FA during
the subacute and chronic phases of cerebral ischemia. Human
studies usually use FA [13,14,15,16] and Mean Diffusivity (MD)
[17,18,19] to study the recovery of the injured brain over time.
Regarding FA values, microstructural integrity of normal-appear-
ing WM improves during 1 and 2 years following ischemic stroke,
achieving subsequent stabilization [14].
Animal studies suggest that structural remodeling of WM in
both the ipsilesional and contralesional hemispheres plays a role in
motor recovery [20,21,22,23]. On the other hand, DTI studies of
stroke patients have demonstrated that reduced contralesional
WM integrity of the corticospinal tract in chronic stroke [24] is
associated with poorer motor skill recovery [25] in stroke patients
compared to patients with better motor recovery and healthy
controls (HC) [25]. In these studies, larger interhemispheric
asymmetries in FA for this anatomical region have been associated
with reduced motor recovery [26,27,28,29], reduced skill im-
provement in response to training [30] as well as motor
dysfunction after stroke [27,31]. Although plastic changes in the
contralesional hemisphere have already proved to play a role in
stroke recovery [32,33,25,34], this role remains still unclear from a
cognitive point of view.
Prior work suggests that DTI may provide information about
different pathophysiological processes and may be one of the most
sensitive neuroimaging biomarkers of vascular damage
[35,36,37,8]. Although, FA is the most widely studied diffusion
metric, there is a growing interest in investigating WM micro-
structural mechanism underlying the FA change by analyzing
other – more direct – diffusion metrics, such as axial (AD) and
radial (RD) diffusivity. A recent study identified RD and AD
decrease accompanying FA increase in areas surrounding the
anterior cingulate cortex after 4-week integrative body-mind
training, a form of mindfulness meditation [38]. Reduction in
RD is usually interpreted as improved myelination, whereas
reduction in AD is associated with axon morphological changes,
such as changes in axonal density or caliber [39,40].
The objectives of the study in this paper were: 1) to evaluate the
effects of right hemispheric stroke on left hemispheric WM; 2) to
investigate the microstructural mechanism underlying the eventual
WM change 3) to assess their effect on cognitive recovery of stroke
patients at three months after stroke. We test the following
hypothesis: a) Stroke patients with poor cognitive recovery will
show more widespread WM disruption in the contralesional (left)
hemisphere; b) Stroke patients with good cognitive recovery will
have better contralesional FA integrity; c) The better contrale-
sional WM integrity will be related to the cognitive performance of
stroke patients with good cognitive recovery. To address these
questions we used a hypothesis-driven TBSS approach.
Materials and Methods
1.1. SubjectsThis is a prospective and longitudinal study that included a
group of consecutive ischemic stroke patients (S) admitted at the
Stroke Unit at the Germans Trias i Pujol Hospital from August
2008 to May 2012 and a group of healthy controls (HC). Stroke
patients underwent a complete neuropsychological assessment in
the acute phase (first 72 hours), and another at three months when
the DTI study was performed. In the control group, cognitive
assessment and DTI were performed in the same day.
Potential participants were included in the study if they had 1)
First territorial ischemic stroke in the territory of middle, anterior
or posterior cerebral arteries (MCA, ACA, PCA); 2) modified
Rankin Scale (mRS) score of 0 and Barthel score of 100 before
admission; 3) Age in the range between 40 and 75 years; 4)
Absence of severe aphasia (fourteenth scoring item of National
Institute of Health Stroke Scale (NIHSS) #1); 5) Absence of
alcohol or drug abuse, psychiatric comorbidities, or severe visual
or hearing loss; 6) Absence of contraindications to undergo MRI
or severe claustrophobia.
From the 30 patients included in the study, we chose patients
with right hemisphere stroke (n = 17), from which 3 were discarded
due to acquisition problems (n = 1), and because the lesion volume
fell outside 1.5 times the interquartile range (n = 2). The final study
sample comprised 14 patients.
Table 1. Demographical and Clinical data.
HC (n=18) SG (n=6) SP (n =8) HC - SG HC - SP SG - SP
Sociodemographic Factors p p p
Age (years) 63 (60.75–67) 58.67611.021 66.5066.370 0.867 0.155 0.172
Women 7 (38.9%) 1 (16.7%) 2 (25%) 0.319 0.413 0.615
Education (years) 7.3364.087 9.5063.728 865.904 0.264 0.741 0.597
Vocabulary subtest 37.7867.856 36.83612.024 33.86610.976 0.825 0.326 0.650
Edinburgh Test 95.56613.492 96.6765.164 99.3861.768 0.452 0.723 0.280
Vascular Risk Factors
Hypertension 8 (44.4%) 3 (50%) 5 (62.5%) 0.590 0.223 0.413
Dyslipidemia 9 (50%) 3 (50%) 4 (50%) 0.680 0.664 0.704
Diabetes Mellitus 1 (5.6%) 2 (33.3%) 4 (50%) 0.143 0.020 0.471
Smoking 6 (33.3%) 1 (16.7%) 2 (25%) 0.414 0.607 0.563
Alcohol intake 9 (50%) 1 (16.7%) 4 (50%) 0.171 0.664 0.238
Values are means 6 standard deviations in Student’s t-test or medians (interquartile range) in Mann-Whitney test for continuous variables. Values are n (%) forcategorical variables in Chi-square test and Fisher’s exact test. p shows statistical comparison between groups.doi:10.1371/journal.pone.0086119.t001
Stroke, Diffusion Tensor Imaging, Recovery
PLOS ONE | www.plosone.org 2 January 2014 | Volume 9 | Issue 1 | e86119
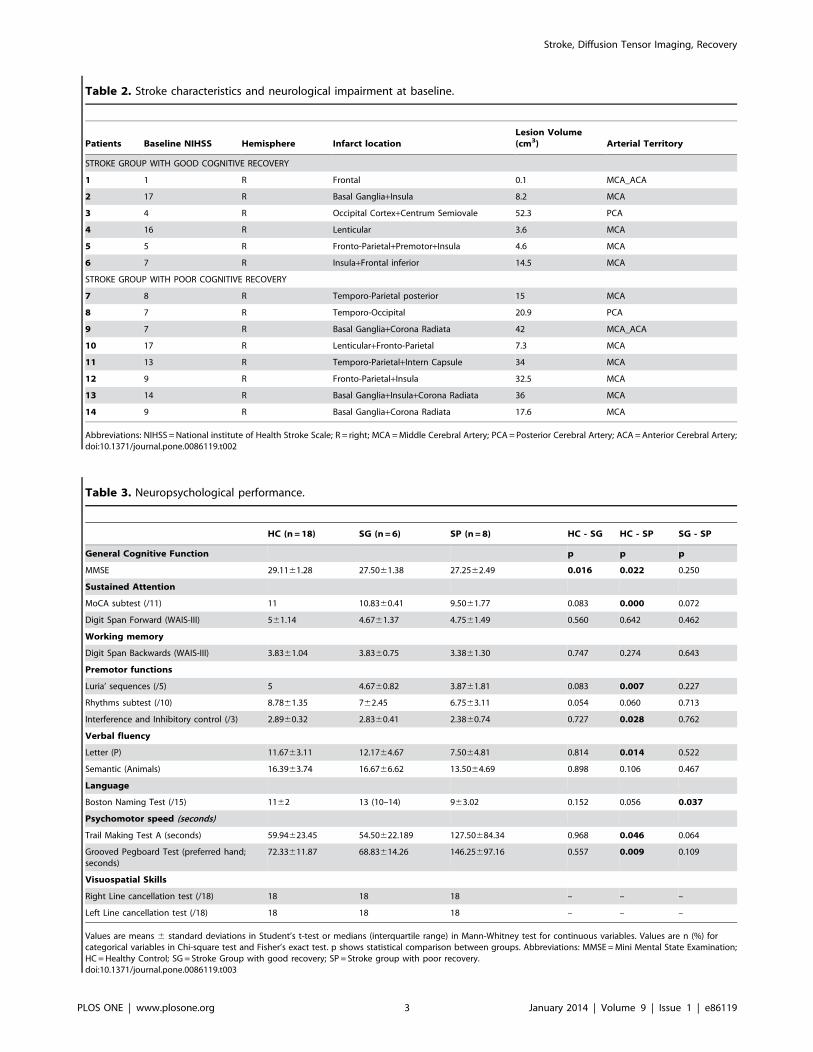
Table 2. Stroke characteristics and neurological impairment at baseline.
Patients Baseline NIHSS Hemisphere Infarct locationLesion Volume(cm3) Arterial Territory
STROKE GROUP WITH GOOD COGNITIVE RECOVERY
1 1 R Frontal 0.1 MCA_ACA
2 17 R Basal Ganglia+Insula 8.2 MCA
3 4 R Occipital Cortex+Centrum Semiovale 52.3 PCA
4 16 R Lenticular 3.6 MCA
5 5 R Fronto-Parietal+Premotor+Insula 4.6 MCA
6 7 R Insula+Frontal inferior 14.5 MCA
STROKE GROUP WITH POOR COGNITIVE RECOVERY
7 8 R Temporo-Parietal posterior 15 MCA
8 7 R Temporo-Occipital 20.9 PCA
9 7 R Basal Ganglia+Corona Radiata 42 MCA_ACA
10 17 R Lenticular+Fronto-Parietal 7.3 MCA
11 13 R Temporo-Parietal+Intern Capsule 34 MCA
12 9 R Fronto-Parietal+Insula 32.5 MCA
13 14 R Basal Ganglia+Insula+Corona Radiata 36 MCA
14 9 R Basal Ganglia+Corona Radiata 17.6 MCA
Abbreviations: NIHSS =National institute of Health Stroke Scale; R = right; MCA=Middle Cerebral Artery; PCA= Posterior Cerebral Artery; ACA=Anterior Cerebral Artery;doi:10.1371/journal.pone.0086119.t002
Table 3. Neuropsychological performance.
HC (n=18) SG (n=6) SP (n=8) HC - SG HC - SP SG - SP
General Cognitive Function p p p
MMSE 29.1161.28 27.5061.38 27.2562.49 0.016 0.022 0.250
Sustained Attention
MoCA subtest (/11) 11 10.8360.41 9.5061.77 0.083 0.000 0.072
Digit Span Forward (WAIS-III) 561.14 4.6761.37 4.7561.49 0.560 0.642 0.462
Working memory
Digit Span Backwards (WAIS-III) 3.8361.04 3.8360.75 3.3861.30 0.747 0.274 0.643
Premotor functions
Luria’ sequences (/5) 5 4.6760.82 3.8761.81 0.083 0.007 0.227
Rhythms subtest (/10) 8.7861.35 762.45 6.7563.11 0.054 0.060 0.713
Interference and Inhibitory control (/3) 2.8960.32 2.8360.41 2.3860.74 0.727 0.028 0.762
Verbal fluency
Letter (P) 11.6763.11 12.1764.67 7.5064.81 0.814 0.014 0.522
Semantic (Animals) 16.3963.74 16.6766.62 13.5064.69 0.898 0.106 0.467
Language
Boston Naming Test (/15) 1162 13 (10–14) 963.02 0.152 0.056 0.037
Psychomotor speed (seconds)
Trail Making Test A (seconds) 59.94623.45 54.50622.189 127.50684.34 0.968 0.046 0.064
Grooved Pegboard Test (preferred hand;seconds)
72.33611.87 68.83614.26 146.25697.16 0.557 0.009 0.109
Visuospatial Skills
Right Line cancellation test (/18) 18 18 18 – – –
Left Line cancellation test (/18) 18 18 18 – – –
Values are means 6 standard deviations in Student’s t-test or medians (interquartile range) in Mann-Whitney test for continuous variables. Values are n (%) forcategorical variables in Chi-square test and Fisher’s exact test. p shows statistical comparison between groups. Abbreviations: MMSE =Mini Mental State Examination;HC=Healthy Control; SG = Stroke Group with good recovery; SP = Stroke group with poor recovery.doi:10.1371/journal.pone.0086119.t003
Stroke, Diffusion Tensor Imaging, Recovery
PLOS ONE | www.plosone.org 3 January 2014 | Volume 9 | Issue 1 | e86119

Eighteen healthy volunteers from the Barcelona-Asymptomatic
Intracranial Atherosclerosis (AsIA) study [41,42] matched by age,
sex, education, and handedness with the stroke patients were
recruited as the control group. None of them had a previous
history of neurological or psychiatric diseases and brain scans were
reported as normal. Information on demographical characteristics
and vascular risk factors were collected in each patient based on
their medical history.
The study was approved by the institutional ethics committee
(Comissio de Bioetica de la Universitat de Barcelona (CBUB);
Institutional Review Board (IRB) 00003099 Assurance number:
FWA00004225; http://www.edu/recerca/comissiobioetica.htm
and the research was conducted in accordance with the Helsinki
Declaration. Written informed consent was obtained from each
participant prior to taking part in the study.
1.2. Measurement of Cognitive Function and GroupingCriteria
Information about previous cognitive impairment was collected
by a trained neuropsychologist with the short version of the
Spanish Informant Questionnaire on Cognitive Decline in the
Elderly (S-IQCODE) [43] and the Frontal Behavioral Inventory
(FBI) [44] on admission day. Premorbid Intelligence was estimated
using the vocabulary subtest of Wechsler Adults Intelligence Scale
(WAIS-III-R) [45] at three months post-stroke.
Patients underwent two neuropsychological examinations at
different times. First examination was performed within the first 72
hours after the stroke. We selected a test battery that covered a
variety of possible cognitive manifestations of vascular brain
injury. Attentional abilities were explored by the Digit Span
Forward Test (WAIS-III-R) [45], the subtest of attention extracted
from de Montreal Cognitive Test (MOCA) [46], and the Line
Cancellation Test (LCT) [47]. Executive abilities were assessed
with the Digit Span Backwards from WAIS-III-R) [48], part B of
the Trail Making Test [47], Phonological fluency (letter P) [47],
Table 4. Clusters of significant FA, RD and AD differences between Stroke and Healthy Controls group.
Brain Lobe Anatomical Region Size (mm3) MNI coordinates Z-max Z p d
x y z
Fractional Anisotropy
HC.S
BG Thalamic Radiation (R) 755 77 119 65 1.00 3.09 0.001 1.299
BG Corticospinal Tract (R) 483 72 118 75 1.00 3.09 0.001 1.299
T Inferior Fronto_Occipital Fasciculus (R) 704 68 143 59 1.00 3.09 0.001 1.299
F Uncinate Fasciculus (R) 138 56 129 58 1.00 3.09 0.001 1.299
BG Anterior Limb of Internal Capsule (R) 202 77 121 68 1.00 3.09 0.001 1.299
BG Retrolenticular part of Internal Capsule (R) 393 66 148 67 1.00 309 0.001 1.299
Radial Diffusivity
S.HC
BG Anterior Limb of Internal Capsule (L) 493 105 142 68 0.99 2.88 0.002 1.21
BG Anterior Limb of Internal Capsule (R) 521 77 121 69 1.00 2.88 0.002 1.21
BG Retrolenticular part of Internal Capsule (L) 265 126 101 69 0.99 2.88 0.002 1.21
BG Retrolenticular part of Internal Capsule (R) 1441 72 147 60 1.00 2.88 0.002 1.21
BG Posterior Thalamic Radiation (L) 393 123 64 82 1.00 2.88 0.002 1.21
BG Posterior Thalamic Radiation (L) 393 51 117 53 1.00 2.88 0.002 1.21
BG Anterior Thalamic Radiation (L) 1345 116 66 90 1.00 2.88 0.002 1.21
BG Anterior Thalamic Radiation (R) 2125 71 142 75 1.00 2.88 0.002 1.21
BG Corticospinal Tract (L) 1218 116 91 100 1.00 2.88 0.002 1.21
BG Corticospinal Tract (R) 2052 63 107 93 1.00 2.88 0.002 1.21
T Inferior Fronto-Occipital Fasciculus (L) 1059 123 65 83 1.00 2.88 0.002 1.21
T Inferior Fronto-Occipital Fasciculus (R) 4340 69 141 59 1.00 2.88 0.002 1.21
F Uncinate Fasciculus (L) 144 109 144 100 1.00 2.88 0.002 1.21
F Uncinate Fasciculus (R) 752 56 127 59 1.00 2.88 0.002 1.21
Axial Diffusivity
S.HC
BG Anterior thalamic radiation (R) 322 66 117 106 0.99 2.05 0.02 0.88
BG Corticospinal Tract (R) 433 65 113 105 0.99 2.05 0.02 0.88
T Inferior fronto occipital fasciculus (R) 342 55 75 83 0.99 2.05 0.02 0.88
Abbreviations: FA= Fractional Anisotropy; RD =Radial Diffusivity; AD =Axial Diffusivity; S = Stroke group; HC=Healthy Control group; BG=Basal Ganglia; T = Temporal;F = Frontal; L = Left; R = Right.doi:10.1371/journal.pone.0086119.t004
Stroke, Diffusion Tensor Imaging, Recovery
PLOS ONE | www.plosone.org 4 January 2014 | Volume 9 | Issue 1 | e86119

and Semantic fluency (animals) [47]. Language abilities were
assessed with spontaneous speech (talking briefly about his/her
health problems), repetition, understanding items extracted from
The Mental Status Examination in Neurology [48], writing of one
sentence, item extracted from the Mini Mental State Examination
Test (MMSE) [49], and naming with the short version (15-items)
of the Boston Naming Test [50]. Premotor abilities were assessed
with Luria’s sequences test, Rhythms subtest extracted from the
MOCA test [46], and interference and inhibitory control subtest
extracted from the Frontal Assessment Battery [51]. Speed and
visuomotor coordination were assessed with the part A of the Trail
Making Test [47] and the Grooved Pegboard Test (GPT) [52].
Neuropsychological examinations also included the MMSE [49],
as a global cognitive test and the Geriatric Depression Scale (GDS)
[53]. The acute neuropsychological examination was performed in
a fixed order that took approximately 60 minutes to complete. If
the patient was fatigued, the testing was split between two sessions
carried out in the same day.
Second cognitive examination took place at three months after
stroke lasting at most 2 hours. It should be mentioned that for this
study we only considered the tests that had been used in both
examinations. HC received a similar neuropsychological assess-
ment to S at the acute phase. Stroke patients were dichotomized
into two subgroups according to their level of cognitive recovery
Table 5. Clusters of significant FA and RD differences between Stroke groups with good and poor recovery and Healthy Controlsgroup.
Brain Lobe Anatomical RegionSize(mm3) MNI coordinates Z-max Z p d
x y z
Fractional Anisotropy
HC.SG
F Genu of Corpus Callosum (L) 231 91 110 97 0.99 2.05 0.02 0.88
HC.SP
BG Pontine Crossing Tract (L) 194 94 149 85 0.99 2.05 0.02 0.88
F Genu of Corpus Callosum (L) 1034 96 144 90 0.99 2.05 0.02 0.88
Body of Corpus Callosum (L) 555 99 94 94 0.99 2.05 0.02 0.88
BG Corona Radiata (L) 1180 109 140 101 1.00 2.05 0.02 0.88
BG Posterior Thalamic Radiation (L) 215 116 68 90 0.99 2.05 0.02 0.88
BG External Capsule (L) 661 123 119 74 0.99 2.05 0.02 0.88
BG Anterior Thalamic Radiation (L) 347 113 158 90 0.99 2.05 0.02 0.88
BG Corticospinal Tract (L) 726 117 107 97 0.99 2.05 0.02 0.88
P Cingulum (cingulate gyrus) (L) 284 100 148 90 0.99 2.05 0.02 0.88
P Forceps major (L) 382 116 68 90 0.99 2.05 0.02 0.88
P Forceps minor (L) 326 94 149 85 0.99 2.05 0.02 0.88
F Inferior fronto occipital fasciculus (L) 414 110 148 98 1.00 2.05 0.02 0.88
T Inferior longitudinal fasciculus (L) 133 117 68 91 0.99 2.05 0.02 0.88
F Superior longitudinal fasciculus (L) 663 111 141 101 1.00 2.05 0.02 0.88
F Uncinate fasciculus (L) 145 112 160 97 0.99 2.05 0.02 0.88
Radial Diffusivity
SP.HC
BG Pontine crossing tract (L) 176 94 149 85 1.00 2.33 0.01 0.98
F Genu of corpus callosum (L) 768 96 145 90 1.00 2.33 0.01 0.98
Body of corpus callosum (L) 306 115 71 90 0.99 2.33 0.01 0.98
BG Anterior limb of Internal Capsule (L) 376 100 132 70 0.99 2.33 0.01 0.98
BG Corona radiata (L) 1551 109 140 101 1.00 2.33 0.01 0.98
BG External capsule (L) 417 123 130 69 1.00 2.33 0.01 0.98
BG Anterior thalamic radiation (L) 890 111 158 88 1.00 2.33 0.01 0.98
BG Corticospinal tract (L) 460 118 110 91 1.00 2.33 0.01 0.98
P Cingulum (cingulate gyrus) (L) 174 99 148 90 1.00 2.33 0.01 0.98
P Forceps major (L) 165 116 68 90 0.99 2.33 0.01 0.98
P Forceps minor (L) 247 94 149 85 1.00 2.33 0.01 0.98
F Inferior fronto-occipital fasciculus (L) 274 110 147 98 1.00 2.33 0.01 0.98
F Superior longitudinal fasciculus (L) 375 112 140 101 1.00 2.33 0.01 0.98
Abbreviations: SG = Stroke group with good recovery; SP = Stroke group with poor recovery; HC=Healthy Control group; BG=Basal Ganglia; T = Temporal; F = Frontal;P = Parietal; L = Left.doi:10.1371/journal.pone.0086119.t005
Stroke, Diffusion Tensor Imaging, Recovery
PLOS ONE | www.plosone.org 5 January 2014 | Volume 9 | Issue 1 | e86119

between acute and subacute phase. First, a paired t-test was
conducted to determine the cognitive tests in which patients had
significantly improved. Second, subjects were considered to
demonstrate a good cognitive recovery (SG group) if they had
normalized or improved 1.5 SD in at least three of these tests.
Statistical analyses were performed with the Statistical Package
for the Social Sciences (SPSS Inc., Chicago, IL, USA), version
17.0 for Windows. Baseline characteristics were summarized as
mean 6 standard deviation (SD) for continuous variables and
proportions (n, %) for categorical variables. The threshold for
statistical significance was set at P,0.05.
1.3. MRI Acquisition and Lesion AnalysisAll images were acquired at a 3T Siemens Magneto TIM Trio
(Siemens Diagnostics Healthcare, Erlangen, Germany) at the
Image Platform of IDIBAPS, Centre de diagnostic per la Imatge
from Hospital Clınic (CDIC), Barcelona. We used a 32-channel
phased-array head coil with foam padding and head phones to
restrict head motion and suppress scanner noise. The MRI
protocol included a set of magnetization prepared rapid gradient
echo (MP-RAGE) T1-weighted images (repetition time [TR]:
2300 ms; echo time [TE]: 3 ms; flip angle: 15u; field of view:
245 mm; and voxel size: 16161 mm3) and two runs of DWI.
DWI was acquired in 30 non collinear diffusion directions, with a
b-value of 1.000 s/mm2 and one with a value of 0 s/mm2, with
the following echo planar acquisition protocol: [TR]: 9300 mm;
[TE]: 94 ms; flip angle, 15u; field of view: 240 mm; no gap; and
voxel size: 26262 mm3.
Infarct depth (cortical, subcortical or both), laterality (left/right)
and vascular territory involved were determined in the first 24
hours employing Computed Tomography (CT) and/or Magnetic
Resonance (MRI). Lesion volume was calculated in the subacute
phase. T2-weighted images (TR: 5520 ms; echo time [TE]: 94 ms)
and fluid attenuated inversion recovery images (FLAIR; [TR]:
9040 ms; [TE]: 85 ms; inversion time [TI]: 2500 ms; and voxel
size: 0.8660.8666.5 mm3) were collected and analyzed by a
trained neurologist (M.M). Lesion volume was determined using
the three largest diameters along the three orthogonal axes divided
with 2 (AxBxC/2) [54].
1.4. Image Pre-processingDWI pre-processing included motion and eddy current
correction using FSL’s Eddy Correct Tool using the FMRIB
Diffusion Toolbox (FDT) (Analysis Group, FMRIB, Oxford, UK).
In order to eliminate spurious voxels, skull stripping of the T2
weighted b = 0 volume was achieved using FSL’s Brain Extraction
Figure 1. Significant changes in FA for the stroke group with poor recovery (SP) and the stroke group with good recovery (SG) at 3months when compared with healthy controls (HC). The red color identifies clusters with significant decrease of FA. Statistical maps arerepresented in radiological convention (right corresponds to left hemisphere), superimposed on an MNI152 template. The threshold for significancewas set at p#0.02 corrected for multiple comparisons. Circles highlight the locus of clusters in the HC.SP contrasts not found in the HC. SGcontrast.doi:10.1371/journal.pone.0086119.g001
Stroke, Diffusion Tensor Imaging, Recovery
PLOS ONE | www.plosone.org 6 January 2014 | Volume 9 | Issue 1 | e86119

Tool (BET) [55], and was used as a brain-mask for all other
diffusion maps. The second DWI run was linearly co-registered
(FLIRT) to the first, and the two runs have been averaged.
FMRIB’s Diffusion Toolbox - FDT v2.0 was used for the tensor
modeling of the diffusion parameters to produce DTI data.
Microstructural maps of fractional anisotropy (FA) and mean
diffusivity (MD) were entered into group analysis using Tract
Based Spatial Statistics - TBSS v1.2 [56] which is part of FSL data
processing suite [57].
1.5. Diffusion Tensor Image Group AnalysisTract-Based Spatial Statistics (TBSS). All subjects’ FA
data were aligned into a common space using the nonlinear
registration tool FNIRT [58,59], which uses a b-spline represen-
tation of the registration warp field [60,61], resulting in all images
transformed into 1 mm isotropic, MNI152 standard space. Next,
all participants’ FA volumes were averaged and a mean FA
skeleton was created from all voxels with a FA threshold = 0.2 to
reduce inclusion of voxels that are likely composed of multiple
tissue types or fiber orientations. Each participants’ aligned,
standard space, FA maps were then projected onto this skeleton to
create a 4D skeletonized volume (3D skeletal volume6number of
subjects) which was then fed into voxelwise group statistics.
1.6. Statistical Analysis of the DTI DataRandomize tool (v2.1; www.fmrib.ox.ac.uk/fsl/randomise/
index.html) from the FMRIB software library with a number of
permutation tests set to 5000, was applied on the FA maps [62.
56], to identify clusters of voxels that were significantly different
between the HC and the S, SP, and SG groups. Significant clusters
were identified using the Threshold-Free Cluster Enhancement
(TFCE) choosing a more restrictive threshold at a p-value #0.02
corrected for Family Wise Error (FWE) via Gaussian Random
Field theory [63].
Other diffusion-derived data (RD and AD) projections on the
TBSS skeleton were also calculated for each subject. The spatial
normalization transformations computed for the FA maps were
applied on the RD and AD maps to achieve their nonlinear
registration, which was projected on the TBSS skeleton. The
resulting 4D volumes were also used for voxelwise cross-subject
statistics.
The following statistical comparisons were made for each TBSS
diffusion map: 1) Whole-brain analysis between HC and S
subgroups; 2) Whole-brain ANCOVA analysis with the selected
cognitive tests as covariates of interest to study differences between
HC, SG, and SP; 3) Spearman’s correlations analysis between the
selected cognitive tests as covariates of interest and the TBSS
diffusion maps.
Figure 2. Significant changes in FA and RD for the stroke group with poor recovery at 3 months when compared with healthycontrols. The red and blue colors show clusters of significant decrease of FA and increase of RD. Statistical maps are represented in radiologicalconvention (right corresponds to left hemisphere) and are displayed superimposed on an MNI152 template. The threshold for significance was set atp#0.02 corrected for multiple comparisons.doi:10.1371/journal.pone.0086119.g002
Stroke, Diffusion Tensor Imaging, Recovery
PLOS ONE | www.plosone.org 7 January 2014 | Volume 9 | Issue 1 | e86119

Results
3.1. Sample CharacteristicsDemographic and clinical data are shown in Table 1. All
subjects were right handed (mean = 96.91610.08) except for one
ambidextrous subject. There were no significant between-groups
differences regarding to premorbid IQ, sex, gender and elapsed
time between stroke onset and neuropsychological assessment in
the acute phase (data not shown). Only a higher frequency of
diabetes mellitus was found in the stroke group with poor cognitive
recovery compared to the HC group. Table 2 shows stroke
severity at baseline of the National Institute of Health Stroke Scale
(NIHSS) and characteristics of the ischemic lesions (location, brain
hemisphere, volume and vascular territory). All infarcts were in the
territory supplied by the right MCA with the exception of 2
infarcts located in the right PCA territory. There were no
significant between-group differences either regarding to the
volume of the lesion (t12 =20.524; p = 0.610), neurological
severity, measured with the NIHSS (t6.284 = 1.272; p = 0.248) at
baseline and at three months (Z = 0.000; p = 1.000), functional
status, measured with the Barthel Scale at 3 months (Z =20.091;
p = 0.928) and the treatment received (all patients received
mechanical Thrombectomy, with the exception of two patients,
who received fibrinolytic treatment with rt-PA) (data not shown).
3.2. Neuropsychological TestingStroke groups in general demonstrated a significant acute-to-
subacute improvement in the following cognitive tests: Mini-
Mental State Examination (MMSE), Semantic Fluency (SF)
(naming animals in one minute), Boston Naming Test (BNT),
TMTA and the GPT (data not shown). The reader has to keep in
mind that cognitive improvement corresponds to increasing score
in the first three and decreased time to complete the last two tests.
This fact is important for the interpretation of the correlation
between FA and the test scores.
At the subacute phase, the SG group showed significant
differences from the HC group only in the MMSE (Z =22.417;
p = 0.016). The SP group showed significant differences from the
HC group in the following cognitive tests: MMSE (Z =22.294;
p = 0.022); Luria’ sequences test (Z =22.704; p = 0.007); Interfer-
ence and Inhibitory Control test (Z =22.196; p = 0.028); Phonetic
Fluency test (t24 =22.661; p = 0.014); Trail Making Test part-A
(t7.485 =22.392; p = 0.046); Grooved Pegboard Test (Z =22.613;
p = 0.009) and the Attentional subtest (MoCA) (Z =23.634;
p = 0.000).
Regarding to the two stroke subgroups, we only found
significant differences between SG and SP in the BNT
(Z =22.089; p = 0.037) (Table 3).
3.3. Fractional AnisotropyFor the whole stroke group (S), significant decrease of FA was
found only in right hemisphere when compared to the HC
(p = 0.001, d = 1.29) (Table 4). When analyzed separately, both SP
and SG groups continue to show significant FA disruption in the
right hemisphere (data not shown). SP group showed significant
decrease of FA also in several anatomical areas of the left
hemisphere (p = 0.02, d = 0.88); whereas SG group showed
significant FA disruption only in one anatomical area of the left
hemisphere (P = 0.02, d = 0.88) (Table 5, Figure 1).
Table 6. Clusters of significant negative (2) and positive (+) FA correlations between the different stroke groups and performancein the Semantic, Trail Making part-A and Grooved Pegboard Test.
Brain Lobe Anatomical Region Size (mm3) MNI coordinates Z p
x y z
Semantic Fluency Test
+SG group
Basal Ganglia Retrolenticular part of IC (R) 3256 52 91 74 2.014 0.022
Trail Making Test (part A)
2SG group
F Superior Corona Radiata (L) 15788 108 126 116 2.409 0.008
F Inferior Fronto-Occipital Fasciculus (R) 7663 64 77 93 2.075 0.019
F Inferior Fronto-Occipital Fasciculus (L) 4035 120 161 75 2.033 0.021
F Superior Longitudinal Fasciculus (L) 264 124 121 93 1.995 0.023
P Cingulum (L) 149 98 126 112 1.685 0.046
P Forceps Major (L) 120 101 45 90 1.655 0.049
Grooved Pegboard Test
2SG group
F Superior Corona Radiata (L) 27662 108 123 112 2.170 0.015
Basal Ganglia Anterior Thalamic Radiation (L) 7188 108 126 114 2.054 0.02
P Splenium of Corpus Callosum (L) 116 111 76 94 1.695 0.045
Basal Ganglia Posterior Thalamic Radiation (L) 390 120 57 73 1.685 0.046
2SP group
T Inferior Longitudinal Fasciculus (R) 917 46 101 74 1.825 0.034
F Posterior Corona Radiata (R) 136 62 87 94 1.695 0.045
Abbreviations: F = Frontal, P = Parietal; T = Temporal; R = Right; L = Left.doi:10.1371/journal.pone.0086119.t006
Stroke, Diffusion Tensor Imaging, Recovery
PLOS ONE | www.plosone.org 8 January 2014 | Volume 9 | Issue 1 | e86119
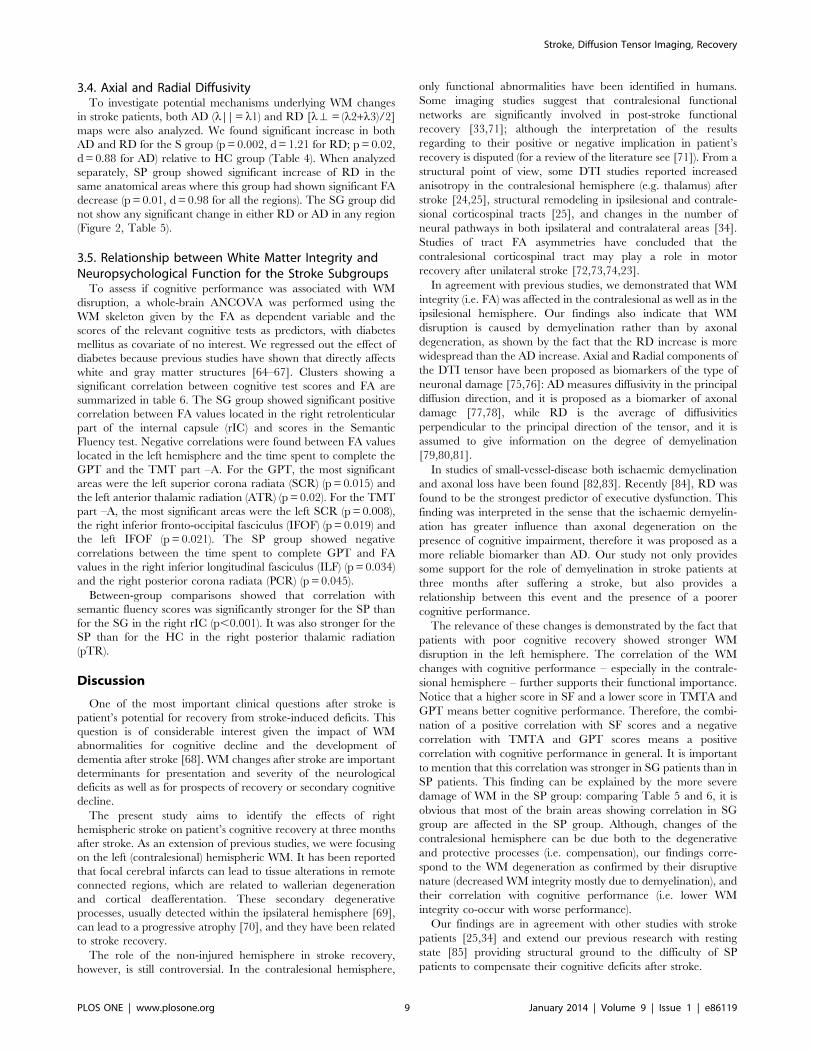
3.4. Axial and Radial DiffusivityTo investigate potential mechanisms underlying WM changes
in stroke patients, both AD (l|| = l1) and RD [lH= (l2+l3)/2]
maps were also analyzed. We found significant increase in both
AD and RD for the S group (p = 0.002, d = 1.21 for RD; p = 0.02,
d = 0.88 for AD) relative to HC group (Table 4). When analyzed
separately, SP group showed significant increase of RD in the
same anatomical areas where this group had shown significant FA
decrease (p = 0.01, d = 0.98 for all the regions). The SG group did
not show any significant change in either RD or AD in any region
(Figure 2, Table 5).
3.5. Relationship between White Matter Integrity andNeuropsychological Function for the Stroke Subgroups
To assess if cognitive performance was associated with WM
disruption, a whole-brain ANCOVA was performed using the
WM skeleton given by the FA as dependent variable and the
scores of the relevant cognitive tests as predictors, with diabetes
mellitus as covariate of no interest. We regressed out the effect of
diabetes because previous studies have shown that directly affects
white and gray matter structures [64–67]. Clusters showing a
significant correlation between cognitive test scores and FA are
summarized in table 6. The SG group showed significant positive
correlation between FA values located in the right retrolenticular
part of the internal capsule (rIC) and scores in the Semantic
Fluency test. Negative correlations were found between FA values
located in the left hemisphere and the time spent to complete the
GPT and the TMT part –A. For the GPT, the most significant
areas were the left superior corona radiata (SCR) (p = 0.015) and
the left anterior thalamic radiation (ATR) (p = 0.02). For the TMT
part –A, the most significant areas were the left SCR (p = 0.008),
the right inferior fronto-occipital fasciculus (IFOF) (p = 0.019) and
the left IFOF (p = 0.021). The SP group showed negative
correlations between the time spent to complete GPT and FA
values in the right inferior longitudinal fasciculus (ILF) (p = 0.034)
and the right posterior corona radiata (PCR) (p = 0.045).
Between-group comparisons showed that correlation with
semantic fluency scores was significantly stronger for the SP than
for the SG in the right rIC (p,0.001). It was also stronger for the
SP than for the HC in the right posterior thalamic radiation
(pTR).
Discussion
One of the most important clinical questions after stroke is
patient’s potential for recovery from stroke-induced deficits. This
question is of considerable interest given the impact of WM
abnormalities for cognitive decline and the development of
dementia after stroke [68]. WM changes after stroke are important
determinants for presentation and severity of the neurological
deficits as well as for prospects of recovery or secondary cognitive
decline.
The present study aims to identify the effects of right
hemispheric stroke on patient’s cognitive recovery at three months
after stroke. As an extension of previous studies, we were focusing
on the left (contralesional) hemispheric WM. It has been reported
that focal cerebral infarcts can lead to tissue alterations in remote
connected regions, which are related to wallerian degeneration
and cortical deafferentation. These secondary degenerative
processes, usually detected within the ipsilateral hemisphere [69],
can lead to a progressive atrophy [70], and they have been related
to stroke recovery.
The role of the non-injured hemisphere in stroke recovery,
however, is still controversial. In the contralesional hemisphere,
only functional abnormalities have been identified in humans.
Some imaging studies suggest that contralesional functional
networks are significantly involved in post-stroke functional
recovery [33,71]; although the interpretation of the results
regarding to their positive or negative implication in patient’s
recovery is disputed (for a review of the literature see [71]). From a
structural point of view, some DTI studies reported increased
anisotropy in the contralesional hemisphere (e.g. thalamus) after
stroke [24,25], structural remodeling in ipsilesional and contrale-
sional corticospinal tracts [25], and changes in the number of
neural pathways in both ipsilateral and contralateral areas [34].
Studies of tract FA asymmetries have concluded that the
contralesional corticospinal tract may play a role in motor
recovery after unilateral stroke [72,73,74,23].
In agreement with previous studies, we demonstrated that WM
integrity (i.e. FA) was affected in the contralesional as well as in the
ipsilesional hemisphere. Our findings also indicate that WM
disruption is caused by demyelination rather than by axonal
degeneration, as shown by the fact that the RD increase is more
widespread than the AD increase. Axial and Radial components of
the DTI tensor have been proposed as biomarkers of the type of
neuronal damage [75,76]: AD measures diffusivity in the principal
diffusion direction, and it is proposed as a biomarker of axonal
damage [77,78], while RD is the average of diffusivities
perpendicular to the principal direction of the tensor, and it is
assumed to give information on the degree of demyelination
[79,80,81].
In studies of small-vessel-disease both ischaemic demyelination
and axonal loss have been found [82,83]. Recently [84], RD was
found to be the strongest predictor of executive dysfunction. This
finding was interpreted in the sense that the ischaemic demyelin-
ation has greater influence than axonal degeneration on the
presence of cognitive impairment, therefore it was proposed as a
more reliable biomarker than AD. Our study not only provides
some support for the role of demyelination in stroke patients at
three months after suffering a stroke, but also provides a
relationship between this event and the presence of a poorer
cognitive performance.
The relevance of these changes is demonstrated by the fact that
patients with poor cognitive recovery showed stronger WM
disruption in the left hemisphere. The correlation of the WM
changes with cognitive performance – especially in the contrale-
sional hemisphere – further supports their functional importance.
Notice that a higher score in SF and a lower score in TMTA and
GPT means better cognitive performance. Therefore, the combi-
nation of a positive correlation with SF scores and a negative
correlation with TMTA and GPT scores means a positive
correlation with cognitive performance in general. It is important
to mention that this correlation was stronger in SG patients than in
SP patients. This finding can be explained by the more severe
damage of WM in the SP group: comparing Table 5 and 6, it is
obvious that most of the brain areas showing correlation in SG
group are affected in the SP group. Although, changes of the
contralesional hemisphere can be due both to the degenerative
and protective processes (i.e. compensation), our findings corre-
spond to the WM degeneration as confirmed by their disruptive
nature (decreased WM integrity mostly due to demyelination), and
their correlation with cognitive performance (i.e. lower WM
integrity co-occur with worse performance).
Our findings are in agreement with other studies with stroke
patients [25,34] and extend our previous research with resting
state [85] providing structural ground to the difficulty of SP
patients to compensate their cognitive deficits after stroke.
Stroke, Diffusion Tensor Imaging, Recovery
PLOS ONE | www.plosone.org 9 January 2014 | Volume 9 | Issue 1 | e86119

SP patients showed significant deficits in attentional, motor,
executive and processing speed functions when compared to HC.
This profile has been related to vascular lesions in brain structures
harboring frontal-subcortical circuits [86], something which is
frequent in strokes that affect the vascular territory supplied by the
MCA. Moreover, SP patients showed lower FA values in major
left and right WM tracts that run along the anterior-posterior axis
of the brain, supporting fronto-posterior and fronto-subcortical
network interactions. These networks have been associated with
executive functions [87]. Furthermore, WM disruption in the
Body of Corpus Callosum for the SP group supports the suggestion
made by Meguro et al (2000) who counted structural disruption of
the corpus callosum as a sign of existing changes in the non-
injured hemisphere. The relationships between structural changes
reported here along with our previous findings imply their
importance in clinical recovery and emphasize that not only
lesion volume or lesion localization but WM integrity of the non-
lesioned hemisphere are also important determinants of post-
stroke recovery.
The generalizability of our findings is restricted by our relatively
low sample size. On the other hand, our sample was quite
homogenous regarding the lesion (all right-sided, first-time infarct)
and demographic characteristics (e.g. vascular risk factors).
Conclusion
According to our knowledge, our study is the first characterizing
WM changes in relation to cognitive recovery in patients at three
months post stroke and matched healthy participants.
We have demonstrated not only the involvement of the
contralesional hemisphere but also that its involvement correlates
with cognitive recovery. The results reported in this paper broaden
our view of the factors that may play a role in patient cognitive
recovery after stroke. Future longitudinal studies may further
improve our understanding of the evolution of poststroke changes
in the contralesional WM microstructure and the relevance of the
WM changes observed in this study.
Moreover, our results demonstrate that DTI provides informa-
tion about the mechanism of WM pathology, and may help to
explain apparent severity and cognitive outcomes. In the future,
DTI may serve as a biomarker of cerebral plasticity and help
evaluating a patient’s response to rehabilitation. Predicting which
patients will have worse outcomes in the chronic phase is a pivotal
question for restorative neurology and can help us to adjust
rehabilitation therapies more efficiently to each patient’s needs.
Finally, taking into account that we assessed only stroke patients
at 3 months following ischemic stroke, our results should be
interpreted carefully. Inter-individual differences in brain structure
might be the result of variations in life experience or of different
genetic predispositions that should be take into account in future
studies with large samples [88].
Author Contributions
Conceived and designed the experiments: MM AD RDA MG TA.
Performed the experiments: RDA MG TA. Analyzed the data: RDA TA.
Contributed reagents/materials/analysis tools: RDA TA MG. Wrote the
paper: RDA. Revised manuscript: MM MG TA IC MB NB AD CC ELC
MFA PTM MAS. Recruitment and exploration of patients: RDA MFA.
References
1. Murkherjee D, Patil C (2011) Epidemiology and the global burden of stroke.
World Neurosurgery, 76: S85–S90.
2. Nichols TE, Holmes AP (2002) Nonparametric permutation tests for functional
neuroimaging: A primer with examples. Hum Brain Mapp 15: 1–25.
3. Irving EA, Bentley DL, Parsons AA (2001) Assessment of white matter injury
following prolonged focal cerebral ischemia in the rat. Acta Neuropathol (Berl)
102: 627–35.
4. Iadecola C, Anrather J (2011) The immunology of stroke: from mechanisms to
translation. Nature Medicine 7: 796–808.
5. Sykovi E, Svoboda J, Polak J, Chvatal A (1994) Extracellular volume fraction
and diffusion characteristics during progressive ischemia and terminal anoxia in
the spinal cord of the rat. J. Cereb. Blood Flow Metab 14: 301–311.
6. Werring DJ, Toosy AT, Clark CA, Parker GJ, Barker GJ, et al. (2000) Diffusion
tensor imaging can detect and quantify corticospinal tract degeneration after
stroke. Journal of Neurology, Neurosurgery & Psychiatry 69: 269–272.
7. Molko N, Pappata S, Mangin JF, Poupon F, LeBihan D, et al. (2002) Monitoring
disease progression in CADASIL with diffusion magnetic resonance imaging: a
study with whole brain histogram analysis. Stroke 33: 2902–8.
8. O’Sullivan M, Summers PE, Jones DK, Jarosz JM, Williams SC, et al. (2001)
Normal-appearing white matter in ischemic leukoaraiosis: a diffusion tensor
MRI study. Neurology 57: 2307–10.
9. O’Sullivan M, Singhal S, Charlton R, Markus HS (2004) Diffusion tensor
imaging of thalamus correlates with cognition in CADASIL without dementia.
Neurology 62: 702–7.
10. Bihel E, Pro-Sistiaga P, Letourneur A, Toutain J, Saulnier R, et al. (2010)
Permanent or transient chronic ischemic stroke in the non-human primate:
behavioral, neuroimaging, histological, and immunohistochemical investiga-
tions. J. Cereb. Blood Flow Metab 30: 273–285.
11. Ding G, Jiang Q, Li L, Zhang L, Zhang ZG, et al. (2008) Magnetic resonance
imaging investigation of axonal remodeling and angiogenesis after embolic
stroke in sildenafil-treated rats. J. Cereb. Blood Flow Metab 28: 1440–1448.
12. van der Zijden JP, van der Toorn A, van der Marel K, Dijkhuizen RM (2008)
Longitudinal in vivo MRI of alterations in perilesional tissue after transient
ischemic stroke in rats. Exp Neurol 212: 207–212.
13. Pitkonen M, Abo-Ramadan U, Marinkovic I, Pedrono E, Khader M, et al.
(2012) Long-term evolution of diffusion tensor indices after temporary
experimental ischemic stroke in rats. Brain Research 1445: 103–110.
14. Munoz Maniega S, Bastin ME, Armitage PA, Farrall AJ, Carpenter TK, et al.
(2004) Temporal evolution of water diffusion parameters is different in grey and
white matter in human ischaemic stroke. J Neurol Neurosurg Psychiatry 75:
1714–8.
15. Wang C, Stebbins GT, Nyenhuis DL, de Toledo-Morell L, Freels S, et al. (2006)
Longitudinal changes in white matter following ischemic stroke: a three-year
follow-up study. Neurobiol Aging 27: 1827–1833.
16. Bhagat Y, Emery D, Shuaib A, Sher F, Rizvi N, et al. (2006) The relationship
between diffusion anisotropy and time of onset after stroke. Journal of Cerebral
Blood Flow & Metabolism 26: 1442–1450.
17. Bhagat Y, Hussain M, Stobbe R, Butcher K, Emery D, et al. (2008) Elevations of
diffusion anisotropy are associated with hyper-acute stroke: a serial imaging
study. Magn Reson Imaging 26: 683–693.
18. Marks MP, Tong DC, Beaulieu C, Albers GW, de Crespigny A et al. (1999)
Evaluation of early reperfusion and intravenous tPA therapy using diffusion- and
perfusion weighted MRI. Neurology 52: 1792–8.
19. Beaulieu C, de Crespigny A, Tong DC, Moseley ME, Albers GW et al. (1999)
Longitudinal magnetic resonance imaging study of perfusion and diffusion in
stroke: evolution of lesion volume and correlation with clinical outcome. Ann
Neurol 46: 568–78.
20. Fiebach JB, Jansen O, Schellinger PD, Heiland S, Hacke W, et al. (2002) Serial
analysis of the apparent diffusion coefficient time course in human stroke.
Neuroradiology 44: 294–8.
21. Brus-Ramer M, Carmel JB, Chakrabarty S, Martin JH (2007) Electrical
stimulation of spared corticospinal axons augments connections with ipsilateral
spinal motor circuits after injury. J. Neurosci 50: 13793–801.
22. Carmichael ST, Chesselet MF (2002) Synchronous neuronal activity is a signal
for axonal sprouting after cortical lesions in the adult. J. Neurosci 14: 6062–70.
23. Dancause N, Barbay S, Frost SB, Plautz EJ, Chen D, et al. (2005) Extensive
cortical rewiring after brain injury. J. Neurosci 44: 10167–79.
24. Liu Z, Li Y, Zhang X, Savant-Bhonsale S, Chopp M (2008) Contralesional
axonal remodeling of the corticospinal system in adult rats after stroke and bone
marrow stromal cell treatment. Stroke 9: 2571–7.
25. Buffon F, Molko N, Herve D, Porcher R, Denghien I, et al. (2005) Longitudinal
diffusion changes in cerebral hemispheres after MCA infarcts. J Cereb Blood
Flow Metab 25: 641–650.
26. Schaechter JD, Fricker ZP, Perdue KL, Helmer KG, Vangel MG, et al. (2009)
Microstructural status of ipsilesional and contralesional corticospinal tract
correlates with motor skill in chronic stroke patients. Human Brain Mapping 30:
3461–3474.
27. Jang SH, Cho SH, Kim YH, Han BS, Byun WM, et al (2005) Diffusion
anisotropy in the early stages of stroke can predict motor outcome. Restor
Neurol Neurosci 23: 11–7.
28. Lindenberg R, Renga V, Zhu LL, Betzler F, Aslop D, et al. (2010) Structural
integrity of corticospinal motor fibers predicts motor impairment in chronic
stroke. Neurology 74: 280–287.
Stroke, Diffusion Tensor Imaging, Recovery
PLOS ONE | www.plosone.org 10 January 2014 | Volume 9 | Issue 1 | e86119

29. Watanabe T, Honda Y, Fujii Y, Koyama M, Matsuzawa H et al. (2001)
Threedimensional anisotropy contrast magnetic resonance axonography topredict the prognosis for motor function in patients suffering from stroke.
J Neurosurg 94: 955–60.
30. Thomalla G, Glauche V, Koch MA, Beaulieu C, Weiller C et al. (2004)Diffusion tensor imaging detects early Wallerian degeneration of the pyramidal
tract after ischemic stroke. Neuroimage 22: 1767–1774.31. Stinear CM, Barber PA, Smale PR, Coxon JP, Fleming MK, et al. (2007)
Functional potential in chronic stroke patients depends on corticospinal tract
integrity Brain 130: 170–180.32. Qiu M, Darling WG, Morecraft RJ, Ni CC, Rajendra J, et al. (2011) White
matter integrity is a stronger predictor of motor function than BOLD response inpatients with stroke. Neurorehabil Neural Repair 25: 275–284.
33. Carmichael ST (2003) Plasticity of cortical projections after stroke. Neurosci-entist 1: 64–75.
34. Gerloff C, Bushara K, Sailer A, Wassermann EM, et al. (2006) Multimodal
Imaging of brain reorganization in motor areas of the contralesional hemisphereof well recovered patients after capsular stroke. Brain 129: 791–808.
35. Crofts JJ, Higham DJ, Bosnell R, Jbabdi S, Matthews PM, et al. (2011) Networkanalysis detects changes in the contralesional hemisphere following stroke.
Neuroimage 54: 161–9.
36. Bucur B, Maden DJ, Spaniol J, Provenzale JM, Cabeza R, et al. (2008) Age-related slowing of memory retrieval: contributions of perceptual speed and
cerebral white matter integrity. Neurobiology Aging 29: 1070–9.37. Burgmans S, van Boxtel MP, Gronenschild EH, Vuurman EF, Hofman P, et al.
(2010) Multiple indicators of age-related differences in cerebral white matter andmodifying effects of hypertension. Neuroimage 49: 2083–93.
38. Leritz EC, Salat DH, Milberg WP, Williams VJ, Chapman CE, et al. (2010)
Variation in blood pressure is associated with white matter microstructure butnot cognition in African Americans. Neuropsychology 24: 199–208.
39. Tang YY, Lu Q, Fan M, Yang Y, Posner MI (2012) Mechanisms of white matterchanges induced by meditation. PNAS (109): 10570–4.
40. Bennett I J, Madden, D J, Vaidya Ch J, Howard D, Howard J H (2010) Age-
Related Differences in Multiple Measures of White Matter Integrity: A DiffusionTensor Imaging Study of Healthy Aging. Human Brain Mapping (31): 378–390.
41. Lopez-Cancio E, Dorado L, Millan M, Reverte S, Sunol A, et al. (2012) TheBarcelona-Asymptomatic Intracranial Atherosclerosis (AsIA) study: prevalence
and risk factors. Atherosclerosis 221: 221–5.42. Miralbell J, Soriano JJ, Spulberb G, Lopez-Cancio E, Arenillas F, et al. (2012)
Structural brain changes and cognition in relation to markers of vascular
dysfunction. Neurobiology of Aging 33: 1003.e9–1003.e17.43. Morales-Gonzalez JM, Gonzalez-Montalvo JI, Del Ser Quijano T, Bermejo-
Pareja F (1992) Validation of the S-IQCODE: the Spanish version of theinformant questionnaire on cognitive decline in the elderly. Arch Neurobiology
55, 262–266.
44. Kertesz A, Davidson W, Fox H (1997) Frontal behavioral inventory: diagnosticcriteria for frontal lobe dementia. Can J Neurol Sci 24: 29–36.
45. Wechsler D (1999): Wechsler Adult Intelligence Scale-III (WAIS-III-R). Madrid:TEA Ediciones.
46. Nasreddine ZS, Phillips NA, Bedirian V, Charbonneau S, Whitehead V, et al.(2005) The Montreal Cognitive Assessment, MoCA: a brief screening tool for
mild cognitive impairment. J Am Geriatr Soc. 53: 695–9.
47. Strauss E, Sherman EMS, Spreen O (2006): A compendium of neuropsycho-logical tests. 3rd Ed. New York: Oxford University Press.
48. Strub R and Black W (2000) The Mental Status Examination in Neurology.F A Davis Publishers, Exeter, DEV, UK.
49. Folstein MF, Folstein SE, McHugh PR (1975) Mini Mental State. A practical
method for grading the cognitive state of patients for the clinician. J PsychiatryRes 12: 189–198.
50. Kaplan E, Goodglass H, Weintraub S (1983): Boston Naming Test.Philadelphia: Lea and Febiger.
51. Ruff RM, Parker SB (1993) Gender and age-specific changes in motor speed and
eye-hand coordination in adults: Normative values for the finger tapping andgrooved pegboard tests. Perceptual and Motor Skills 76: 1219–1230.
52. Yesavage JA, Brink TL, Rose TL, Lum O, Huang V, et al. (1982) Developmentand validation of a geriatric depression screening scale: a preliminary report.
J Psychiatr Res 17: 37–49.53. Sims JR, Rezai Gharai L, Schaefer PW, Vangel M, Rosenthal ES, et al. (2009)
ABC/2 for rapid clinical estimate of infarct, perfusion, and mismatch volumes.
Neurology 72: 2104–2110.54. Smith SM (2002) Fast robust automated brain extraction. Human Brain
Mapping 17: 143–155.55. Smith SM, Jenkinson M, Johansen-Berg H, Rueckert D, Nichols TE, et al.
(2006) Tract-based spatial statistics: Voxelwise analysis of multi-subject diffusion
data. Neuroimage 31: 1487–1505.56. Smith SM, Jenkinson M, Woolrich MW, Beckmann CF, Behrens TEJ, et al.
(2004) Advances in functional and structural MR image analysis andimplementation as FSL. Neuroimage 23: 208–219.
57. Andersson JLR, Jenkinson M, Smith S (2007) Non-linear optimization. FMRIBtechnical report TR07JA1. Available: www.fmrib.ox.ac.uk/analysis/techrep.
58. Andersson JLR, Jenkinson M, Smith S. (2007) Non-linear registration, aka
spatial normalization FMRIB technical report TR07JA2. Available: www.fmrib.ox.ac.uk/analysis/techrep.
59. Klein A, Andersson J, Ardekani BA, Ashburner J, Avants B, et al. (2009)
Evaluation of 14 nonlinear deformation algorithms applied to human brain MRIregistration. Neuroimage 46: 786–802.
60. Rueckert D, Sonoda LI, Hayes C, Hill DLG, Leach MO, et al. (1999) Non-rigid
registration using free-form deformations: Application to breast MR images.IEEE Transactions on Medical Imaging 18: 712–721.
61. Nichols TE, Holmes AP (2002) Nonparametric permutation tests for functionalneuroimaging: A primer with examples. Hum Brain Mapp 15: 1–25.
62. Smith SM, Nichols TE (2009) Threshold-free cluster enhancement: Addressing
problems of smoothing, threshold dependence and localization in clusterinference. Neuroimage 44: 83–98.
63. Dufouil C, Godin O, Chalmers J, Coskun O, MacMahon S, et al. (2009) Severecerebral white matter hyperintensities predict severe cognitive decline in patients
with cerebrovascular disease history. Stroke 40: 2219–21.64. Antenor-Dorsey J, Meyer E, Rutlin J, Perantie O, White N et al. (2013) White
matter microstructural integrity in youth with Type 1 Diabetes 62: 581–589.
65. Perantie C, Keller JM, Weaver PM, et al. (2011) Prospectively determinedimpact of type 1 diabetes on brain volume during development. Diabetes 60:
3006–3014.66. Van Duinkerken E, Schoonheim MM, Ijzerman RG et al. (2012) Diffusion
tensor imaging in type 1 diabetes: decreased white matter integrity relates to
cognitive functions. Diabetologia 55: 1218–1220.67. Dihne M, Grommes C, Lutzenburg M, Witte OW, Block F (2002) Different
mechanisms of secondary neuronal damage in thalamic nuclei after focalcerebral ischemia in rats. Stroke 33: 3006–11.
68. Skriver EB, Olsen TS, McNair P (1990) Mass effect and atrophy after stroke.Acta Radiol 31: 431–8.
69. Rehme AK, Fink GR, von Cramon DY, Greffkes C (2011) The role of the
contralesional motor cortex for motor recovery in the early days after strokeassessed with longitudinal fMRI. Cereb Cortex 21: 756–768.
70. Rehme AK, Eickhoff SB, Rottschy C, Fink GR, Grefkes C (2012) Activationlikelihood estimation meta-analysis of motor-related neural activity after stroke.
Neuroimage 59: 2771–2782.
71. Ago T, Kitazono T, Ooboshi H, Takada J, Yoshiura T, et al. (2003)Deterioration of pre-existing hemiparesis brought about by subsequent
ipsilateral lacunar infarction. J Neurol Neurosurg Psychiatry 74: 1152–3.72. Brus-Ramer M, Carmel JB, Chakrabarty S, Martin JH (2007) Electrical
Stimulation of Spared Corticospinal Axons Augments Connections withIpsilateral Spinal Motor Circuits after Injury. J. of Neurosci 27: 13793–13801.
73. Jankowska E, Edgley SA (2006) How can corticospinal tract neurons contribute
to ipsilateral movements? A question with implications for recovery of motorfunctions Neuroscientist 12: 67–79.
74. Liu Z, Li Y, Zhang X, Savant-Bhonsale S, Chopp M (2008) Contralesionalaxonal remodeling of the corticospinal system in adult rats after stroke and bone
marrow stromal cell treatment. Stroke 9: 2571–7.
75. Burzynska AZ, Preuschhof C, Backman L, Nyberg L, Li SC, et al. (2010) Agerelated differences in white matter microstructure: region-specific patterns of
diffusivity. Neuroimage 49: 2104–2112.76. Song SK, Sun SW, Ju WK, Lin SJ, Cross AH, et al. (2003) Diffusion tensor
imaging detects and differentiates axon and myelin degeneration in mouse opticnerve after retinal ischemia. Neuroimage 20: 1714–1722.
77. Kumar R, Nguyen HD, Macey PM, Woo MA, Harper RM (2012) Regional
brain axial and radial diffusivity changes during development. J. Neurosci Res90: 346–355.
78. Kumar R, Macey PM, Woo MA, Harper RM (2010) Rostral brain axonal injuryin congenital central hypoventilation syndrome. J. Neurosci Res 88: 2146–2154.
79. Hu Y, Geng F, Tao L, Hu N, Du F, et al (2011). Enhanced white matter tracts
integrity in children with abacus training. Hum Brain Mapp 32: 10–21.80. Keller TA, Just MA (2009) Altering cortical connectivity: Remediation induced
changes in the white matter of poor readers. Neuron 64: 624–631.81. Bennett IJ, Madden DJ, Vaidya CJ, Howard DV, Howard JH (2010) Age related
differences in multiple measures of white matter integrity: A diffusion tensor
imaging study of health aging. Hum Brain Mapp 31: 378–390.82. Pantoni L (2010) Cerebral small vessel disease: from pathogenesis and clinical
characteristics to therapeutic challenges. The Lancet Neurology 9: 689–701.83. Englund E (2002) Neuropathology of white matter lesions in vascular cognitive
impairment. Cerebrovascular Diseases 13: 11–15.84. Lawrence AJ, Patel B, Morris RG, MacKinnon AD, Rich PM, et al. (2013).
Mechanisms of Cognitive Impairment in Cerebral Small Vessel Disease:
Multimodal MRI Results from the St George’s Cognition and Neuroimaging inStroke (SCANS) Study. PLoS One, 8: e61014.
85. Dacosta-Aguayo R, Fernandez-Andujar M, Millan M, Reverte S, Gomis M, etal. (2012) Whole brain resting-state analysis in patients with first ever stroke: a
Fmri study with independent component analysis (ICA). International
Neuropsychological Society Mid-Year Meeting. June 27–30. Oslo (Norway).Journal of International Neuropsychological Society.
86. Chui HC (2007) Subcortical ischemic vascular dementia. Neurol Clin 25: 717–740.
87. Salthouse TA (2011) Neuroanatomical substrates of age-related cognitivedecline. Psychology Bulletin 137: 753–784.
88. Johanse-Berg H, Scholz J and Stagg CJ (2010) Relevance of structural brain
connectivity to learning and recovery from stroke. Frontiers in SystemsNeurosciences 4: 1–9.
Stroke, Diffusion Tensor Imaging, Recovery
PLOS ONE | www.plosone.org 11 January 2014 | Volume 9 | Issue 1 | e86119


![Hemisphere Religion Optimized[1]](https://static.fdocuments.in/doc/165x107/577d33dc1a28ab3a6b8be81e/hemisphere-religion-optimized1.jpg)