Strouhal numbers, forces and flow structures around two tandem cylinders of different diameters
22
Journal of Fluids and Structures 24 (2008) 505–526 Strouhal numbers, forces and flow structures around two tandem cylinders of different diameters Md. Mahbub Alam , Y. Zhou Department of Mechanical Engineering, The Hong Kong Polytechnic University, Hung Hom, Kowloon, Hong Kong, China Received 7 February 2007; accepted 1 October 2007 Available online 3 December 2007 Abstract This paper presents a detailed investigation of Strouhal numbers, forces and flow structures in the wake of two tandem cylinders of different diameters. While the downstream cylinder diameter, D, was fixed at 25 mm, the upstream cylinder diameter, d, was varied from 0.24D to D. The spacing between the cylinders was 5.5d, at which vortices were shed from both cylinders. Two distinct vortex frequencies were detected behind the downstream cylinder for the first time for two tandem cylinders of the same diameter. The two vortex frequencies remained for d/D ¼ 1.0–0.4. One was the same as detected in the gap of the cylinders, and the other was of relatively low frequency and was ascribed to vortex shedding from the downstream cylinder. While the former, if normalized, declined progressively from 0.196 to 0.173, the latter increased from 0.12 to 0.203 with decreasing d/D from 1 to 0.24. The flow structure around the two cylinders is examined in the context of the observed Strouhal numbers. The time-averaged drag on the downstream cylinder also climbed with decreasing d/D, though the fluctuating forces dropped because vortices impinging upon the downstream cylinder decreased in scale with decreasing d/D. r 2007 Elsevier Ltd. All rights reserved. 1. Introduction The study of aerodynamic interference between two closely separated cylinders is of both fundamental and practical significance. In engineering, fluid forces and Strouhal numbers are the major factors to consider in the design of multiple slender structures subjected to cross-flow, e.g., chimney stacks, tube bundles in heat exchangers, overhead power-line bundles, bridge piers, stays, masts, chemical-reaction towers, offshore platforms and adjacent skyscrapers. The simplest configuration of multiple slender structures is two cylinders in either tandem or side-by-side arrangement. From the fundamental point of view, aerodynamic interference between two closely separated cylinders may give rise to flow separation, reattachment, vortex impingement, recirculation and quasi-periodic vortices, involving most generic flow features associated with multiple structures. Thus, flow around two cylinders provides a good model to understand the physics of flow around multiple cylindrical structures. Flow around two tandem cylinders of identical cylinders is in general classified into three regimes (Zdravkovich, 1987): (i) the extended-body regime, where the two cylinders are so close to each other that the free shear layers separated from the upstream cylinder overshoot the downstream one, and the flow in the gap of the cylinders is ARTICLE IN PRESS www.elsevier.com/locate/jfs 0889-9746/$ - see front matter r 2007 Elsevier Ltd. All rights reserved. doi:10.1016/j.jfluidstructs.2007.10.001 Corresponding author. Tel.: +852 27667813; fax: +852 23654703. E-mail address: [email protected] (Md. Mahbub Alam).
-
Upload
md-mahbub-alam -
Category
Documents
-
view
213 -
download
1
Transcript of Strouhal numbers, forces and flow structures around two tandem cylinders of different diameters

ARTICLE IN PRESS
0889-9746/$ - se
doi:10.1016/j.jfl
�CorrespondE-mail addr
Journal of Fluids and Structures 24 (2008) 505–526
www.elsevier.com/locate/jfs
Strouhal numbers, forces and flow structures around twotandem cylinders of different diameters
Md. Mahbub Alam�, Y. Zhou
Department of Mechanical Engineering, The Hong Kong Polytechnic University, Hung Hom, Kowloon, Hong Kong, China
Received 7 February 2007; accepted 1 October 2007
Available online 3 December 2007
Abstract
This paper presents a detailed investigation of Strouhal numbers, forces and flow structures in the wake of two
tandem cylinders of different diameters. While the downstream cylinder diameter, D, was fixed at 25mm, the upstream
cylinder diameter, d, was varied from 0.24D to D. The spacing between the cylinders was 5.5d, at which vortices were
shed from both cylinders. Two distinct vortex frequencies were detected behind the downstream cylinder for the first
time for two tandem cylinders of the same diameter. The two vortex frequencies remained for d/D ¼ 1.0–0.4. One was
the same as detected in the gap of the cylinders, and the other was of relatively low frequency and was ascribed to vortex
shedding from the downstream cylinder. While the former, if normalized, declined progressively from 0.196 to 0.173,
the latter increased from 0.12 to 0.203 with decreasing d/D from 1 to 0.24. The flow structure around the two cylinders is
examined in the context of the observed Strouhal numbers. The time-averaged drag on the downstream cylinder also
climbed with decreasing d/D, though the fluctuating forces dropped because vortices impinging upon the downstream
cylinder decreased in scale with decreasing d/D.
r 2007 Elsevier Ltd. All rights reserved.
1. Introduction
The study of aerodynamic interference between two closely separated cylinders is of both fundamental and practical
significance. In engineering, fluid forces and Strouhal numbers are the major factors to consider in the design of
multiple slender structures subjected to cross-flow, e.g., chimney stacks, tube bundles in heat exchangers, overhead
power-line bundles, bridge piers, stays, masts, chemical-reaction towers, offshore platforms and adjacent skyscrapers.
The simplest configuration of multiple slender structures is two cylinders in either tandem or side-by-side arrangement.
From the fundamental point of view, aerodynamic interference between two closely separated cylinders may give rise to
flow separation, reattachment, vortex impingement, recirculation and quasi-periodic vortices, involving most generic
flow features associated with multiple structures. Thus, flow around two cylinders provides a good model to understand
the physics of flow around multiple cylindrical structures.
Flow around two tandem cylinders of identical cylinders is in general classified into three regimes (Zdravkovich,
1987): (i) the extended-body regime, where the two cylinders are so close to each other that the free shear layers
separated from the upstream cylinder overshoot the downstream one, and the flow in the gap of the cylinders is
e front matter r 2007 Elsevier Ltd. All rights reserved.
uidstructs.2007.10.001
ing author. Tel.: +852 27667813; fax: +852 23654703.
ess: [email protected] (Md. Mahbub Alam).

ARTICLE IN PRESSMd. Mahbub Alam, Y. Zhou / Journal of Fluids and Structures 24 (2008) 505–526506
stagnant; (ii) the reattachment regime, where the shear layers separated from the upstream cylinder reattach on the
downstream cylinder and the flow in the gap is still insignificant; (iii) the co-shedding regime, where the shear layers roll
up alternately in the gap between the cylinders and thus the flow in the gap is significant. Zhou and Yiu (2006) and Xu
and Zhou (2004) unearthed two distinct flow structures in the reattachment regime, depending on whether the shear
layers from the upstream cylinder reattach on the downstream or upstream side of the downstream cylinder.
It is now well established that, in the co-shedding regime, the two circular cylinders shed vortices separately at the
same frequency (Ishigai et al., 1972; Meneghini et al., 2001; Igarashi, 1984; Alam et al., 2003a, 2006; Xu and Zhou,
2004; Alam and Zhou, 2007a). Alam and Sakamoto (2005) used a square cylinder of the same characteristic height to
replace the upstream cylinder, causing the vortex shedding frequency to be reduced, or to replace the downstream
cylinder, which resulted in an increase in the shedding frequency. They have found in the co-shedding regime that, for a
given downstream cylinder, different upstream-cylinder cross-sections with the same characteristic width resulted in a
difference in the frequency of vortex shedding from the upstream cylinder, and the frequency of vortex shedding from
the downstream cylinder adjusted itself to that of the upstream one. On the other hand, for a given upstream cylinder, a
change in the downstream-cylinder cross-section produced no difference in its shedding frequency [see Alam and
Sakamoto (2005) Alam and Zhou (2007a) for details]. It was concluded that the hydrodynamic stability of the flow
around two tandem two cylinders is predominantly controlled by the upstream cylinder, not the downstream cylinder.
The observation raises a number of questions. Firstly, would the two vortex shedding frequencies remain identical if the
upstream cylinder diameter is changed, which will lead to a change in the vortex strength and frequency? Secondly, if
the answer to the first question is yes, up to what diameter ratio? How does the Strouhal number depend on the ratio of
the cylinder diameters? Thirdly, how would the flow downstream of the cylinders evolve, as compared with a single
cylinder wake or the wake of two tandem cylinders of the same diameter? Finally, how would the fluid forces on the
cylinders vary, as compared with those on an isolated cylinder or two tandem cylinders of the same diameter? It has
been previously reported that placing a small cylinder upstream of a large cylinder, with their centre-to-centre spacing in
the reattachment regime, could reduce significantly both time-averaged and fluctuating forces on the downstream large
cylinder (Strykowski and Sreenivasan, 1990; Sakamoto et al., 1997; Lee et al., 2004). However, there is little information
in the literature on the effect of a small cylinder on the forces on a large downstream cylinder with their centre-to-centre
spacing in the co-shedding regime. These issues are both fundamentally and practically interesting and motivate the
present investigation.
This work aims to study experimentally aerodynamic interference between two tandem circular cylinders of different
diameters. The upstream cylinder diameter (d) is varied, with the downstream cylinder diameter (D) unchanged, so that
the ratio d/D varies from 1.0 to 0.24. The flow structure, Strouhal number, time-averaged and fluctuating forces on the
downstream cylinder are systematically measured.
2. Experimental details
Measurements were conducted in a low-speed, open-circuit wind tunnel with a 2.0m long test-section of
0.35m� 0.35m. The flow in the test-section was uniform and the turbulent intensity was 0.5% at a free-stream velocity
UN ¼ 14m/s. Two brass cylinders were mounted in tandem in the vertical mid-plane of the working section. Fig. 1(a)
shows schematically the experimental set-up and the definitions of coordinates (x0, y0) and (x, y), with the origins defined
at the upstream and downstream cylinder centres, respectively. The upstream cylinder of diameter d was fixed-mounted
at both ends, 0.2m downstream from the exit plane of the contraction. The downstream cylinder of diameter D was
cantilever-mounted, its lower end having a clearance of about 2–3mm from the bottom wall of the working section
(Fig. 1(b)). No vibration of the cylinder was observed. The diameter D was 25mm and d was 25, 20, 15, 10 and
6mm, respectively, and the corresponding d/D was 1.0–0.24, resulting in a maximum blockage of about 7.1%, and a
minimum aspect ratio of 14. No end-plate was mounted. No vibration was observed even for the cylinder of the smallest
diameter (6mm). The upstream cylinder was fixed-supported at both ends through the same diameter hole of 30mm
long on the wind-tunnel walls. The vibration of a cylinder, fix-supported at both ends, in cross-flow may should be
appreciable only when the vortex shedding frequency synchronized with the natural frequency of the fluid-
cylinder system, which has been carefully avoided in the present experiments. The measurement were conducted at
UN ¼ 14m/s, corresponding to a Reynolds numbers (Re) of 2.72� 104 and 0.65� 104 based on the large and small
cylinder diameters, respectively.
Two tungsten wires of 5mm in diameter and approximately 2mm in length, one (FH) fixed and placed at x0/d ¼ 2,
y0/d ¼ �1 and the other (TH) traversed over x/D ¼ 1–22, y/D ¼ 0.2–4.0, were used to measure the frequencies of vortex
shedding from the upstream and downstream cylinders, respectively (Fig. 1). The wires were operated at an overheat

ARTICLE IN PRESS
Flow
Dd
L=5.5d
d2d
D
4D
22D
4D
Traversinghotwire, TH
Fixed hotwire, FH
x
y
x'
y'
Load cell
Wind tunnel walls
Downstreamcylinder
Flow
Upstream Cylinder
Gap 2~3 mm
Fixed plate
Steel blocks
Fig. 1. (a) Schematic arrangement of experimental set-up. (b) Force measurement set-up.
Md. Mahbub Alam, Y. Zhou / Journal of Fluids and Structures 24 (2008) 505–526 507
ratio of 1.8 on a constant temperature circuit. The hot-wire probe holder was placed perpendicular to the wake-centre
plane to minimize the disturbance to flow. It is known that, at a higher subcritical Re (2� 103–105), vortices behind a
single isolated cylinder roll up at x0/d ¼ 1.2–2.0 and y0/d ¼ �0.7 to �0.5 (Zdravkovich, 1997). The present Re based on
the upstream cylinder is 6.5� 103–2.72� 104. Noting that the present experiment was conducted at L/d ¼ 5.5, where the
flow over the upstream cylinder was almost the same as that over an isolated single cylinder, the hot-wire should not
affect the rollup of vortices, and its effect on the shear layer should be negligibly small. The signals from the wires were
offset, amplified and then digitized using a 12-bit A/D board at a sampling frequency of 2.0 kHz. The sampling duration
was about 16.2 s and at least three sample signals in one test were obtained at each measurement location. A signal
exceeding 150 vortex shedding cycles in length may be considered to be stationary in the wake of a cylinder (Sakamoto
et al., 1987). The presently measured minimum vortex shedding frequency was 67Hz; a duration of 16.2 s corresponds
to 1085 cycles, about 7.2 times the critical signal length. The power spectral density function, Eu, of the signals,
calculated using a fast Fourier transform algorithm, was determined based on the average of 15 runs, each composed of
2048 (211) samples. Only repeatable dominant frequencies in the power spectrum were considered to be the dominant
vortex frequencies. The frequency resolution in the power spectra was about 0.4Hz.
A three-component quartz piezoelectric load cell (Kistler Model 9251A), characterized by high response, resolution
and stiffness, was installed at the upper end of the downstream cylinder to measure the fluid forces. This load cell was
bolted tightly between two machine-polished stainless steel blocks (Fig. 1(b)). In order to avoid the effect of wind tunnel
vibration on the measurements, the holder of the load cell was mounted on an external rigid frame detached from the

ARTICLE IN PRESSMd. Mahbub Alam, Y. Zhou / Journal of Fluids and Structures 24 (2008) 505–526508
wind tunnel. The load cell measures instantaneous integral fluid forces acting on the length of the cylinder exposed in
the wind tunnel. The preload of the load cell was 25 kN, more than 7.4� 104 times higher than the fluid forces presently
measured, resulting in a very high signal-to-noise ratio.
A Dantec particle imaging velocimetry (PIV) was used to measure the near wake in the (x, y) plane. The cylinder
surface and the tunnel working section wall hit by the laser sheet were painted black to minimize reflection noises. The
flow was seeded by smoke, generated from Paraffin oil, with a particle size of about 1mm in diameter. This measurement
was conducted in a different wind tunnel, whose test-section was 0.6m� 0.6m and 2.4m long. The velocity in the test-
section was uniform to within 1% and the turbulent intensity was 0.7% at UN ¼ 14m/s. See Huang et al. (2006), Alam
and Zhou (2007b) for more details of the tunnel and the PIV system). The two cylinders have the same diameter as those
used for the frequency and force measurements.
A two-component laser Doppler anemometry (LDA; Dantec Model 58N40 with enhanced FVA signal processor)
was used to measure the cross-flow distributions of time-averaged and root mean square (rms) velocities at x/D ¼ �1.0,
1.0 and 4.0. The LDA system was mounted on a three-dimensional (3-D) computer-controlled traversing mechanism,
with a traversing resolution of 1mm. This measurement was conducted in the wind tunnel with the 2.4m long test-
section of 0.6m� 0.6m.
The hot-wire and PIV/LDA measurements were carried out in two different wind tunnels of different working section
dimensions. However, the cylinder diameters used were identical. Therefore, the minimum aspect ratio of the cylinders,
corresponding to the large diameter cylinder used, was 14 and 24 in the hot-wire-measurement wind tunnel and
PIV/LDA-measurement wind tunnel, respectively. West and Apelt (1993) established that the ‘long’ cylinder conditions,
at which flow is independent of the cylinder spanwise length, prevail given a cylinder aspect ratio greater than 10. The
aspect ratios of presently used cylinders all exceed the critical value for the ‘long’ cylinder condition. It may be inferred
that the aspect ratios effect on results is negligibly small.
Flow visualization was conducted using the laser-induced fluorescence (LIF) technique in a water tunnel with
a 0.5m long working section of 0.15m� 0.15m. The upstream cylinder diameter was 15, 12, 9, 6 and 4mm,
and the downstream one was 15mm, resulting in the same ratios of diameters as used in the wind tunnels. Both
cylinders were made of acrylic, and L/d was 5.5. The Reynolds numbers were 450 and 180 based on the large and
small diameters, respectively. Dye (Rhodamine 6G 99%) was introduced into the flow through two pin holes at the
mid-span of the two cylinders and 901 clockwise and anti-clockwise, respectively, from the leading stagnation point.
A thin laser sheet, generated by laser beam sweeping, provided illumination in the vertical plane through the mid-span
of the cylinders. A Spectra-Physics Stabilite 2017 Argon Ion laser (4W) was used to generate the laser beam. A digital
video camera was used to record the dye-marked vortex street at a framing rate of 25 frames per second. The camera
view window was set first at x0/d ¼ �1–x/D ¼ 3 and then at x/D ¼ �1.0–13. The duration of each recording was
10min.
3. Wavelet and cross-wavelet analyses
The Fourier transform produces averaged spectral coefficients that are independent of time and is useful to identify
dominant frequencies in a signal. When a Fourier spectrum from the signal displays more than one peak, the
information on the frequencies, at which the peaks occur, with respect to time, i.e., frequency-time plots, is very
valuable to the understanding of flow physics (Farge, 1992; Alam et al., 2003b; Alam and Sakamoto, 2005). This
information may be given in the short term Fourier transform (STFT). However, STFT may suffer from limitations
(Daubechies, 1990; Newland, 1993; Hamdan et al., 1996; Torrence and Compo, 1998). The limitations may be avoided
if the wavelet transform is deployed, which produces a potentially more revealing picture of the time–frequency
localization of signals. Although relatively new, wavelet analysis has found many applications in fluid mechanics, for
example, to identify predominant frequencies in a coaxial jet flow (Li, 1997; Yilmaz and Kodal, 2000), to explicate
fundamental vibration frequencies of a self-excited cylinder (Hamdan et al., 1996), to study the turbulent structures of
different scales in a turbulent cylinder wake (Rinoshika and Zhou, 2005a, b). Recently, Alam and Sakamoto (2005) and
Alam et al. (2003b) used wavelet and cross-wavelet transforms to characterize the switching phenomena of the gap flow
between two circular cylinders in staggered, tandem and side-by-side arrangements. Alam et al. (2003b) observed, based
on the wavelet analysis of two simultaneously obtained hot-wire signals measured in a two-side-by-side-cylinder wake,
how the vortex frequency associated with one cylinder changed at the bi-stable flow regime with respect to that
associated with the other and with respect to time. They managed to identify, based on cross-wavelet analysis, the
synchronized frequency, the synchronized region in time space, and phase between the processes of vortex shedding
from the two cylinders.

ARTICLE IN PRESSMd. Mahbub Alam, Y. Zhou / Journal of Fluids and Structures 24 (2008) 505–526 509
The wavelet transform is a linear convolution (Yong, 1998) of a given one-dimensional signal u(t) and the mother
wavelet c(t). Mathematically, the wavelet transform is given by
W ðs; bÞ ¼1ffiffisp
ZuðtÞC# t� b
s
� �dt, (1)
where W(s, b) is the wavelet coefficient, the superscript ‘#’ denotes the complex conjugate, b is the translation
parameter, and s is the scale parameter. W(s, b) may be given graphically in the wavelet map in terms of s and b for a
given mother wavelet. A large value of W(s, b) reflects the combined effect of a large fluctuation of the signal and of
good matching in the shape between the signal and the wavelet.
There are many mother wavelets used in practice, e.g., the Morlet wavelet, the Mexican hat wavelet, and the Gabor
wavelet. The Mexican hat wavelet is real-valued, and the Morlet and Gabor wavelets are complex-valued. The real-
valued wavelet isolates the local minima and maxima of a signal. When a complex-valued mother wavelet is used in
Eq. (1), W(s, b) becomes complex, with a real part, WR(s, b), and an imaginary part, WI(s, b). While W 2ðs; bÞ ¼W R2
ðs; bÞ þW I2 ðs; bÞ provides the information on the frequency domain of a signal, WR(s, b) is important to identify
the minima and maxima of a signal with regard to frequency (Farge, 1992). The choice of appropriate mother wavelet
depends on the information we need to extract from the signal (Rinoshika and Zhou, 2005b). For example, information
extracted using the Mexican hat wavelet is highly localized in the time domain and poorly localized in the frequency
domain. The Gabor wavelet has a good frequency resolution but a poor time resolution, compared with the Mexican
hat; its frequency resolution is however poorer, although its time resolution is better, than the Morlet wavelet. The
Morlet wavelet is used herein and is expressed as:
CðtÞ ¼ p�1=4 eio0t e�t2=2, (2)
where o0 is the wave number in the Morlet wavelet, chosen to be 6.0 to satisfy the admissibility condition (Farge, 1992;
Li, 1997). At this value of o0, the relation between scales, s, and Fourier frequencies is f ¼ 1/(1.03s) (Torrence and
Compo, 1998). Given wavelet transforms W1(s, b) and W2(s, b) of two time series, the cross-wavelet spectrum W12(s, b)
is defined by
W 12ðs; bÞ ¼W 1ðs; bÞW#2 ðs; bÞ, (3)
0
0.005
0.01
0 100 200 300
67110
0
0.0005
0.001
0 100 200 300
67
110
110 Hz(Std = 0.196)
5.5d
100 67
110
110 67
11069
11067
11067
110
110
0.6
1.0
1.4
1.8
2.2
2.6
3.0
3.4
3.8
11067
110
110
110
110
110
110
110
110
110
x/D
1.0 4.0
y/D
67
67
65
71
67
112
67
67
70
110
22.0
65
59110
69
110
67
0.000
0.020
0.040
0 100 200 300
67
8.3
112
0 100 200 300
f
110 Hz
110
67
0 100 200 300
0 100 200 300
110
0
0.02
0.04
0.06
Eu
0.00
0.01
0.02
0.03
Eu
0.00
0.01
0.02
Eu
67 Hz (StD= fsD/U = 0.12)
Fig. 2. The power spectral density function of hot-wire signals for d/D ¼ 1.0 (d ¼ 25mm, D ¼ 25mm).

ARTICLE IN PRESSMd. Mahbub Alam, Y. Zhou / Journal of Fluids and Structures 24 (2008) 505–526510
where W#2 ðs; bÞ is the complex conjugate of W2(s, b). If the analysis is carried out based on a complex wavelet, as with
the Morlet wavelet used herein, the cross-wavelet spectrum W12(s, b) is also complex, and hence W12(s, b) consists of real
and imaginary parts, i.e., W R12ðs; bÞ and W I
12ðs; bÞ. The cross-wavelet W12(s, b) reflects the similarity (coherence) between
the signals in terms of both frequency and localization (in time space). More details of wavelet and cross-wavelet
analysis could be found in Torrence and Compo (1998) and Alam et al. (2003c).
4. Results and discussion
4.1. Vortex shedding frequency
Fig. 2 presents the typical power spectral density functions (Eu) of the measured hot-wire signals for d/D ¼ 1.0. A
table is inserted in the figure to list frequencies at which the pronounced peaks in Eu occur. A single pronounced peak
occurs at 110Hz in Eu of signal u, measured in the gap of the two cylinders, indicating the frequency, fs, of vortex
t (sec)
f (H
z)
Min Max
0 0.05 0.1 0.15 0.2 0.25 0.3 0.35 0.4 0.45 0.5 0.55 0.6 0.65 0.7 0.75
40
60
80
100
120
140
f (H
z)
40
60
80
100
120
140
f (H
z)
40
60
80
100
120
140
Fig. 3. Wavelet scalogram of hot-wire signals (d/D ¼ 1.0): (a) between cylinders, (b) behind cylinders (x/D ¼ 4, y/D ¼ 1.4), and (c)
cross-wavelet scalogram of the two hot-wire signals. The outer contour enclosed 80% of maximum energy.

ARTICLE IN PRESSMd. Mahbub Alam, Y. Zhou / Journal of Fluids and Structures 24 (2008) 505–526 511
shedding from the upstream cylinder. The corresponding Strouhal number, Std ( ¼ fsd/UN), is 0.196, approximately
equal to the presently measured value (0.198) behind an isolated cylinder. However, two peaks are identifiable in Eu
behind the cylinders. The one at f ¼ 110Hz is rather pronounced and is the same as measured between the cylinders,
and the other occurs at 67Hz or StD ¼ fsD/UN ¼ 0.12. The peak at Std ¼ 0.196 is detected across the wake, over
y/d ¼ 0–3.8, from x/D ¼ 1 to 4, but is identifiable only for y/d ¼ 3–3.8 at x/D ¼ 22. The observation is consistent with
previous reports at similar Re and L/d (Xu and Zhou, 2004; Zhou and Yiu, 2006). The peak at St ¼ 0.12 is barely
identifiable, which is probably why this St value has been overlooked in previous measurements (Igarashi, 1984; Kiya
et al., 1980; Xu and Zhou, 2004; Zhou and Yiu, 2006). At a close vicinity of the downstream cylinder, this peak is
detectable only within the central region of the wake, e.g., at y/do0.6 at x/D ¼ 1. This detectable region grows laterally
downstream, up to y/d ¼ 3.0 at x/D ¼ 4 and y/d ¼ 3.4 at x/D ¼ 22. Furthermore, this peak becomes weaker with
increasing y/D. The observation suggests that vortex shedding from the downstream cylinder be responsible for the
peak at StD ¼ 0.12. The peak at 67 and 110Hz becomes stronger and weaker, respectively, with increasing x/D,
implying that, while the vortices of 110Hz decay downstream, those of 67Hz grows. The power spectrum displays a
peak at 8.3Hz at x/D ¼ 22 and y/D ¼ 1.0, which is probably caused by a low frequency noise.
Ishigai et al. (1972) and Igarashi (1984) reported a bi-stable flow phenomenon, that is, the stable reattachment and
co-shedding occur intermittently at the same L/d and Re. Xu and Zhou (2004) found a different bi-stable flow
phenomenon, where two stable flow states, i.e., the shear layer rollup behind and reattachment on the downstream
cylinder, may co-exist at the same L/d ( ¼ 2–3) and Re, though not necessarily in time. Both bi-stable phenomena are
associated with the simultaneous occurrence of two distinct Strouhal numbers. The present observation differs from the
bi-stable phenomena. Due to a disparity in incident flow conditions, the shear layers around the upstream cylinder
should be associated with different instability frequencies compared to those around the downstream cylinder, thus
resulting in two distinct Strouhal numbers observed behind the downstream cylinder.
Raw signal (TH)
(x/D=4, y/D=1.4)
Band-pass
filtered signal
(100-120 Hz)
Band-pass
filtered signal
(50-80 Hz)
Raw signal (FH)
(x’/d=2, y’/d=1)
Band-pass
filtered signal
(100-120 Hz)
Band-pass
filtered signal
(50-80 Hz)
In t
he
gap
of
the
cyli
nder
sB
ehin
d t
he
dow
nst
ream
cyli
nder
0 0.05 0.1 0.15 0.2 0.25 0.3 0.35 0.4 0.45 0.5 0.55 0.6 0.65 0.7 0.75
t (sec)
Fig. 4. Hot-wire signals (d/D ¼ 1.0) and their band-pass filtered signals. The ordinate of the FH raw signal and its band-pass filtered
signals are scaled from �0.4 to 0.4V and that of the TH raw signal and its band-pass filtered signals are �0.75 to +0.75V.

ARTICLE IN PRESSMd. Mahbub Alam, Y. Zhou / Journal of Fluids and Structures 24 (2008) 505–526512
The occurrence of the peak at Std ¼ 0.196 behind the cylinders may be ascribed to two different scenarios: (i) the
advection and/or impingement of vortices shed from the upstream cylinder; (ii) an intermittent lock-in of vortex
shedding from the downstream cylinder to vortices adveceted from the upstream cylinder. Fig. 3 shows the wavelet and
cross-wavelet analysis results of FH and TH signals measured simultaneously between and behind the cylinders,
respectively. A close examination of the figure unveils that vortex shedding from the upstream cylinder occurs at a
frequency of 110Hz (Fig. 3(a)), while that from the downstream is 110Hz, e.g., at time t ¼ 0.12–0.18 s and 0.26–0.33 s
in Fig. 3(b) and 67Hz, e.g., at t ¼ 0.02–0.06 s and 0.18–0.26 s. The higher vortex frequency (110Hz) appears in two
modes, i.e., simultaneously with the lower vortex frequency (e.g. at t ¼ 0.02–0.03 s, 0.08–0.1 s, 0.44–0.47 s, 0.58–0.6 s)
and in the absence of the lower vortex frequency (e.g. at t ¼ 0.12–0.18 s, 0.26–0.33 s, 0.37–0.38 s). In the first mode,
vortex shedding from the downstream cylinder occurs at 67Hz and co-exists with the vortices of 110Hz advected from
the upstream cylinder; in the second mode, vortex shedding from the downstream cylinder is locked-in with the
frequency of vortices originating from the upstream cylinder. The lock-in of the two shedding processes may be
identified unequivocally from the cross-wavelet (Fig. 3(c)) in terms of the lock-in instant, duration and intermittency.
Apparently, the lock-in occurs at a frequecny of 110Hz and at a time t when the wavelet scalogram is concentrated, e.g.,
at t ¼ 0.12–0.18 s and 0.26–0.33 s.
The above observation could also be extracted from the digitally band-pass filtered signals of the fluctuating velocity
between and behind the cylinders (Fig. 4). As two dominant frequencies were detected at 67 and 110Hz behind the
downstream cylinder, the TH signal at x/D ¼ 4 and y/D ¼ 1.4 was band-pass filtered with a band of 50–80Hz and
100–120Hz, respectively, in order to extract information in the signals around the central frequencies of 67 and 110Hz,
respectively (Fig. 4(d–f)). The FH signal is also filtered at the same band-pass frequencies (Fig. 4(a–c)). Both raw and
filtered FH signal fail to show the presence of the frequecny component of 67Hz in the gap of the cylinders. On the
other hand, both raw and filtered TH signals contain the two frequency components of 67 and 110Hz, suggesting that
vortices may switch from one frequency to the other, or may occur simultatneously at both high and low frequencies, as
observed in the wavelet analysis results. For example, the TH signal exhibits the frequecny of 110Hz at t ¼ 0–0.02 s
(Fig. 4(e)), and the frequencies of both 67 and 110Hz at t ¼ 0.02–0.03 s (Fig. 4(e, f)) and only the frequecny of 67Hz at
f
0
0.010.02
0.03
0.04
0 100 200 300
133
0
0.002
0.004
0 100 200 300
74133
0
0.000005
0.00001
0 100 200 300
133
0
0.000005
0.00001
0.000015
0.00002
0 100 200 300
74
0.6
1.0
1.4
1.8
2.2
2.6
3.0
3.4
3.8
5.5d
x/D
y/D
133 Hz(Std=0.19)
133
1.0
74
74133
74133
13374
133
133
133
133
4.0
74
74
74
130
13274
13374
13374
13374
133
133
22.0
74
60
74
74
74
74
74
74
74 Hz (StD= 0.13)
74
131
133
13374
74 133
0.000
0.020
0.040
0 100 200 300
133133133
133
74
0.000
0.020
0.040
0.060
0 100 200 300
133
74
Fig. 5. The power spectral density function of hot-wire signals for d/D ¼ 0.8 (d ¼ 20mm, D ¼ 25mm).

ARTICLE IN PRESSMd. Mahbub Alam, Y. Zhou / Journal of Fluids and Structures 24 (2008) 505–526 513
t ¼ 0.03–0.08 s (Fig. 4(f)), then again both at t ¼ 0.08–0.1 s (Fig. 4(e, f)), and then returns to the frequecny of 110Hz at
t ¼ 0.11–0.18 s (Fig. 4(e)).
In their investigation of the lateral vibrations of two tandem cylinders (L/D ¼ 6.5) of the same diameter in a free
surface water channel, King and Johnes (1976) obserevd two peaks in the dependence of the measured vibraion
amlitude of the downstream cylinder on the reduced velocity Ur ( ¼ UN/nD, where n is the structural natural frequecny
of the cylinders), one at Ur ¼ 5.5 and the other at Ur ¼ 7.5. The one at Ur ¼ 5.5 (St ¼ 1/Ur ¼ 0.182) resulted from the
excittation at the frequency of vortex shedding from the upstream cylinder. However, they could not explain the other
peak at Ur ¼ 7.5, which was more pronounced than that at Ur ¼ 5.5. Since Ur ¼ 7.5 corresponds to St ¼ 0.13, the
frequencies, at which their observed peaks occurred, agree well with the presently measured Std ¼ 0.196 and StD ¼ 0.12,
respectively. We may offer one explanation from the present findings, that is, their peak at Ur ¼ 7.5 resulted from the
excitation of vortex shedding from the downstream cylinder.
Fig. 5 presents Eu for d/D ¼ 0.8. The frequencies of vortex shedding from the upstream and downstream cylinders are
133Hz or Std ¼ 0.19 and 74Hz or StD ¼ 0.13, respectively. The peak at 74Hz in Eu measured behind the downstream
cylinder is more significant than that for d/D ¼ 1.0, and is discernible up to y/D ¼ 1.8 at x/D ¼ 1.0. The cross-wavelet
scalogram displays concentrations around 133Hz, e.g., at t ¼ 0.11–0.15 s, 0.33–0.35 s, 0.54–0.57 s in Fig. 6(c), indicating
the intermittent lock-in of vortex shedding from the downstream cylinder with that from the upstream. The wavelet
scalogram of the signals measured behind the downstream cylinder shows from time to time concentrations
f (H
z)
t (sec)
Min Max
0 0.05 0.1 0.15 0.2 0.25 0.3 0.35 0.4 0.45 0.5 0.55 0.6 0.65 0.7 0.75
40
60
80
100
120
140
f (H
z)
160
40
60
80
100
120
140
160
f (H
z)
40
60
80
100
120
140
160
Fig. 6. Wavelet scalogram of hot-wire signals at d/D ¼ 0.8: (a) between cylinders, (b) behind cylinders (x/D ¼ 4, y/D ¼ 1.0), and (c)
cross-wavelet scalogram of the two hot-wire signals. The outer contour line enclosed 80% of maximum energy.

ARTICLE IN PRESS
83 Hz (StD= 0.149)
0
0.0005
0.001
0.0015
0.002
0 100 200 300
f
166
83
0
2E-06
4E-06
0 100 200 300
0.6
1.0
1.4
1.8
2.2
2.6
3.0
3.4
3.8
5.5d
x/D
y/D
166 Hz(Std=0.178)
83
83
83
83
83
1.0
83
4.0
83166
83
166
16683
83166
22.0
166
166
166
166
166
166
166
166
83
83
83
83
83
83
83
166
83
83
83
83
83
83
83
83
83
166
166
166
0.00E+00
2.00E-03
4.00E-03
6.00E-03
8.00E-03
0 100 200 300
166
83
0.00E+00
1.00E-05
2.00E-05
3.00E-05
0 100 200 300
83
166
Fig. 7. The power spectral density function of hot-wire signals for d/D ¼ 0.6 (d ¼ 15mm, D ¼ 25mm).
106 Hz (StD= 0.189)
0
0.000005
0.00001
0 100 200 300
f
232
0
0.0005
0.001
0.0015
0 100 200 300
106 232
5.5D
x/D232 Hz(Std=0.166)
0.000
0.020
0.040
0.060
0.080 106
0 100 200 300
232
0.000
0.010
0.020106
0 100 200 300
106
0.000
0.030
0.060
0.090
0 100 200 300
0.6
1.0
1.4
1.8
2.2
2.6
3.0
3.4
3.8
y/D
22.0
106
106
1.0
232106
232106
232
232106
106
112
4.0
106
106
106
106
106
106
106
106
106
106
106
106
106
106
106
106
232
232
106
106 106 106
0.000
0.030
0.060106
0 100 200 300
106
Fig. 8. The power spectral density function of hot-wire signals for d/D ¼ 0.4 (d ¼ 10mm, D ¼ 25mm).
Md. Mahbub Alam, Y. Zhou / Journal of Fluids and Structures 24 (2008) 505–526514

ARTICLE IN PRESS
t (sec)
f (H
z)
Min Max
0 0.15 0.3 0.45 0.6 0.75
80
120
160
200
240
280
f (H
z)
80
120
160
200
240
280
f (H
z)
80
120
160
200
240
280
Fig. 9. Wavelet scalogram of hot-wire signals at d/D ¼ 0.4: (a) between cylinders, (b) behind cylinders (x/D ¼ 1, y/D ¼ 1), and (c)
cross-wavelet scalogram of the two hot-wire signals. The outer contour line enclosed 80% of maximum energy.
Md. Mahbub Alam, Y. Zhou / Journal of Fluids and Structures 24 (2008) 505–526 515
simultaneously around 133 and 74Hz, e.g., at t ¼ 0.09–0.1 s, 0.2–0.21 s, 0.27–0.29 s in Fig. 6(b). Similar observations
are made for d/D ¼ 0.6 (Fig. 7) and 0.4 (Fig. 8). For d/D ¼ 0.6, the peak at 166Hz is more pronounced at x/D ¼ 1 than
at 83Hz, but becomes weaker at x/D ¼ 4. By x/D ¼ 22, the peak at 166Hz vanishes completely. For d/D ¼ 0.4, the
low-frequency peak overwhelms the high-frequency peak even at x/D ¼ 1, the latter being discernible only at
y/D ¼ 0.6–2.6. In fact, the high frequency peak cannot be observed at x/DX4. The wavelet and cross-wavelet
scalograms at d/D ¼ 0.4 (Fig. 9) shows that the vortex shedding from the downstream cylinder is intermittently locked-
in with the vortices originating from the upstream cylinder; however, the lock-in duration shrinks considerably,
compared with larger d/D.
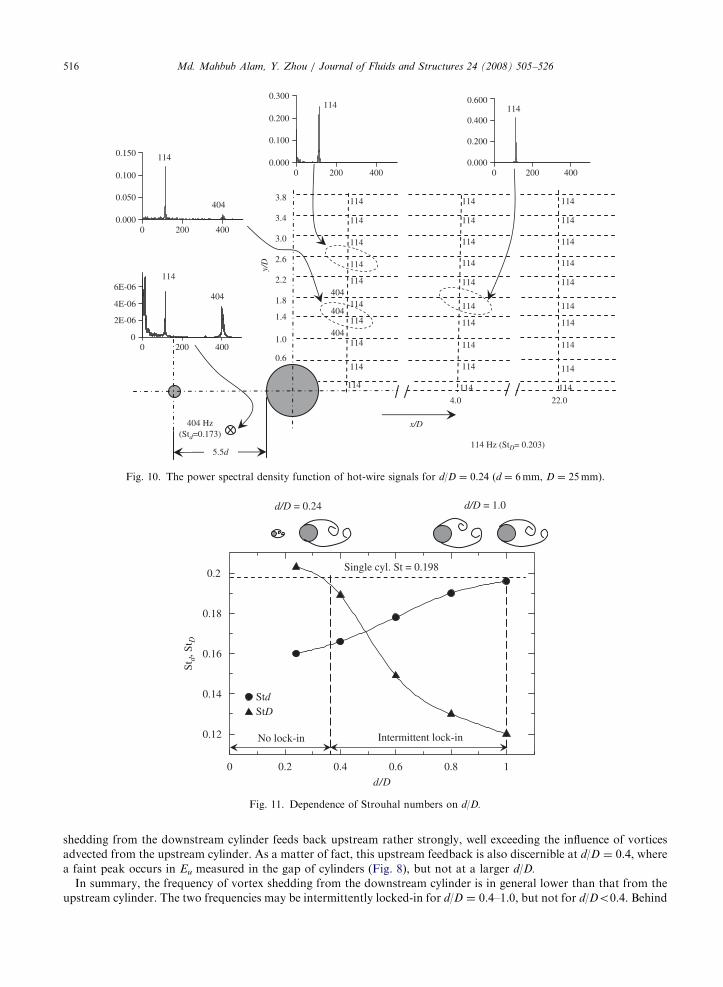
As d/D drops to 0.24 (Fig. 10), two pronounced peaks were observed at 404Hz or Std ¼ 0.173 and 114Hz or
StD ¼ 0.203 in the gap of the two cylinders. The former originates from vortex shedding from the upstream cylinder and
is absent behind the downstream cylinder, except a tiny hump at x/D ¼ 1 and y/D ¼ 1–1.8 (see Eu at y/D ¼ 1.4 and
x/D ¼ 1). The latter occurs at x/D40, apparently resulting from vortex shedding from the downstream cylinder. Being
very small compared with the downstream cylinder, the upstream cylinder produces very weak vortices, which fail to
lock in vortex shedding from the downstream cylinder. Interestingly, the hot-wire in the gap of the cylinders captures
quite convincingly the information on vortex shedding from the downstream cylinder, suggesting that alternate vortex
ARTICLE IN PRESS
114 Hz (StD= 0.203)
0
2E-06
4E-06
6E-06
0 200 400
114
404
0.6
1.0
1.4
1.8
2.2
2.6
3.0
3.4
3.8
5.5d
x/D
y/D
404 Hz(Std=0.173)
114
4.0
114
114
114
114
114
114
114
114
114
114
114
114
114
114
114
114
114
404
404
404
22.0
114
114
114
114
114
114
114
114
1140.000
0.050
0.100
0.150
0 200 400
404
1140.000
0.100
0.200
0.300
0 200 4000.000
0.200
0.400
0.600
0 200 400
114 114
114114114
Fig. 10. The power spectral density function of hot-wire signals for d/D ¼ 0.24 (d ¼ 6mm, D ¼ 25mm).
0 0.2 0.4 0.6 0.8 1
d/D
StdStD
Single cyl. St = 0.198
d/D = 0.24 d/D = 1.0
Intermittent lock-inNo lock-in0.12
0.14
0.16
0.18
0.2
Std,
St D
Fig. 11. Dependence of Strouhal numbers on d/D.
Md. Mahbub Alam, Y. Zhou / Journal of Fluids and Structures 24 (2008) 505–526516
shedding from the downstream cylinder feeds back upstream rather strongly, well exceeding the influence of vortices
advected from the upstream cylinder. As a matter of fact, this upstream feedback is also discernible at d/D ¼ 0.4, where
a faint peak occurs in Eu measured in the gap of cylinders (Fig. 8), but not at a larger d/D.
In summary, the frequency of vortex shedding from the downstream cylinder is in general lower than that from the
upstream cylinder. The two frequencies may be intermittently locked-in for d/D ¼ 0.4–1.0, but not for d/Do0.4. Behind

ARTICLE IN PRESSMd. Mahbub Alam, Y. Zhou / Journal of Fluids and Structures 24 (2008) 505–526 517
the cylinders, the y/D range where the high-frequency vortices are captured diminishes with declining d/D, because of
weakened vortices from the upstream cylinder. Accordingly, the peak of the lower frequency grows in Eu, compared
with that of the higher frequency. The observation is linked to an increasing incident flow velocity, at a smaller d/D, to
the downstream cylinder.
Fig. 11 summarizes the dependence on d/D of Std and StD, associated with the upstream and downstream cylinders,
respectively. The Strouhal number measured herein (St ¼ 0.198) behind an isolated circular cylinder is also given. At
d/D ¼ 1.0, Std is 0.196, very close to St. The value of Std displays a variation opposite to that of StD; Std decreases for a
smaller d/D. It is likely that the downstream cylinder acts to block the flow. This effect is more significant at small d/D,
which may prolong the period of vortex shedding from the upstream cylinder, thus decreasing Std. On the other hand,
StD increases with decreasing d/D. At d/D ¼ 1.0, StD is rather small, 0.12, because the approaching gap flow velocity at
the downstream cylinder is significantly lower than that at the upstream cylinder or a single isolated cylinder. With
decreasing d/D, the upstream cylinder wake becomes narrower and the flow velocity approaching the upstream side of
the downstream cylinder increases (as will be discussed in Sections 4.2.1 and 4.2.2), resulting in an increase in StD.
Fig. 12. Photographs of wake in the gap with change in d/D: (a) d/D ¼ 1, (b) 0.8, (c) 0.6, (d) 0.4, and (e) 0.24.

ARTICLE IN PRESSMd. Mahbub Alam, Y. Zhou / Journal of Fluids and Structures 24 (2008) 505–526518
4.2. Flow structure
4.2.1. Vortex street
Fig. 12 presents typical photographs from laser-induced fluorescence flow visualization of the flow between the
cylinders at various d/D. With decreasing d/D, the upstream-cylinder wake narrows and the size of vortices appears
smaller. However, the vortex street is qualitatively unchanged. The advected alternately arranged vortices impinge upon
the downstream cylinder; and the impinging width across the downstream cylinder diminishes, with respect to the scale
of the downstream cylinder wake, with decreasing d/D. The observation is consistent with the absence of the higher
frequency peak in Eu at y/D42.6 (x/D ¼ 1) for d/D ¼ 0.4 (Fig. 8) and at y/D41.8 (x/D ¼ 1) for d/D ¼ 0.24 (Fig. 10).
The alternating vortex impingement upon the downstream cylinder acts essentially as a quasi-periodic excitation, thus
locking-in vortex shedding from the downstream cylinder given adequate strength. The present data demonstrate that
vortex shedding from the downstream cylinder is almost completely locked-in with this excitation at d/D ¼ 1, but only
intermittently for 0.4pd/Do1 because of the reduced strength of excitation. The excitation is too weak to lock in
vortex shedding from the downstream cylinder at d/Do0.4.
Two types of vortex shedding from the downstream cylinder were observed in flow visualization for d/D ¼ 0.4–1.0,
one coupled (locked-in) with vortex shedding from the upstream cylinder at the higher dominant frequency and the
other decoupled at the lower dominant frequency. They switched frequently from one to the other, as observed in the
hot-wire signals. Fig. 13 shows typical photographs taken behind the downstream cylinder (d/D ¼ 0.4). By counting
vortices shed from the cylinders within a given duration, the frequencies of coupled and decoupled vortex shedding
from the downstream cylinder may be estimated. In the decoupled case (Fig. 13(a)), vortex shedding from the
downstream cylinder was at a frequency lower than from the upstream cylinder, and the flow structure was
characterized by an alternate vortex street. In the coupled case (Fig. 13(b)), a higher vortex frequency was detected in
the very near wake. Note that the vortices at x/Do5 appear at a higher frequency than further downstream, consistent
with the hot-wire measurement (Section 4.1). When advected downstream, the high frequency vortices are unstable and
reorganize themselves to the lower frequency, which is determined by the inherent instabilities of shear layers in the
wake of the two tandem cylinders.
Fig. 13. Distinct flow structures captured at different instants behind the downstream cylinder, d/D ¼ 0.4, ReD ¼ 450. (a) Low-
frequency vortices generated by the downstream cylinder, which are decoupled from those shed from the upstream cylinder. (b) High-
frequency vortices generated by the downstream cylinder (x/Do5), which are coupled with those originating from the upstream
cylinder. Note the low-frequency vortices at x/D45.

ARTICLE IN PRESS
12:11:17
A1
A2A3A4
B1
B2B3B4
12:14:12
A1
A2A3A4
B4 B1
B2
B3B5
A5
12:17:13
A1
A2
A3
A4
B1
B2B4-3
B5
A6
A5
(a)
(b)
(c)
A5-3A6
B5B6 B4-3
A2A7
12:24:06
A5-3
B4-3
B5B5
B6B7
A6
A7
12:27:16
(f)
(e)
Part o
f A3
12:20:11
A1
A2
A3
A4
B 4-3 B2
B5
A6
B6
A5A7
(d)
0 1 2 3 4 5 6 7 8 9 10 11 12 13
x/D
Fig. 14. Sequential photographs of the wake behind the downstream cylinder, illustrating the vortex evolution from high frequency to
low frequency (d/D ¼ 0.4).
Md. Mahbub Alam, Y. Zhou / Journal of Fluids and Structures 24 (2008) 505–526 519
ARTICLE IN PRESS
x'/d
1.9 2.21.4
1.72.1
1.3
1 2 3 4 5
1 2 3 4 5 6
0.70
y/D
1.7
1.6
1.3
1.5
y/D
x/D
2.01.3 1.1
1.1 1.0
-2
-1
0
1
2
-2
-1
0
1
2
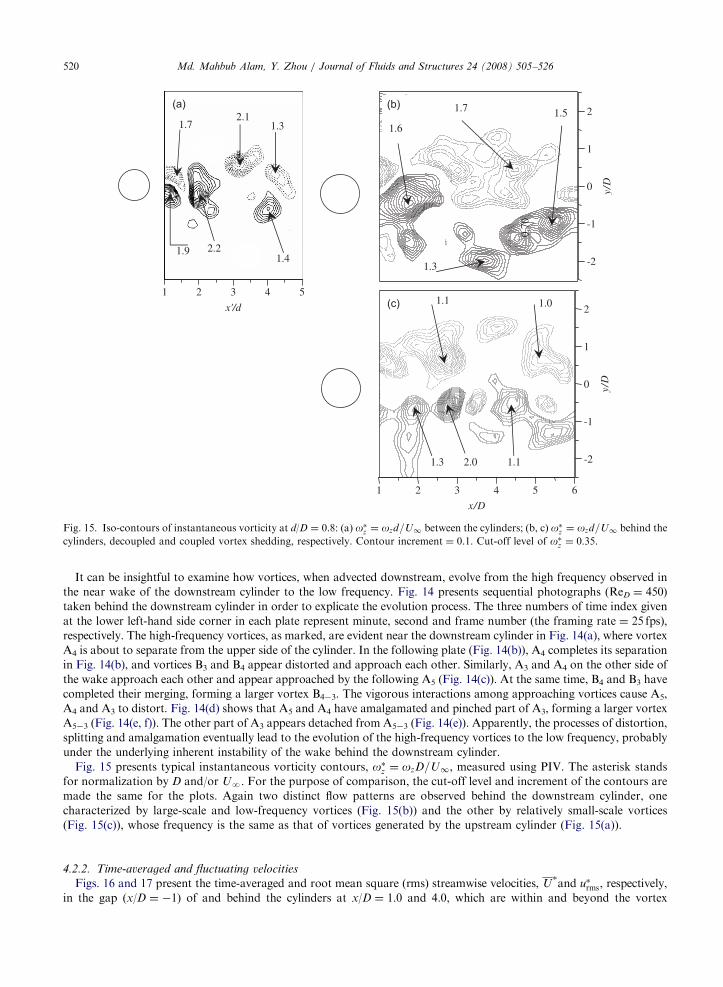
Fig. 15. Iso-contours of instantaneous vorticity at d/D ¼ 0.8: (a) o�z ¼ ozd=U1 between the cylinders; (b, c) o�z ¼ ozd=U1 behind the
cylinders, decoupled and coupled vortex shedding, respectively. Contour increment ¼ 0.1. Cut-off level of o�z ¼ 0:35.
Md. Mahbub Alam, Y. Zhou / Journal of Fluids and Structures 24 (2008) 505–526520
It can be insightful to examine how vortices, when advected downstream, evolve from the high frequency observed in
the near wake of the downstream cylinder to the low frequency. Fig. 14 presents sequential photographs (ReD ¼ 450)
taken behind the downstream cylinder in order to explicate the evolution process. The three numbers of time index given
at the lower left-hand side corner in each plate represent minute, second and frame number (the framing rate ¼ 25 fps),
respectively. The high-frequency vortices, as marked, are evident near the downstream cylinder in Fig. 14(a), where vortex
A4 is about to separate from the upper side of the cylinder. In the following plate (Fig. 14(b)), A4 completes its separation
in Fig. 14(b), and vortices B3 and B4 appear distorted and approach each other. Similarly, A3 and A4 on the other side of
the wake approach each other and appear approached by the following A5 (Fig. 14(c)). At the same time, B4 and B3 have
completed their merging, forming a larger vortex B4�3. The vigorous interactions among approaching vortices cause A5,
A4 and A3 to distort. Fig. 14(d) shows that A5 and A4 have amalgamated and pinched part of A3, forming a larger vortex
A5�3 (Fig. 14(e, f)). The other part of A3 appears detached from A5�3 (Fig. 14(e)). Apparently, the processes of distortion,
splitting and amalgamation eventually lead to the evolution of the high-frequency vortices to the low frequency, probably
under the underlying inherent instability of the wake behind the downstream cylinder.
Fig. 15 presents typical instantaneous vorticity contours, o�z ¼ ozD=U1, measured using PIV. The asterisk stands
for normalization by D and/or UN. For the purpose of comparison, the cut-off level and increment of the contours are
made the same for the plots. Again two distinct flow patterns are observed behind the downstream cylinder, one
characterized by large-scale and low-frequency vortices (Fig. 15(b)) and the other by relatively small-scale vortices
(Fig. 15(c)), whose frequency is the same as that of vortices generated by the upstream cylinder (Fig. 15(a)).
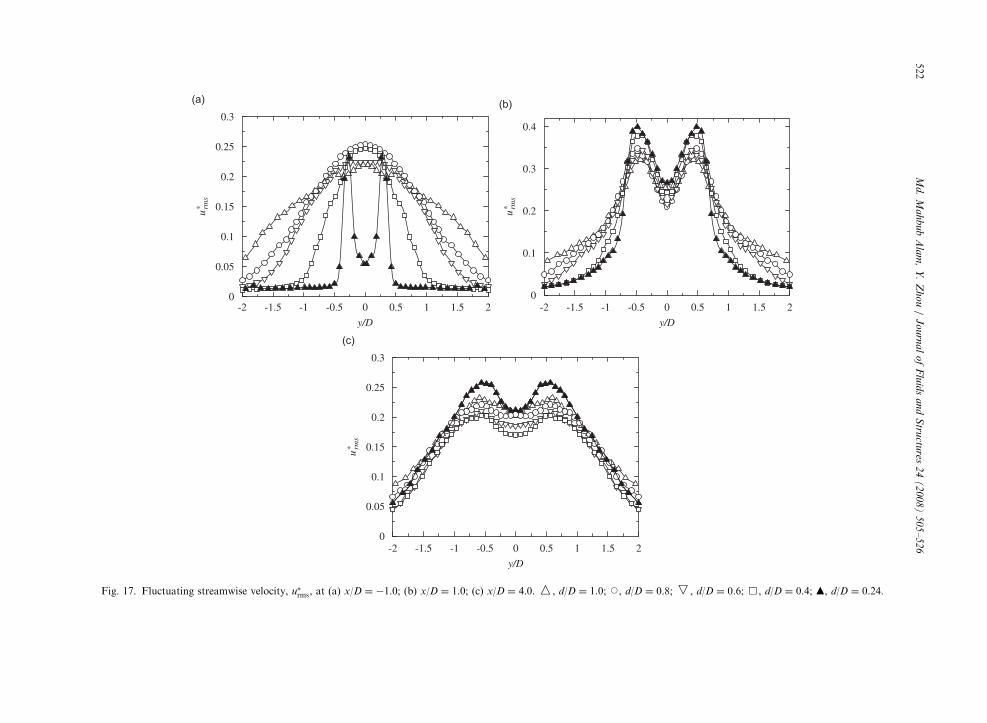
4.2.2. Time-averaged and fluctuating velocities
Figs. 16 and 17 present the time-averaged and root mean square (rms) streamwise velocities, U�and u�rms, respectively,
in the gap (x/D ¼ �1) of and behind the cylinders at x/D ¼ 1.0 and 4.0, which are within and beyond the vortex

ARTIC
LEIN
PRES
S
-2 -1.5 -1 -0.5 0 0.5 1 1.5 20.5
0.6
0.7
0.8
0.9
1
y/D
-2 -1.5 -1 -0.5 0 0.5 1 1.5 2
0.5 1 1.5 2 2.5
1
1.1
1.2
y/D
-2 -1.5 -1 -0.5 0 0.5 1 1.5 2
y/D
0
0.2
0.4
0.6
0.8
1
1.2
U*
U*
0
0.2
-0.2
0.4
0.6
0.8
1
1.2
U*
Fig. 16. Time-averaged velocity, U�, at (a) x/D ¼ �1.0; (b) x/D ¼ 1.0; (c) x/D ¼ 4.0. W, d/D ¼ 1.0; J, d/D ¼ 0.8; r, d/D ¼ 0.6; &, d/D ¼ 0.4; m, d/D ¼ 0.24.
Md
.M
ah
bu
bA
lam
,Y
.Z
ho
u/
Jo
urn
al
of
Flu
ids
an
dS
tructu
res2
4(
20
08
)5
05
–5
26
521
ARTIC
LEIN
PRES
S
-2 -1.5 -1 -0.5 0 0.5 1 1.5 20
0.05
0.1
0.15
0.2
0.25
0.3
u∗ rm
s
y/D
-2 -1.5 -1 -0.5 0 0.5 1 1.5 20
0.1
0.2
0.3
0.4
y/D
u∗ rm
s
-2 -1.5 -1 -0.5 0 0.5 1 1.5 20
0.05
0.1
0.15
0.2
0.25
0.3
y/D
u∗ rm
s
Fig. 17. Fluctuating streamwise velocity, u�rms, at (a) x/D ¼ �1.0; (b) x/D ¼ 1.0; (c) x/D ¼ 4.0. W, d/D ¼ 1.0; J, d/D ¼ 0.8; X, d/D ¼ 0.6; &, d/D ¼ 0.4; m, d/D ¼ 0.24.
Md
.M
ah
bu
bA
lam
,Y
.Z
ho
u/
Jo
urn
al
of
Flu
ids
an
dS
tructu
res2
4(
20
08
)5
05
–5
26
522

ARTICLE IN PRESS
0.2 0.4 0.6 0.8 1
d/D
d/D=0.24 d/D=1.0
Single cylinder:
0
0.1
0.2
0.3
0.4
0.5
0.6
0.7
0.8
0.9
1
1.1
1.2
CD
CDrms
CLrmsCD
, CD
rms,
CL
rms
CD=1.11CDrms=0.09
CLrms=0.16,
Fig. 18. Dependence on d/D of CD, CDrms and CLrms on the downstream cylinder.
Md. Mahbub Alam, Y. Zhou / Journal of Fluids and Structures 24 (2008) 505–526 523
formation length, respectively. At x/D ¼ �1, the centerline deficit 1�U�increases with decreasing d/D (Fig. 16(a)). The
same is observed at x/D ¼ 1.0 (Fig. 16(b)) but the opposite occurs at x/D ¼ 4.0 (Fig. 16(c)). It may be inferred from the
streamwise variation of 1�U�with d/D (Fig. 16(b, c)) that the velocity recovery rate is higher for smaller d/D, implying a
higher entrainment rate of free-stream fluid into the wake (Alam and Zhou, 2007b). The observation may also suggest
larger vortex strength behind the downstream cylinder and hence an increasing time-averaged drag with decreasing d/D,
which will be later confirmed by measured forces on the downstream cylinder. The lateral distributions of both U�
(Fig. 16(a)) and u�rms (Fig. 17(a)) appear to be narrowing with declining d/D, suggesting a smaller wake width and vortex
size in the gap between the cylinders, consistent with the observation in Fig. 12. Being within the vortex formation region,
U�at x/D ¼ 1.0 (Fig. 16(b)) may represent the velocity distribution of free shear layer separating from the downstream
cylinder. The maximum U�is 1.06, 1.08, 1.10, 1.13 and 1.19 for d/D ¼ 1.0, 0.8, 0.6, 0.4 and 0.24, respectively, that is, the
free shear layer velocity around the downstream cylinder increases with decreasing d/D, implying an increasing time-
averaged drag (Roshko, 1954). Furthermore, the U�peak (see the insert of Fig. 16(b)) becomes narrower for smaller d/D,
suggesting that the free shear layer around the downstream cylinder becomes thinner, conforming to the observation from
Fig. 12. This narrowing shear layer is also evident in u�rms (Fig. 17(b)). A narrowing shear layer in general corresponds to a
higher drag (Nakaguchi et al., 1968) as well as a higher Strouhal number (Roshko, 1954).
The u�rms value over y/D ¼ �1.0–1.0 at x/D ¼ 4 (Fig. 17(c)) decreases from d/D ¼ 1.0 to 0.4 but increases from
d/D ¼ 0.4 to 0.24. Since vortices from the upstream cylinder impinge on the downstream cylinder, u�rms behind the
downstream cylinder is expected to be dependent on the strength of the vortices and how the vortices interact with the
shear layer separation from the downstream cylinder. The decrease in u�rms with decreasing d/D from 1.0 to 0.4 is
probably due to the combined effect of the decreasing strength of impinging vortices and the intermittent lock-in of the
two vortex shedding process. The increase of u�rms from d/D ¼ 0.4 to 0.24 may be attributed to the fact that the two
vortex shedding processes are not locked-in with each other at d/D ¼ 0.24.
4.3. Forces on the downstream cylinder
Fig. 18 presents time-averaged drag (CD), fluctuating drag (CDrms) and lift (CLrms) on the downstream cylinder. It is
well known that CDrms and CLrms on a cylinder are highly dependent on oncoming flow conditions. For example, CDrms

ARTICLE IN PRESSMd. Mahbub Alam, Y. Zhou / Journal of Fluids and Structures 24 (2008) 505–526524
and CLrms decrease with increasing turbulent intensity (Surry, 1972; Laneville et al., 1975; Nakamura and Ohya, 1984),
but increase with the increasing strength of oncoming vortices (Gursul and Rockwell, 1990; Lee and Smith, 1991;
Rockwell, 1998; Alam et al., 2003a, 2005, 2006). The value of CD increases with decreasing d/D from 1.0 to 0.24,
apparently linked to the increasing approaching flow velocity to the downstream cylinder. The increasing value of CD
with decreasing d/D from 1.0 to 0.24 is consistent with increasing centerline velocity deficit (Fig. 16(b)), narrowing shear
layer thickness (Figs. 16(b), 17(b)) and increasing shear layer velocity (Fig. 16(b)). On the other hand, CDrms and CLrms
decrease for a smaller d/D due to a decrease in the strength of oncoming vortices although the increasing approaching
flow velocity may increase CDrms and CLrms.
5. Conclusions
The wake of two tandem cylinders of different diameters has been experimentally investigated, including the flow
structure, Strouhal numbers and forces. The flow is in the co-shedding regime (L/d ¼ 5.5); the diameter ratio is from 1
to 0.24. The investigation leads to the following conclusions:
1.
One dominant frequency only occurs between the cylinders. However, two are detected behind the two cylinders,including the case of d/D ¼ 1.0, which has not been previously reported. One is identical to that of vortex shedding
from the upstream cylinder, and the other is ascribed to vortex shedding from the downstream cylinder. The
frequency of vortex shedding from the downstream cylinder is lower than that from the upstream cylinder, but the
two are intermittently the same, or ‘locked-in’, for d/DX0.4. While the vortices of the higher frequency decay rapidly
behind the downstream cylinder, those of the lower grow all the way to the farthest downstream distance, i.e.,
x/D ¼ 22, presently examined. Both LIF flow visualization and PIV capture two distinct flow structures behind the
downstream cylinder under the same experimental conditions, one displaying a higher-frequency vortex street that
disappears at x/D45 and the other a lower-frequency street, which is consistent with the analysis of the dominant
vortex frequencies. The intermittent lock-in is not observed for d/Do0.4.
2.
The dimensionless frequency, Std, of vortex shedding from the upstream cylinder declines progressively from 0.196 atd/D ¼ 1 to 0.173 at d/D ¼ 0.24, probably because the downstream cylinder acts to slow down the flow around the
upstream cylinder. On the other hand, the dimensionless frequency, StD, of vortex shedding from the downstream
cylinder increases from ¼ 0.12 at d/D ¼ 1 to 0.203 at d/D ¼ 0.24 due to an increase in the incident flow velocity to
this cylinder.
3.
With decreasing d/D, the time-averaged drag on the downstream cylinder increases, due to less stagnant fluid orlarger dynamic pressure between cylinders. However, the fluctuating forces on this cylinder drop because a smaller
d/D should result in the impaired strength of vortex shedding from the upstream cylinder.
4.
As d/D decreases, the width of the wake between the cylinders appears to narrow. Furthermore, the centerline deficit1�U�at x/D ¼ 1 behind the downstream cylinder increases for smaller d/D, and the velocity recovery rate is
higher, implying a higher entrainment rate due to stronger vortices. The results are internally consistent with the
observed dependence of the time-averaged drag on d /D.
5.
At very small d/D, 0.4 or smaller, the frequency of vortex shedding from the upstream cylinder may be measured inthe gap of the two cylinders, but not behind. As a matter of fact, the Strouhal number, time-averaged drag, and
fluctuating drag and lift associated with the downstream cylinder all approach their counterparts in an isolated
cylinder wake, implying a negligibly small effect of the upstream cylinder on the downstream cylinder wake.
Acknowledgments
Y.Z. wishes to acknowledge support given to him by the Research Grants Council of the Government of the HKSAR
through Grants PolyU B-Q862.
References
Alam, M.M., Sakamoto, H., 2005. Investigation of Strouhal frequencies of two staggered bluff bodies and detection of multistable flow
by wavelets. Journal of Fluids and Structures 20, 425–449.

ARTICLE IN PRESSMd. Mahbub Alam, Y. Zhou / Journal of Fluids and Structures 24 (2008) 505–526 525
Alam, M.M., Zhou, Y., 2007a. Phase lag between vortex sheddings from two tandem bluff bodies. Journal of Fluids and Structure 23
(2), 339–347.
Alam, M.M., Zhou, Y., 2007b. The turbulent wake of an inclined cylinder with water running. Journal of Fluid Mechanics 589,
261–303.
Alam, M.M., Moriya, M., Takai, K., Sakamoto, H., 2003a. Fluctuating fluid forces acting on two circular cylinders in a tandem
arrangement at a subcritical Reynolds number. Journal of Wind Engineering and Industrial Aerodynamics 91, 139–154.
Alam, M.M., Moriya, M., Sakamoto, H., 2003b. Aerodynamic characteristics of two side-by-side circular cylinders and application of
wavelet analysis on the switching phenomenon. Journal of Fluids and Structures 18, 325–346.
Alam, M.M., Sakamoto, H., Moriya, M., 2003c. Reduction of fluid forces acting on a single circular cylinder and two circular cylinders
by using tripping rods. Journal Fluids and Structures 18, 347–366.
Alam, M.M., Sakamoto, H., Zhou, Y., 2005. Determination of flow configurations and fluid forces acting on two staggered circular
cylinders of equal diameter in cross-flow. Journal of Fluids and Structures 21, 363–394.
Alam, M.M., Sakamoto, H., Zhou, Y., 2006. Effect of a T-shaped plate on reduction in fluid forces acting on two tandem circular
cylinders in a cross-flow. Journal of Wind Engineering and Industrial Aerodynamics 94, 525–551.
Daubechies, I., 1990. The wavelet transform, time-frequency localization and signal analysis. IEEE Transaction, Information Theory
36, 961–1005.
Farge, M., 1992. Wavelet transforms and their applications to turbulence. Annual Review of Fluid Mechanics 24, 395–457.
Gursul, I., Rockwell, D., 1990. Vortex-street impinging upon an elliptical leading edge. Journal of Fluid Mechanics 211, 211–242.
Hamdan, M.N., Jubran, B.A., Shabaneh, N.H., Abu-Samak, M., 1996. Comparison of various basic wavelets for the analysis of flow-
induced vibration of a cylinder in cross-flow. Journal of Fluids and Structures 10, 633–651.
Huang, J.F., Zhou, Y., Zhou, T.M., 2006. Three-dimensional wake structure measurement using a modified PIV technique.
Experiments in Fluids 40, 884–896.
Igarashi, T., 1984. Characteristics of the flow around two circular cylinders arranged in tandem (2nd report). Bulletin of the Japan
Society of Mechanical Engineering 27, 2380–2387.
Ishigai, S., Nishikawa, E., Nishimura, E., Cho, K., 1972. Experimental study of structure of gas flow in tube banks axes normal to flow.
Bulletin of the Japan Society of Mechanical Engineering 15, 949–956.
King, R., Johnes, D.J., 1976. Wake interaction experiments with two flexible circular cylinders in flowing water. Journal of Sound and
Vibration 45, 259–283.
Kiya, M., Arie, M., Tamura, H., Mori, H., 1980. Vortex shedding from two circular cylinders in staggered arrangement. ASME
Journal of Fluids Engineering 102, 166–173.
Laneville, A., Gartshore, I.S., Parkinson, G.V., 1975. An explanation of some effects of turbulence on bluff bodies. In:
Proceedings of Fourth International Conference on Winds Effects on Building and Structures, Heathrow, England, K75-363,
pp. 333–341.
Lee, D.J., Smith, C.A., 1991. Effect of vortex core distortion on blade-vortex interaction. AIAA Journal 29, 1355–1363.
Lee, S.J., Lee, S.I., Park, C.W., 2004. Reducing the drag on a circular cylinder by upstream installation of a small control rod. Fluid
Dynamics Research 34, 233–250.
Li, H., 1997. Wavelet auto-correlation analysis applied to eddy structure identification of free turbulent shear flow. International
Journal of the Japan Society of Mechanical Engineers 40, 567–576.
Meneghini, J.R., Saltara, F., Siqueira, C.L.R., Ferrari Jr., J.A., 2001. Numerical simulation of flow interference between two circular
cylinders in tandem and side-by-side arrangement. Journal of Fluids and Structures 15, 327–350.
Nakaguchi, H., Hasimoto, K., Muto, S., 1968. An experimental study of aerodynamic drag on rectangular cylinders. Japan Society of
Aeronautical Space Science 16, 1–5.
Nakamura, Y., Ohya, Y., 1984. The effects of turbulence on the mean flow past a two-dimensional rectangular cylinders. Journal of
Fluid Mechanics 149, 255–273.
Newland, D.E., 1993. An Introduction of Random Vibrations, Spectral and Wavelet Analysis, third ed. London, Longman Scientific
and Technical.
Rinoshika, A., Zhou, Y., 2005a. Effects of initial conditions on a wavelet-decomposed turbulent near-wake. Physical Review E 71,
057504:1-8.
Rinoshika, A., Zhou, Y., 2005b. Orthogonal wavelet multi-resolution analysis of a turbulent cylinder wake. Journal of Fluid
Mechanics 524, 229–248.
Rockwell, D., 1998. Vortex-body interactions. Annual Review of Fluid Mechanics 30, 199–229.
Roshko, A., 1954. On the drag and shedding frequency of two-dimensional bluff bodies. NACA Technical Note No. 3169.
Sakamoto, H., Haniu, H., Obata, Y., 1987. Fluctuating forces acting on two square prisms in a tandem arrangement. Journal of Wind
Engineering and Industrial Aerodynamics 26, 85–103.
Sakamoto, H., Takeuchi, N., Haniu, H., Tan, K., 1997. Suppression of fluid forces acting on square prism by passive control. Journal
of Fluids Engineering 119, 506–511.
Strykowski, P.J., Sreenivasan, K.R., 1990. On the formation and suppression of vortex ‘shedding’ at low Reynolds numbers. Journal of
Fluid Mechanics 218, 71–107.
Surry, D., 1972. Some effects of intense turbulent on the aerodynamic of a circular cylinder at subcritical Reynolds number. Journal of
Fluid Mechanics 52, 543–563.
Torrence, C., Compo, G., 1998. A practical guide to wavelet analysis. Bulletin of the American Meteorological Society 79, 61–78.

ARTICLE IN PRESSMd. Mahbub Alam, Y. Zhou / Journal of Fluids and Structures 24 (2008) 505–526526
West, G.S., Apelt, C.J., 1993. Measurements of fluctuating pressures and forces on a circular cylinder in the Reynolds number range104
to 2.5� 105. Journal of Fluids and Structures 7, 227–244.
Xu, G., Zhou, Y., 2004. Strouhal numbers in the wake of two inline cylinders. Experiments in Fluids 37, 248–256.
Yilmaz, T., Kodal, A., 2000. An analysis on coaxial jet flows using different decomposition techniques. Journal of Fluids and
Structures 14, 359–373.
Yong, R.K., 1998. Wavelet Theory and Its Application, sixth ed. Kluwer Academic Publishers, USA.
Zdravkovich, M.M., 1987. The effects of interference between circular cylinders in cross flow. Journal of Fluids and Structures 1,
239–261.
Zdravkovich, M.M., 1997. Flow Around Circular Cylinders, vol. 1. Fundamentals, Oxford Science Publications.
Zhou, Y., Yiu, M.W., 2006. Flow structure, momentum and heat transport in a two-tandem-cylinder wake. Journal of Fluid
Mechanics 548, 17–48.