Stronger by Degrees: An update to the Council on ...€¦ ·...
32
Stronger by Degrees: An update to the Council on Postsecondary Education on the progress and status of the nonprofit private college sector June 20, 2014 Gary S. Cox, Ph.D President (502) 695-5007 [email protected] http://aikcu.org
Transcript of Stronger by Degrees: An update to the Council on ...€¦ ·...

Stronger by Degrees: An update to the Council on Postsecondary Education on the progress and status
of the nonprofit private college sector!!
June 20, 2014
Gary S. Cox, Ph.D!President!
(502) [email protected]!
http://aikcu.org

2
KRS 164.020(13)!!The Council on Postsecondary Education in Kentucky shall: !Ensure that the state postsecondary system does not unnecessarily duplicate services and programs provided by private postsecondary institutions and shall promote maximum cooperation between the state postsecondary system and private postsecondary institutions. Receive and consider an annual report prepared by the Association of Independent Kentucky Colleges and Universities stating the condition of independent institutions, listing opportunities for more collaboration between the state and independent institutions and other information as appropriate;

AIKCU is the member organization for the 19 private nonprofit, SACSCOC accredited 4-year colleges and universities in Kentucky

AIKCU Sector Profile
• 19 nonprofit private nonprofit colleges and universities (note: in most cases data in this report includes Mid-Continent University, which became an AIKCU member in 2005 and is slated to close on June 30, 2014.)
• 36,195 total Fall 2013 enrollment
• 28,855 undergraduates
• 71% (20,527) Kentucky residents, representing every county in Kentucky.
• 8,328 out-of-state students, including 890 international students. Students from all 50 US states and more than 100 countries.
• 25% are 25 or older
• 59% female
• Racially and ethnically diverse: 78.8% white, 13.6% minority, 5.3% unknown, 2.3% nonresident alien
• 50% are Pell-eligible
• 7,340 graduate students; recent sector growth concentrated in graduate enrollment and degrees.
4

Fall Enrollment at Kentucky’s nonprofit private colleges, 2003-13
5,000
10,000
15,000
20,000
25,000
30,000
35,000
40,000
2003 2004 2005 2006 2007 2008 2009 2010 2011 2012 2013
7,3407,2456,8636,122
5,4474,708
4,2964,0143,8203,5953,157
28,85528,95529,36728,28226,69725,70324,745
23,42623,08822,55622,375
Undergraduate GraduateSource: Kentucky Council on Postsecondary Education Comprehensive Database
5

Baseline* Baseline*
COLLEGE READINESS AIKCU!!
Performance*Metric* Baseline** 2010511** 2011512** 2012513*** Target*Progress:*Baseline*to*Target*
New!Teacher!Excellence!! 17.1%! 17.6%! 18.5%! 32.7%! 77! 77! 77!
Icons!do!not!represent!a!global!evaluaBon!of!insBtuBonal!status!on!an!indicator;!they!indicate!change!from!baseline!to!targeted!value!only.!!Targets!set!through!negoBaBon!between!CPE!and!insBtuBon.!For!more!informaBon!on!metrics,!including!definiBons,!visit:!hNp://dataportal.cpe.ky.gov/dashboard.shtm!
!!!!!!!!!!!!!!!!!!!!!!!!!!!!!!!!!!!!!!!!!!!!!
**Change(for(2012/13(data:(Percent(of(teaching(program(graduates(scoring(in(the(top(25(percent(na<onally(on(Praxis(II(Prac<ce(of(Learning(and(Teaching((PLT)(licensure(exams.(
*Percent(of(teaching(program(graduates(scoring(in(the(top(15(percent(na<onally(on(Praxis(II(Prac<ce(of(Learning(and(Teaching((PLT)(licensure(exams.(
• AIKCU members continue to work together and with K-12 partners to further the work that occurred under AIKCU’s SB1/Unbridled Learning Grant!
!• Growing interest and investment in dual credit/dual enrollment, including traditional
arrangements as well as unique partnerships
6

7
Performance*Metric* Baseline* 2010411* 2011412* 2012413* Target*Progress:*
Baseline*to*Target*
Degrees&and&Creden+als&(Total)& 6,581& 7024& 7,927& 8,172& 8,000& 100%&
&&&&&Bachelor’s&Degrees& 4,159& 4,431& 4,620& 4,595& 5,600& 30%&
&&&&&Master’s&Degrees& 1,724& 1,824& 2,408& 2,668& 2,200& 100%&
&&&&&Doctoral&Degrees—&&&&&&&&&All&Types& 137& 171& 154& 189& 200& 83%&
STUDENT SUCCESS AIKCU&&

0
1000
2000
3000
4000
5000
6000
7000
8000
02-03 03-04 04-05 05-06 06-07 07-08 08-09 09-10 10-11 11-12 12-13
Baccalaureate Master's/Specialist Doctoral
Total annual degrees awarded by AIKCU institutions increased by 72% from 2002-03 to 2012-13
Total baccalaureate degrees increased by 29%, graduate degrees by 230%. Source: CPE Comprehensive Database
8
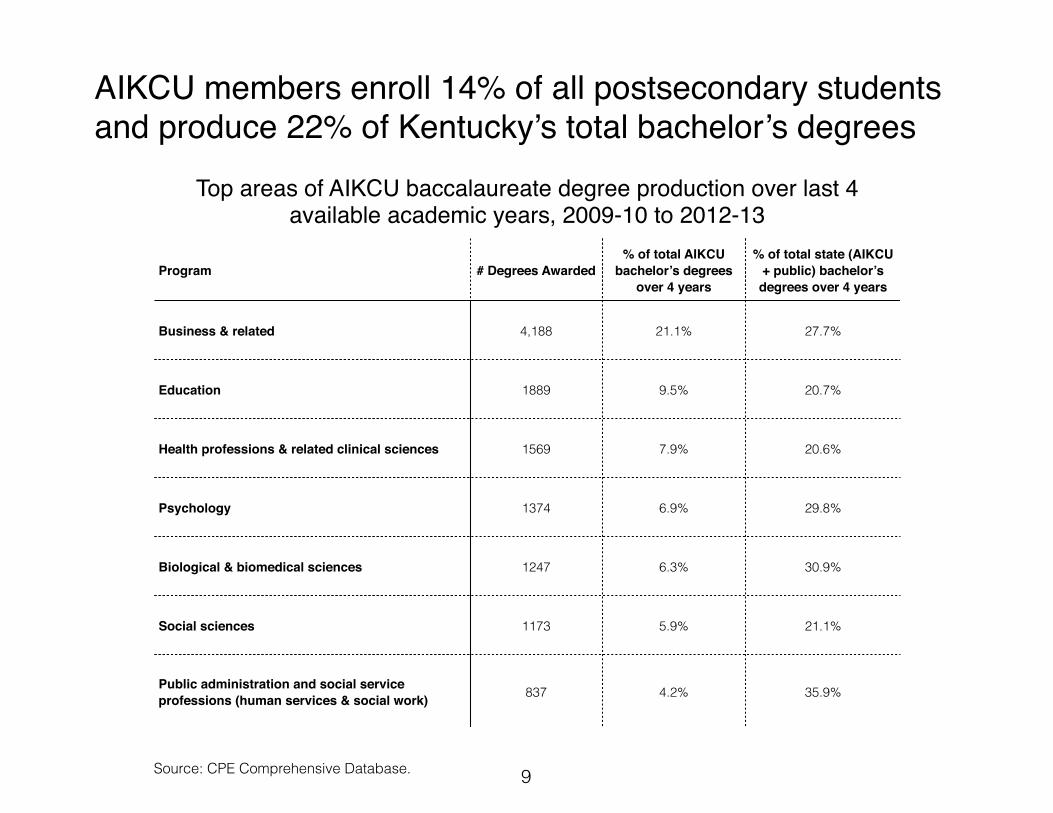
Top areas of AIKCU baccalaureate degree production over last 4 available academic years, 2009-10 to 2012-13
Program # Degrees Awarded% of total AIKCU
bachelor’s degrees over 4 years
% of total state (AIKCU + public) bachelor’s degrees over 4 years
Business & related 4,188 21.1% 27.7%
Education 1889 9.5% 20.7%
Health professions & related clinical sciences 1569 7.9% 20.6%
Psychology 1374 6.9% 29.8%
Biological & biomedical sciences 1247 6.3% 30.9%
Social sciences 1173 5.9% 21.1%
Public administration and social service professions (human services & social work) 837 4.2% 35.9%
AIKCU members enroll 14% of all postsecondary students and produce 22% of Kentucky’s total bachelor’s degrees
Source: CPE Comprehensive Database. 9

• Discrepancies exist between CPE and IPEDS data for the 2012-13 cohort. Preliminary IPEDS data indicates an overall 6-year AIKCU graduation rate of 50.5% for 2012-13. !
• Graduation rates vary widely by institution type and the college readiness of entering students. 6-year rates range from around 30% to more than 80%.!
• AIKCU students are more likely to graduate in 4 years than in 5 or 6: !• Of students who persist to graduation, 76% do so in 4 years.!• AIKCU 4-year IPEDS graduation rate is 38.1%.!
!!!
10
STUDENT SUCCESS AIKCU!!
Performance*Metric* Baseline* 2010411* 2011412* 201242013* Target*Progress:*
Baseline*to*Target*
Bachelor’s!Gradua/on!Rate!
50.8%! 49.3%! 50.4%! 49.1%! 55%! <<! <<!
Underrepresented!Minority!
35.6%! 37.1! 33.9%! 33.9%! <<! <<! <<!
Non!Underrepresented!Minority!
50.6%! 51.3%! 53.1%! 52.0%! <<! <<! <<!
Transfers!from!KCTCS! 1,276! 2,274! 2,620! 2,077! 1,800! 100%!
Icons!do!not!represent!a!global!evalua/on!of!ins/tu/onal!status!on!an!indicator;!they!indicate!change!from!baseline!to!targeted!value!only.!!Targets!set!through!nego/a/on!between!CPE!and!ins/tu/on.!For!more!informa/on!on!metrics,!including!defini/ons,!visit:!hXp://dataportal.cpe.ky.gov/dashboard.shtm!
!!!!!!!!!!!!!!!!!!!!!!!!!!!!!!!!!!!!!!!!!!!!!

KCTCS transfers, adult students, graduate education remain a priority for many AIKCU members
• 25% of undergrads 25 or older • Community campuses and partnerships with KCTCS extend AIKCU’s
presence to many additional communities in rural areas of the state • Designated transfer scholarships available at many AIKCU campuses • Graduate enrollment and degrees continue to expand to meet needs of Ky.
employers and the Commonwealth
11
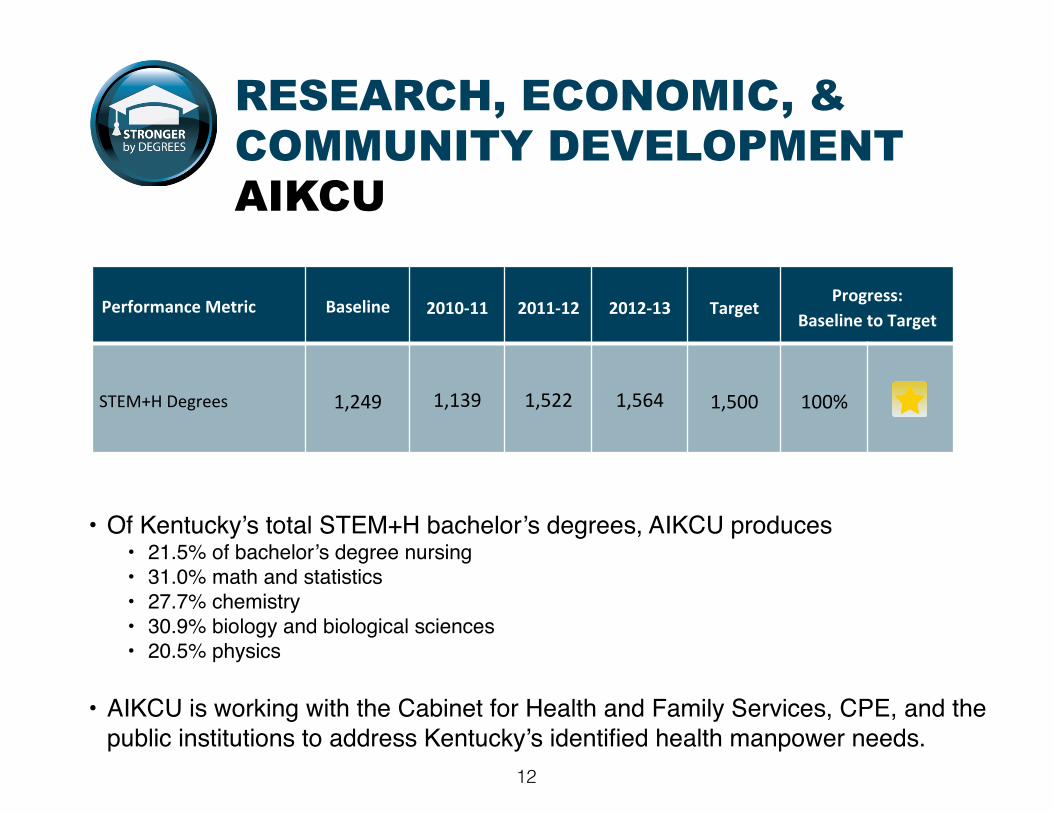
• Of Kentucky’s total STEM+H bachelor’s degrees, AIKCU produces !• 21.5% of bachelor’s degree nursing!• 31.0% math and statistics!• 27.7% chemistry!• 30.9% biology and biological sciences!• 20.5% physics!
!• AIKCU is working with the Cabinet for Health and Family Services, CPE, and the
public institutions to address Kentucky’s identified health manpower needs.12
RESEARCH, ECONOMIC, & COMMUNITY DEVELOPMENT AIKCU!!
Performance*Metric* Baseline* 2010411* 2011412* 2012413* Target*Progress:*
Baseline*to*Target*
STEM+H!Degrees! 1,249! 1,139! 1,522! 1,564! 1,500! 100%!

EFFICIENCY AND INNOVATION AIKCU !!
Performance*Metric* Baseline* 2010411* 2011412* 2012413* Target*Progress:*
Baseline*to*Target*
Online!Learning!(Percent!of!all!credit!earned!through!online!learning)!
6.6%! 8.4%! 10.9%! 12.0%! 8.0%! 100%!
Credits!Earned!By!Degree!Graduates! 137! 138.2! 137.3! 136.2! 137! GG! GG!
Credits(earned(by(degree(graduates(includes(all(bachelor’s(degree(graduates(during(the(year.((Online(learning(measures(the(percent(of(completed(student(credit(hours(delivered(through(distance(learning.(((
Icons!do!not!represent!a!global!evaluaLon!of!insLtuLonal!status!on!an!indicator;!they!indicate!change!from!baseline!to!targeted!value!only.!!Targets!set!through!negoLaLon!between!CPE!and!insLtuLon.!For!more!informaLon!on!metrics,!including!definiLons,!visit:!hUp://dataportal.cpe.ky.gov/dashboard.shtm!
!!!!!!!!!!!!!!!!!!!!!!!!!!!!!!!!!!!!!!!!!!!!!

2013-14 Average Published Tuition/Fees and Room Board
$0
$9,000
$18,000
$27,000
$36,000
$45,000
AIKCU Southern Average National Average
$10,823$9,586$9,644
$30,094$26,590$24,231
Tuition/Fees Room/Board
Affordability and Value:!Average published costs at AIKCU institutions are less than southern and national private college averages
The average tuition increase for 2014-15 is approximately 2.7%.!!Sources: College Board Trends in College Pricing 2013, AIKCU Survey. AIKCU data excludes Berea College and Alice Lloyd College, who both guarantee full tuition scholarships for all students as part of their work college missions.
$33,875$36,176
$40,917
14

But virtually no AIKCU student pays the sticker price.
!A private college education is attainable for many students thanks to a 4-prong partnership: student/family + institution + federal aid + state aid !
• 98% of full-time first year students receive some financial aid. !
• 92% receive institutional grants/scholarships.
Source: IPEDS
15

0
2,500
5,000
7,500
10,000
12,500
15,000
17,500
20,000
22,500
25,000
27,500
$2,500$1,900$2,930
$5,645
$12,382
Avg. institutional grant (2011-12)Max Pell GrantMax KTGMax CAPMax KEES
Average 2013-14 AIKCU tuition: $24,321
Potential student aid awards by category
In 2011-12 average institutional grants for first-time, full-time students were $12,382. AIKCU members have increased financial aid expenditures in the subsequent years. !Source: IPEDS
16

Institutional grants and scholarships Total student financial aid awarded from institutional funds, Kentucky nonprofit private colleges and universities (in $ millions)
$20
$40
$60
$80
$100
$120
$140
$160
$180
$200
$220
$240
$260
96-97 97-98 98-99 99-00 00-01 01-02 02-03 03-04 04-05 05-06 06-07 07-08 08-09 09-10 10-11 11-12 12-13
$256.3
$239.8
$220.6
$200.3
$183.3
$168.4
$153.1$142.5
$129.8$124.2
$112.5
$77.4$73.1$69.9$64.3$60.5
$48.2
Source: National Center for Education Statistics (IPEDS)
17

Kentucky’s investment in AIKCU students• Kentucky’s private nonprofit colleges and universities receive no direct state money.
• Students attending private colleges are eligible for state financial aid programs that benefit students in all sectors: the need-based College Access Program (CAP) and Kentucky Educational Excellence Scholarship (KEES).
• AIKCU students received a combined $29.61 million in 2012-13 from CAP and KEES programs. (Students would have received these awards had they attended a public institution.)
• The Kentucky Tuition Grant (KTG) is the only state student financial aid program explicitly for Kentucky residents attending in-state private colleges. The need-based program is designed to help offset the higher costs of attending a private institution. State statute sets the maximum award at up to 1/2 the average appropriation per FTE student enrolled in all public institutions (current max KTG award = $2,930).
• 10,381 students attending AIKCU institutions received $27.98 million in KTG in 2012-13.
18

Alice LloydAsbury
BellarmineBerea
BresciaCampbellsville
CentreGeorgetown
Kentucky ChristianKentucky Wesleyan
Lindsey WilsonMidway
St. CatharineSpalding
Thomas MoreTransylvania
UnionUPike
U. Cumberlands
$0 $1,000 $2,000 $3,000 $4,000 $5,000 $6,000 $7,000
$1,069
$1,008
$428
$1,620
$621
$491
$398
$259
$1,512
$501
$272
$1,347
$1,509
$1,471
$393
$900
$2,270
$723
$520
$838
$840
$462
$351
$308
$587
$312
$601
$1,625
$333
$200
$436
$206
$1,190
$208
$914
$628
$343
$378
$1,768
$1,690
$964
$1,187
$925
$1,160
$711
$1,089
$3,266
$843
$530
$1,366
$1,098
$2,611
$448
$1,484
$2,123
$1,022
$850
KTG CAP KEES
Kentucky’s “Big 3” state financial aid to AIKCU students, 2012-13 !(in $1000s)
In 2012-13, 14,461 unduplicated AIKCU students received $57.58 million in state grants. 70% of that total was distributed through the need-based CAP and KTG programs. !!Source: KHEAA
19

KTG awards to AIKCU students = 2.4% of state postsecondary appropriation
In 2012-13, Kentucky appropriated approximately $1.2 billion to postsecondary education. (appropriations to public postsecondary institutions, CPE, KHEAA). !KTG ($28 million) to AIKCU students = about 2.4% of that total postsecondary appropriation.
AIKCU KTG
KHEAA (excluding AIKCU KTG)
CPE
Public Institutions
Source: Office of Kentucky State Budget Director, Enacted Budget FY 2013; KHEAA Note these are General Fund appropriations, not total funds received or total expenditures.
20
AIKCU’s number one policy priority is the support of KHEAA’s budget
recommendation, which would appropriate all lottery revenue
committed by statute to student aid.
21
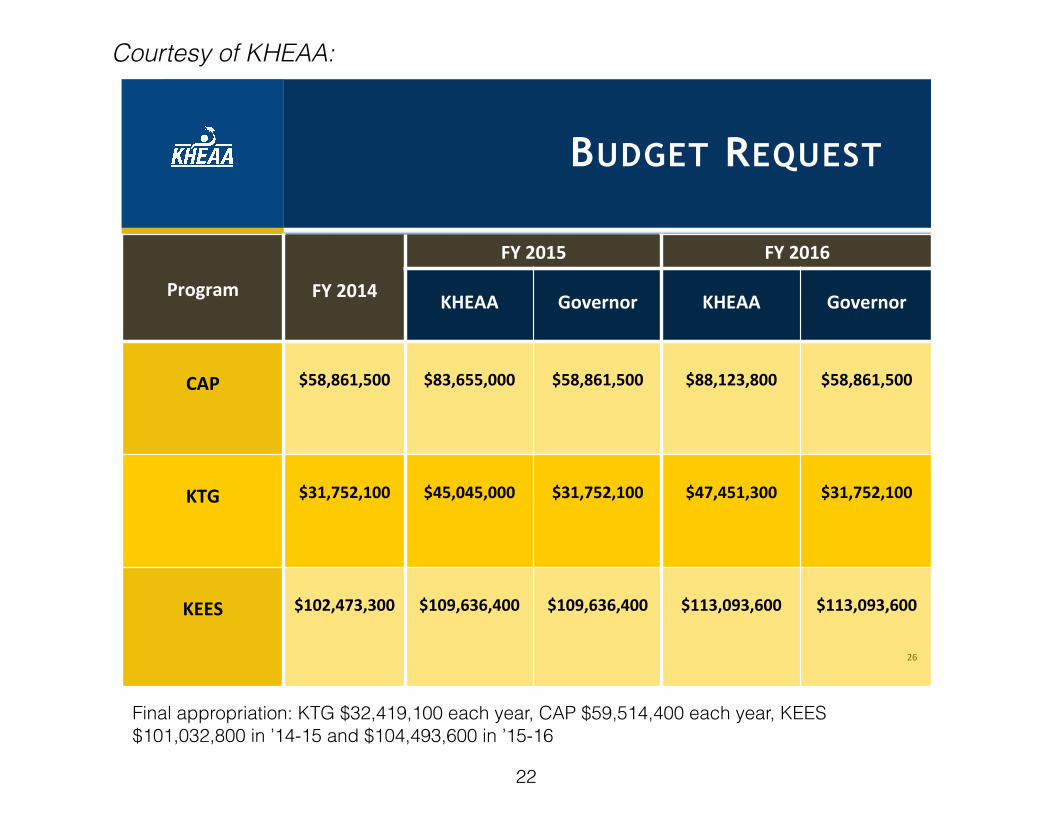
BUDGET REQUEST
26#
!!
Program!
!!
FY!2014!
FY!2015! FY!2016!!
KHEAA!!
Governor!!
KHEAA!!
Governor!
!CAP!
!$58,861,500!
!$83,655,000!
!$58,861,500!
!$88,123,800!
!$58,861,500!
!
!KTG!
!$31,752,100!
!$45,045,000!
!$31,752,100!
!$47,451,300!
!$31,752,100!
!
!KEES!
!$102,473,300!
!$109,636,400!
!$109,636,400!
!$113,093,600!
!$113,093,600!
!
Courtesy of KHEAA:
22
Final appropriation: KTG $32,419,100 each year, CAP $59,514,400 each year, KEES $101,032,800 in ’14-15 and $104,493,600 in ’15-16

CAP & KTG EXHAUSTED FUNDING DATES BY FY 2009
THROUGH FY 2014
24#
0# 30# 60# 90# 120# 150# 180# 210#
FY2009&
FY2010&
FY2011&
FY2012&
FY2013&
FY2014&
KTG#
CAP#
&&&&&&&January&&&&&&&&February&&&&&&&&&&March&&&&&&&&&&&April&&&&&&&&&&&&&&May&&&&&&&&&&&&&&June&&&&&&&&&&&&&&July&&&&&&&&&&&&August&&&
Kentucky’s need-based programs are first-come, first-served and are quickly exhausted.
Courtesy of KHEAA 23

24

ROI: What is the economic value added to the Commonwealth by Kentucky’s private colleges?
To answer this question, AIKCU recently commissioned an economist to conduct an economic benefits study using the same methodology the Kentucky Cabinet for Economic Development uses to evaluate companies and industries seeking economic incentives. The study:
• Uses publicly available 2011-12 employment and wage data from the National Center for Education Statistics Integrated Postsecondary Education Data System (IPEDS).
• Focuses only on economic benefits to the Commonwealth of Kentucky derived from institutions’ annual operations. It is not a comprehensive evaluation of the broad cultural and economic impacts that these institutions provide. (AIKCU released a comprehensive report in 2006 and several institutions regularly conduct their own more complex economic impact studies.)
• Excludes: capital construction projects; value of existing facilities; economic benefits of creation of human capital; student, alumni, and visitor spending; economic impacts of auxiliary or cultural venues; social benefits of an educated population; research, grants, and value of community service.
25

– from a 2014 AIKCU-commissioned economic impact study
“AIKCU’s member institutions provide both economic benefits and social benefits to Kentucky without direct state appropriations for the operation of these institutions. This may make the AIKCU’s member institutions one of the greatest economic and social bargains to the residents and taxpayers of Kentucky”
26

Annual Economic Benefits (in $ millions)
$162
$102
$354
DirectIndirectInduced
Total = $617.6 million
Jobs
2,231
1,166
7,037
Total = 10,434
ROI: AIKCU members’ economic benefits to the Commonwealth of Kentucky
27

Key findings of economic benefits study
AIKCU members add $617.6 million to Kentucky’s economy annually.!
Direct benefits: $354 million!
• $344 million in direct wages + benefits
• 7,037 total employees (4,898 FT); average annual wage + benefits = $48,920
Indirect benefits: $102 million!
• 1,166 Kentucky jobs exist because of AIKCU members’ operations.
• Wages + benefits of these indirect jobs = $47+ million; average $40,600 annually
Induced benefits (response by Kentucky’s economy to direct and indirect): $162 million
• 2,231 induced Kentucky jobs
• Induced wages + benefits = $89 million; average annual wage + benefits = $39,370
28

Challenges facing Kentucky private colleges
• Flat undergraduate enrollments, degree production, and graduation rates
• Changing demographics of Kentucky
• Underfunded state financial aid programs
• Financial strain of serving large numbers of low-income students (tuition discounting eating into net revenue)
• Public perception and anxiety about costs, value of degrees, and student debt
• Rising costs: compliance, fixed costs (salaries, health insurance, retirement plans, campus maintenance, etc.)
• Increasing/inconsistent/uncertain federal regulatory oversight
• Modest institutional resources
29

< $1 million $1-20 million $20-50 million $50-100 million $100 million +
3
1
5
9
1
Median endowment value at end of fiscal 2012 = $18.6 million
Number of AIKCU institutions by endowment category, FY 2012
Source: National Center for Education Statistics, IPEDS
30

Responding to challenges• Cost containment, including eliminating programs and in some
cases faculty/staff
• Refocusing on institutional missions
• Identifying opportunities and expanding into new markets, including the development of new programs where appropriate
• Focusing on innovative ways to deliver educational value
• Collaborating - with area employers, the Commonwealth, public postsecondary providers, and each other
• New leadership, new ideas
31

Leadership Transitions: new presidents at 8 of 19 AIKCU institutions in the last 3 years
• Berea College - Dr. Lyle D. Roelofs (2012)
• Georgetown College - Dr. M. Dwaine Greene (2013)
• Kentucky Wesleyan College - Dr. Craig Turner (2011)
• Midway College - Dr. John P. Marsden (2013)
• Thomas More College - David A. Armstrong, J.D. (2013)
• Transylvania University - Dr. Seamus Carey (2014)
• Union College - Dr. Marcia Hawkins (2012)
• University of Pikeville - Dr. James Hurley (2013)
32