Strong year for Hiab · Operating profit margin* continued to improve Strong year for Hiab –sales...
23
Strong year for Hiab 8 February 2018 Cargotec’s financial statements review 2017 Mika Vehviläinen, CEO • Mikko Puolakka, CFO Cargotec’s financial statements review 2017 8/2/2018 1
Transcript of Strong year for Hiab · Operating profit margin* continued to improve Strong year for Hiab –sales...

Strong year for Hiab
8 February 2018
Cargotec’s financial statements review 2017
Mika Vehviläinen, CEO • Mikko Puolakka, CFO
Cargotec’s financial statements review 2017 8/2/2018 1

Contents1. Group level development
2. Business areas
3. Financials, dividend and outlook

Operating profit margin* continued to
improve
Strong year for Hiab – sales increased by 5%
and operating profit* by 12%
Kalmar’s sales declined, but operating profit*
improved slightly
MacGregor’s order intake improved during the
second half of 2017
Progress in M&A
127
149
231
250263
4.0 %4.4 %
6.2 %
7.1 %
8.0 %
2013 2014 2015 2016 2017
Operating profit* EUR million Operating profit* margin
3
Highlights of 2017 – Strong year for Hiab, MacGregor’s orders improved in H2/2017
8/2/2018Cargotec’s financial statements review 2017
*) Excluding restructuring costs

8/2/2018Cargotec’s financial statements review 2017 4
Growth in number of containers
handled at ports accelerated
Strong interest for efficiency
improving automation solutions
Customers’ decision making is slow and
starting with phased investments
Construction activity on good level
Good development continued in Europe,
US demand stayed on strong level
Market improved in merchant sector, but
orders remained well below historical
levels
In offshore, interest level has increased,
but not materialised in orders
Market environmentin 2017
Source: Clarkson Research
(number of ships and offshore units)
Indicative historical average
504
827
0
400
800
1,200
1,600
2,000
2016 2017
102 75
0
200
400
600
800
2016 2017
2016 2017 2016 2017
701 743
0100200300400500600700800
2016 2017
Long term contracting – Key driver for MacGregor
Construction output – Key driver for Hiab
Global container throughput (MTEU) – Key driver for Kalmar
Merchant ships > 2,000 gt (excl. ofs & misc) Mobile offshore units
United States Europe
Source: Oxford Economics
Source: Drewry
+0.2% +3.7%
+6.0%
Historical averageHistorical average
+64% -26%

454 438 389440 448
386 351 369
275239
220
282 288
279260
289
173
149
124
100 121
136139
126
0
200
400
600
800
1,000
Q1 2016 Q2 2016 Q3 2016 Q4 2016 Q1 2017 Q2 2017 Q3 2017 Q4 2017
Kalmar Hiab MacGregor
5
Orders received – Good growth in Hiab in 2017, MacGregor’s orders improved in H2/17
Orders receivedMEUR
1,721 1,555
1,0161,116
546 521
0
750
1,500
2,250
3,000
3,750
2016 2017
Kalmar Hiab MacGregor
+10%
-10%
903
825
733
8223,1903,283
+25%(y/y)
8/2/2018Cargotec’s financial statements review 2017
Orders receivedMEUR
857800
749784
-16%(y/y)
+2%(y/y)
-5%

Order bookMEUR
8/2/2018Cargotec’s financial statements review 2017 6
Order book declined in Kalmar and MacGregor
Order book by reporting
segment, Q4 2017
900 977 926 887 765
286302 290 293
299
598556
507 519487
0
500
1,000
1,500
2,000
2,500
Q4/16 Q1/17 Q2/17 Q3/17 Q4/17
Kalmar Hiab MacGregor
49%
19%
32%
Kalmar Hiab MacGregor
1,783 1,8341,720 1,698
1,550

SalesMEUR
Operating profit*MEUR
7
Record-high operating profit* in Q4/17
477364 403 377
479
257
270282
252
280
199
160160
112
144
0
250
500
750
1,000
Q4/16 Q1/17 Q2/17 Q3/17 Q4/17
Kalmar Hiab MacGregor
845
61.0 59.2
72.1
57.4
74.6
0
25
50
75
100
Q4/16 Q1/17 Q2/17 Q3/17 Q4/17
Kalmar Hiab MacGregor Cargotec total EBIT**
*) Excluding restructuring costs, **) Including Corporate admin and support
933
8/2/2018Cargotec’s financial statements review 2017
793740
902

8
Gross profit continued to improve in 2017
583
634
787
840 857
18.3 %18.9 %
21.1 %
23.9 %
26.1 %
0.0 %
2.5 %
5.0 %
7.5 %
10.0 %
12.5 %
15.0 %
17.5 %
20.0 %
22.5 %
25.0 %
27.5 %
0
100
200
300
400
500
600
700
800
900
1,000
2013 2014 2015 2016 2017
Gross profit, MEUR Gross profit-%
8/2/2018Cargotec’s financial statements review 2017
MEUR

Services and software* salesMEUR
231215 215 215 229
51
35 44 31
48
0
50
100
150
200
250
300
Q4/16 Q1/17 Q2/17 Q3/17 Q4/17
2017 service sales at last
year’s level
– Growth in Kalmar (+2%) and
Hiab (+4%), MacGregor
declined (-8%)
Software sales grew 7% in
2017
Services and software sales
31% (29%) of total sales in
2017
9
Service and software 31% of total sales in 2017
8/2/2018Cargotec’s financial statements review 2017
*Software sales defined as Navis business unit and automation software
Services
Software
872 874
148 159
0
200
400
600
800
1,000
1,200
2016 2017
1,020 1,033
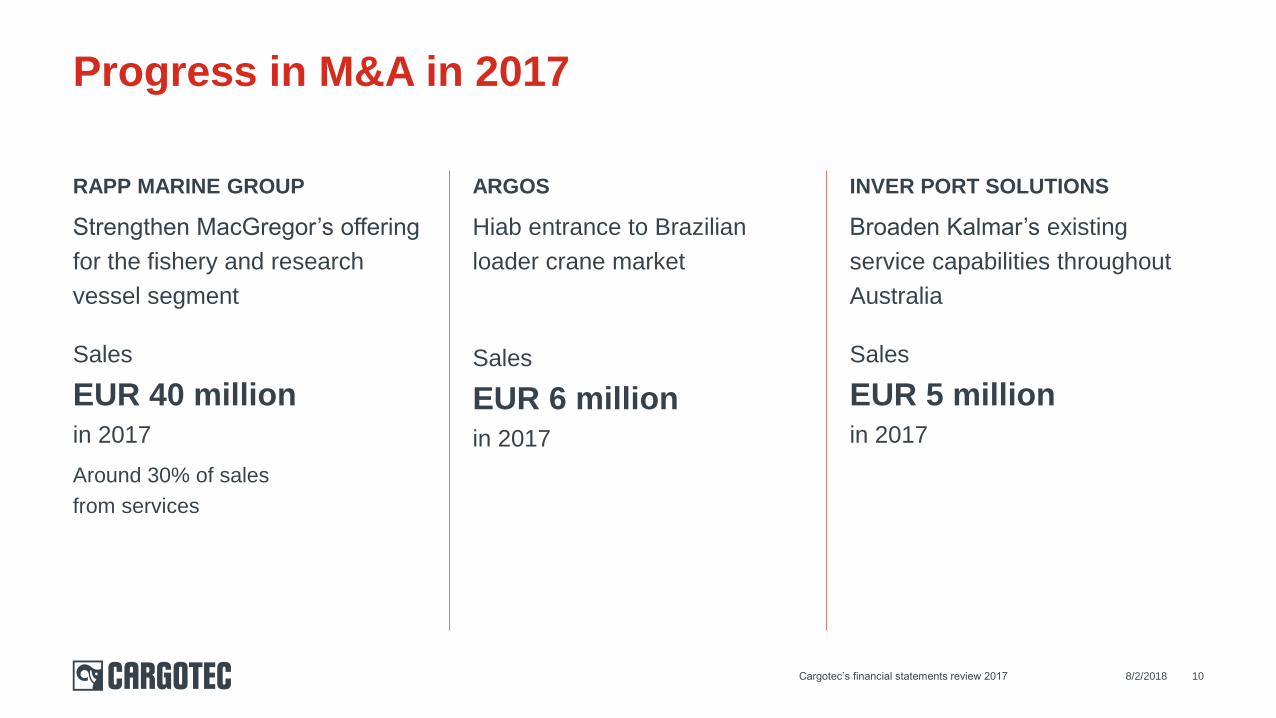
RAPP MARINE GROUP
Strengthen MacGregor’s offering
for the fishery and research
vessel segment
Sales
EUR 40 millionin 2017
Around 30% of sales
from services
INVER PORT SOLUTIONS
Broaden Kalmar’s existing
service capabilities throughout
Australia
Sales
EUR 5 millionin 2017
8/2/2018Cargotec’s financial statements review 2017 10
Progress in M&A in 2017
ARGOS
Hiab entrance to Brazilian
loader crane market
Sales
EUR 6 millionin 2017

BusinessareasCargotec’s financial statements
review 2017
11

MEUR Q4/17 Q4/16 Change
Orders
received
369 440 -16%
Order book 765 900 -15%
Sales 479 477 +0%
Operating
profit*
44.6 41.5 +7%
Operating
profit margin*
9.3% 8.7% +61bps
Orders received declined in all
geographical regions
Low order intake especially
in automation and projects
Sales remained at last year’s
level, supported by project
deliveries
Operating profit* increased
especially in mobile equipment
Kalmar Q4 –Profitability improved
75%15%
10%
Equipment and services
Automation and projects
Software
*) Excluding restructuring costs
**) Figures rounded to closest 5%
Sales mix**
in 2017

MEUR Q4/17 Q4/16 Change
Orders
received
289 282 +2%
Order book 299 286 +5%
Sales 280 257 +9%
Operating
profit*
39.9 32.9 +21%
Operating
profit margin*
14.3% 12.8% +148bps
Orders received continued
to grow in EMEA
Growth in EMEA +9%
Strong growth in loader cranes
Sales and operating profit grew
Service sales grew 6%
Hiab Q4 – Solid growth in sales and profitability
*) Excluding restructuring costs
**) Figures rounded to closest 5%
85%
10%5%
Commercial
Large customers
Defence
Sales mix**
in 2017

MEUR Q4/17 Q4/16 Change
Orders
received
126 100 +25%
Order book 487 598 -19%
Sales 144 199 -28%
Operating
profit*
2.1 0.5 +308%
Operating
profit margin*
1.4% 0.3% +117bps
Orders received increased in
APAC and Americas
Large gas distribution project
order
Sales declined both in merchant
and offshore due to low delivery
volumes
Operating profit* increased due
to cost savings
MacGregor Q4 –Continued growth in orders received
*) Excluding restructuring costs
**) Figures rounded to closest 5%
75%
25%
Merchant
Offshore
Sales mix**
in 2017

From 2020 onwards annual savings of
EUR 50 million
– EUR 10 million savings in 2017
2017 EUR 25 million (MacGregor)
EUR 13 million in 2018 (MacGregor)
– Operational restructuring: reduction of
approximately 170 employees
EUR 13 million in 2018 (Kalmar)
– Relocation of assembly operation
Product redesign and project management
improvement continues in 2018
Previously announced cost savings programmes proceeding
DRAFT

Financials, dividend and outlookCargotec’s financial statements
review 2017
8/2/2018Cargotec’s financial statements review 2017 16

8/2/2018Cargotec’s financial statements review 2017 17
Key figures – Operating profit increased
Q4/17 Q4/16 Change 2017 2016 Change
Orders received, MEUR 784 822 -5% 3,190 3,283 -3%
Order book, MEUR 1,550 1,783 -13% 1,550 1,783 -13%
Sales, MEUR 902 933 -3% 3,280 3,514 -7%
Operating profit*, MEUR 74.6 61.0 +22% 263.2 250.2 +5%
Operating profit*, % 8.3% 6.5% +173bps 8.0% 7.1% +90bps
Restructuring costs, MEUR 17.2 39.7 -57% 36.5 52.5 -31%
Operating profit, MEUR 57.3 21.3 +169% 226.7 197.7 +15%
Operating profit, % 6.4% 2.3% +407bps 6.9% 5.6% +129bps
Net income, MEUR 29.7 12.2 +143% 136.3 125.3 +9%
Earnings per share, EUR 0.45 0.20 +129% 2.11 1.95 +8%
Earnings per share, EUR** 0.64 0.65 -1% 2.51 2.54 -1%
*) Excluding restructuring costs
**) Excluding restructuring costs, using reported effective tax rate

18
Cash flow from operations weakened due to low prepayments and higher net working capital
181
204
315
373
253
91
5674
152
12
40
88
112
0
50
100
150
200
250
300
350
400
2013 2014 2015 2016 2017 Q1/16 Q2/16 Q3/16 Q4/16 Q1/17 Q2/17 Q3/17 Q4/17
8/2/2018Cargotec’s financial statements review 2017
Cash flow from operationsMEUR

8/2/2018Cargotec’s financial statements review 2017 19
Net debt EUR 472 million
(31 Dec 2016: 503)
Average interest rate 2.3% (2.3%)
Net debt/EBITDA 1.6 (1.8)
Total shareholders’ equity EUR
1,425 million (1,395)
Equity/total assets 41.5% (39.1%)
Well diversified loan portfolio:
Bonds EUR 464 million
Bank loans EUR 293 million
EUR 300 million revolving credit facility
refinanced in Q2/17, the facility is fully
undrawn
Balanced maturity profile
EUR 97 million loans maturing in 2018
Strong balance sheet
97
166
192
42
167
100
0
50
100
150
200
250
2018 2019 2020 2021 2022 2023-
578 719 622
503472
46.7 %
59.2 %
46.4 %
36.0 % 33.0 %
0%
20%
40%
60%
0
200
400
600
800
2013 2014 2015 2016 2017
Net debt (lhs) Gearing-% (rhs)
Maturity profile
Net debt and gearing
MEUR
MEUR

20
Operating profit* margin and ROCE improved
9.8
8.0
0
2
4
6
8
10
12
2013 2014 2015 2016 2017
ROCE-% Operating profit margin %*
8/2/2018Cargotec’s financial statements review 2017
%
ROCE (return on capital employed), annualised *) Excluding restructuring costs

Proposal to increase the dividend
8/2/2018Cargotec’s financial statements review 2017 21
0.89
1.11
2.21
1.95
2.11
0.420.55
0.800.95
1.05*
0.00
0.50
1.00
1.50
2.00
2.50
2013 2014 2015 2016 2017
Board proposes EUR 1.05 dividend per B share for 2017
Dividend to be paid in two instalments (EUR 0.53 and 0.52)
Dividend EPS (reported) Payout ratio
50%
36%49%
47%
50%
*Board proposal to AGM

2018 outlook
Operating profit excluding restructuring costs for 2018
is expected to improve from 2017 (EUR 263.2 million).
As a result of the adoption of the IFRS 15 standard effective from January 1, 2018, Cargotec’s revenue recognition for
certain products and customer contracts will change in 2018. The IFRS 15 restated figures for 2017 will be published in
March 2018 the latest. The change in accounting principles is not expected to have a material impact on annual
operating profit.
8/2/2018Cargotec’s financial statements review 2017 22