Strength simulations of tension bars for heavy...
87
Strength simulations of tension bars for heavy lifting Hållfasthetssimuleringar av dragstag för tunga lyft Arvid Hoikka Faculty of health, science and technology Degree project for master of science in engineering, mechanical engineering 30 credit points Supervisor: Jens Bergström Examiner: Pavel Krakhmalev Date: 2018-08-13
Transcript of Strength simulations of tension bars for heavy...

Strength simulations of tension bars for heavy lifting
Hållfasthetssimuleringar av dragstag för tunga lyft
Arvid Hoikka
Faculty of health, science and technology
Degree project for master of science in engineering, mechanical engineering
30 credit points
Supervisor: Jens Bergström
Examiner: Pavel Krakhmalev
Date: 2018-08-13


Abstract
Proplate, a world leading company, is expert on volume-based cutting and machining of both ordinary
steel as well as stainless steel. One of Proplate’s mayor products is tension bars, which is a component
made to balance high forces and give stability to structures such as cranes, buildings, bridges and much
more. Proplate builds their tension bars in different high strength steel materials, purchased from SSAB,
and sells them worldwide. Proplate would like to market themselves better and wishes to produce a
catalogue for the maximum load that can be applied to their tension bars, as competitors Pretec and
Macalloy, already have for their tension bars. The purpose of the project has been to investigate the
tension bars and the maximum load they can withstand before failure. The tension bars have been
modeled in the CAD-program Creo Parametric, and then sent to the finite element method program
ABAQUS to analyze their structural strength. Three different types of tension bars, and a fourth tension
bar (called the walnut-strap) used as a connecting element between some of the tension bars, were
investigated. They were modeled with sprints, to hold several tension bars together, and with a
construction called loader, to simplify the model load application step. The three different types of
tension bars have been analyzed as individual and also when connected to other tension bars. Some
tension bars could be directly connected to each other with sprints, and some used the walnut-strap to
connect other tension bars to each other. The project was limited to fatigue analyses, which is an
important factor to control. This could instead be a great continuation of the project. The results from
the strength analyses show that the stress is higher at the surfaces around the hole at the end of each
tension bar, and the maximum load the tension bars can withstand depends on this area. The length,
thickness and orientation of the tension bar has been varied, and the maximum load that each model can
withstand has been listed. The length and direction of the tension bars did not influence the result for
singular tension bars, but the thickness did. Both the length and the thickness of the tension bars did
influence the result when multiple tension bars where connected to each other. Tables have been derived
which shows the absolute maximum load that the tension bars can withstand. Proplate can use the tables
in their catalogue, and they can also put a safety factor on the models to make them safer. Another part
of the study was to investigate advantages and disadvantages with if the sprints, the connecting element
between the tension bars, were replaced with screws instead. The result describes the yield strength
needed for the screws and how the structures would behave compared to the current structure. A larger
investigation into the effect of using screws may be one way to continue the work after this project,
together with other investigations of, for instance, the use of compression bars.


Sammanfattning
Proplate är ett världsledande företag, som är experter på volymbaserad skärning och tillverkning i både
vanligt stål såväl som rostfritt stål. En av Proplates huvudprodukter är deras dragstag, som är en
komponent gjord för att balansera stora krafter och tillbringa stabilitet till strukturer, exempelvis
lyftkranar, byggnader, broar med mera. Proplate bygger sina dragstag med hjälp av olika typer av
höghållfasta stålsorter, köpta från SSAB, och säljer sedan produkterna över hela världen. Proplate skulle
vilja marknadsföra sig bättre och önskar att ta fram en katalog över den maximala kraften som kan
appliceras på dragstagen, vilket konkurrenter som Macalloy och Pretec redan har för sina dragstag.
Syftet med projektet är att undersöka dragstagen och den maximala kraften som dragstagen klarar av
innan de går sönder. Dragstagen har modellerats upp i CAD-programmet Creo Parametric, och sedan
skickats till finita-elementmetodsprogrammet ABAQUS för hållfasthetsanalyser. Tre olika typer av
dragstag, och en fjärde variant (kallad valnöts-staget) som använts som ett sammankopplande element
mellan olika typer av dragstagen, har undersökts. De har modellerats tillsammans med sprintar, för att
hålla samman flera dragstag, och en konstruktion vid namn loader, som ska förenkla
kraftapplikationssteget i analyserna. De tre olika typerna av dragstag har analyserats individuellt och
sammankopplade till andra dragstag samtidigt. Några av dragstagen kunde direkt sammankopplas till
andra dragstag med hjälp av sprintar, men andra behövde valnöts-staget för att sammankoppla
dragstagen till varandra. Projektet var avgränsat så att utmattningslaster, vilket är en mycket viktig
faktor, inte analyserades. Resultatet från hållfasthetsanalyserna visar att spänningarna i ytan kring ett
hål i kanterna av dragstagen blir som störst, och den maximala kraften som dragstagen kan klara av är
beroende på denna yta. Dragstagens längd, tjocklek och orientering i rummet har varierat, och den
maximala kraften som varje modell kan klara av har tabellerats. Dragstagens längd och riktning i rummet
påverkade inte resultatet när individuella dragstag analyserades, men dess tjocklek gjorde det. Både
längden och tjockleken av dragstagen påverkade resultatet när flera dragstag blivit sammankopplade till
varandra. Tabellerna visar den absolut maximala kraften som dragstagen kan klara av. Proplate kan
använda dessa tabeller till deras katalog, och de kan också lägga till en säkerhetsfaktor på modellerna
för att göra dem säkrare. En annan del av analyserna var att undersöka fördelarna och nackdelarna om
sprintarna, som är det sammankopplande elementet mellan de olika dragstagen, blivit utbytta mot
skruvar istället. Resultatet beskriver vilken sträckgräns som skulle behövas för skruvarnas material och
hur strukturen skulle bete sig i jämförelse till den nuvarande strukturen. En större undersökning
angående effekten med skruvar kan vara en bra fortsättning på arbetet efter detta projekt, tillsammans
med andra undersökningar som exempelvis angående användning av tryckstag.


Acknowledgements
This report is the result from the work that has been done in the final moments of a Master of Science
Degree in Mechanical Engineering, at Karlstad University. This project consists of 30 credit points
which has been made on full time during spring 2018, and it has been done at Karlstad University,
Karlstad, on behalf of the company Proplate, at Oxelösund.
I would like to begin the report by personally thanking both Karlstad University and Proplate for this
interesting project that I have been working with these past weeks. I think my project has been an
exciting and educational project, and it has given me a lot of new perspectives about how to work when
managing this type of projects. The project has been both hard and complicated at times, but also fun
and interesting at other times.
I would like to begin by thanking Karlstad University, with Jens Bergström and Pavel Krakhmalev. Jens
has been my supervisor at Karlstad University, and he has helped me in the project from the start by
giving me good ideas about how to do the project, and he has been some “new eyes” that has looked at
my results from each week. Pavel Krakhmalev has been my examiner in the project, and I would like to
thank him for examining my project.
I would also like to thank Proplate for giving me this opportunity to perform this interesting project for
a real company. I would like to thank my supervisor at Proplate, Johan Törnqvist, for all his support and
during this project. He has helped and supported me by answering all the questions I have been asking
during the project, and I think that the communication between us has been good from the start. I hope
the results from this report will come to great use for Proplate, and that they will be able to develop their
catalogue over the maximum load that can be applied to their tension rods and tension rod systems. Once
again, thanks for this interesting project, and for all help.
Arvid Hoikka
Karlstad University

Table of Contents
1. Introduction ......................................................................................................................................... 1
1.1 Frameworks and stability .............................................................................................................. 1
1.2 Tension Bars .................................................................................................................................. 1
1.2.1 General information about tension bars ................................................................................ 1
1.2.2 Areas of application ................................................................................................................ 2
1.2.3 The company Proplate AB .................................................................................................... 11
1.2.4 Other companies that makes straps .................................................................................... 14
1.2.5 Rules, requirements and problems with tension rods ......................................................... 17
1.3 Project description with goal and purpose ................................................................................. 22
1.3.1 Project description ............................................................................................................... 22
1.3.2 Purpose and goal .................................................................................................................. 23
2. Method .............................................................................................................................................. 24
2.1 Work flow description ................................................................................................................. 24
2.2 Modeling requirements ............................................................................................................... 24
2.3 CAD-models ................................................................................................................................. 25
2.3.1 CAD-models of tension rods ................................................................................................. 25
2.3.2 CAD-models of other components ....................................................................................... 26
2.3.3 Building of larger components by CAD-models.................................................................... 28
2.4 Pre-analysis .................................................................................................................................. 30
2.4.1 Modeling for gravity tests in Abaqus ................................................................................... 30
2.4.2 Results from gravity tests in Abaqus .................................................................................... 32
2.4.3 Modeling for combined load test in Abaqus ........................................................................ 34
2.4.4 Results from combined load test in Abaqus ......................................................................... 35
2.4.5 Modeling and results for friction test in Abaqus .................................................................. 37
2.4.6 Interpretation of the Abaqus results .................................................................................... 39
2.5 Modeling assumptions ................................................................................................................ 40
2.5.1 Stress analysis method assumptions .................................................................................... 40
2.5.2 Friction coefficient assumptions .......................................................................................... 40
2.5.3 Fatigue assumptions ............................................................................................................. 40
2.5.4 Creep assumptions ............................................................................................................... 40
2.5.5 Wear effect assumptions...................................................................................................... 40
2.5.6 Temperature change effect assumptions ............................................................................ 41
2.5.7 Geometric assumptions........................................................................................................ 41

2.5.8 Plasticity assumptions .......................................................................................................... 41
2.5.9 Gravitation effect assumptions ............................................................................................ 41
2.5.10 Material parameter assumptions ....................................................................................... 41
2.6 Abaqus modeling of tension rods................................................................................................ 42
2.6.1 Symmetry conditions and cuttings used .............................................................................. 42
2.6.2 Material properties .............................................................................................................. 44
2.6.3 Steps ..................................................................................................................................... 45
2.6.4 Interactions........................................................................................................................... 45
2.6.5 Loads ..................................................................................................................................... 47
2.6.6 Boundary conditions ............................................................................................................ 48
2.6.7 Meshing ................................................................................................................................ 50
2.6.8 Acceptance of the result. ..................................................................................................... 50
3. Results ............................................................................................................................................... 53
3.1 Results from analysis 1 ................................................................................................................ 53
3.2 Results from analysis 2 ................................................................................................................ 55
3.3 Results from analysis 3 ................................................................................................................ 55
3.4 Results from analysis 4 ................................................................................................................ 56
3.5 Results from analysis 5 ................................................................................................................ 57
3.6 Results from analysis 6 ................................................................................................................ 58
3.7 Summary of all tables .................................................................................................................. 59
3.8 Screws instead of sprints ............................................................................................................. 61
4. Discussion .......................................................................................................................................... 64
4.1 Assumptions in method............................................................................................................... 64
4.2 Results ......................................................................................................................................... 65
4.3 Comparison between results ...................................................................................................... 68
4.4 Future work ................................................................................................................................. 69
4.4.1 Future screw analysis ........................................................................................................... 69
4.4.2 Future optimization analysis ................................................................................................ 69
4.4.3 Future fatigue analysis ......................................................................................................... 69
4.4.4 Future construction analysis ................................................................................................ 70
5. Conclusions ........................................................................................................................................ 71
6. References ......................................................................................................................................... 72
Appendix 1 – Drawing of Strap-A .......................................................................................................... 75
Appendix 2 – Drawing of Strap-B .......................................................................................................... 76
Appendix 3 – Drawing of Strap-C .......................................................................................................... 77
Appendix 4 – Drawing of the walnut-strap ........................................................................................... 78

1
1. Introduction 1.1 Frameworks and stability
Framework is a structure that can be built up to create stability to constructions and structures. A
framework can be built up by many truss elements to a cross structure. This can give a stability to
systems and hold up walls and roofs from falling apart by external influences from, for instance, winds
and earthquakes [1, 2]. Frameworks is built up by many smaller trusses that prevents some type of
movements in the system. More added trusses in relation to the number of joint points improves the
stability for the system [2]. Example of some simple trusses can be seen in Figure 1.
Figure 1: Three types of simple frameworks under loads [3].
The left framework in Figure 1 is stable, and the system stays strong from the force that it is subjected
to. The middle framework is unstable, and the system risks to collapse when it is subjected to the same
force. The right framework shows the same framework as the one in the middle, but an extra truss has
been added diagonally, and this gives stability to the whole system by preventing the collapse [3].
The idea behind frameworks is that the system will be subjected to a force in one point, and this force
will propagate through the system by the different constituents. Some trusses in the framework might
be fully unloaded, while some trusses will experience tension and other trusses will experience
compression in different magnitudes. What the internal forces are depends on how the system is built,
but the sum of all forces, in all directions, shall be equal to zero to obtain stability to the framework [2].
It is important that the stresses in the framework do not exceed the yield strength anywhere in the system.
An excess of the yield stress can plastically deform the trusses to unwanted shapes. A better system, or
trusses with greater cross section area, can be used to compensate for the overloading [4].
One example when a whole system was torn down was when The Silver Bridge, between West Virginia
and Ohio, collapsed 1967, after less than 40 years in use. The bridge was built as a framework of eyebars,
and when one eyebar broke the whole system became unstable and the bridge came down. This shows
that a simple truss element in a framework can destroy the whole framework if this element is exposed
to an overload [5].
1.2 Tension Bars
1.2.1 General information about tension bars
Tension bars (also known as tension rods, pendant bars or simply just straps) are eyebar looking
construction that can be used in frameworks to balance forces in the system and create stability. This
construction is meant to be used for tensile loads and is built to withstand these forces. Tension bars are
built for tensile forces only, and not compression forces (see compression bars for components made for
compressive forces). A simple model of a tension rod can be seen in Figure 2, which shows a product
from the company Macalloy. This model of the tension rod consists of 3 parts; the actual rod and two
fork heads. The fork head can be screwed on and off the rod [6].
2
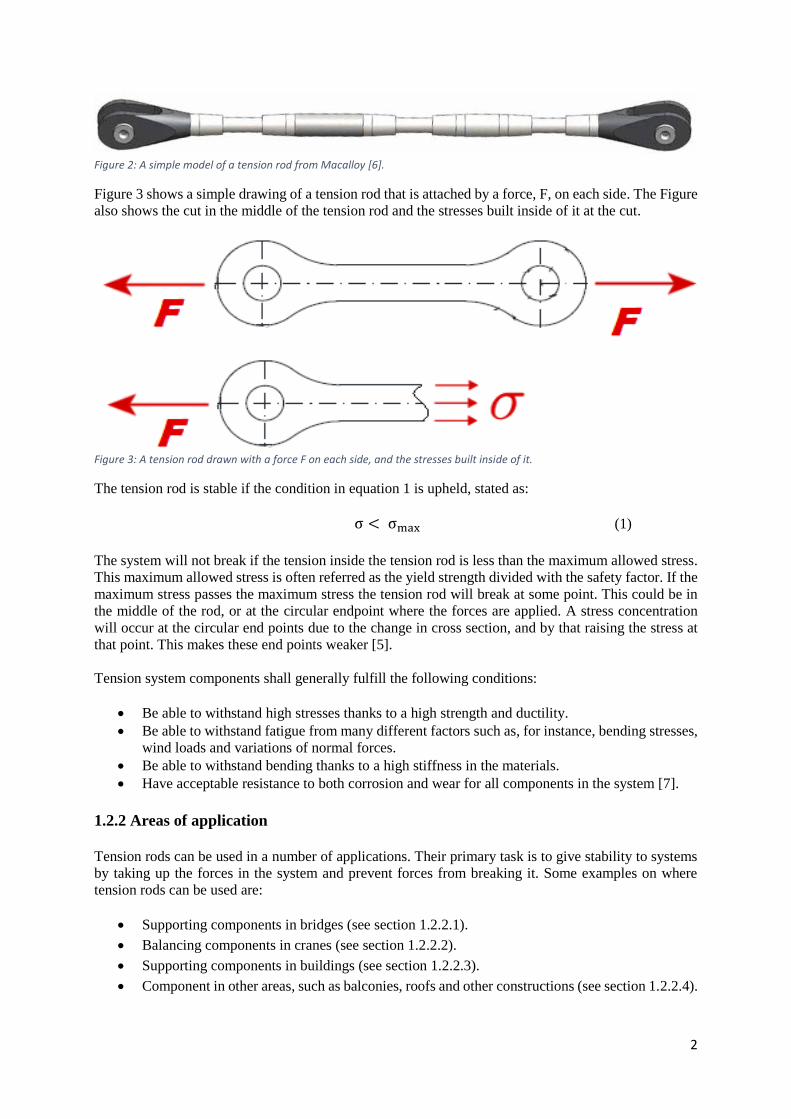
Figure 2: A simple model of a tension rod from Macalloy [6].
Figure 3 shows a simple drawing of a tension rod that is attached by a force, F, on each side. The Figure
also shows the cut in the middle of the tension rod and the stresses built inside of it at the cut.
Figure 3: A tension rod drawn with a force F on each side, and the stresses built inside of it.
The tension rod is stable if the condition in equation 1 is upheld, stated as:
σ < σmax (1)
The system will not break if the tension inside the tension rod is less than the maximum allowed stress.
This maximum allowed stress is often referred as the yield strength divided with the safety factor. If the
maximum stress passes the maximum stress the tension rod will break at some point. This could be in
the middle of the rod, or at the circular endpoint where the forces are applied. A stress concentration
will occur at the circular end points due to the change in cross section, and by that raising the stress at
that point. This makes these end points weaker [5].
Tension system components shall generally fulfill the following conditions:
• Be able to withstand high stresses thanks to a high strength and ductility.
• Be able to withstand fatigue from many different factors such as, for instance, bending stresses,
wind loads and variations of normal forces.
• Be able to withstand bending thanks to a high stiffness in the materials.
• Have acceptable resistance to both corrosion and wear for all components in the system [7].
1.2.2 Areas of application
Tension rods can be used in a number of applications. Their primary task is to give stability to systems
by taking up the forces in the system and prevent forces from breaking it. Some examples on where
tension rods can be used are:
• Supporting components in bridges (see section 1.2.2.1).
• Balancing components in cranes (see section 1.2.2.2).
• Supporting components in buildings (see section 1.2.2.3).
• Component in other areas, such as balconies, roofs and other constructions (see section 1.2.2.4).

3
1.2.2.1 Tension bars in bridges
A bridge can simply be modeled as a free beam. This beam will be loaded by both its own weight, but
also by external forces that will deform it. The stresses can be easily determined by simple solid
mechanics, and the same can be done for the elongation. Figure 4 shows a simple beam that a bridge
can be modeled as [4].
Figure 4: A simple beam that a bridge can be modelled as [1].
The beam in Figure 4 is torn apart by tension stresses. This can happen to a bridge as well, and some
construction changes must be made to prevent it. This can be made by adding more upholding concrete
plates under the bridge, but that is often very expensive, and it does not give the greatest solution.
Another way to prevent the bending can be to add some tension rods to the system to hold it up [8, 9].
There are several types of bridges that can use a framework system to hold up the bridge. Some types
of these bridges are:
• Truss bridges.
• Arch bridges.
• Cable stayed bridges.
• Suspension bridges.
Figure 5 shows these 4 types of bridges and the structure of the framework structure.
Figure 5: Four different types of bridges. The upper left Figure shows a truss bridge, the upper right Figure shows an arch bridge, the lower left Figure shows a cable stayed bridge and the lower right Figure shows a suspension bridge [8].

4
Cable stayed bridges are bridges with long elements that are supposed to hold up the structure. The
number of needed cables depends on the bridge dimensions, the forces that are supposed to be lifted and
much more. Figure 6 shows some types of cable stayed bridges built with different amounts of cables
in different closeness between the cables. Big cable stayed bridges are, for instance, Russky bridge,
Sutong bridge and Stonevutters bridge. Figure 7 shows Russky bridge.
Figure 6: Different types of cable stayed bridges with different amounts of cables [9].
Figure 7: Russky bridge, from Vladivostok in Russia.
Figure 8 shows how tension and compression occur inside one of the bridge towers. What can be seen
in the figure is that the cables are in tension, which catches the forces and leads it to the tower where
they are formed into compression. It is normally important that the cables are in constant tension, and
absolutely not compression. This behavior is similar to the behavior from tension rods. Tension rods can
also be used to lift up components, and they shall also never be in compression.
These bridges shall also be able to withstand external problematic things, such as vibrations. Tacoma
Tower Bridge is one bridge that could not withstand vibrations and it collapsed in 1940, leading to new
ideas about how to construct bridges. It is up to the engineer and designer to make sure the bridge is safe
from failures, and that each component can take up the necessary forces without breaking. What needs
to be done is for the engineers to have a good understanding for how the forces operates through the
bridge in order to calculate the shape of the tension elements. Figure 9 shows how some tension cables
have been constructed and placed to the bridge

5
Figure 10 shows how forces act inside a cable stayed bridge, and Figure 11 shows the elongations act in
the same bridge. What can be seen is that the cables take up the tensions while mostly the rest of the
bridge is under compression. This also influences how the deformations will be in the bridge.
Figure 10: All the different forces inside a cable stayed bridge [9].
Figure 11: All the different deformations inside a cable stayed bridge [9].
Other types of how tension bars can be used in frameworks in bridges can be seen in Figure 12 which
shows four bridges with these elements. These structures are often named after its original constructer
like the Eiffel tower is.
Figure 8: Forces of tension and compression in a tower of a cable stayed bridge [9]. Figure 9: A cable of a tension part of a cable
stayed bridge [9].

6
Figure 12: four different types of bridges where tension rods can be used as a part of the framework [3].
Several studies have been made about bridges throughout the years, and how bridges shall be formed.
One study was made on University of Lund in 2010 where the design of a longer bridge over Iceland
was investigated. This study shows how the design of bridges can be chosen, and what to think of during
the analysis. This study shows stresses in, for instance, cable stayed bridges [10].
1.2.2.2 Tension bars in cranes
Tension bars can also be used in cranes as a component to stabilize the lifting from the cranes. The role
for the tension rod is to bind together frameworks with counterweights. Crawler cranes can be able to
lift up to 3000 ton, and needs tension rods that can balance these forces. These rods can be the component
that are exposed to the greatest loading in the crane [11]. Example of how these rods are used in a crane
can be seen in Figure 13.
Figure 13: A tension rod placed in a crane [12].
Tension rods can be coupled to many other after each other to form a long tension rod to bind the forces
in the system. Wires can be used to control the forces if the lifting is of light weight, but these
components are often not a good choice when the forces increases, and a tension rod must be used
instead to lift the things up with the crane [12].
Figure 14 shows the anatomy of a classic crane tower, and Figure 15 shows the pendant bars on the top
of that tower, and how they are placed.

7
What can be seen in Figure 14 is
that the tension rods are
stretched so they can hold up the
crane in the horizontal plane.
The tower is sticking out and
needs, because of its own
weight, be lifted, so it does not
collapse.
Another thing that can be
observed in Figure 14 is that
most parts of the body of the
crane also are built as a
framework to help it withstand
unwished deformation and
prevent movements [13].
Figure 14: The anatomy of a typical crane [13].
Figure 15: A closer look at the tower of the crane with all tension rods [13].
1.2.2.3 Tension bars in buildings
Another area where tension rods can be used is as roof trusses in buildings. It lies in the building to
support it from collapsing from different loads, such as external wind loads. The construction must be
able to withstand these forces, and it is up to the designer to make sure that happens by using those
elements as a part of a framework and prevent movements in the building [14]. A typical case when a
building was constructed badly with respect for the winds was The Citygroup Center, in New York, that
was discovered in the 70’s to have a risk of 1/16 each year to collapse. Winds can be a big dilemma, and
a good model must be used to construct buildings, and that can be made with tension rods [15].
Figure 1 is a very suitable Figure to demonstrate how this works when building a framework, and how
trusses are built into the building to prevent this movement. Figure 16 shows another example, very
comparable to Figure 1, of how trusses can be implemented in buildings to stabilize it. The trusses are
often built up in the roof of the building. That gives stability to the building in the horizontal direction,
and also helps it to hold up the weight from the roof of the building. Figure 16 shows a building with

8
trusses inside the walls as well as the roof.
This makes the building more stable in
more directions and secures it from falling
apart in other directions.
The truss elements in buildings shall be
constructed so they can take up both
tension loads as well as compression
loads. This helps the truss elements to
give the best stability to the whole
building. The truss elements can be built
with I-formed beams in many cases, but
another usual thing is to construct them
with tension rods and compression rods,
since these elements have some
advantages compared to normal I-formed
beams, see section 1.2.5.3 for more
information about the advantages.
Another way to construct frameworks for
houses is by constructing the trusses like
those that can be seen in Figure 17 which shows a pyramid structure of the elements in the construction.
This gives another type of stability that can be used to hold up the buildings own weight, and at the same
time prevent it from collapsing by any external load.
Figure 17: Another way of constructing frameworks for holding up buildings [16].
What is important when dealing with trusses is that their own weight is very low comparable to the rest
of the structure. The trusses shall not press down the framework and it needs a low weight then. The
trusses will be loaded with both their own weight but also with some tension forces/compression forces,
and it needs a well-designed structure to do so safely. How strong the truss elements must be depend
from situation to situation, and if the truss elements is too weak they needs to be replaced with some
kind of stronger elements to fulfill its duties in the building [17].
A tension rod is an element that can be treated as one of these stronger elements. This element is built
to be able to take up stronger forces in the system. This element in much stronger, and has the ability to
withstand higher loads. Examples of how trusses can be used in an arena as support can be seen in Figure
Figure 16: Structure of trusses on the roof and walls of a building [16].

9
18, which shows some tension rods from the company Macalloy (see section 1.2.4 for more information
about products from the company) placed on the top of the roof. Figure 19 also shows some tension
rods, from the same company, used to hold up a floor, at University of Minnesota, and stabilize it.
Figure 18: Tension rods, from Macalloy, on the roof in an arena [6].
There are several things that must be
kept in mind when simulating the
tension rods and deciding how they shall
be used in building, for instance:
1: Preventing failures of any part of the
tension rod, including its connections.
2: Failure of the tension rod as a whole
construction.
3: Controlling the deformations in the
tension rod.
It is very important to make sure the
tension rods are safe, and that they will
be safe from the 3 perspectives given
above. This must all be done when a
strength analysis is made for tension
rods from companies [17].
Dealing with strength in buildings can be a very serious issue. The building must be credible to have a
strength good enough to hold up the whole construction. Table 1 shows some different types of criteria’s
for the credibility in buildings. Table 1 lists three types of safety classes that can be used depending on
the seriousness in the building, taken from a standard that regulates steel constructions [18]. Table 2
shows which safety factors that should be used (safety to the tensile strength) for these three safety
classes over some different times of period, taken from the same standard [18]. How long the tension
Figure 19: Tension rods holding up a floor at University of Minnesota [6].

10
rod, or other steel component will be in use is up to the designer to analyze and that person can use Table
1 and Table 2 as a help on the way when designing the construction.
Table 1: Different classes of safety that can be given to a component in a building, depending on the situation [18]
Consequence class: Description: Example of buildings and
plants:
CC3 High risk for death, or huge
economic, societal or environmental
contingent consequences.
Public platforms, public buildings
where the consequences of a
collapse are serious (example for a
concert hall).
CC2 Normal risk for death, important
economic, societal or environmental
contingent consequences.
Apartments and office-buildings,
public buildings where the
consequences of a collapse are
normal (example for an office-
building).
CC1 Low risk for death, or small
economic, societal or environmental
contingent consequences.
Agricultural buildings where
people normally does not stay
(example for a greenhouse or a
storage building).
Table 2: Different safety factors that shall be used depending on which safety class the construction has been selected to [18]
Safety class: Minimum value for β
Reference period 1 year Reference period 50 year
RC3 5.2 4.3
RC2 4.7 3.8
RC1 4.2 3.3
The safety factors, given in Table 2, depends on the risk of other people being killed or wounded. A
higher safety is needed if that risk is higher, and a lower risk gives a lower safety factor. Tension rods
can be used when a higher safety is needed while a smaller truss component can be used instead if the
safety can be lower. Multiple tension rods, such as those in Figure 18 and Figure 19, can also be used in
the construction to hold up loads. This can help the system by letting each component take a lower load,
and can also create more stability to the system [18].
1.2.2.4 Tension bars in other applications
Tension rods can be used in a number of other types of applications. All types of applications can’t be
mentioned in this report, but some of these areas can be, for instance, balconies, elements to uphold
roofs, stabilizing elements in scaffolding and much more. Smaller tension rods are used if the loads that
they shall lift up are smaller, and larger tension rods shall be used if they do not need to uphold a higher
load. The general rule for when tension rods shall be used is when wires cannot be used to uphold the
construction [19]. Wires has lots of problems compared to tension rods, for instance their lower stiffness,
and they could therefore be a bad choice to used when the element risks to become non-stiff [7].
Figure 20 shows how tension rods can be used to lift smaller glass, and Figure 21 shows roofs how
tension rods can be used to lift balconies [19].

11
Figure 20: Tension rods holding up a glass roof [19]. Figure 21: Tension rods holding up a balcony [20].
1.2.3 The company Proplate AB
Proplate is a company, with its factories in Oxelösund, that specializes in volume-based cutting and
machining of both ordinary steel as well as stainless steel. Proplate gives construction solutions to their
customers all over the world, and produces prefabricated details. Some of Proplate’s steel application
branches are wear resistant components for mining machines, bolt baskets for wind mills and tension
rods for heavy lifting in, for instance, in the crane industry [21].
1.2.3.1 Tension rod components from Proplate
Proplate’s tension rods are one of their biggest products, and they deliver them to companies such as
Liebherr to their crane industry. Proplate’s tension rods can be made in many different forms, with a
thickness from 10-70 mm, and a length from 1-16 m. The straps are normally 35-40 mm in thickness
for a good bearing capacity. The tension rods can also be linked to each other by some elements to make
the elements longer. These components are built with different high strength steels from SSAB, see
section 1.2.3.3 for more information about material properties, and they can lift up to 3000 tons.
Figure 22 shows some of Proplate’s components.
Figure 22: Some of the tension rods from Proplate [21].

12
Some of the components in Figure 22 can withstand higher loads than others. Some constructions, such
as the smaller construction second from the bottom looking like an “eight”, are built to link Proplate’s
straps to each other. This small construction is called walnut-strap in the project. Another method to link
straps to each other is by connecting two straps to a strap with twice the thickness in between them. This
is one method that can be used for connecting many straps to each other [21, 22]. Figure 23 shows the
first way of connecting straps to each other using walnut-straps.
The structure of the four components in
Figure 23 is held together with the help of
two sprints. The sprints are placed in
between the components in through the
holes in the structures. The sprints are then
locked on the other side of the walnut-strap
with the use of a smaller locking element,
and the whole structure is then kept together
to hold the straps in a long chain.
These sprint elements can be used for both
the walnut-strap-design, and for the design
when the straps are directly connected to
each other. This is a very simple but good
way to lock all components to each other in
the system.
A friction contact is made between the
sprint and the inner parts of all the different
straps, thus holding each component
together when the straps are loaded.
1.2.3.2 The friction contact between the components
There will be different types of contact situations between all the components in the system when the
components are drawn/pressed to each other in movement. Friction will occur between all components
in contact, which complicates movements in the system. Some of these areas that will experience friction
contact are the sprints contact to the different straps, the surfaces of the straps to each other and the
surfaces of the straps to the walnut-straps.
The coefficient of friction is not a material parameter, and is therefore not connected to one material. It
will instead depend on which materials that are in contact with each other. The choice of the coefficient
of friction is a multivariable equation that depends on factors such as the surface topography, materials
in contact and much more. The friction between these components depends on the coefficient of friction
which can be written as
𝜇 = 𝜇𝐷 + 𝜇𝐴 (2)
where the first component on the right-hand side in equation (2) represents a deformation part of the
coefficient of friction. The second term on the right-hand side represents an adhesive part of the
coefficient of friction. Materials with a rougher surface structure will make the movement harder
between the surfaces, and thereby increasing the coefficient of friction [23].
Figure 23: Connection between 2 straps and 2 walnut-straps from Proplate’s assortment [21].

13
The coefficient of friction can be assumed to be of a higher value for these surfaces in the tension-rod-
system, since it shall help to hold all components together, so the sprints and straps will hold tight and
not lose their structure when they are loaded.
1.2.3.3 Material parameters in the straps
The straps are built with one kind of material, called Strenx 960, and the sprints are built with another
material, called Toolox 33. The sprints could also be built with a material called Toolox 44.
SSAB describes some advantages with Strenx 960 as:
• Exceptional consistency within a plate guaranteed by close tolerances.
• High impact toughness which provides for good resistance to fractures.
• Superior bendability and surface quality.
• Weldability with excellent HAZ strength and toughness.
Table 3 shows some material parameters of Strenx 960 in its strength. Table 4 shows impact toughness
of the material. Table 5 shows the chemical composition in the alloy. Table 6 shows values for CET,
which is the carbon equivalent and gives information about the weldability for the material depending
on the different amount of alloying elements. Table 3, 4, 5 and 6 is found from SSAB’s material site.
Table 3: Material parameters in the alloy Strenx 960 [24]
Thickness
(mm):
Yield strength RP0,2
(min MPa):
Tensile strength Rm
(MPa):
Elongation A5
(min %):
4.0-53.0 960 980-1150 12
53.1-100 850 900-1100 10
Table 4: Impact properties of Strenx 960 [24]
Grade Min transverse test, impact energy,
Charpy V 10*10 mm tests specimens
Exceeds the requirements for
Strenx 960 E 40 J/-40OC S960QL
Table 5: The chemical composition in Strenx 960, with all elements [24]
C
(max %):
Si
(max %):
Mn
(max %):
P
(max %):
S
(max %):
Cr
(max %):
Cu
(max %):
Mo
(max %):
Ni (max
%):
B (max
%):
0.20 0.50 1.60 0.020 0.010 0.8 0.3 0.70 2.0 0.005
Table 6: Maximum CET-values for Strenx 960 [24]
Thickness (mm): 4.0-34-9 35.0-100.0
CET(CEV) 0.38 (0.58) 0.41 (0.67)
The material properties from Table 3-6 comes after the material has been quenched and tempered. This
gives the material a higher strength, and a better toughness [24].
The material Toolox 33 is described as a hardened steel that is suitable for many applications thanks to
its forming stability. The material has a high toughness, and is therefore a good material for its areas of
application [25]. Table 7 shows some material parameters for Toolox 33, Table 8 shows the same

14
parameters for Toolox 44 and Table 9 shows the different elements that can be found in the chemical
composition in both Toolox 33, Toolox 44 and in another one of SSABs alloys, called Toolox 40. Table
7, 8 and 9 are found on SSAB’s material site.
Table 7: Material properties for Toolox 33 [26]
Toolox 33 – Mechanical Properties: + 20OC + 200OC + 300OC + 300OC +400OC
Hardness (HBW): 300 -- -- -- --
Hardness (HRC): 29 -- -- -- --
Yield strength, Rp0,2 (MPa): 850 690 680 590 560
Tensile strength, Rm (MPa): 980 900 -- -- --
Elongation, A5 (%): 16 12 -- -- --
Impact toughness, Charpy-V (J): 100 170 180 180 --
Table 8: Material properties for Toolox 44 [26]
Toolox 44 – Mechanical Properties: + 20OC + 200OC + 300OC + 300OC +400OC
Hardness (HBW): 450 -- -- -- --
Hardness (HRC): 45 -- -- -- --
Yield strength, Rp0,2 (MPa): 1300 1150 1120 1060 930
Tensile strength, Rm (MPa): 1450 1380 -- -- --
Elongation, A5 (%): 13 10 -- -- --
Impact toughness, Charpy-V (J): 30 60 80 80 --
Table 9: Chemical composition in Toolox 33, Toolox 44 and Toolox 40 [26]
Chemical composition: Toolox 33: Toolox 40: Toolox 44:
C 0.22-0.24% 0.28% 0.32%
Si 0.6-1.1% 1.1% 0.6-1.1%
Mn 0.8% 0.6% 0.8%
P Max 0.010% Max 0.010% Max 0.010%
S Max 0.002% Max 0.002% Max 0.002%
C 1.0-1.2% 1.22% 1.35%
Mo 0.30% 0.5% 0.80%
V 0.10-0.11% 0.12% 0.14%
Ni Max 1.0% Max 1.0% Max 1.0%
CEIIW 0.62-0.71% 0.77-0.81% 0.94-0.98%
CET 0.40-0.44% 0.45-0.50% 0.55-0.57%
1.2.4 Other companies that makes straps
There are several other companies that makes tension rods. Some of the other companies are Macalloy,
Pretec, Dextra Group and Nordic Fastening Group.
The tension rods from these companies are different from Proplates tension rods in many ways. The
tension rods from these four companies have more of a classical design of tension rods, like the one in
Figure 2. Some of these tension rods also do not use sprints to lock the tension rods to other tension
rods/elements, they use screws instead to hold the structure together. These tension rods normally have
a fork head in the end of the tension rod as well. Figure 24 shows 2 tension rods from the company
Dextra Group, and Figure 25 shows fork heads from the company Macalloy, to demonstrate how the
tension rods looks like.

15
Figure 24: Two models of tension rods from Dextra Group [27].
Figure 25: Fork heads used by Macalloy for their tension rods [6].
One idea why these companies use these models for their tension rods is that this model is well described
in different Eurocode standards with what conditions that must be fulfilled. The fork heads can also
easily be taken off by screwing them of the rod. The middle part of the tension rod, that is a long truss
is called the rod, and it is together with the fork heads called a tension rod. The maximum force that the
rod can handle is defined in the standard as [14, 28]:
𝐹𝑚𝑎𝑥 = 𝑚𝑖𝑛 {𝐴 ∗ 𝑓𝑦/𝛾0
0,9 ∗ 𝐴𝑆 ∗ 𝑓𝑇/𝛾2 (3)
A = the unthreaded area of the rod.
fy = the yield strength of the material.
AS = the threaded area of the rod.
fy = the tensile strength.
γ0 and γ2 are safety factors.
A general rule is that the number on the safety factor, for the material type, is
γ0 = 1.0 (for steel).
γ0 = 1.1 (for stainless steel).
γ2 = 1.25.
The safety factors given are the lowest allowed safety factors that can be used for steel constructions in
bearing applications. Higher values can be used for more safety. Proplate’s straps have no threated area
in the rods, thus making equation (3) equal to
𝐹𝑚𝑎𝑥 = 𝐴 ∗ 𝑓𝑦/𝛾0 (4)
Equation (4) can be used to calculate the maximum load a tension rod from Proplate could withstand.
There are more equations that can be used for compression rods as well [14, 28].

16
These different companies have some other elements that they manufacture. One example of those
elements can be seen in Figure 26 which shows a circular plate that straps can be attached to. This
method is one very common method for linking several straps to each other [29].
There are also several rules about how to
install the tension rods easily. The tension
rods shall be linked to the rest of the structure
easily, without giving extra loads to the
structure. The weight of the tension rod shall
be kept as low as possible, but there will be a
weight still there, and this can damage the
tension rod badly if it is installed wrongly. It
is important that the tension rod does not get
bent when it is installed by its weight.
Figure 27 shows some example about how the
tension rod should be installed, and how it
shall not be installed. The worst case is if the
rod is installed like the lowest rod in Figure
27. A maximum deflection of around 0,5o is
allowed for the rod by the different
companies, but higher angular deflections
may damage the structure in the joint points of
the rod [6, 29, 30].
The company Dextra Group has been working in many different projects throughout the years, and many
of these projects can be seen on their homepage [27]. The tension rods shall be avoided to use in areas
where wind loads can infect the structure, or if any vibrations from the surrounding can do it. The
structure is not made to be able to withstand unwanted inflections, and it is closely related to how the
tension rod has been installed [28].
Nordic Fastening Group has also delivered tension rods to many applications, such as bridges, buildings,
shopping malls, bus terminals, airports, exhibition halls and much more. They are selling rods for both
tension applications as well as compression applications [30].
The straps that Nordic Fastening Group delivers have also been analyzed with help of The Finite
Element Method to get a good overview of the stresses inside the tension rod. Figure 28 shows an
analysis made on their fork head on one of the tension rods. The red area represents the locations where
the stress is of tension in character, while the blue area represents where compression stresses is located
at the fork head.
Figure 26: A circular plate that can be used to link several tension rods to each other used by many companies [29].
Figure 27: Some better ways and worse ways of installing tension rods to the structure [6].

17
Figure 28: An analysis made with the finite element method to determine the stresses inside a fork head [30].
Dextra Group and Pretec are two of those companies that does not use prints to connect the straps to
each other, instead they connect them by screws. Dextra Group has screw threads from the size of M16
to M108 [31], and Pretec has models for M16 to M160. Pretec’s straps can also be seen in their product
catalogs where they list their different models. Table 10 shows an example of those lists.
Table 10: List of different types of Pretec’s straps with their corresponding maximum loads [29]
Pretec’s straps are called ASDO-straps, and Table 10 lists the maximum load each type of strap can
maximally take before breaking. Some of Pretec’s longest straps are around 22 m, and their strongest
ones can take up loads to almost 10 MN [29].
Macalloy builds both straps for tension loads as well as for compression loads, and Macalloy has also
some product catalogs that can be used when buying their straps to find the right one. Table 11 shows a
typical Table for a specific type of strap taken from their catalogs.
Table 11: List of different types of from Macalloy straps with their corresponding maximum loads [6]
1.2.5 Rules, requirements and problems with tension rods
Tension rods shall be designed under some rules to make sure they are safe. This part of the report will
explain more about the rules, requirements and things that can go wrong with tension rods.

18
1.2.5.1 Problems with tension rods
Several aspects must be kept in mind when designing tension rods. The design must be suitable to the
forces that is subjected to it. The maximum tension stresses from the applied force, and the avoidance
of unwanted inflections, have already been mentioned, but there are other aspects to control such as
material fatigue, creep in the material and many other things that can damage the tension rod. The tension
rods must also be designed with material that will not corrode, and it needs to be installed to the
construction in a way that will not damage the end points, see Figure 27. Instability due to buckling is
normally not a factor that needs to be kept in mind for tension rods, but must be calculated for
compression rods [7, 14, 32-34].
Fatigue is a serious factor that is the dominant reason for failures of products. The material will, after
some time under loads, be beaten down and the material will then break apart [5, 35]. Tension rods are
often made to be used during longer periods of time, and investigating the number of cycles needed to
break the material under its fatigue load is of great importance [34].
Failures of tension components often happens around the joint points. These points must therefore be
constructed with extra safety, and the coefficient of friction in the joints might have to be determined
directly by testing [7]. These endpoints can experience an increase in the stresses, due to stress
concentrations. A geometrical stress concentration factor, Kt, that describes the increase in stress around
these points can be written as
𝐾𝑡 = 𝜎𝑚𝑎𝑥
𝜎𝑛𝑜𝑚 (5)
σmax is the maximum stress. σnom represents the nominal stress, and is the net-section average stress in
the hole cross-section, or further away. The increased stress often needs to be controlled, and this can
be calculated if the nominal stress is known and if the geometrical stress concentration factor is also
known [4].
The Silver Bridge, mentioned in section 1.1, failed in 1967, and was investigated for failures of the
eyebar due to fatigue. The bridge suddenly collapsed, without any warnings, and a crack was believed
to have grown to a critical length from one ear of the eyebar. Corrosion problems had occurred, and that
failure was believed to be because of either the mechanisms of corrosion stress or corrosion fatigue. It
was later on discovered that the eyebar cracked not because of fatigue, but the time and money that was
spent when investigating the presence of any sight of fatigue shows the importance to control this when
constructing different constructions [5].
Corrosion problems can together with fatigue make the design more critical, and can cause a failure
more easily. Table 12 shows some different exposure classes that must be used when corrosion and
fatigue are of importance at the same time.
Table 12: Table over different exposure classes depending on corrosion and fatigue [7]
Fatigue load Corrosion effects
not externally exposure externally exposure
no serious fatigue load class 1 class 2
primarily axial fatigue load class 3 class 4
Fatigue load in both axial and
transversal direction (wind and rain) --- class 5

19
Another serious thing to control is the creep that can occur in the material over some time. The material
will with time start to deform without any needed change in the load. This can be of importance when
the construction is under higher loads for longer times [5]. This normally happens for metals if they are
at elevated temperatures, from 30% of its melting temperature (measured in K) and up, for longer periods
of time. This can also happen to other materials, such as polymers, already at room temperature [5, 36].
There are also other problems, such as external loads, that can affect the result, and these factors must
also be calculated and optimized. Wind loads can easily put the tension rod in vibration, and this state
can cause serious problems to the whole construction. There are some problems when trying to calculate
both the fatigue and the wind effect on these components which makes these analyses harder to do.
Other problems can occur if any of the elements in a framework is suddenly unloaded. Instability, fatigue
and other types of damages can come up on the other elements if one tension rods suddenly get unloaded.
A pretension can be set to the system to make them loaded from the start. This can be useful to make
the construction stiffer, and prevent components from just hanging in the air [7].
1.2.5.2 Rules for tension rods
Several rules can be found about how to construct tension rods, and how they shall be tested. Some of
these rules can be found in, for instance, the standard SS-EN 1993-1, which regulates the design
requirements of steel constructions in lifting applications. Parts from this standard that can be used when
forming tension rods are:
1. General rules and rules for buildings
2. General rules – Structural fire design
3. General rules - Supplementary rules for cold-formed members and sheeting
4. General rules – Supplementary rules for stainless steels
5. Plated structural elements
6. Strength and stability of shell structures
7. Plated structures subject to out of plane loading
8. Design of joints
9. Fatigue
10. Material toughness and through-thickness properties
11. Design of structures with tension components
These standards only regulate the steel products from areas such as lifting capacity, resistance to fire
accidents and similar things. Requirements on insulation, and several similar factors, will not be
mentioned in these standards [14]. Companies such as Dextra Group, Pretec and Macalloy are
companies that uses these standards when forming their tension rods [28, 29, 31]. It can also be useful
to work with the standard SS-EN 1990-1, which is called:
1. Eurocode - Basis of structural design
This standard gives some extra rules that can be of use together with SS-EN 1993-1. Much of the
information in these standards are not directly linked to tension rods, it is just for ordinary steel
constructions instead. Some of the information that can be used for tension rods are for choosing the
right material, while some other parts are there for analyzing stresses in the materials.
1.2.5.3 Requirements on Tension rods
There are several requirements on tension rods that must be fulfilled if they shall be able to work
successfully, but tension rods can be very useful constructions if they are fulfilling these requirements.
Some advantages with tension rods, compared to other similar products such as cables, are:

20
1. Less elongation under load.
2. Lower post tension forces required.
3. Better corrosion resistance.
4. Better long-term relaxation.
5. Reduced costs for monitoring and maintenance.
6. Simplicity with installation thanks to its design.
All these six advantages are some reasons why a tension rod should be used in constructions instead of
simple truss elements. Tension rods can also withstand large loads without breaking, and more tension
rods can be applied, like in Figure 29, if a higher load is applied.
The tension rods must be tested at the temperatures they are going to be used in. They shall be tested in
room temperature if they are about to be used in room temperature, and they shall be tested at elevated
temperatures if they are about to be used at elevated temperatures. The material they are built in can
have a great change in its properties when it is heated up, and that means that the results at room
temperature are invalid.
One situation where the temperature can increase is in case of a fire is started. A fire can change the
material properties of the steel, and decrease the yield stress, and the tension rod can break at lower
loads. A safety factor can be used if the tension rods are about to be used where fires can start. Creeping
can also occur at elevated temperatures, which can damage the tension rods [37]. Parts that lie in between
other tension components shall also be easy to remove, if needed, but they shall be kept safe from the
surrounding, so they do not get damaged by, for instance, fires [7].
The tension rod must also be dimensioned against many other types of accident loads. Something can
always go wrong with the rod, and it is important that the construction do not collapse easy [14]. Table
2 shows some safety factors that can be used to make sure everything is all right with the construction
[18]. The weight of the tension rod could also be able to create instability in the material if it is pressing
the construction in a wrong way. This is another accidental load that can be threating the tension rods,
and must be designed against [14].
A very important part to analyze is the joint points of the tension rod. These points are often weak, due
to stress concentrations that can occur, and a bad construction can damage the whole component badly.
It is also important to form the tension rods in a way showing if they are about to break, so a collapse,
Figure 29: Several tension rods applied to hold a stronger construction together [27].

21
like the one with the eyebar in The Silver Bridge can be avoided, or at least foreseen [18, 33]. It is also
very important to always control all the calculations done in the engineer process to make sure all
calculations can be proved by real testing. All models can have problems when they are built, and it is
therefore important to make sure all calculations are correct in the reality [38].
Proplate uses sprints to lock their straps to each other, but many other companies use screws instead.
Screws make the straps stronger in their locking system to each other, and it makes them in one way
easier to deal with since screws can be found in standards. It is generally very important to make sure
weaker parts are not going to fail in constructions due to factors like corrosions, fatigue or wear, and
screws are a typical element that can fail due to this [14, 39].
Stainless steels can be recommended when constructing tension rods. These steels can be discolored in
building applications, but they are still useful. It is often hard to calculate the corrosion in these
applications, and using already existing models/formulas/results can be of great use, and after that try to
find the material that fulfills the requirements best [39].
The corrosion resistance for the screws should be just as good, or even better, than the corrosion
resistance of the material it surrounds. The screws will be under loads in small areas, and stress corrosion
can be a big problem because of that. This type of corrosion occurs more often with increasing loads in
these tension applications as well, so this problem becomes bigger at elevated temperatures. The screws
are recommended to be made of stainless steels for this application to prevent, for instance, corrosion
problems that can occur. Screws made of any ordinary steels can become a big problem when they are
about to be used in these applications together with stainless steels as tension rods. The area relation can
become big between the two materials, and the screws will have a high risk to start to corrode
aggressively [39].
The screws can be loaded in many ways. They can be tensile loaded (preloaded for instance), and they
can be shear loaded, and the difference between them can be seen in Figure 30. Tensile loaded screws
can be both preloaded and not preloaded depending on how the construction should be formed. Shear
loaded screws can be formed in several ways, one is to form a double lap joint which is how the screws
are formed from many of the other companies [33]. Figure 31 shows a simple double lap joint that is
built up by three plates and two screws.
Figure 30: The difference between crews that are under tension and under shear [33].
Figure 31: A simple drawing of a double lap joint [40].

22
The screw models that are recommended to use in this type of application area are screws made from
screw classes from the 4.6-models to the 10.9-models. Data of their yield strength and tensile strength
can be found in Table 13.
Table 13: The yield strength and the tensile strength of different classes of screws that are recommended [33]
Strength-
class:
4.6 4.8 5.6 5.8 6.8 8.8 10.9
fyb (MPa): 240 321 300 400 480 640 900
fub (MPa): 400 400 500 500 600 800 1000
Table 13 shows that the strength-class that gives approximately the same yield strength to screws
compared to the yield strength of the sprints is the 10.9-class. This one is the closest in that aspect.
1.3 Project description with goal and purpose
1.3.1 Project description
Proplate is a world leading company when it comes to constructing tension rods, and they are selling
their products worldwide to several companies. These tension rods can then be used in a number of
applications for the companies. Proplate would like to improve its market so many other companies can
find them, and buy their products in the future. Proplate would therefore like to have a catalog of their
products to show them to the world, and to help the customers to find the right product with the right
dimensions easily.
Proplate could by this catalog promote themselves better on the market. Proplate is specially looking for
a catalog made for their tension rods. This catalog will show some of their most common tension rods
with their dimensions. This catalog will also be able to show the loads that each of their models, with
different dimensions, can handle. This will be similar to Pretec’s and Macalloy’s catalogs (see Table 10
and Table 11 for example of how these companies present their tension rods).
All the different tension rods must first be tested numerically to find the maximum forces they can
withstand, and the result can then be used to systematize into a catalog to present the result. This project
will work with developing the basis for the catalog, and all the data the company needs. Proplate has
four different tension rods, three ordinary tension rods and the walnut-strap, which will be tested in the
project. The Tables 10 and 11 can be a guidance to what the result should look like.
Some of the other companies that were described in section 1.2.4 have a threading on their tension rods
which makes it possible to screw together many tension rods to each other with a screw. This is
something that Proplate is interested in analyzing in order of developing a similar way to connect their
tension rods to each other. Proplate would also like to know more about how they could implement this
to their products, and how to manufacture the thread to their tension rods. This will also be investigated
in the project.
The tension rods will be dimensioned from the standards SS-EN 1993-1-1 to SS-EN 1993-1-11 and SS-
EN 1990-1, like some other of the companies does, see section 1.2.5.2 for more information about the
content in these standards. These standards regulate steel construction in general, and most of the
information in them will not be used in this project. Much of the information is also made for when the
tension rods are about to be design, and it will also not be used in the project, but the needed information
from the standards will be taken out and used to make sure the tests go perfect. Some of the rules and
requirements will be given in section 2. Method, and some other information can be found in, for
instance, section 1.2.5 with the rules and requirements for the tension rods. It is of importance that all
tested elements can be replaced in the construction in order of using these standards [7].

23
1.3.2 Purpose and goal
The purpose of the project is to find, from strength simulations, the maximum load that different tension
rod models can withstand, and thereby finding the information needed for Proplate to produce a catalog
to market themselves and their tension rods. The possibility for a future change in the models, by
replacing the sprints with screws, will also be investigated to give Proplate the wanted information.
The goals are the following:
• Find maximum loads that can be applied to all Proplate’s tension rods.
• Derive tables that shows this maximum load depending on the shape of the tension rods.
• Investigate advantages and disadvantages if Proplate manufactures their tension rods with a
screw as the connecting element instead of a sprint, and how this should be formed.

24
2. Method 2.1 Work flow description
The tension rods were first modeled in the CAD-program Creo Parametric 3.0 by PTC Inc, based on
drawings made from Proplate of their models, see section 2.3 for more information about the models.
The models were then formatted into step files and imported to the program Abaqus/CAE 16.4, for the
strength analyses by Finite Element Method-simulations (FEM). The models, with different dimensions
in thickness and length, were then connected to each other, in different ways, and tested under different
loads, see section 2.6 for more information about the modeling of the component in Abaqus. The aim of
the analyses was to calculate the maximum loads the different constructions could withstand before
failing. The loads used were assumed by simple calculations, see section 2.6.5 for more information
about the magnitude of the loads. The results of the maximum loads, calculated from the FEM-analysis,
were summarized and finally tabled for all the different models with their different dimensions to present
a final result.
Some instructions about the simulations that were made in Abaqus came from ABAQUS/CAE User’s
Guide for Abaqus 6.14. This manual was used to help with the simulations and the modeling.
The tension rods also had to follow the rules given in the standards SS-EN 1993-1 as good as possible
to secure them against typical failure problems. The analyses were then performed under some
assumptions (see section 2.5 for more information about the assumptions made) which can affect the
result in a bad way. The analysis should therefore, according to the standards, be tested in real life before
it can be used to make sure the FEM-results are correct [32].
2.2 Modeling requirements
It is of great importance to understand what the requirements are for the modeling work with the models.
The tension rods must be analyzed correctly, and some important factors needs a better formulation to
minimize problems that can appear. The weight of the components is an important factor, and it must
be analyzed correctly. It might be out of importance when the weight of the component is small, but its
importance increases with increasing weight. The weight of the components, and the possible pre-load
in the joint points, can generally be analyzed as a permanent load in tension components, for example
in long wires. An analysis of how the weight influences the stresses in the component can be made to
determine their importance in the analyses [7].
The models are about to work softly without any failures, and are therefore modeled to their yield
strength as the maximum stress applicable. Equation (4) was used to define the maximum load, together
with the yield strengths given from Table 3 and Table 7, and with a safety factor of 1 in the calculations
(which should be used for steels). More safety factors can also be used depending on situation and where
the tension rod shall be used, but this is up to the designer in the specific application to decide, so the
analyses in the report only gives the absolute maximum force the components can withstand. The
maximum stresses that the sprints and the tension rods, made of material with a thickness less than 53
mm, can withstand are
{𝜎𝑚𝑎𝑥,𝑠𝑡𝑟𝑎𝑝𝑠 = 960 𝑀𝑃𝑎
𝜎𝑚𝑎𝑥,𝑠𝑝𝑟𝑖𝑛𝑡𝑠 = 860 𝑀𝑃𝑎
Components that have a non-constant cross section shall generally be analyzed with the help of the finite
element method to get the best result. There are many important aspects that must be considered for
these types of analyses. The modelling with the boundary conditions and contact conditions, are just a
few of these factors [32]. The components analyzed in the project were believed to be able to have all

25
its boundary conditions defined in a conservative way, for instance, freely suspended or firmly clamped.
A steel construction that can have all its boundary conditions defined in a conservative way can have all
its components analyzed one by one in the analysis. Generally, a global analysis must always be made
for the construction, even if it is conservatively defined to make sure all the components also can work
together without failing [38].
An ordinary analysis shall determine if the components will fail under either deformations that are too
extreme for the construction that creates a fracture in the components, lost stability that gives problems
for any of the components to work under normal conditions or when fatigue and other time dependent
effects damages the construction [18].
2.3 CAD-models
The following sections will show the different CAD-models, which were made and used in the project,
and how these models were connected to each other.
2.3.1 CAD-models of tension rods
Proplate has three tension rods that were investigated in the project. They are called strap-A, strap-B
and strap-C in the project. Proplate also has a fourth tension rod called walnut-strap. A CAD-model of
strap-A can be seen in Figure 32, and a detailed drawing of it can be seen in Appendix 1.
Figure 32: CAD-model made of Strap-A, with a length of 1000 mm between the centrum points of the holes.
This tension rod has a height of 60 mm in the rod part. The length of this tension rod can be varied so
that the distance between the center point of the holes increases, and the distance between these points
is x m (where x is an integer) with x going from 1-16. The thickness of this tension rod can also be
varied with values from 10 mm up to 50 mm, with an increase of 10 mm each time.
A CAD-model of strap-B can be seen in Figure 33, and a detailed drawing can be seen in Appendix 2.
Figure 33: CAD-model made of Strap-B, with a length of 3000 mm between the centrum points of the holes.
This tension rod has a height of 45 mm in the rod part. That tension rod can be used when a longer chain
of tension rods is needed, since many tension rods can easily be connected to each other on both sides
of this model. The length of this tension rod model can be varied so that the distance between the center
point of the holes increases, and the distance between these points is x m (where x is an integer) with x

26
going from 1-16. The thickness of this tension rod can also be varied with values from 10 mm up to 50
mm, with an increase of 10 mm each time.
A CAD-model of strap-C can be seen in Figure 34, and a detailed drawing can be seen in Appendix 3.
Figure 34: CAD-model made of Strap-C, with a length of 5500 mm between the centrum points of the holes.
This tension rod has a height of 145 mm in the rod part. This gives an increase in the bending stiffness,
E*I, where E is the modulus of elasticity and I is the moment of inertia. This makes this model suitable
for heavier loadings since the greater bending stiffness will reduce the deflection of the system [4]. The
length of this tension rod can be varied so that the distance between the center point of the holes
increases, and the distance between these points is x m (where x is an integer) with x going from 1-16.
The thickness of this tension rod can also be varied with values from 10 mm up to 50 mm, with an
increase of 10 mm each time.
A CAD-model of the walnut-strap can be seen in Figure 35, and a detailed drawing can be seen in
appendix 4.
Figure 35: A CAD-model made of the walnut-strap, with a length of 500 mm between the centrum points of the holes.
This model is made to connect some tension rod models to each other. This model has a fixed length,
but the thickness of this model can be varied from 5 mm to 25 mm, with an increase of 5 mm each time.
This model shall always have half the thickness of the tension rods it is connecting. This model is not
symmetric in the middle since the height of the two endpoints is different (see appendix 4).
The CAD-models were made in the project from the drawings, and the drawings came from Proplate.
2.3.2 CAD-models of other components
Other elements were also made into models. Sprints were made to hold some of the tension rods together
into a longer chain. Locking elements are used to lock the sprints to the rest of the structure. An element
for the load application, called the loader, was also made in the project to make the simulations more
realistic. Figure 36 shows two different types of sprint models (to the left and in the middle), and also
the locking element that is placed in the hole of the sprints (the right figure).

27
Figure 36: 2 different CAD-models of the sprints, and a CAD-model of the locking element that is placed in the hole of the sprints to prevent them from falling off.
There are no exact drawings made for the sprints nor the locking elements. These components models
were made in CAD with a real sprint as inspiration for the dimensions of the models. Figure 37 shows
a simple drawing of the sprints that shows the assumptions made for the general modeling of the different
sprint elements.
The sprints were designed so they
always would fit perfectly into the
hole they are put in. This condition
means that the length d is always the
same as the hole-diameter in the
tension rod.
Other dimensions given is that:
D = d + 20 mm,
h = 10 mm,
L = 15 mm,
b = 10 mm.
The length H – (h +L + b) will be
varied so it fits to all the different
models. This length shall be equal to
the length of the hole of the
component it shall go through.
There are two chamfers made in the sprint model. A chamfer of 2 mm is made in the upper corner of
the sprint all around it, and a chamfer of 3 mm is made on the bottom of the sprint all around it, see
Figure 36 for a better view of it.
The locking element was made to fit into the hole of all the models of the sprints. The locking element
was made only to the visualization of the project. This element was never used in any of the simulations
since it was assumed that it could be excluded in that part of the analyses.
Another model made was the loader, which can be seen in Figure 38 from two different views.
Figure 37: Drawing of a sprint with design parameters.

28
Figure 38: Different view of the CAD-model of the loader.
The loader is a model that there are no drawings made of, and it is a component made just to make the
results more realistic. This model shall be linked to the tension rods at their ends, and a load will be set
to this model to make it act on the tension rods. The loader consists of a steel cube with two walls,
shaped as a “c”, with a circular rod in the middle of it. This circular rod will be the thing that connects
to the tension rods. The dimensions of the circular rod will be the same as the hole it shall fit in. The
length of the rod was first set to the same as the thickness of the tension rods, so the tension rods would
fit exactly in the loaders. This length was later changed due to problems that were discovered from the
results of a pre-analysis made. The length of the circular rod became then twice as long as the thickness
of the tension rods, see section 2.4.3 for more information about the change of the rod length of the
loader. The walls of the steel box were set to the same as the thickness of the tension rod. The dimensions
of the steel box were set to 60 mm in height, and a varied thickness and width, see section 2.6.5 for more
information about the dimensions of the loader.
2.3.3 Building of larger components by CAD-models
2.3.3.1 Strap-A
The first type of tension rod will only be tested as one component at the same time. It will be locked
with a loader on each side, according to the tension rod in Figure 39 which shows a tension rod connected
to a loader at one side.
Figure 39: Strap-A connected to a loader at one side.

29
This type of connection can be made for Strap-A, but it can also be made for each one of the three
different tension rod models, with different dimensions on the loader. This will be tested in the
simulations for all the different types of tension rods. The loader model that is seen in Figure 39 is the
loader model that was made after the dimension changes of the model that was done later in the project.
2.3.3.2 Strap-B
The second type of tension rod can be treated as a single component, just like Strap-A, but it can also
be connected to several tension rods. A tension rod is connected to two tension rods of the same type,
but with a thickness of the half, at each side of it, and they are locked by a sprint in each hole. Figure 40
shows how this looks from 2 different angles.
Figure 41 shows an explosion view of the components in Figure 40.
Figure 40: Strap-B connected to each other, seen from two different angles.
Figure 41: An explosion view of all the components in Figure 40.
2.3.3.3 Strap-C
The third type of tension rod can be treated as a single component, just like Strap-A, but it can also be
connected to several tension rods with the help of the walnut-Strap. A tension rod is connected to two
Walnut-straps, with a thickness of the half of the tension rod, at each side of it, and they are locked by
a sprint in each hole. Figure 42 shows how this looks from 2 different angles.
Figure 43 shows an explosion view of the components in Figure 42.

30
Figure 42: Strap-C connected to each other, with the help of walnut-straps, seen from two different angles.
Figure 43: An explosion view of all the components in Figure 42.
2.4 Pre-analysis
A decision had to be made about several factors in the project, which would affect how the simulations
would be performed. The gravity, and if that should be considered when analyzing the tension rods, is
one example, and the coefficient of friction between the materials is another one. Including the effects
of the gravity will provide a better result, but the analyses will take a longer time to do. A larger friction
might also be able to affect the result on one way. A pre-study was carried out where the effects of the
gravitation and friction were investigated.
Section 2.4.1-2.4.4 show the result of that study for different situations with the gravity tested, section
2.4.5 shows when the coefficient of friction is tested, and section 2.4.6 shows the interpretation of the
result taken from section 2.4.1-2.4.5.
The tension rods were tested in the pre-analysis. It was believed that all the models could show a very
similar result in the tests. Strap-B is the easiest tension rod to simulate thanks to its symmetry in the
middle of the length of the rod, and it was therefore chosen as the specimen in the pre-analyses. The
results from the simulations on this model is believed to work similarly for Strap-A as well as Strap-C.
2.4.1 Modeling for gravity tests in Abaqus
The first weight analysis was performed with three different types of dimensions and placed in two
different orientations in the space. The first strap-B was 1 m in length, and 10 mm in thickness. The
second strap-B was 8 m in length, and 30 mm in thickness. The third strap-B was 16 m in length, and

31
50 mm in thickness. These straps were placed between 2 loaders, one in each end, and held up by them.
Only half of the model was used since a symmetry is in the middle of the models could be used to
minimize the calculations. Figure 44 shows the first tested model of the smallest tension rod.
Figure 44: The smallest of the tension rods tested first in the analysis.
All the tension rods, and other components, had a density given to ρ = 8750 kg/m3, a modulus of
elasticity of 210 GPa and a Poison ratio of 0.3 in the pre-analysis. Only one step was created for the
analysis. The increment sizes were 0.1 in the initial, 1/109 in the minimum and 1 at the maximum.
An interaction was set between the tension rod and the loader between their surfaces, and between the
hole of the tension rod to the cylindrical rod in the loader, seen Figure 45. The loader was set to be the
master and the tension rod was set to be the slave in that interaction relationship. A hard, penalty contact
was used. The coefficient of friction was set to 0.78.
The loader was fully encastered on the side holding the loader, and the tension rod had a symmetry
boundary condition to prevent it to move in its normal direction, see Figure 46. The gravity load was
then applied to the tension rod, but not the loader, with a value of 9.81 m/s2. The direction of the gravity
was changed between the test of the tension rod that was laying down and standing.
A mesh was made with a tetragonal element with a mesh size of 50 for the loader and 20 for the tension
rod and a job was then created.
Figure 45: Interactions between the surfaces of the tension rod (right Figure), and the loader (left Figure) where the loader is the master and the tension rod is the slave in that interaction relationship.

32
2.4.2 Results from gravity tests in Abaqus
Figure 47 shows the result of the first testing when the tension rod was laying down.
Figure 47: The result of the first test for the first tension rod with the loader. The Figure shows the Von Mises Stress in the material, with the red area representing higher stresses, and the blue area represents lower stresses.
A second test was made when the tension rod stood up at 90o, and the result from that test can be seen
in Figure 48, where only the tension rod is seen.
Figure 48: The result of the second test for the first tension rod with the loader. The Figure shows the Von Mises Stress in the material, with the red area representing higher stresses, and the blue area represents lower stresses.
The first two tests show that the tension rod that stood straight up had the lowest stresses in it, and the
tension rod that was laying down had the highest stresses in it. The maximum stress was only around
1.3 MPa, which is much less than 1% of the yield strength for the material.
The same analyses were made again for the 8 m long tension rod. The tension rod was divided into two
parts, with a tie constrain in between them to hold them together. This was made to make it easier to
assign the interactions more easily to the right area. The longer tension rod was tested, and Figure 49
shows the result for the tension rod in the same direction as the one in Figure 47. Figure 50 shows the
Figure 46: Boundary conditions for the tension rod (left figure) and the loader (right figure), where the tension rod is prevented from moving in the normal direction due to symmetry, and the loader is fully encastered on the side it is suspended at.

33
same type of result as Figure 48 when it comes to the direction of the tension rod. The highest stresses
were found in the middle of the tension rod, and only that area is displayed in Figure 49 and Figure 50
due to the size of the construction. Figure 49 and Figure 50 show the absolute value of the stresses and
not if those stresses are in tension or compression.
Figure 49: The result of the first test for the second tension rod with the loader. The Figure shows the Von Mises Stress in the material, with the red area representing higher stresses, and the blue area represents lower stresses.
Figure 50: The result of the second test for the second tension rod with the loader. The Figure shows the Von Mises Stress in the material, with the red area representing higher stresses, and the blue area represents lower stresses.
The tension rod that was standing did once again show the lowest maximum stresses, and the laying one
did once again show the highest maximum stresses. The maximum stress in the tension rod is now
around a litter less than 10% of the yield strength of the material.
The third tension rod was also tested in the two different directions. Figure 51 shows the result of the
analysis when the tension rod was standing up and Figure 52 shows the result when the tension rod was
laying down.
Figure 51: The result of the first test for the third tension rod with the loader. The Figure shows the Von Mises Stress in the material, with the red area representing higher stresses, and the blue area represents lower stresses.

34
Figure 52: The result of the second test for the third tension rod with the loader. The Figure shows the Von Mises Stress in the material, with the red area representing higher stresses, and the blue area represents lower stresses.
The maximum stress in the tension rod has now increased to around 1/3 of the yield strength of the
material. This was observed when the tension rod was laying down. The standing tension rod does also
show higher stresses in the rod.
2.4.3 Modeling for combined load test in Abaqus
Another pre-study was made to test how the gravitation can influence the result together with a tension
force applied. The test started by testing only how the tension force would affect the result. The tension
rod was only laying down in these experiments.
The loader was first modeled as the first prototype of it from 2.4.1, but the result had some problems, so
the loader was redesigned to prevent these problems, see section 2.3.2 for more information about the
design change. The model was almost modeled in the same way as in section 2.4.1, but the boundary
condition on the loader was removed, and replaced with a pressure instead. The interaction between the
outer surfaces of the loader and the tension rod was also removed. Figure 53 shows the new interaction
between the loader and the tension rod.
Figure 53: Interactions between the surfaces of the tension rod (right Figure) and the loader (left Figure), where the loader is the master and the tension rod in the slave.
A new boundary condition was given to the upper and lower surfaces of the loader, which prevented all
movement in the gravitational direction. Figure 54 shows where the pressure was applied, and Figure
55 shows how the boundary condition was applied.

35
The new tension rod had a thickness of 40 mm, and a length of 6 m. Two steps were made for the model.
The gravitation load was applied in the first step, while the tension load was applied first in the second
step. The applied pressure was the maximum pressure the rod of the tension rod should be able to
withstand before failing.
The rod has an cross-section area of 40*45 mm2, and was tested for a pressure of 872 MPa. The load
that should be applied to the loader was calculated as:
𝐹 = 𝜎 ∗ 𝐴 ≈ 872 ∗ 180 𝑁 = 1.5696 𝑀𝑁.
This force should be applied to the loader, with an area of 120*200 mm2, which gives a pressure of
𝜎 =𝐹
𝐴≈
1.5696 ∗ 106
24000= 65.4 𝑀𝑃𝑎.
This pressure was placed on the loader according to Figure 54. A mesh was made with a mesh size of
20 for the whole model, with tetragonal elements.
2.4.4 Results from combined load test in Abaqus
The gravity load was first turned off to test the effect of only the tension load to see if this load could,
by itself, start plastically deforming the tension rod. Figure 56 shows the result of that analysis.
Figure 54: The result of the test for the tension rod with the loader when only the tension force is applied to the model. The Figure shows the Von Mises Stress in the material, with the red area representing higher stresses, and the blue area represents lower stresses.
The most critical part was now the endpoints of the tension rod. The rod was not the part that did
experience the greatest stresses. Much of the surface in the hole in Figure 56 was over the yield strength.
Figure 54: The load applied to the loader. Figure 55: The new boundary condition added to the loader.

36
The gravity load was turned on again, and the model was tested with that. Figure 57 shows the result of
that analysis with both gravity and the force applied. Figure 58 shows the result of the analysis for only
the tension rod.
Figure 55: The result of the test for the tension rod with the loader when both the tension force and the gravity load is applied to the model. The Figure shows the Von Mises Stress in the material, with the red area representing higher stresses, and the blue area represents lower stresses.
Figure 56: The result of the test for the tension rod with the loader when both the tension force and the gravity load is applied to the model. The Figure shows the Von Mises Stress in the material, with the red area representing higher stresses, and the blue area represents lower stresses.
Figurer 59 shows the stresses underneath the model. The colored parts are those where the stresses are
over the yield strength of the material. Colored parts can also be seen inside the hole of the tension rod
to the left in Figure 59.
Figure 57: The result of the test for the tension rod with the loader when both the tension force and the gravity load is applied to the model. The Figure shows the Von Mises Stress in the material, with the red area representing higher stresses, and the blue area represents lower stresses. The coloured areas are those where the stresses go over the yield strength of the material.

37
2.4.5 Modeling and results for friction test in Abaqus
Several parts of the tension rods will be in contact in the analyses, especially for those more complicated
models of several tension rods connected, and that will lead to friction forces between the surfaces. The
value of the coefficient of friction will influence the final result from the simulations. A rougher surface
will influence the deformation part of the coefficient of friction, and thereby increase the friction
between the surfaces. Different values of the coefficient of friction were tested in this analysis. The
model with both gravity and the tension force added, from section 2.4.4, was once again tested. The
value of the coefficient of friction was changed to 0.3, 0.4, 0.5, 0.6, 0.7 and 0.8, and the gained effects
were studied. The pressure added to the loader in this simulation was 70 MPa.
The effect of a coefficient of friction of 0.3 can be seen in Figure 60. The effect of a coefficient of
friction of 0.4 can be seen in Figure 61. The effect of a coefficient of friction of 0.5 can be seen in Figure
62. The effect of a coefficient of friction of 0.6 can be seen in Figure 63. The effect of a coefficient of
friction of 0.7 can be seen in Figure 64. The effect of a coefficient of friction of 0.8 can be seen in Figure
65. Only regions where the stresses are higher than 1100 MPa in the model can be seen in those Figures.
All other regions are painted black. It was revealed that the end points of the tension rod were exposed
to the highest stresses, so they are the visualized parts in Figure 60-65. Only half of the tension rod is
seen in figure 60-65 due to symmetry in the middle of the thickness in the tension rods.
Figure 58: The result of the test when the coefficient of friction was 0.3. The Figure shows the Von Mises Stress in the material, with the red area representing higher stresses, and the blue area represents lower stresses. The coloured areas are those where the stresses go over 1100 MPa.
Figure 59: The result of the test when the coefficient of friction was 0.4. The Figure shows the Von Mises Stress in the material, with the red area representing higher stresses, and the blue area represents lower stresses. The coloured areas are those where the stresses go over 1100 MPa.

38
Figure 60: The result of the test when the coefficient of friction was 0.5. The Figure shows the Von Mises Stress in the material, with the red area representing higher stresses, and the blue area represents lower stresses. The coloured areas are those where the stresses go over 1100 MPa.
Figure 61: The result of the test when the coefficient of friction was 0.6. The Figure shows the Von Mises Stress in the material, with the red area representing higher stresses, and the blue area represents lower stresses. The coloured areas are those where the stresses go over 1100 MPa.
Figure 62: The result of the test when the coefficient of friction was 0.7. The Figure shows the Von Mises Stress in the material, with the red area representing higher stresses, and the blue area represents lower stresses. The coloured areas are those where the stresses go over 1100 MPa.

39
Figure 63: The result of the test when the coefficient of friction was 0.8. The Figure shows the Von Mises Stress in the material, with the red area representing higher stresses, and the blue area represents lower stresses. The coloured areas are those where the stresses go over 1100 MPa.
Figure 60-65 shows that the area that is exposed to a stress greater than 1100 MPa increases when the
coefficient of friction increases. This means that a higher friction force gives a higher stress inside the
material of the tension rods.
2.4.6 Interpretation of the Abaqus results
The gravitation effect has been investigated to understand the importance of including the gravitation in
the calculations. The result shows that the gravitation does not influence the result much when the
models are smaller and thinner, independent of the direction the model is placed in, so it could perhaps
be excluded in analyses with those. The gravitation effects are reaching higher values for the 8 m long
tension rod, and it could here be important to include it since it still affects the result by around 70 MPa.
The longest tension rods need the gravitation included in the model due to its affect.
What can be seen is that the stresses inside the rod part of the tension rod, that comes from the gravity
only, increases exponentially with the different models. This gives only smaller effects on the end points
of the tension rods. The applied force does give an approximate linear effect of the stresses inside the
rod, and a more dramatic increase of the stresses at the end points of the tension rod.
The smaller models can be calculated quickly with or without the gravity load, but the bigger models
take longer times, and the decision is that all models should have the gravity load applied on. The time
needed to calculate the effects of the gravity is still small for the smaller tension rods, so it could be
applied on those as well therefore. The result will probably be a little better with that included.
What can be seen in Figure 59 is that the applied stress gives a higher stress in the material at the bottom
side than at the upper side on the rod. This is because the weight of the tension rod creates bending
stresses on the bottom side, and that those bending stresses can be added with the stress from the applied
force. The gravitation gives a pressure on the upper part of the tension rod, which can be subtracted from
the stresses from the applied load to find the active load there [4]. Figure 4 can be taken as an example
of how a typical beam behaves under the load of the gravitation.
The friction shows that the areas that are over the yield strength will increase with an increase of the
coefficient of friction. It can be assumed that the coefficient of friction will be of a higher value, since
it is supposed to hold the structure together from falling apart, which means that the contact points will
experience higher stresses. One idea is to choose a coefficient of friction of a higher value, and then
expect the real value of the friction to be smaller. This can be used as a safety factor to the simulations,
so a coefficient of friction would not be too small and underestimated in the analysis.

40
2.5 Modeling assumptions
2.5.1 Stress analysis method assumptions
The stress analysis method used was the Von-Mises stress analysis, and any analysis with membrane
stresses was not used for the components. Membrane stress is a type of stress that can be found close to
the surfaces in, for instance, pressure vessels and other thin walled constructions. The membrane stresses
can be very complicated to analyze, and the simulated components were believed to be thick enough to
only need a Von-Mises stress analysis to determine the stresses inside of the material [41]. Some of the
longest tension rods could be a thin construction, but it was still believed that those components could
be analyzed with the same stress criteria.
2.5.2 Friction coefficient assumptions
The friction between the different components is of important in the modelling, but either Proplate nor
SSAB have any information about the coefficient of friction. Internet research was performed in order
to find the correct value of the coefficient of friction, and several studies show that the value could be
between 0.5-0.8 for metal-metal-contact for dry and clean surfaces, with a value around 0.7 normally
[42-44]. More studies show that the coefficient of friction can be assumed to be around 0.74 for mild
steels in contact with mild steels, and around 0.78 for hard steels in contact with hard steels [45-49]. The
steels used in the tension rods were assumed to be hard steels, see Table 3-9 for more information about
them, and the coefficient of friction was therefore taken as 0.78 for all the contacts.
2.5.3 Fatigue assumptions
Another factor that will not be considered in the analysis is effects from fatigue load on the constructions.
Fatigue is an important factor to investigate since it has a huge role in failures of components, but it was
not investigated in the project. SS-EN 1993-1-9 describes fatigue analysis in more details, and how they
should be made, which can be used to investigate this further. A normal rule for fatigue, from this
standard, is that the stress difference should be less than 1.5 times the yield stress to maybe be safe, but
it is a complex work to understand fatigue behavior for different components, and the number of cycles
a construction can withstand before failing should normally be found by testing [34].
Fatigue analysis is a complex topic, and it needs more time than this project allows. This is a reason why
it is neglected in the project. The project needs limits in its size, and fatigue was excluded since it is a
big topic itself. Fatigue information can also change from different types of application areas, and this
information is missing in the project, which makes it hard to do a good, realistic analysis of the topic.
Specific data about the loads from different situations must be found in order to investigate fatigue
problems further.
2.5.4 Creep assumptions
Creep can affect the life of tension rods if they are loaded for a longer period of time, and especially if
the tension rods are loaded at higher temperatures. The tension rods are assumed to be used at
temperatures around -30oC up to 50oC, and any creep is assumed not to be of importance in that interval.
Long time creep will not be considered in the analysis.
2.5.5 Wear effect assumptions
Wear can affect the contact surfaces, and after that change the coefficient of friction between the
different metals in contact [23]. These wear effects were considered in the project. It is believed that the
materials will have the same coefficient of friction over longer times, and that no unneglectable wear
will be present for the materials. The hardness is also higher for the sprint material, which makes wear
often lower for many materials.

41
2.5.6 Temperature change effect assumptions
Temperature changes can change the material properties, and can increase the material stresses.
Increasing temperatures can expand the construction and give increasing stresses. The temperature
interval that the tension rods are assumed to be used in (-30oC up to 50oC) can be seen as a small interval,
and any expansion effects on the stresses are assumed to be small in this interval, and it was not
considered in the project.
Temperature changes will also be able to affect the material properties. Increasing temperatures can
decrease the yield strength and the Young’s modulus [35]. Any of these effects on the materials were
assumed to be neglectable in the project.
2.5.7 Geometric assumptions
All the different constructions were assumed to fit perfectly to each other. The sprints will fit exactly
into the holes in the tension rods, but there are actually small gaps, around a few tenth of a millimeter
according to Proplate. All the components will also be in a “perfect contact” with each other, with no
gap between them, which can give a stronger friction force than it actually is.
2.5.8 Plasticity assumptions
The materials the tension rods are made of have
been hardened and tempered. These materials can
often show a stress-strain relationship like the one
shown in the stress-strain-diagram in Figure 66,
where there is no exact point when the material
starts yielding. These diagrams normally do not
look like typical mild-steel stress-strain diagram,
where the yield strength can easily be found.
Materials with a stress-strain relationship like the
one in Figure 66 gets its yield strength set by the
0.2% offset yield strength instead. The material
will have started to plastically deform at this
point, but it is a very small plastic deformation at
this point. Materials that show this behavior can be plastically deformed every time it is loaded, and it
can develop greater deformations over time [5, 35]. The material used in this project will be assumed to
have this type of behavior, but the yielding will be assumed to be very small, and not affect the results.
The tension rods shall be used at loads much less than at the 0.2% offset yield strength, due to safety
factors, and it will therefore not be exposed to those critically high stresses.
2.5.9 Gravitation effect assumptions
The effect of the self-weight by gravitation has been analyzed, see section 2.4.1-2.4.6, and the result
shows that the gravitation should be included in the analysis to make it more realistic.
2.5.10 Material parameter assumptions
The density was assumed to be 7850 kg/m3 for the steel that was used, the Young modulus was set to
210 GPa and the Poisons ratio was set to 0.3 for all the materials. These material parameters were given
from SSAB, and will be used together with Table 3-9 to describe the material in the program when
simulating and modelling.
Figure 64: A stress-strain diagram for a steel with no exact point when the yielding starts [50].

42
2.6 Abaqus modeling of tension rods
Several analyses were performed. Each analysis had a specific number related to it in order of making
the analysis process easier to understand and follow in the work.
Analysis 1 was made for a tension rod of type Strap-A, with dimensions changed as described in section
2.3.1, placed between 2 loaders. Analysis 2 was made with Strap-B, but with the same installation
otherwise. Analysis 3 was made with Strap-C, but with the same installation otherwise.
Analysis 4 was made with four Strap-B connected to each other as in Figure 40. Two of those straps had
a thickness of half the others. All the straps were connected with sprints. The dimension of the thickness
of the largest strap was varied from 10 mm – 50 mm. The length of these singular straps was varied
from 1 m – 6 m. Larger straps were not tested, since these straps can become less stiff due to a small
bending stiffness. The total length of the strap-chain was supposed to be approximately the same as the
length of the longest individual strap of this type.
Analysis 5 was made with two Strap-C connected to each other with the help of two walnut-straps, with
half the thickness of the Strap-C, and sprints connecting them to each other. Figure 42 shows how this
looks when the tension rods are connected. The length was varied from 1 m – 16 m for each Strap-C.
The thickness was varied from 10 mm – 50 mm.
Analysis 6 was made similar to analysis 5, but with three Strap-C and four walnut-straps. These were
connected to each other, and simulated like the other ones. The thickness was varied from 10 mm – 50
mm. The length was varied from 1 m – 10 m so this set-up would be approximately as long as those
investigated in analysis 5.
All the models were tested as both laying down and standing up in order to find out if the result is
comparable. The direction of the gravity was changed in order to obtain those different analyses. Only
the models with the largest thickness were tested in the analyses, with some different lengths.
Which lengths that were tested did depend on how much the stresses changed inside the material. Only
a few tests were made if a tension rod of 8 m shows more or less the same result as one of the length of
1 m when it comes to the maximum stress the tension rod can handle. More analyses had to be made if
the maximum allowed stress these models can be subjected to changed drastically. It was believed that
the force a tension rod can handle is approximately linear changed with a change in the thickness. If a
tension rod can handle x kN and has a thickness of y mm, a tension rod of y/2 mm in thickness would
then be able to handle a force of x/2 kN. This was assumed in order to minimize the number of needed
simulations. This assumption was also tested in the end by analyzing a tension rod of 10 mm in thickness,
and compare the results to see if the thesis holds.
How the models were modeled in Abaqus, after they had been imported, will be described in section
2.6.2-2.6.7, and some of the modeling in Creo will be described in section 2.6.1.
2.6.1 Symmetry conditions and cuttings used
Symmetry conditions were used in the analyses to simplify all the models, and thereby decrease the
needed time to run the analyses. Some of the models had some exact symmetries in their structures, and
could be modified by that. Some of the other models had a structure that looks almost like a symmetry,
and they were modified after these as well. It was not always an exact symmetry, but it was believed
that the models could be treated as if they had a symmetry in the structure.
Figure 67 shows how the symmetry was used in analysis 3, from two different angles, with the use of
strap-C with two loaders, and its cut in the middle. The same type of symmetry condition was also used

43
to cut the models in analysis 1, but with strap-A instead of strap-C. Figure 68 shows the symmetry used
for analysis 2, from two different angles, with an extra symmetry used in the middle.
Figure 65: Strap-C with 2 loaders that was used in analysis 3, with a symmetry in the structure.
Figure 66: Strap-B with 2 loaders that was used in analysis 2, with a symmetry in the structure.
Figure 69 shows the symmetry used for the system in analyses 4, taken from two different views, which
shows a very similar cutting results to the one in analyses 2.
Figure 67: Strap-B with 2 loaders that was used in analysis 4, with a symmetry in the structure.
Figure 70 shows the symmetry that was used in analysis 5, and Figure 71 shows the symmetry that was
used in analysis 6 together with the model without any cuttings in it. The model in Figure 70 has been
cut in the middle, but that is not an exact symmetry there. It was believed that it could be used as a
symmetry there anyway since the structure is very similar.

44
Figure 68: Strap-C with 2 loaders and 2 walnut-straps that was used in analysis 5, with a symmetry in the structure.
Figure 69: Strap-C with 2 loaders and 4 walnut-straps that was used in analysis 6, with a symmetry in the structure.
The sprints were believed to give a similar effect on both sides of the hole it was placed in. The sprint
was cut in half, and only the side with the larger cross section was used. Figure 72 shows a sprint used,
and how this sprint was cut.
2.6.2 Material properties
All the materials used in the project were given the same material properties in Abaqus. The materials
will be tested so they do not exceed the yield strength, but all the other material parameters are the same
Figure 70: One view of one of the sprint models that was used in the project (left figure), and also the sprint after it was cut (right figure) and used as a symmetry.

45
for these materials. The density, the modulus of elasticity and the Poison ratio are the same for both the
tension rods, and the sprints. The loader was given the same material parameters, but it was never
investigated in the result of the analyses.
2.6.3 Steps
Two steps were made, step 1 & step 2, in order to do the analysis. Both steps were made as static general.
The increment sizes were set to 0.1 in the initial, 1/109 in the minimum and 1 at the maximum in all the
analyses made.
2.6.4 Interactions
Different models were set under different interactions depending on how these models were constructed.
Models with more parts in it had more interaction conditions applied since a greater number of contacts
could be found in these. All areas under contact were taken as a simple master-slave-relationship. A
tangential contact, used with the penalty method, with a coefficient of friction on 0.78 used. A normal
contact was also used, and this contact was taken as a hard contact. Some of the interaction areas also
had small sliding used, instead of finite sliding, in order to get the Abaqus-job done.
2.6.4.1 Interactions for analyses 1-3
These three analyses had very similar interactions applied to them. An interaction was set between the
rod inside the loader to the inside of the hole of the tension rod. The loader-rod surface was taken as the
slave and the hole-surface was taken as the master surface. Figure 73 shows this relation between the
two surfaces used in the interaction.
Figure 71: The interaction between the rod inside the loader, as the slave, and the hole-surface of the tension rod, as the master. This was used in the analyses 1-3.
2.6.4.2 Interactions for analysis 4
Analysis 4 had more models in it, and needed more interactions applied to it. The same interaction that
was used between the loaders and the tension rods in analyses 1-3 were used even in these analyses.
Another contact was between the sprints and the tension rods. The sprints were here used as the slave
and the hole-surfaces of the tension rods were used as the masters. This interaction relationship can be
seen in Figure 74. The sprints were also locked to the surface of the tension rods surface with a tie
constrain. This tie constrain relation can be seen in Figure 75, with the sprint surface as the slave and

46
the tension rod surface as the master. The tension rod in Figure 75 is actually strap-C from analysis 5
which also used this type of tie constrain. Another contact was between the surfaces of the two tension
rods. The thickest tension rod had a part of its surface set to be the master in that relation, and the thinner
tension rod had a part of its surface set to be the slave. This can be seen in Figure 76.
Figure 72: The interaction between the sprint, as the slave, and the hole-surface of two tension rods, as the masters. This was used in the analyses 4.
Figure 73: The tie constrains between the sprint, as the slave, and the surface of one tension rods, as the masters. This was used in the analyses 4.
Figure 74: The interaction between the thicker tension rods surface, as the master, and the thinner tension rods surface, as the slave. This was used in the analyses 4.

47
2.6.4.3 Interactions for analysis 5-6
Analysis 5 and analysis 6 had many of the interactions that is found in the other analyses. The tie
constrain seen in Figure 75 was used in these analyses, but the sprints were connected to the walnut-
straps instead. The interaction seen in Figure 73 was also used. The interaction seen in Figure 76 was
also used, but between the tension rods and the walnut-straps this time, where the walnut-straps were
the slave surface. The relation seen in Figure 74 was also used again, but the sprints went through both
a strap-C and a walnut-strap this time.
2.6.5 Loads
The load was applied as a pressure on the outer surface of the loader. This pressure was calculated in
the same was as on page 35 in section 2.4.3. The maximum tension that the tension rods can withstand
is the yield strength, and the maximum pressure that can be applied on the loader-surface, σA, can be
calculated as:
𝜎𝐴 = −𝐴𝑅𝑂𝐷
𝐴𝐿𝑂𝐴𝐷𝐸𝑅∗ 𝜎𝑌 (6)
AROD is the cross-section area in the rod part of the tension rod, and ALOADER is the area of the loader at
the side the pressure is applied on. The negative sign of the equation comes from the reason that the
pressure shall be in tension.
The area of the loader used in Abaqus was 120*200 mm2 in analyses 1-2 and analysis 4. The area was
set to 180*200 mm2 in analysis 3 and analyses 5-6.
This load was applied, and the result was analyzed. A stress concentration occurred around the hole of
the end point of the tension rod, and equation (5) was used to calculate the geometrical stress
concentration factor by comparing the stresses between the different areas. σmax was calculated by setting
σnom = σA. This gave the exact stress that should be tested. The stress was increased if the result showed
that the tension rod could withstand a higher load that the one applied. This was done until an acceptable
result was collected.
The models that did not go through a cutting in the middle of the rod (analysis 1 and analysis 3) had the
loader-pressure applied on both loaders, while the other analyses had the pressure applied on the only
visible loader in the analyses. Figure 77 shows these areas that the pressure was set on in analysis 1.
Figure 75: The side of the loader that the pressure was applied on in analysis 1.
Another load that was applied in the analyses was a gravity load. This load was set on all the objects
analyzed, except the loaders. The gravity constant was set to 9.81 m/s2 in the analyses. The models were
tested as both standing and laying. Laying models had the gravity applied as the one seen in Figure 78.

48
The standing models had the gravity applied by changing the direction of it, so the gravity load was
oriented in the normal direction of the rod on the tension rod. How, and when, these loads were applied
did depend on the different analyses.
Figure 76: The gravity load applied to the tension rod in analysis 1.
2.6.5.1 Loads for analysis 1-3
The gravity load was applied in the first step in these analyses, and it was active through the whole
analysis. The pressure load was applied first in the second step.
2.6.5.1 Loads for analysis 4-6
The combined tension rods could not have the gravity applied first since testings showed that they did
risk to become too un-stiff then. The pressure was instead applied in the first step (can be treated as a
pre-load), and active through the whole analysis. The gravity was then applied in the second step in
order to investigate the combined effect of both loads together.
2.6.6 Boundary conditions
Several boundary conditions were used in the analyses. The loader was always prevented from all types
of movement. Figure 79 shows how the loaders were locked. The red areas were prevented from any
movements in their normal directions. These boundary conditions were applied in the first step and used
through the whole analysis. Analyses 1-3 also had the outer side of the loader locked from all normal-
direction movements, that was applied in step 1 and turned off in step 2 (and replaced with the pressure).
This was never used for analyses 4-6 since it had a load applied on it from the beginning.
Figure 77: Boundary conditions that were set to the loader to prevent its movements.
All the models that had sides that were cut had to use a symmetry boundary condition in order of
modeling it correctly. A symmetry in the normal direction was set to the surfaces that was created in the
cutting process. Figure 80 shows that side for analysis 1, and Figure 81 shows the same for analysis 5.

49
Some models had also been cut in the middle of one of the rods. A symmetry condition had to be set in
the normal direction there as well. How this symmetry condition looked for analysis 4 can be seen in
Figure 82, and how this looked for analysis 5 (where there was no exact symmetry, but it was treated as
one) can be seen in Figure 83. These boundary conditions that have been mentioned, and that can be
seen in Figure 80-83, were used in step 1 and never turned off in the analysis.
Figure 78: Boundary conditions used as a symmetry condition in analysis 1.
Figure 79: Boundary conditions used as a symmetry condition in analysis 5.
Figure 80: Boundary conditions used as a symmetry condition inside one of the rods in analysis 4.
Figure 81: Boundary conditions used as a symmetry condition inside one of the rods in analysis 5.

50
2.6.7 Meshing
The elements used in the meshing were tetragonal elements. This element type is a 3D-element that was
believed to give a good result for the analysis due to its simplicity [51]. Meshings were made for the
tension rods and the other components. The mesh size was bigger on the locations where the result did
not have to be very precise, and smaller on the areas where a more precise result was needed. Figure 84
shows the meshing done for one of the analyses made in analysis 5. What can be seen is that the meshing
is finer around the holes on the tension rod.
Figure 82: Meshing made for the construction in one of the analyses in analysis 50.
2.6.8 Acceptance of the result.
A job was made after these steps had been applied in Abaqus, and a result was evaluated. The result was
accepted if all the stresses in the material were lower than the maximum allowed stress to make sure no
plastic deformation occurs in the structure. Some areas in the model might still show some signs of
stresses over the maximum allowed stress, even for very low loads applied. These areas are often small
and concentrated around sharp edges and corners in the model. Figure 85 shows one of those areas that
was found in one of the analyses where the black represents all locations where the stresses are lower
than the maximum allowed stress.
Figure 83: Locations on sharp edges where the stresses increases in Abaqus.
These points, where the geometry changes very rapidly, often give a result similar to the one in Figure
85. These stress concentrations seen in the figure can often be ignored if they are concentrated around a
sharp edge. These stress concentrations must on the other hand be very small if this assumption shall be
made. Figure 60-65 show some highlighted areas in the friction test when the coefficient of friction is

51
changed. The highlighted areas often appears around corners, just like the one in Figure 85. Figure 86
shows a result from an early Abaqus test that was made. The grey area shows where stresses is over the
maximum allowed stress in this example.
Figure 84: An early test of a tension rod, where the grey area shows stresses that are over the maximum allowed stress.
What Abaqus does is that it looks, for instance, for values of forces and displacements at each node, and
then summarizes these into large systems of matrices. The relationship can look like:
�̅� = �̃� ∗ �̅� (7)
F is the force vector, d is the displacement vector and k is the stiffness matrix that combines these two
vectors to each other [51]. Sharp edges can give problems when the relation in (7) is investigated, and
thereby show stresses that are higher than they should be.
The reason why these areas occur are both due to the sharp geometry change, but also due to how the
loader, and the sprints act when they are loaded. Figure 87 shows how the rod inside the loader will
bend itself when the pressure is applied to the loader.
Figure 85: The loader with the rod inside of it that has been bent when the system was loaded.
The sprints act in a similar way as the rod inside the loader. This behavior will make the stresses increase
in the tension rod since the pressure from the loader on the tension rods hole-surface will be more
concentrated at some points compared to other ones. The loader is a construction that will make the
results more realistic, but the real-life loader-construction can look very different, and the stresses it will
give can be hard to predict exactly.
An acceptable result will be when this highlighted area around the sharp edge is very small. The result
was decided to be accepted if this highlighted area is smaller than 25% into the hole (which is actually

52
12.5% since the construction simulated is only in half), and is so small that it does not penetrate the
whole way through the elements around the hole. Figure 88 shows an element that has been taken from
an early analysis in the project. This element is one of those around the hole of one strap-A. This element
was one of those on the corner where the stress concentration is the largest, and only the black area is
under the maximum allowed stress. This element shows areas with a large stress in it, but the stresses in
this element is not going too deep, which means that the result with elements like this can be seen as an
acceptable result in the end. It is very important that the stresses in the stress concentrated areas are very
small, and that it does not penetrate through the whole element of any of those around the hole if the
result can be seen as an acceptable one.
Figure 86: A selected element from an early analysis of strap-A. The Figure shows the Von Mises Stress in the material, with the red area representing higher stresses, and the blue area represents lower stresses. The coloured areas are those where the stresses go over the maximum allowed stress.
The friction-coefficient-effect-analysis that was performed earlier in the project can be used to
demonstrate what an acceptable result is and is not. Figure 60 shows stress concentrations that are so
small that the result is seen as acceptable, while Figure 65 shows a result that is totally unacceptable. It
is up to the situation to test how much each model can be loaded in order to get stresses that are
acceptable.

53
3. Results
Section 3.1 shows the result when several Strap-A, with different dimensions, connected between two
loaders, are tested. Section 3.2 shows the result when several Strap-B, with different dimensions,
connected between two loaders, are tested. Section 3.3 shows the result when several Strap-C, with
different dimensions, connected between two loaders, are tested. Section 3.4 shows the result when four
Strap-B, connected to each other in a chain, with different dimensions, between two loaders, are tested.
Section 3.5 shows the result when two Strap-C, with different dimensions, connected to each other in a
chain with walnut-straps, between two loaders, are tested. Section 3.5 shows the result when three Strap-
C, with different dimensions, connected to each other in a chain with walnut-straps, between two
loaders, are tested
Each section in the result will present different parts of the result evaluated in the project. The most
critical points will also be shown for all the different types of analyses in order of showing how well the
stresses inside the structure looks.
3.1 Results from analysis 1
The most critical areas were around the hole on the end of tension rods. The geometrical stress
concentration factor had a value of around 2.67. Figure 89 shows the tension rods around the hole and
the stresses around it in one of the analyses made for this type of construction. Figure 89 shows both the
stresses from minimum to maximum, and also the same figure with only the stresses that has exceeded
the yield strength in the material in color.
Figure 87: The result of one of the tests in analysis 1. The upper Figure shows the Von Mises Stress in the material, with the red area representing higher stresses, and the blue area represents lower stresses. The coloured areas, in the lower Figure, are those where the stresses go over the yield strength of the material. The thickness of the tension rod is 50 mm.

54
Table 14 shows the maximum force the tension rods, with different thicknesses, could withstand before
failing the criteria for the stresses.
Table 14: The maximum force that could be applied to the tension rods in analysis 1 with different thicknesses
Thickness: 10 mm: 20 mm: 30 mm: 40 mm: 50 mm:
Maximum force: 216 kN 432 kN 648 kN 864 kN 1080 kN
Tension rods with different lengths were tested. The lengths tested were 2 m, 8 m and 16 m, which all
gave the same maximum stress. The thickness was 50 mm for all these tests. Two analyses were
performed when the thickness was only 10 mm, one for a 5 m long tension rod and one for a 10 m long
tension rod. The length of the tension rod did not affect the result around the holes, so only the thickness
can be used when determining the maximum force the tension rods can withstand. Figure 90 shows the
result of one of the analyses with the 10 mm thickness in a similar way as in Figure 89.
Figure 88: The result of one of the tests in analysis 1. The upper Figure shows the Von Mises Stress in the material, with the red area representing higher stresses, and the blue area represents lower stresses. The coloured areas, in the lower Figure, are those where the stresses go over the yield strength of the material. The thickness of the tension rod is 10 mm.
The results were very similar when the tension rods were standing up and when they were laying down.
Table 14 can be used independent of the orientation of the tension rod. Figure 91 shows how one of the
tension rods bent itself in one analysis, but with a greater scale factor to show the behavior of the bending
of the construction.
Figure 89: The tension rod that was bent in one of the analyses.

55
3.2 Results from analysis 2
The result from analysis 2 shows that the orientation of the tension rods did not affect the result. Standing
tension rods could withstand forces with the same value as tension rods that was laying down. The
thickness was once again the only depending factor for the forces, while the length of the tension rod
did not affect the result. The geometrical stress concentration factor had a value of around 1.72.
Table 15 shows the same type result as the one from Table 14, but for a tension rod from analysis 2.
Figure 92 shows the same result as Figure 89, but for a tension rod from analysis 2. The lengths of the
tension rods tested in this analysis were 2 m, 8 m and 16 m for 50 mm in thickness. Tests were also
made for lengths of 4 m and 10 m for tension rods with thicknesses of 10 mm.
Table 15: The maximum force that could be applied to the tension rods in analysis 2 with different thicknesses
Thickness: 10 mm: 20 mm: 30 mm: 40 mm: 50 mm:
Maximum force: 250 kN 500 kN 750 kN 1000 kN 1250 kN
Figure 90: The result of one of the tests in analysis 2. The upper Figure shows the Von Mises Stress in the material, with the red area representing higher stresses, and the blue area represents lower stresses. The coloured areas, in the lower Figure, are those where the stresses go over the yield strength of the material. The thickness of the tension rod is 50 mm.
3.3 Results from analysis 3
The result from analysis 3 shows that the orientation of the tension rods did not affect the result. Standing
tension rods could withstand forces with the same value as tension rods that were laying down. The

56
thickness was once again the only depending factor for the forces, while the length of the tension rod
did not affect the result. The geometrical stress concentration factor had a value of around 3.33.
Table 16 shows the same type result as the one from Table 14, but for a tension rod from analysis 3.
Figure 93 shows the same result as Figure 89, but for a tension rod from analysis 3. The lengths of the
tension rods tested in this analysis were 2 m, 8 m and 16 m for 50 mm in thickness. Tests were also
made for lengths of 4 m and 10 m for tension rods with thicknesses of 10 mm.
Table 16: The maximum force that could be applied to the tension rods in analysis 3 with different thicknesses
Thickness: 10 mm: 20 mm: 30 mm: 40 mm: 50 mm:
Maximum force: 418 kN 836 kN 1254 kN 1672 kN 2090 kN
Figure 91: The result of one of the tests in analysis 3. The upper Figure shows the Von Mises Stress in the material, with the red area representing higher stresses, and the blue area represents lower stresses. The coloured areas, in the lower Figure, are those where the stresses go over the yield strength of the material. The thickness of the tension rod is 50 mm.
3.4 Results from analysis 4
The result from analysis 4 shows that the orientation of the tension rods did not affect the result. Standing
tension rods could withstand forces with the same value as tension rods that was laying down. The
thickness was here not the only depending factor for the forces. The length of the tension rod did affect
the result in these analyses.
Table 17 shows the same type of result as the one from Table 14, but for a tension rod from analysis 4,
but with both changing thicknesses and lengths of the individual tension rods. The thickness, named t,
of the tension rods is plotted on the upper horizontal row, and the length, named L, of the tension rods
is plotted on the left column.

57
Figure 94 shows the same result as Figure 89, but for a tension rod from analysis 4. The lengths of the
tension rods tested in this analysis were 2 m, 4 m, 5 m and 6 m for 50 mm in thickness. Tests was also
made for lengths of 2 m and 4 m for tension rods with thicknesses of 10 mm.
Table 17: The maximum force that could be applied to the tension rods in analysis 4 with different values of the thickness, t, and different values of the length, L. The thickness, named t, of the tension rods is plotted on the upper horizontal row, and
the length, named L, of the tension rods is plotted on the left column
Dimensions: t = 10 mm: t = 20 mm: t = 30 mm: t = 40 mm: t = 50 mm:
L = 1-3 m: 260 kN 520 kN 780 kN 1040 kN 1300 kN
L = 4 m: 255 kN 510 kN 765 kN 1020 kN 1275 kN
L = 5 m: 250 kN 500 kN 750 kN 1000 kN 1250 kN
L = 6 m: 240 kN 480 kN 720 kN 960 kN 1200 kN
Figure 92: The result of one of the tests in analysis 4. The upper Figure shows the Von Mises Stress in the material, with the red area representing higher stresses, and the blue area represents lower stresses. The coloured areas, in the lower Figure, are those where the stresses go over the yield strength of the material. The thickness of the tension rod is 50 mm.
3.5 Results from analysis 5
The result from analysis 5 shows that the orientation of the tension rods did not affect the result. Standing
tension rods could withstand forces with the same value as tension rods that was laying down. The
thickness was here not the only depending factor for the forces. The length of the tension rod did affect
the result in these analyses.
Table 18 shows the same type of result as the one from Table 14, but for a tension rod from analysis 5,
but with both changing thicknesses and lengths of the individual tension rods. The thickness, named t,
of the tension rods is plotted on the upper horizontal row, and the length, named L, of the tension rods
is plotted on the left column. The lengths of the tension rods tested in this analysis were 1 m, 3 m, 5 m,
6 m, 8 m, 10 m, 12 m, 13 m, 13 m, 15 m and 16 m for 50 mm in thickness. Tests were also made for
lengths of 4 m and 10 m for tension rods with thicknesses of 10 mm. Figure 95 shows the same result
as Figure 89, but for a tension rod from analysis 5.

58
Table 18: The maximum force that could be applied to the tension rods in analysis 5 with different values of the thickness, t, and different values of the length, L. The thickness, named t, of the tension rods is plotted on the upper horizontal row, and
the length, named L, of the tension rods is plotted on the left column
Dimensions t = 10 mm: t = 20 mm: t = 30 mm: t = 40 mm: t = 50 mm:
L = 1-2 m: 418 kN 836 kN 1254 kN 1672 kN 2090 kN
L = 3-4 m: 411 kN 822 kN 1233 kN 1644 kN 2055 kN
L = 5 m: 404 kN 808 kN 1212 kN 1616 kN 2020 kN
L = 6-7 m: 396 kN 792 kN 1188 kN 1584 kN 1980 kN
L = 8-9 m: 389 kN 778 kN 1167 kN 1556 kN 1945 kN
L = 10-11 m: 382 kN 764 kN 1146 kN 1528 kN 1910 kN
L = 12 m: 374 kN 748 kN 1122 kN 1496 kN 1870 kN
L = 13 m: 368 kN 736 kN 1104 kN 1472 kN 1840 kN
L = 14 m: 360 kN 720 kN 1080 kN 1440 kN 1800 kN
L = 15 m: 353 kN 706 kN 1059 kN 1412 kN 1765 kN
L = 16 m: 346 kN 692 kN 1038 kN 1384 kN 1730 kN
Figure 93: The result of one of the tests in analysis 5. The upper Figure shows the Von Mises Stress in the material, with the red area representing higher stresses, and the blue area represents lower stresses. The coloured areas, in the lower Figure, are those where the stresses go over the yield strength of the material. The thickness of the tension rod is 50 mm.
3.6 Results from analysis 6
The result from analysis 6 shows that the orientation of the tension rods did not affect the result. Standing
tension rods could withstand forces with the same value as tension rods that was laying down. The
thickness was here not the only depending factor for the forces. The length of the tension rod did affect
the result in these analyses. Table 19 shows the same type of result as the one from Table 14, but for a
tension rod from analysis 6, but with both changing thicknesses and lengths of the individual tension
rods.

59
The thickness, named t, of the tension rods is plotted on the upper horizontal row, and the length, named
L, of the tension rods is plotted on the left vertical row. The lengths of the tension rods tested in this
analysis were 1 m, 3 m, 4 m, 5 m, 6 m, 7 m, 8 m, 9 m and 10 m for 50 mm in thickness. Tests were also
made for lengths of 4 m and 10 m for tension rods with thicknesses of 10 mm. Figure 96 shows the same
result as Figure 89, but for a tension rod from analysis 6.
Table 19: The maximum force that could be applied to the tension rods in analysis 6 with different values of the thickness, t, and different values of the length, L. The thickness, named t, of the tension rods is plotted on the upper horizontal row, and
the length, named L, of the tension rods is plotted on the left column
Dimensions t = 10 mm: t = 20 mm: t = 30 mm: t = 40 mm: t = 50 mm:
L = 1-2 m: 418 kN 836 kN 1254 kN 1672 kN 2090 kN
L = 3 m: 404 kN 808 kN 1212 kN 1616 kN 2020 kN
L = 4 m: 396 kN 792 kN 1188 kN 1584 kN 1980 kN
L = 5 m: 382 kN 763 kN 1146 kN 1528 kN 1910 kN
L = 6 m: 374 kN 748 kN 1122 kN 1496 kN 1870 kN
L = 7 m: 368 kN 736 kN 1104 kN 1472 kN 1840 kN
L = 8 m: 360 kN 720 kN 1080 kN 1440 kN 1800 kN
L = 9 m: 346 kN 692 kN 1038 kN 1384 kN 1730 kN
L = 10 m: 338 kN 676 kN 1014 kN 1352 kN 1690 kN
Figure 94: The result of one of the tests in analysis 6. The upper Figure shows the Von Mises Stress in the material, with the red area representing higher stresses, and the blue area represents lower stresses. The coloured areas, in the lower Figure, are those where the stresses go over the yield strength of the material. The thickness of the tension rod is 50 mm.
3.7 Summary of all tables
This section summaries the tables of the maximum load found for each type of analysis performed in
section 3.1-3.6.

60
Table 14: The maximum force that could be applied to the tension rods in analysis 1 with different thicknesses
Thickness: 10 mm: 20 mm: 30 mm: 40 mm: 50 mm:
Maximum force: 216 kN 432 kN 648 kN 864 kN 1080 kN Table 15: The maximum force that could be applied to the tension rods in analysis 2 with different thicknesses
Thickness: 10 mm: 20 mm: 30 mm: 40 mm: 50 mm:
Maximum force: 250 kN 500 kN 750 kN 1000 kN 1250 kN Table 16: The maximum force that could be applied to the tension rods in analysis 3 with different thicknesses
Thickness: 10 mm: 20 mm: 30 mm: 40 mm: 50 mm:
Maximum force: 418 kN 836 kN 1254 kN 1672 kN 2090 kN
Table 17: The maximum force that could be applied to the tension rods in analysis 4 with different values of the thickness, t, and different values of the length, L. The thickness, named t, of the tension rods is plotted on the upper horizontal row, and
the length, named L, of the tension rods is plotted on the left column
Dimensions: t = 10 mm: t = 20 mm: t = 30 mm: t = 40 mm: t = 50 mm:
L = 1-3 m: 260 kN 520 kN 780 kN 1040 kN 1300 kN
L = 4 m: 255 kN 510 kN 765 kN 1020 kN 1275 kN
L = 5 m: 250 kN 500 kN 750 kN 1000 kN 1250 kN
L = 6 m: 240 kN 480 kN 720 kN 960 kN 1200 kN
Table 18: The maximum force that could be applied to the tension rods in analysis 5 with different values of the thickness, t, and different values of the length, L. The thickness, named t, of the tension rods is plotted on the upper horizontal row, and
the length, named L, of the tension rods is plotted on the left column
Dimensions t = 10 mm: t = 20 mm: t = 30 mm: t = 40 mm: t = 50 mm:
L = 1-2 m: 418 kN 836 kN 1254 kN 1672 kN 2090 kN
L = 3-4 m: 411 kN 822 kN 1233 kN 1644 kN 2055 kN
L = 5 m: 404 kN 808 kN 1212 kN 1616 kN 2020 kN
L = 6-7 m: 396 kN 792 kN 1188 kN 1584 kN 1980 kN
L = 8-9 m: 389 kN 778 kN 1167 kN 1556 kN 1945 kN
L = 10-11 m: 382 kN 764 kN 1146 kN 1528 kN 1910 kN
L = 12 m: 374 kN 748 kN 1122 kN 1496 kN 1870 kN
L = 13 m: 368 kN 736 kN 1104 kN 1472 kN 1840 kN
L = 14 m: 360 kN 720 kN 1080 kN 1440 kN 1800 kN
L = 15 m: 353 kN 706 kN 1059 kN 1412 kN 1765 kN
L = 16 m: 346 kN 692 kN 1038 kN 1384 kN 1730 kN
Table 19: The maximum force that could be applied to the tension rods in analysis 6 with different values of the thickness, t, and different values of the length, L. The thickness, named t, of the tension rods is plotted on the upper horizontal row, and
the length, named L, of the tension rods is plotted on the left column
Dimensions t = 10 mm: t = 20 mm: t = 30 mm: t = 40 mm: t = 50 mm:
L = 1-2 m: 418 kN 836 kN 1254 kN 1672 kN 2090 kN
L = 3 m: 404 kN 808 kN 1212 kN 1616 kN 2020 kN
L = 4 m: 396 kN 792 kN 1188 kN 1584 kN 1980 kN
L = 5 m: 382 kN 763 kN 1146 kN 1528 kN 1910 kN
L = 6 m: 374 kN 748 kN 1122 kN 1496 kN 1870 kN
L = 7 m: 368 kN 736 kN 1104 kN 1472 kN 1840 kN
L = 8 m: 360 kN 720 kN 1080 kN 1440 kN 1800 kN
L = 9 m: 346 kN 692 kN 1038 kN 1384 kN 1730 kN
L = 10 m: 338 kN 676 kN 1014 kN 1352 kN 1690 kN

61
The loads represented in table 14-19 are the absolute highest loads that can be applied to the models
without failure.
3.8 Screws instead of sprints
One advantage with tension rods that are connected with sprints is that it gives more degrees of freedom
to the construction. The interaction contact between the different tension rods are due to frictional
behavior, which gives the different models an easier way to elastically deform with the loads and can
reduce material stresses.
Changing the construction to screws instead of sprints would probably worsen this advantage. Equation
7 shows the relationship between the forces and the deformations in the construction, and the material
forces might increase drastically if the deformations are limited in the construction.
One advantage with a changed structure is that the model chain of tension rods will be stronger
connected to each other. The screws will hold the whole structure together in a stronger way at the
contact points. There is a risk that the construction will become un-stiff with larger structures, and the
deflection of the tension rods will become big. Figure 97 shows this type of problem by comparing a
tension rod chain in its deformed shape with its undeformed shape, with a larger scale factor from
Analysis 4.
Figure 95: One of the tension rod chains that has been simulated in Abaqus, which shows how the chain of tension rods has been deformed from its original shape in the analysis.
Figure 98 also shows a tension rod, of a smaller length than the tension rod in Figure 97, from the same
type of analysis. The deflection of the chain of tension rods can be seen, with a larger scale factor, in
Figure 98.
Figure 96: One of the tension rod chains that has been simulated in Abaqus, which shows how the chain of tension rods has been deformed from its original shape in the analysis.
The structure will not slide against each other in the same way thanks to the screws. This makes it easier
to keep the structure stronger together, but will probably increase the stresses on the screws. The stresses
on the sprints did never reach any critical values in the Abaqus-simulations, and those objects did never
become a limiting factor for the load that could be applied. Figure 99 shows the stresses in one of the
sprints in analysis 5.
The tie constrain used might have increased the sharp-edge-stresses a little bit more, which can be
assumed when analyzing the result from Figure 100. The stresses are anyway a bit far from the yield
strength in the sprints.

62
Figure 97: The stresses in one of the sprints in one of the analyses in analysis 5. The Figure shows the Von Mises Stress in the material, with the red area representing higher stresses, and the blue area represents lower stresses.
Figure 98: Result for the stress analysis of the walnut-strap in one analysis. The Figure shows the Von Mises Stress in the material, with the red area representing higher stresses, and the blue area represents lower stresses.
Replacing sprints with screws will probably show results with stresses greater than those in Figure 99.
This means that the yield strength must probably be even greater for the screws than it is for the sprints
in order to hold the system together without failing. This type of system will look like a double lap joint,
and recommended strength classes for the material used for the screws can be seen in Table 13. The 10.9
strength class is the strength class that is closest to the screws when the yield strength is compared in
the analysis. This strength class can be the best to recommend from those in Table 13, but a more precise
analysis can be recommended to perform to the tension rods before that, and analyze how much the

63
stresses will increase with the limited deformation in the system. A screw made of an even greater
strength can perhaps be needed if the deformation is too limited and the stresses is increased by that.
A specific type of screw, or screws, needs to be selected to perform an analysis of how this construction
can affect the result. Screws can be used with different sizes, such as some of the companies have, which
all will have a specific result in the stress analysis. A larger screw can be recommended to use since it
can stay stronger from bending and tension forces from the surroundings. A screw with a similar
diameter as the sprints can be recommended to use to get a similar result [4].
Screws has threads on them, and that means that the surface of the hole in the tension rods needs a
threading as well. The screws can be purchased, which might be the smartest way to get the screws, but
the threading must be made on the tension rods. This can easily be made by using a tap, and drill the
threads into the surface. It can be recommended to make these threads on the surface at the same time
as creating the holes in the tension rods. A tap can drill out material, and at the same time form the
pattern needed for the screws [52].
Changing the shape of the tension rods is an economic issue. Creating these threads means that new
investments must be made on new machines that can do this work. A tap-machine that can drill the
holes/threads must be purchased first. The drill-tap must be of a strong material that can drill the hole in
high strength steel without failing itself. This condition puts some requirements on the strength of the
tap in the drill machine. Screws of greater sizes also makes the process more complicated by putting
more requirement on the tap to make threads on a bigger area. This whole process will be an extra part
in the whole manufacturing chain for Proplate, and it can therefore be needed to look over the work flow
system in the factories to make it as smooth as possible.
The screws can then be installed with a simple nut on the other side of the hole to hole the whole system
together. This nut can be screwed on and screwed off easily, which makes it easy to remove the screw
from the tension rods if needed. The screws can also have a preload added to it to make it able to hold
the structure together strongly all from the beginning.

64
4. Discussion 4.1 Assumptions in method
The result from the simulations will depend on the modelling of the construction. It is of great
importance that the modeling is done correctly to give a result based on the reality. But there will always
be some problems between the simulation results and the reality since some assumptions are made in
Abaqus calculations. The geometric assumption made, see section 2.5.7, is one of those. The results
from the simulations should be tested mechanically in order to make sure they are correct.
The other assumptions that has been made, see section 2.5, can also affect the results. It has been
assumed that there will be no problems with creep, wear nor temperature change effects, but these
problems will occur in the reality and the tension rods will be affected by these problems. Tension rods
used for a longer time will be worn out and creeping might have started. Some plasticity will also occur
every time the constructions are loaded, which will give some problems in the long term. The tension
rods should be replaced after some time, and it is assumed that this will not become a problem in the
early life of the tension rods. An analysis could be made to prove this assumption, which has not been
made in the project, but it is believed that creep and wear will not give a great effect of the final results
from the analyses.
The tension rods has been calculated to maximum possible load they can withstand. Safety factors are
often used in reality, and this will make the results safer. The creep and wear that can be assumed for
the result will, thanks to this, probably be lower than expected when analyzing the result. What can be
seen in, for instance, Table 7 is that the material properties will be affected strongly by a temperature
change, but it is believed that the temperature interval for where the tension rods shall be used is very
small. The change in Young’s modulus and yield strength are also very small, and no non-negligible
stresses from thermal expansion is assumed.
Fatigue is an area that has not been investigated in the project. Many of the failures occurs due to fatigue,
and it can therefore be a very important factor to investigate [5, 35]. The project was limited so there
was, sadly, no time to make these important investigations in the project. This is still of great importance,
and it could be a future work for the project, see section 4.3. What has been assumed is that no “quick
fatigue”, meaning fatigue that happens after just a few cycles, will occur for the investigated tension
rods. The tension rods will be able to be attached to forces and oscillated back and forth for a longer
period of time without fatigue failure. A background to fatigue failures has been given in section 2.5.3,
and it is believed that low-cycle fatigue failures can be avoided thanks to stresses that are too low to
give this sort of problem to the constructions.
Some models had more symmetries that could be used when simplifications were made, and some
models had fewer symmetries. Some of the models were tested the same way as if they had more
symmetries, analysis 5 for instance. It is, however, believed that these analyses would give an acceptable
result anyway since the model is very similar on both sides of the model where the symmetry condition
has been applied. It is not exactly correct, but is believed to give approximate same result. A few testings
were also made to prove this idea, which showed that the result became very similar. Another non-exact
symmetry cut was made for all the sprints when it was believed that both sides of the sprints would hold
the structure together in the same way.
The loader was a construction that went through some geometric changes in the project. The loader was
first constructed so the tension rods would fit perfectly into the two sides of the loaders surfaces. This
construction was later in the pre-analysis discovered to not work well since when loaded induced

65
additional stresses in the tension rods. A drastic geometry change had to be made to give a better result.
The early results from the pre-analysis is still believed to be acceptable, with the early loader model
used, but it had to be changed after that to make the rest of the analyses acceptable.
The idea behind the sprints was first that the tie constrain should not be applied. An ordinary contact
with 0.78 as the coefficient of friction was the first idea to put behind the surfaces, but the result did not
converge in Abaqus, and it was replaced with a tie constrain instead.
The whole project was run by using the idea of trial and error. A few ideas, like the one with the contact
between the surfaces between the tension rod and the sprint, were tested in the modelling, and the result
from these were analyzed. Some changes were made if the result did not converge, and then a new test
was made to see if the analysis converged. It was always important to improve in a way to make them
more similar to the reality, and being backed up by a clear idea. The result was then analyzed to ensure
a correct modelling, and changes could then be implemented if the result deviated from reality.
4.2 Results
The values that have been calculated for the forces are the absolute maximum values that can be applied
for each type of construction. This force is the value that cannot be exceeded for any reason. A crossing
of this value will not be accepted by the rules made in section 2.6.8, and plastic deformations will start.
The only safety factor that has been applied was the one given from equation (3), with a value of 1.0,
and no other in the project. A greater safety factor can be used to make the result safer from failing if an
extra safety is wanted. This job is often up to the company that uses the tension rods to decide to make
sure they are safe from failures. What safety factor that shall be used depends on the situation where the
tension rods are about to be used, so putting a safety factor in this project can be useless to do. The
situation can give a safety factor that can be given by the company that uses tension rods, and that will
make the result from the Table 14-20 even better and minimizing the zones that are over the yield point
in figures 89-90 and 92-96 in the results.
Even Proplate could put a safety factor on the values from Tables 14-19 to make their tension rods safer
from failures. This would make the result worse since the maximum force will decrease when this is
done, but it will make the risk for yielding lower. One example is to put a safety factor of 0.9 (90 %
safety to the maximum force to the system) on Table 14-19. An even greater safety factor can be used
if Proplate thinks it is necessary for the safety.
Table 20 shows Table 14 with a safety factor of 0.9, Table 21 shows Table 15 with a safety factor of
0.9, Table 22 shows Table 16 with a safety factor of 0.9, Table 23 shows Table 17 with a safety factor
of 0.9, Table 24 shows Table 18 with a safety factor of 0.9, Table 25 shows Table 19 with a safety factor
of 0.9.
Table 20: The result from Table 14, but with a 90 % safety
Thickness: 10 mm: 20 mm: 30 mm: 40 mm: 50 mm:
Maximum force: 194.4 kN 388.8 kN 583.2 kN 777.6 kN 972 kN
Table 21: The result from Table 15, but with a 90 % safety
Thickness: 10 mm: 20 mm: 30 mm: 40 mm: 50 mm:
Maximum force: 225 kN 450 kN 675 kN 900 kN 1125 kN
Table 22: The result from Table 16, but with a 90 % safety
Thickness: 10 mm: 20 mm: 30 mm: 40 mm: 50 mm:
Maximum force: 376.2 kN 752.4 kN 1128.6 kN 1504.8 kN 1881 kN

66
Table 23: The result from Table 17, but with a 90 % safety
Dimensions: t = 10 mm: t = 20 mm: t = 30 mm: t = 40 mm: t = 50 mm:
L = 1-3 m: 234 kN 468 kN 702 kN 936 kN 1170 kN
L = 4 m: 229.5 kN 459 kN 688.5 kN 918 kN 1147.5 kN
L = 5 m: 225 kN 450 kN 675 kN 900 kN 1125 kN
L = 6 m: 216 kN 432 kN 648 kN 864 kN 1080 kN
Table 24: The result from Table 18, but with a 90 % safety
Dimensions t = 10 mm: t = 20 mm: t = 30 mm: t = 40 mm: t = 50 mm:
L = 1-2 m: 376.2 kN 752.4 kN 1128.6 kN 1504.8 kN 1881 kN
L = 3-4 m: 369.9 kN 739.8 kN 1109.7 kN 1479.6 kN 1849.5 kN
L = 5 m: 363.6 kN 727.2 kN 1090.8 kN 1454.4 kN 1818 kN
L = 6-7 m: 356.4 kN 712.8 kN 1069.2 kN 1425.6 kN 1782 kN
L = 8-9 m: 350.1 kN 700.2 kN 1050.3 kN 1400.4 kN 1750.5 kN
L = 10-11 m: 343.8 kN 687.6 kN 1031.4 kN 1375.2 kN 1719 kN
L = 12 m: 336.6 kN 673.2 kN 1009.8 kN 1346.4 kN 1683 kN
L = 13 m: 331.2 kN 662.4 kN 994.8 kN 1324.8 kN 1656 kN
L = 14 m: 324 kN 648 kN 972 kN 1296 kN 1520 kN
L = 15 m: 317.7 kN 635.4 kN 953.1 kN 1270.8 kN 1588.5 kN
L = 16 m: 311.4 kN 622.8 kN 934.2 kN 1245.6 kN 1557 kN
Table 25: The result from Table 19, but with a 90 % safety
Dimensions t = 10 mm: t = 20 mm: t = 30 mm: t = 40 mm: t = 50 mm:
L = 1-2 m: 376.2 kN 752.4 kN 1128.6 kN 1504.8 kN 1881 kN
L = 3 m: 363.6 kN 727.2 kN 1090.8 kN 1454.4 kN 1818 kN
L = 4 m: 356.4 kN 712.8 kN 1069.2 kN 1425.6 kN 1782 kN
L = 5 m: 343.8 kN 687.6 kN 1031.4 kN 1375.2 kN 1719 kN
L = 6 m: 336.6 kN 673.2 kN 1009.8 kN 1346.4 kN 1683 kN
L = 7 m: 331.2 kN 662.4 kN 994.8 kN 1324.8 kN 1656 kN
L = 8 m: 324 kN 648 kN 972 kN 1296 kN 1520 kN
L = 9 m: 311.4 kN 622.8 kN 934.2 kN 1245.6 kN 1557 kN
L = 10 m: 304.2 kN 608.4 kN 912.6 kN 1216.8 kN 1521 kN
The results that can be seen in Table 14-19 is the absolute maximum load that the tension rods can be
used with, but this load is made under many assumptions on the place where they are used. The
maximum load they can withstand can change if the conditions around them are changed. A big
difference in the result would probably not be seen if only one of these factor changes, but a greater
difference can be seen if many of these factor changes. Examples of these factors that has been assumed,
and that can change the result drastically, are, for instance, the gravity constant, the temperature, the
density, the material parameters and much more. The gravity constant was set to 9.81 m/s2, but this
constant can be higher at some points in the world, and it may decrease the maximum allowed load
applied to the structures. The temperature effects, on both the material parameters and in increasing
stresses due to heat driven deformations, was assumed to give no critical effect on the structure, but a
smaller effect will probably be seen on the structure depending on where it is tested. Values of the
density, Young’s modulus and Poisons ratio were set to “normal values for steels”, but these values are
probably not exact in reality. A slightly higher density and Young’s modulus could, for instance, be able
to increase the material stresses in the structures and decrease the maximum load that can be applied to
the structure. A greater change may occur if many of the applied parameters described are slightly wrong
at the same time, and it may therefore make the maximum load applied smaller seen in Table 14-19 [35].
A safety factor on the tension rods, given from Proplate, can therefore be good to ensure tension rod.
Table 20-25 has a safety factor of 90 %, which can be assumed to be enough to back up these small

67
errors, which can be used instead of Table 14-19. Proplate can decide for themselves what safety they
would like to put on their tension rods, and using it on table 14-19. Perhaps Proplate would like an even
greater safety on their products and put, for instance, a safety of 80 % to their tension rods.
One important question is how good the final result is actually. The colored area in Figure 89-90 and
Figure 92-96 have grown in about 12.5 % of the thickness of the tension rod from both sides. This will
indicate that plastic deformations are about to start, in a larger scale, which means that the results are on
the limits of acceptance. It is believed that this result is good enough to be used safely. A harder rule
can be used as well to increase safety, but it is believed that the condition stated is appropriate since the
companies using the straps often has their own safety factors in the models. This means that the straps
will be used at lower applied stresses, and the colored area will decrease. The result given is only for
when this maximum stress is applied.
What can be seen in Figure 89-90 and Figure 92-96 is that the stresses in the hole reaches its maximum
values close to the edge, and slowly grows into the hole with increasing load. The reason to this is
because the loader interact, on which can be seen in Figure 87. The rod-part of the loader will be bent
when it is loaded, and this bending will make a stronger contact closer to the edge of the hole, and it
arises from the loader-model. The real-life loader construction can be made better than the one used in
the analyses, and the problem might be reduced in reality. Thus, the results shows a result worse than
the actual real-life result. The colored area in those figures might decrease due to better contact and
improve the result. Figure 88 also shows what is expected from the result to accept it. The colored area
of the elements close to the edge must be minimized and not be allowed to “walk through” the whole
element. The stress is allowed to only affect, if any affect, the surface region.
The friction analysis made, see section 2.4.5 for more information, shows that a larger coefficient of
friction increases the area that starts to yield. The coefficient of friction used in the analyses can be seen
as a very high coefficient, and the real friction coefficient is probably lower than the one used in the
project. This will probably make the colored areas in Figure 89-90 and Figure 92-96 to decrease a little
bit, which is good when it comes to safety. The coefficient of friction might still be quite high, so the
structure can hold itself together easily, and the real value might be a value close to 0.78 as used.
However, the value of the coefficient of friction is assumed not to be higher than 0.78, and probably
smaller, but it is still believed to be close to 0.78 [45-49].
The study on the advantages and disadvantages using screws were supported by results made in the
other analyses. The sprints in the study were tested under the yield point, and this result was used to
estimate the required yield strength used for the screws. Screws should be made from the higher strength
material of Toolox 44, instead of Toolox 33 used for the sprints (see Table 7 and 8 for a comparison
between the materials [26]). It would probably be better, and cheaper, to buy screws from another
company. The machining of the threading process would perhaps, unlike the screws, be better to be done
directly at Proplate in order to avoid extra deliveries of large components back and forth between
Proplate and a threading company.
Surprisingly, all the analyses 1-6 displayed independence of the orientation of the tension rods. Tension
rods standing up gave the same maximum load as tension rods that was laying down. Hence, the gravity
has a small effect on the increased stress around the holes. It is primary the tension load that was the
dominant factor for the maximum stress. Analyses made without the gravity would probably have given
a result that was close to the result found, but with stresses a bit lower around the holes.
The fact that the tension load was the dominant factor for the maximum stress is an advantageous result.
An applied normal load to a beam gives a proportional maximum stress to the cross-section area, and
then also the maximum load is proportional to the cross-section area of the tension rod. Only tension
rods with the largest possible thickness were tested, and the same tension may then apply to the loader
independent of the thickness of the tension rods.

68
Just a few tests were made with thinner tension rods, with only the smallest possible thicknesses, and
the analysis results are compatible to the other results. Figure 90 shows results from one of the analyses
of thinner tension rods, and it can be seen that the stresses that have reached the yield point are still
around the edge and very small. The rule that the stresses are prohibited to expand more than 12.5% into
the hole thickness (through the first element) was not used here, this rule was only tested for the largest
models of tension rods, but the stresses were still close to the edge. The result can therefore be treated
as acceptable. A finer mesh could be used to determine more exactly how long into the model the colored
area, the plastic region, actually has reached [51], but it felt unnecessary to do since the result was still
small.
Proplate is interested in investigating how model changes can affect their tension rods, but no simulation
tests were made with models with the sprints replaced by screws. The reason to this is that the type of
screw should be chosen first, and then analyzed. Many different screws may be used, and it means that
more analyses has to be performed to understand how to optimize the design. There was no time in the
project for this type of optimization. However, it may be a future work from the project with the goal to
obtain a stress description and to optimize screw design.
Proplate uses a specific type of tension rods of their own design. Many of the other described in this
report uses another type, built adopting the SS-EN 1993-1-standards [7]. Thus Proplate’s tension rods
are more special and harder to work with, but the other types of tension rods are seen more often in
constructions.
One way for Proplate to market themselves better is to develop designs with screws as the holding
elements instead of the sprints they use today. It will hold the structure together stronger and the tension
rods will become less like the one seen in Figure 98. This can be one way to give more choices to the
customers and make Proplates tension rods more useful in more categories. The other companies often
puts a pipe inside the fork head, which has threads drilled inside, and the screws can be screwed to this
pipe, see Figure 2. Proplate can probably drill the threads directly into the tension rod and does not need
this pipe in their constructions, but the exact design of the thread should be further investigated.
4.3 Comparison between results
The big question from the analyses is if the result derived can be judged as acceptable or disapproved.
It can be made by comparing the results between different companies maximum loads on tension rods
from Pretec and Macalloy as used in table 10 and 11 respectively. These strap-models are different in
many ways, but some simple comparisons can be made depending on the cross-section size. The
comparison made to show the results to be came very similar between the companies.
A model of a tension rod from Macalloy, and one from Dextra Group, are displayed in figure 2 and
figure 24 respectively. The hole at the end points of the tension rods is approximately as big as the
thickness and the height of the rod-part of the tension rods. If the hole is about 70 mm for a M68-
threaded tension rod, the cross-section area would then be around 4900 mm2. This cross-section area is
approximately the same for a tension rod of type C with a thickness of 30 mm. The maximum load the
tension rod can withstand is 1254 kN, see table 16. Table 10 shows the same for some of Pretec’s tension
rods, and it can be seen that ASDO 350-S and ASDO 520-S have very similar maximum loads. More
comparisons made shows the results in table 14-19 are very similar to the results from the other
companies.
The comparisons made are very simple and does not give a detailed answer, but it gives a good hint
about how well Proplate’s tension rods stands to Pretec’s tension rods. The results from the analyses

69
performed can therefore be seemed as good since the strength of the tension rods seems to be around
and over 1000 kN from the different companies.
The result from the comparison is of great importance to verify the how good the results were. Similar
studies to this have probably been made in the different companies, as a project on their own tension
rods. Figure 28 shows a strength analysis of one tension rod from Nordic Fastening Group, and it reveals
that they have been doing that kind of analyses. Results from these kinds of studies can be presented in
tables and figures, but the work behind the result (the modelling) is often something that stays in the
companies. The fact that the results came so close in this project to the results from the other companies
is therefore very good.
4.4 Future work
The project ends here, but there are still many tasks to further analyze potential improvements. Examples
of future works are:
• Perform Abaqus analyses of screw applications, and calculate the maximum load for all the
models.
• Investigate the tension rod design in order to optimize them.
• Investigate the effect of fatigue, and how well the models analyzed can withstand fatigue loads.
• Investigate future product areas for Proplate in order to improve the tension rods.
4.4.1 Future screw analysis
The effect of the screw implementation and design can be investigated further. The screw tensile
strength, and applied stress conditions can be further investigated. A small opening to that project has
been made in this project, but it can be pursued further. Screws can be chosen, and simulations can start
again to test new structures after that. The simulation tests must be made for all the tension bars once
again to see how they will be affected when introducing new screw design. Thus, the screw analysis
project will be a big project to do in itself.
4.4.2 Future optimization analysis
Tension rod design optimization is another important future task. The present models, seen in Appendix
1-4, have been tested with different lengths and thicknesses, but other dimensions may change as well.
The rod-part on the tension rods cross section may be decreased, for instance, to remove superfluous
material. It would make the tension rods cheaper to manufacture, and can be good from an environmental
perspective.
This will also be a big project to work with. Optimizations for so many models may take a long time to
do due to the number of components testings. Many factors must be kept in mind, buckling, may play a
bigger role since material reduction will affect the stiffness and the critical buckling loads.
4.4.3 Future fatigue analysis
Analysis of how fatigue can influence the result has been mentioned earlier in the discussion, but it can
be stated again due to its importance. It should be the next part in the analysis, and done even before
analyses of optimizations. It may be the next step to do, and by another student to add to the results from
the present report. This project might need much more time to do those analyses.

70
4.4.4 Future construction analysis
A fourth future work may be to investigate how Proplate can continue their work with new products.
Proplate works presently only with tension rods, but could perhaps expand to manufacturing
compression rods as well. Many application areas, such as buildings, use both tension rods as well as
compression rods, and Proplate can develop their market strength if they expand their assortment to
other types of rod-constructions. Buildings with frameworks in their structures can, if the loads are big,
use rods of both tension and compression to balance all forces. Proplate does investigate compression
bars at the moment, and it could also be a great continuity of the project for another student next year.
A company that can deliver both tension rods and compression rods to their potential customers may
increase their selling due to this.
Working with compression rods can be complex, and take some time. Drawings must first be made, and
the models from the drawings must then be tested. Compression rods are also different from tension
rods, and many other factors (such as buckling for instance) must be tested. Drawings can partially be
made from the drawings of the tension rods, but these needs to be improved to make the rod-
constructions usable for compression loads. Proplate is at the moment working with drawings of
compression rods, and drawings of these can perhaps be ready to a new project for a new student next
year to analyze.

71
5. Conclusions
The present thesis results shows that the direction and the length of the tension rods do not affect the
maximum load they can withstand when they are used individually, since only the thickness affects the
results for these tension rods. The maximum load that multiple connected tension rods can withstand
varies with both the thickness and the length of each tension rod, but the direction of the tension rods
has no influence in these cases either.
The maximum loads that can be applied to a tension bar, with a thickness of 50 mm, is 1080 kN to Strap-
A, 1250 kN to Strap-B and 2090 to strap-C are 1080 kN. The maximum load that could be applied to
four connected Strap-B, with 50 mm in thickness, and lengths from 1 m to 6 m, varied in a range from
1200 kN to 1300 kN. The maximum load that could be applied to two walnut-connected Strap-C, with
50 mm in thickness, and lengths from 1 m to 16 m, varied in a range from 2090 kN to 1730 kN. The
maximum load that could be applied to three walnut-connected Strap-C, with 50 mm in thickness, and
lengths from 1 m to 10 m, varied in a range from 2090 kN to 1690 kN. All loads decreases proportional
with a decrease in thickness, and the load also decreased with increasing lengths when several tension
bars were connected.
The hole at the end of the tension rods are the most critical points, where the structure risks to collapse,
and the sprints are always safe from failures. If these sprints were replaced by screws, they would
probably need to be made with a stronger material since the material stresses risk to increase with that
design. How much stronger the material needs to be must be calculated from an investigation itself.
What can be concluded from the project result is that:
• The force that can be applied is proportional to the thickness of the tension rod.
• The tension rod model can be chosen from the thickness of the models.
• Screws may need a greater material strength than sprints.

72
6. References
1. University, Lund. Krav på Konstruktioner. [Online] [Citat: den 15 02 2018.]
http://www.kstr.lth.se/fileadmin/kstr/pdf_files/vbk013/foerelaes/F_repetition_2015.pdf.
2. Meriam, J.L, Kraige, L.G. Engineering Mechanics Statics, 7th edition. u.o. : John Wiley & Sons, 2012-
05-31.
3. Samskolan teknik, Fackverk. [Online] [Citat: den 15 2 2018.]
https://sites.google.com/a/utb.nacka.se/samskolan-teknik/fackverk.
4. Lundh, Hans. Grundläggande hållfasthetslära . u.o. : Studentlitteratur AB , 2016.
5. Richard W. Hertzberg, Richard P. Vinci, Jason L. Hertzberg. Deformation and fracture mechanics of
engineering materials. u.o. : WILEY, 2012.
6. Macalloy. Macalloy Tension Structures. [Online] [Citat: den 15 02 2018.]
http://www.srglimited.com.au/images/files/brochures/macalloy-tension-structures_srg.pdf.
7. Swedish Standard Institution. Eurocode 3: Design of steel structures – Part 1-11: Design of
structures with tension components. u.o. : Swedish Standard Institution, 2006.
8. Bridges. [Online] [Citat: den 15 02 2018.] https://www.steelconstruction.info/Bridges.
9. Anwar, Naveed. Design of Cable Stayed Bridges. u.o. : Asian Institute of Technology.
10. Jóhannesson, Jóhannes H. Design of a 170 m span bridge over the fjord Thorskafjordur in Iceland.
Lund : Lunds Tekniska Högskola, 2010.
11. Proplate. Trycksaker. PROPLATE | ÅRSBERÄTTELSE 2016/2017. [Online] 2017. [Citat: den 15 02
2018.] https://proplate.se/sv/om-proplate/trycksaker/.
12. Trycksaker. PROPLATE | ÅRSREDOVISNING 2015/2016. [Online] 2016. [Citat: den 15 02 2018.]
https://proplate.se/sv/om-proplate/trycksaker/.
13. TOWER CRANE ANATOMY. [Online] den 19 12 2015. [Citat: den 15 02 2018.]
https://www.cranecrews.com/crane-blog/tower-crane-anatomy.
14. Swedish Standard Institution. Eurocode 3: Design of steel structures – Part 1-1: General rules and
rules for buildings. u.o. : Swedish Standard Institution, 2005.
15. Structural Integrity. [Online] [Citat: den 18 02 2018.]
https://99percentinvisible.org/episode/structural-integrity/.
16. Trusses. [Online] [Citat: den 18 02 2018.] https://www.steelconstruction.info/Trusses.
17. Eichenberger, Peter. Roof Truss Guide - Design and construction of standard timber and steel
trusses. [Online] [Citat: den 18 02 2018.] http://www.nzdl.org/gsdlmod?e=d-00000-00---off-0cdl--00-
0----0-10-0---0---0direct-10---4-------0-1l--11-en-50---20-about---00-0-1-00-0--4----0-0-11-10-0utfZz-8-
00&cl=CL1.252&d=HASH018da78ecdae2da0d3f516df>=2.
18. Swedish Standard Institution. SS-EN 1990, Eurocode – Basis of structural design. u.o. : Swedish
Standard Institution, 2002.

73
19. HALFEN. DETAN dragstångsystem. [Online] HALFEN. [Citat: den 18 02 2018.]
http://www.halfen.com/se/1414/produkter/dragstangsystem/detan-dragstangsystem/inledning/.
20. Lstiburek, joseph. BSI-005: A Bridge Too Far. [Online] den 15 08 2008. [Citat: den 18 02 2018.]
https://buildingscience.com/documents/insights/bsi-005-a-bridge-too-far.
21. Proplate. WORLD-LEADING IN STRAPS. [Online] Proplate. [Citat: den 23 02 2018.]
https://proplate.se/proplate-straps/.
22. CUT RISK CUT TIME CUTTING EDGE. Oxelösund : Proplate.
23. Hutchings, Ian och Shipway, Philip. Tribology: Friction and Wear of Engineering Materials, Second
Edition. u.o. : Butterworth-Heinemann, 2017.
24. SSAB. Data sheet 2013 Strenx 960. Oxelösund : SSAB, 2017.
25. Toolox 33. Färdighärdat, exceptionellt rent maskin- och verktygsstål. [Online] SSAB. [Citat: den 23
02 2018.] https://www.ssab.se/produkter/varumarken/toolox/products/toolox-33.
26. Toolox 33, 40 and 44 Engineering & Tool Steel. Oxelösund : SSAB.
27. Dextra. Bangkok BITEC expansion. [Online] [Citat: den 28 02 2018.]
https://www.dextragroup.com/activities/technical-solutions-for-construction/project-references/11-
activities/construction/solutions/142-bangkok-bitec-expansion.
28. Macalloy. Tension Structures. European Technical Approval. [Online] [Citat: den 28 02 2018.]
http://www.macalloy.com/application/files/3515/1301/0409/2017_TS_APPROVAL_web_res_copy.p
df.
29. Pretec. Nya Dimensioner. [Online] [Citat: den 28 02 2018.]
http://www.pretec.se/sites/default/files/Schwedisch%20komplett.pdf.
30. Nordic Fastening Group. Tension rod and compression strut systems. [Online] [Citat: den 28 02
2018.] http://nfgab.se/media/1256/mconnect2-web.pdf.
31. Dextra. Tension bar systems. [Online] Dextra. [Citat: den 28 02 2018.]
https://www.dextragroup.com/activities/technical-solutions-for-construction/solutions/84-tension-
bar-systems.
32. Swedish Standard Institution. Eurocode 3: Design of steel structures – Part 1-5: Plated structural
elements. u.o. : Swedish Standard Institution, 2006.
33. Eurocode 3: Design of steel structures – Part 1-8: Design of joints. u.o. : Swedish Standard
Institution, 2005.
34. Eurocode 3: Design of steel structures – Part 1-9: Fatigue. u.o. : Swedish Standard Institution,
2005.
35. Askeland, Donald. The Science and Engineering of Materials. u.o. : CL Engineering , 2011.
36. McCrum, N. G, Bucknall, Clive B och Buckley, C. P. Principles of polymer engineering. Oxford :
Oxford University, 1997.
37. swedish standard institution. Eurocode 3: Design of steel structures – Part 1-2: General rules –
Structural fire design. u.o. : swedish standard institution, 2005.

74
38. Eurocode 3: Design of steel structures – Part 1-7: Plated structures subject to out of plane loading.
u.o. : swedish standard institution, 2007.
39. Eurocode 3: Design of steel structures – Part 1-4: General rules – Supplementary rules for stainless
steels. u.o. : swedish standard institution, 2006.
40. Johansson, Bernt. SBI seminarium. Skruvförband Utformning och dimensionering. [Online] den 10
03 2010. [Citat: den 14 03 2018.] https://www.yumpu.com/sv/document/view/20537573/sbi-
seminarium/15.
41. Stresses in PressureVessels. [Online] [Citat: den 14 03 2018.]
https://booksite.elsevier.com/samplechapters/9780750677400/9780750677400.PDF.
42. Friction and Friction Coefficients . [Online] [Citat: den 18 03 2018.]
https://www.engineeringtoolbox.com/friction-coefficients-d_778.html.
43. Coefficients of Friction for Steel. [Online] [Citat: den 18 03 2018.]
https://hypertextbook.com/facts/2005/steel.shtml.
44. Coefficients of Friction Equation and Table Chart. [Online] [Citat: den 18 03 2018.]
https://www.engineersedge.com/coeffients_of_friction.htm.
45. Coefficient for Static Friction of Steel. [Online] [Citat: den 18 03 2018.]
http://www.carbidedepot.com/formulas-frictioncoefficient.htm.
46. Coefficient of Friction . [Online] [Citat: den 18 03 2018.]
http://www.engineershandbook.com/Tables/frictioncoefficients.htm.
47. Coefficients of Friction “F”. [Online] [Citat: den 18 03 2018.]
http://web.applied.com/assets/attachments/492ACC9E-E5C2-2D43-0B8CCDA72ACE3361.pdf.
48. Friction Factors. [Online] [Citat: den 18 03 2018.] http://rommet.com/remco/misc/friction.htm.
49. Factors affecting the friction between surfaces . [Online] [Citat: den 18 03 2018.]
http://www.roymech.co.uk/Useful_Tables/Tribology/co_of_frict.htm.
50. Failure Criteria For Material Failure…. [Online] den 31 03 2016. [Citat: den 18 03 2018.]
https://designhubin.com/2016/03/31/failure-criteria-for-material-failure/.
51. Logan, Daryl L. A First Course In The Finite Element Method. Wisconsin : University of Wisonsin,
2011.
52. Threading a hole. The tap. [Online] [Citat: den 03 05 2018.]
http://web.mit.edu/course/other/machineshop/Drilling/threading.html.

75
Appendix 1 – Drawing of Strap-A
Figure A1 shows a drawing made of strap-A with some specific dimension for this tension rod. The
thickness and the distance between the holes can be varied according to given rules described in the
report earlier. The other dimensions are the same for all types of strap-A.
Figure A 1: A drawing made of one type of strap-A with dimensions in the drawing, except the thickness and distance between the two holes that can be varied.

76
Appendix 2 – Drawing of Strap-B
Figure A2 shows a drawing made of strap-B with some specific dimension for this tension rod. The
thickness and the distance between the holes can be varied according to given rules described in the
report earlier. The other dimensions are the same for all types of strap-B.
Figure A 2: A drawing made of one type of strap-B with dimensions in the drawing, except the thickness and distance between the two holes that can be varied.

77
Appendix 3 – Drawing of Strap-C
Figure A3 shows a drawing made of strap-C with some specific dimension for this tension rod. The
thickness and the distance between the holes can be varied according to given rules described in the
report earlier. The other dimensions are the same for all types of strap-C.
Figure A 3: A drawing made of one type of strap-C with dimensions in the drawing, except the thickness and distance between the two holes that can be varied.

78
Appendix 4 – Drawing of the walnut-strap
Figure A4 shows a drawing made of the walnut-strap with some specific dimension for this tension rod.
The thickness is the only parameter that can be varied according to given rules described in the report
earlier. The other dimensions are the same for all types of walnut-straps.
Figure A 4: A drawing made of one type of the walnut-strap with dimensions in the drawing, except the thickness that is the only factor that can be varied.