Strength of Joint in Seismic Retrofit Using Outer-Frame ... · STRENGTH OF JOINT IN SEISMIC...
14
13 th World Conference on Earthquake Engineering Vancouver, B.C., Canada August 1-6, 2004 Paper No. 1244 STRENGTH OF JOINT IN SEISMIC RETROFIT USING OUTER-FRAME FOR EXISTING RC BUILDINGS Akira TASAI 1 , Kenji NAGAYAMA 2 , Hideo KATSUMATA 3 , Tsuyoshi SANO 4 , Matsutaro SEKI 5 SUMMARY In a seismic strengthening of existing reinforced concrete (RC) buildings, it is important to estimate the capacity along the connection between the additional component and the existing frame. In case of the strengthening with new outer frames, researches are insufficient on the required quantity of anchors in the connection to transfer shear and to resist eccentric moment. Therefore, an experimental study and elasto- plastic analyses were carried out to investigate the effect of anchors on the behavior of existing RC frames strengthened by new outer frames. One-span and one-third scale specimens simulating an existing frame strengthened by a new outer RC frame with steel braces were tested under static and cyclic loading reversals. Friction type dampers were incorporated into the braces to make the resistance generated by the new frame stable. Main parameter of the test was quantity of anchors connecting both frames. Based on the test results, specimens were analyzed by nonlinear frame analysis. Moreover, parametric analyses by changing quantity of anchors were conducted to investigate adequate quantity of them. From the test and the analyses, the followings were concluded. The quantity of anchors could be determined appropriately according to the recommendation by Japan Building Disaster Prevention Association for the retrofitting inside the existing frame, provided that the capacity of a new outer frame should be estimated exactly. Assuming incomplete composition between the new outer RC frame and the inner steel frame was desirable to estimate their capacity safely in the design. Sufficient anchors should be placed in the beam and be concentrated in high shear areas in order to transfer the shear to the new outer frame effectively. 1 Associate Professor, Faculty of Engineering, Yokohama National University, Yokohama, Japan 2 Design Engineer, Department of Structural Design, Mitsubishi Jisho Sekkei Inc., Tokyo, Japan 3 Chief Research Engineer, Technical Research Institute, Obayashi Corporation, Tokyo, Japan 4 Research Engineer, Technical Research Institute, Obayashi Corporation, Tokyo, Japan 5 General Manager, Technical Research Institute, Obayashi Corporation, Tokyo, Japan
Transcript of Strength of Joint in Seismic Retrofit Using Outer-Frame ... · STRENGTH OF JOINT IN SEISMIC...

13th World Conference on Earthquake Engineering Vancouver, B.C., Canada
August 1-6, 2004 Paper No. 1244
STRENGTH OF JOINT IN SEISMIC RETROFIT USING OUTER-FRAME FOR EXISTING RC BUILDINGS
Akira TASAI1, Kenji NAGAYAMA2, Hideo KATSUMATA3, Tsuyoshi SANO4, Matsutaro SEKI5
SUMMARY In a seismic strengthening of existing reinforced concrete (RC) buildings, it is important to estimate the capacity along the connection between the additional component and the existing frame. In case of the strengthening with new outer frames, researches are insufficient on the required quantity of anchors in the connection to transfer shear and to resist eccentric moment. Therefore, an experimental study and elasto-plastic analyses were carried out to investigate the effect of anchors on the behavior of existing RC frames strengthened by new outer frames. One-span and one-third scale specimens simulating an existing frame strengthened by a new outer RC frame with steel braces were tested under static and cyclic loading reversals. Friction type dampers were incorporated into the braces to make the resistance generated by the new frame stable. Main parameter of the test was quantity of anchors connecting both frames. Based on the test results, specimens were analyzed by nonlinear frame analysis. Moreover, parametric analyses by changing quantity of anchors were conducted to investigate adequate quantity of them. From the test and the analyses, the followings were concluded. The quantity of anchors could be determined appropriately according to the recommendation by Japan Building Disaster Prevention Association for the retrofitting inside the existing frame, provided that the capacity of a new outer frame should be estimated exactly. Assuming incomplete composition between the new outer RC frame and the inner steel frame was desirable to estimate their capacity safely in the design. Sufficient anchors should be placed in the beam and be concentrated in high shear areas in order to transfer the shear to the new outer frame effectively.
1 Associate Professor, Faculty of Engineering, Yokohama National University, Yokohama, Japan 2 Design Engineer, Department of Structural Design, Mitsubishi Jisho Sekkei Inc., Tokyo, Japan 3 Chief Research Engineer, Technical Research Institute, Obayashi Corporation, Tokyo, Japan 4 Research Engineer, Technical Research Institute, Obayashi Corporation, Tokyo, Japan 5 General Manager, Technical Research Institute, Obayashi Corporation, Tokyo, Japan
INTRODUCTION Strengthening with new outer frames is one of effective seismic strengthening methods for existing reinforced concrete (RC) buildings, because normal occupancy is possible during strengthening construction work by the method. In the method, it is important to estimate the capacity along the connection between the additional component and the existing frame. However, researches are insufficient on the required quantity of anchors in the connection to transfer shear and to resist eccentric moment. In this study, experimental work and elasto-plastic analyses were carried out to investigate the behavior of existing RC frame strengthened by new outer frame. The quantity of post-installed anchor rebar to connect both frames was chosen as a main parameter in the test. Effect of the quantity on the strength, deformation ability, or failure behavior of the strengthened frame was investigated. Estimation method to determine the adequate quantity of anchor rebar was studied based on the proposed strengthening technique. In the analytical study, simulating inelastic behavior of the test specimens was attempted. On the basis of the accuracy in reproducibility of the test results by the analysis, parametric studies were conducted to investigate the effect of the quantity or arrangement of post-installed anchor rebar on the performance of the strengthened frame in order to provide beneficial information for the rehabilitation of existing RC structures.
OUTLINE OF THE TEST Test specimens Total three one-span frame specimens whose scale was reduced to one third from a real size structure were tested. Two of them simulated a reinforced concrete existing frame strengthened by a new outer frame as shown in Figure 1. A prototype building was supposed to be a school building in Japan. Dominant characteristics of specimens were summarized in Table 1. Specimen No.1 was prepared as a reinforced concrete frame without strengthening to obtain a basic performance of the original existing frame. Specimens No.2 and No.3 were strengthened ones for the same original existing frame as specimen No.1. The main parameter of the strengthened specimens was the shear strength along the connection between an existing frame and a new outer frame. Table 1 Characteristics of Specimens
Figure 1 Strengthening Concept
Dimensions, reinforcement, and materials of the existing frame were the same among all specimens as shown in Figure 2. Rigid RC stubs for loading were cast monolithically to the top and bottom of the specimens. Specifications of the new outer frame for specimens No.2 and No.3 were common as shown in Figure 3. The outer frame was consisted of a reinforced concrete frame, an inner rectangular steel frame, and steel braces within the frame. The main bars in columns of the RC frame were anchored in the stub by D10 rebar welded to them. The specification of the braces was special, that is, the brace included a
Specimen Strength of the Connection StrengtheningNo.1 (No connection) (Non)No.2 No Failure along the Connection By New OuterNo.3 Failure along the Connection Frame

friction type damper whose details are illustrated in Figure 4. The damper was specially created to dissipate a seismic energy by the sliding friction between a stainless plate and a brake material plate, which adhered the gusset steel plate or the steel brace. The device is able to produce the stable friction and restoring force characteristics during the sliding under the constant pressure by tightening force of high tension bolts through special conical springs. The static friction force and displacement relationship obtained from the unit test for the damper is shown in Figure 5. The static friction coefficient changed from 0.2 to 0.245. It was also confirmed by the dynamic test that the friction coefficient reached 0.3 under the sliding velocity during large earthquakes. Material properties are listed in Table 2.
Figure 2 Reinforcement Details of Existing RC Frame
Figure 3 Details of New Outer Frame
Table 2 Material Properties
2,200
1,200 200 300200300 200 200 200
600
650
750
2,050
650
300 200 300
800
350
1,350
2,050
350
PL=12
Stub Main Bars D22
Stub Stirrups D13
Beam Stirrups D6
Beam Main Bars D13
Column Main Bars D10
Column Hoops 4φ
CL
1,800200 1,200 200
200
750
1,250
300
PL=12
3002001,2002,200
200300
PL=12
100 100 100
D10
Beam Stirrups D6
Gusset PLPL=9
Headed Stud13φ Ls=80
Steel Frame [-100×50×5
Beam Main Bars D13
Friction TypeDamper
Gusset PL=9
Column Hoops D6
Column Main Bars D10
Reinforcement Anchor Brace Gusset Steel Concrete σ BD13 D10 D6 4φ D10 Frame Existing New Frame
Yield σ y 387 382 329 442 337 291 281 321 23.7 21.5Tensile σ u 566 537 491 493 478 354 433 463

Figure 4 Details of Friction Damper
Figure 5 Force – Displacement Relationship of Friction Damper The connection between the existing RC frame and the new outer RC frame was designed according to the Seismic Improvement Design Guidelines for Existing Reinforced Concrete Buildings (The Japan Building Disaster Prevention Association, 1990). The shear force carried through the connection was estimated as the total lateral strengths of the new outer RC frame, the inner steel frame and the braces with friction dampers. Surface roughening was applied for about 20 percent of total connection surface area in the existing RC beam and columns. The shear strength of the connection in specimen No.2 was designed to be larger than the maximum shear force QE carried through the connection, based on the following equation, which is provided in the guideline as the shear strength qa of a post-installed adhesive anchor rebar, when the effective anchorage length is sufficient (in case of exceeding seven times of the rebar diameter).
-250
-200
-150
-100
-50
0
50
100
150
200
250
-40 -30 -20 -10 0 10 20 30 40
Di
Damping Force(kN)
Load(kN )
D am pingForce(kN )

[ ]21,min aaa qqq = (1)
=1aq esy a⋅⋅σ7.0 (2)
esBca aEq ⋅⋅= σ4.02 (3)
where, yσ : specified yield strength of an anchor rebar,
es a : cross-sectional area of an anchor rebar,
cE : Young’s modulus of concrete in the existing element, and
Bσ : compressive strength of concrete in the existing element. Due to eccentricity between the existing frame and the new outer frame, an eccentric moment M perpendicular to the loading direction could occur. The moment generates tensile force T in the post-installed anchor rebar. T was estimated by the following equation.
LeQ
LMT E ⋅== (4)
where, e : distance between both structural centroids of existing and new outer frames, and
L : resisting arm length, which was defined as two third of the distance between both centroids of columns in the new outer RC frame.
The tensile strength aT of a post-installed adhesive anchor was estimated by the following equation
according to the guideline. [ ]321 ,,min aaaa TTTT = (5)
01 aT ya ⋅= σ (6)
cBa AT ⋅= σ23.02 (7)
eaaa dT l⋅⋅⋅= πτ3 (8)
2110 Ba στ = (9)
where, yσ : specified yield strength of an anchor rebar,
Bσ : compressive strength of concrete in the existing element,
0a : cross-sectional area of an anchor rebar,
cA : effective projected area of cone shape concrete failure surface of existing element,
aτ : bond strength of a post-installed anchor rebar against pull-out force,
ad : diameter of a post-installed anchor rebar, and
el : effective anchorage length of a post-installed anchor rebar.
Consequently, the demanded number an of post-installed anchor rebar in specimen No.2 was determined
by the following equation. The demanded number of anchor rebar due to the eccentric moment, which is

represented in the second term in the equation, was about 10 percent of the total demanded number of anchor rebar.
aa
Ea T
Tq
Qn +≈ (10)
Specimen No.3 was designed to fail along the connection in order to obtain the shear strength along that. The quantity of anchor rebar was determined so that the direct shear strength along the connection could be slightly smaller than the supplied shear force along the connection. The direct shear strength jQ was
estimated the following equation, based on the conventional theory (Mattock, 1972). jejayaj AnTQ τ⋅+⋅= 8.0 (11)
where, yaT : tensile yield strength of a post-installed anchor rebar,
jA : total area of the connection, and
jeτ : the maximum direct shear stress between concrete surfaces.
The first term in the above equation represents the contribution of friction by anchor rebar. The second term represents the contribution of concrete to the direct shear strength along the connection. The value of
jeτ was assumed to be 1.0 N/mm2 in consideration for non-uniformity in the distribution of shear stress.
Determined arrangement of post-installed anchor rebar in the specimens is shown in Figure 6. The quantity of post-installed anchor rebar in specimen No.3 was about one fourth of that in specimen No.2.
Specimen No.2 Specimen No.3 (26 Anchors in Beam, 16 Anchors in Column) (7 Anchors in Beam, 4 Anchors in Column)
Figure 6 Arrangement of Post-Installed Anchor Rebar
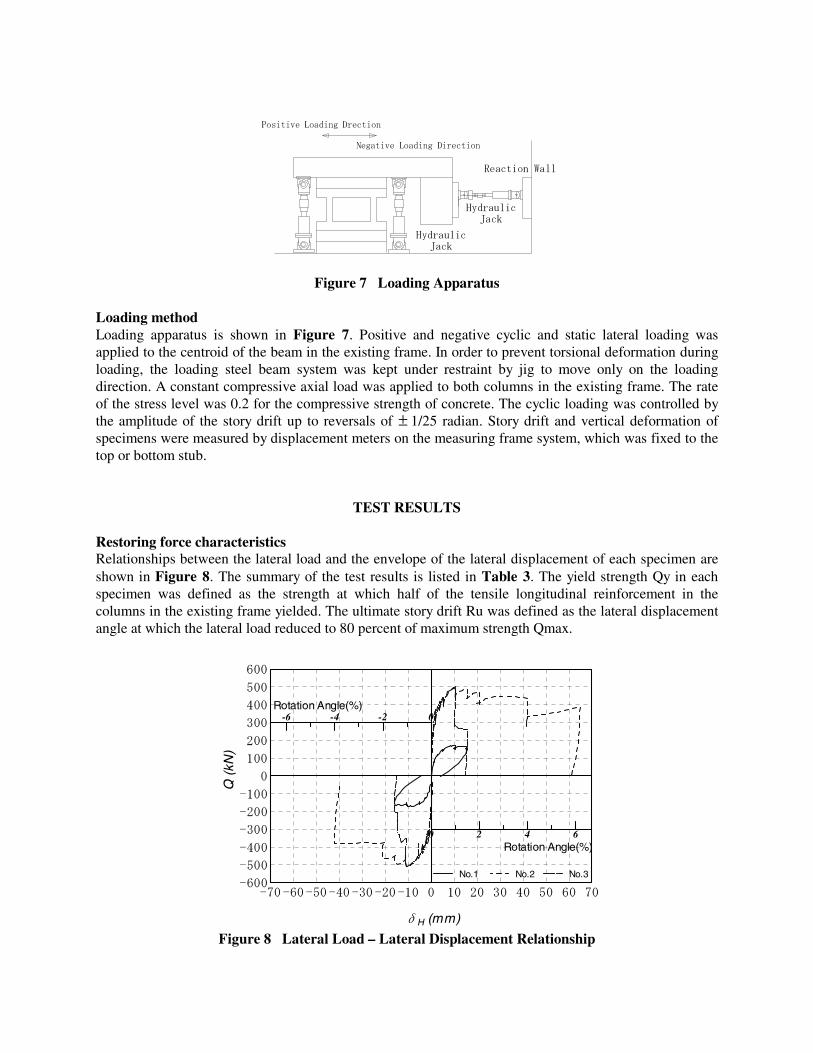
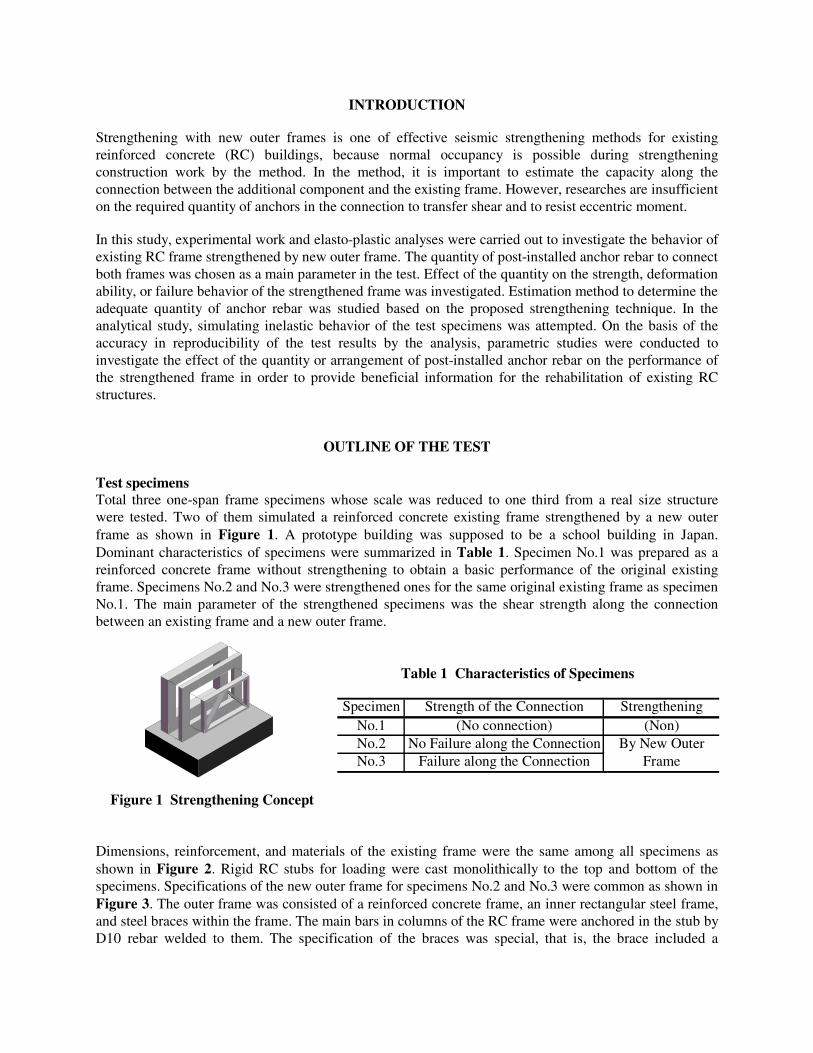
Figure 7 Loading Apparatus Loading method Loading apparatus is shown in Figure 7. Positive and negative cyclic and static lateral loading was applied to the centroid of the beam in the existing frame. In order to prevent torsional deformation during loading, the loading steel beam system was kept under restraint by jig to move only on the loading direction. A constant compressive axial load was applied to both columns in the existing frame. The rate of the stress level was 0.2 for the compressive strength of concrete. The cyclic loading was controlled by the amplitude of the story drift up to reversals of ± 1/25 radian. Story drift and vertical deformation of specimens were measured by displacement meters on the measuring frame system, which was fixed to the top or bottom stub.
TEST RESULTS Restoring force characteristics Relationships between the lateral load and the envelope of the lateral displacement of each specimen are shown in Figure 8. The summary of the test results is listed in Table 3. The yield strength Qy in each specimen was defined as the strength at which half of the tensile longitudinal reinforcement in the columns in the existing frame yielded. The ultimate story drift Ru was defined as the lateral displacement angle at which the lateral load reduced to 80 percent of maximum strength Qmax.
Figure 8 Lateral Load – Lateral Displacement Relationship
HydraulicJack
HydraulicJack
Positive Loading Drection
Negative Loading Direction
Reaction Wall
-70 -60 -50 -40 -30 -20 -10 0 10 20 30 40 50 60 70-600
-500
-400
-300
-200
-100
0
100
200
300
400
500
600
No.3
δH (mm)
Q (k
N)
No.2 No.1
0 2 4 6
-6 -4 -2 0Rotation Angle(%)
Rotation Angle(%)
Table 3 Test Results
K0: Initial Stiffness
Specimen No.1 Specimen No.2 Specimen No.3
Figure 9 Final Failure Patterns Specimen No.1 yielded before ± 1/100 radian of the drift angle, and reached the maximum strength at ± 1/100 radian. After that, at –1/67 radian, columns failed in shear and, at the same time, the ability to sustain the constant axial load had lost. The maximum strengths of strengthened specimens No.2 and No.3 were marvelously larger than that of specimen No.1; i.e., both were three times of that of specimen No.1, despite of large difference in the quantity of anchor rebar along the connection in specimens No.2 and No.3. Sufficient efficiency of the strengthening was demonstrated in both specimens. Initial stiffness in both specimens was also significantly higher than that of non-strengthened specimen No.1. Large deformability has developed in specimen No.2. The ductility factor was 4.7 in the positive loading direction and 4.8 in the negative loading direction. On the other hand, in specimen No.3, rapid decrease in the strength due to shear failure in columns and slippage failure between the existing and the outer frames occurred immediately after the maximum strength. The load – displacement relationship indicated brittle behavior. The final failure patterns of specimens are shown in Figure 9. The figures of specimen No.2 and No.3 show the failure of new outer frames. Eccentricity by new outer frame During the test, relative separation displacement between the existing frame and the new outer frame was measured. The difference of the measured displacements at both ends in the top beam of specimen No.3 is plotted in Figure 10 at every first peak of loading cycle. The alternately change in the separation displacement indicated in the figure is illustrated conceptually in Figure 11. The effect of eccentricity by the addition of the outer frame is clearly demonstrated. Therefore, it is reasonable to estimate the quantity of anchor rebar along the connection in consideration for the eccentricity. Strength of the new outer frame The new outer frame adopted in this study consisted of the RC frame, the inner steel frame and the braces with friction dampers. The composite effect of these three elements on the lateral strength of the new outer frame was investigated. Three composite effects were assumed; i.e., complete composition, incomplete composition, and complete separation between the RC frame and the inner steel frame. The complete
Specimen Direction Qy (kN) Qmax (kN) Ry (%) Rmax (%) Ru (%) μ K0 (kN/mm)No.1 Positive 166 170 0.76 0.98 41.5
Negative -162 -172 -0.6 -0.81 -1.5 2.5No.2 Positive 486 497 0.85 1 4 4.7 214.9
Negative -500 -514 -0.8 -0.97 -4 4.8No.3 Positive 493 502 0.88 1.01 1.5 1.7 291
Negative -499 -512 -0.9 -1.02 -1 1.2

composition assumed monolithic composition between the both frames. The incomplete composition assumed friction along the interface between the both frames and the complete separation assumed the summation of the independent strength in each frame. The maximum strengths of specimens on the negative loading direction in the test are listed in Table 4. The estimated maximum strengths of specimens No.2 and No.3 are listed in Table 5 for the three cases of the assumed composite effect. Each strength in table 6 represents the summation of the observed maximum strength of specimen No.1, the observed lateral strength of braces with damper based on the unit test, and the calculated lateral strength the RC frame – inner steel frame system under consideration for the assumed composite effects. The observed maximum strengths of specimens No.2 and No.3 was almost equivalent to the estimated strength assuming the incomplete composition. Therefore, assuming the incomplete composition between the RC frame and the inner steel frame is adequate for the estimation of quantity of anchor rebar. On the other hand, assuming the complete separation is safe side for the estimation of the lateral strength of the new outer frame.
Figure 10 Detached Displacement due to Torsional deformation
Figure 11 Conceptual Deformation due to Eccentricity
Table 4 Observed Maximum Strength
Table 5 Estimated Maximum Strength Based on Composite Effect
Det
ache
d D
ispl
acem
ent(mm)
0.0
-0.4
-0.8
-1/5
60
+1/
560
+1/
280
-1/2
80
+1/
200
-1/2
00
+1/
100
-1/1
00
0.8
0.4
Existing Frame Existing Frame
New Outer Frame New Outer Frame
Specimen No.1 No.2 No.3Qmax (kN) 172 514 512
Specimen No.2 No.3Friction Coefficient 0.2 0.245 0.2 0.245
Complete Composition 556 598 536 575Incomplete Composition 516 559 497 535
Complete Separation 459 502 440 477

ANALYTICAL STUDY In order to simulate the test results, inelastic frame analysis was carried out. Moreover, parametric analysis was also carried out changing the quantity of anchor rebar. Computer program CANNY-E which was developed for three-dimensional inelastic dynamic and static frame analysis was used. Frame models The existing RC frame in specimens was simulated by a frame model in the analysis. The beam and columns in the model was divided to line elements at every location of anchor rebar as shown in Figure 12. Each line element was represented as an elastic beam with inelastic springs model. The model of restoring force characteristics as shown in Figure 13 was adopted to represent the deterioration in strength observed in the test. Elastic stiffness, cracking moment, and yield moment were estimated based on the material properties according to the AIJ Standard for Structural Calculation of Reinforced Concrete Structures (AIJ, 1999). Secant stiffness at yielding was estimated based on an empirical method (AIJ, 1987). Stiffness after yielding was assumed to be 1 percent of elastic stiffness. The RC frame and the inner steel frame in the new outer frame was assumed to resist monolithically and simulated by a single frame model. The beam and columns in the model was divided to line elements by the same manner as shown Figure 12. The model of restoring force characteristics was also the same as shown in Figure 13. As the initial stiffness of the model, stiffness after cracking in the RC frame was given. The first degrading point in stiffness in the model was assumed to be equivalent to the yield point of RC frame. As the second stiffness, degraded initial stiffness based on the ratio of steel frame stiffness to RC frame stiffness was used. The yield moment was assumed to be equivalent to the sum of yield strength of the both frames. Stiffness after yielding was assumed to be 2 percent of initial stiffness. .
Figure 12 Division to Line Elements Figure 13 Restoring Force Model of Line Elements
1400
1050
125 85 70 70 70 70 70 70 70 70 70 70 70 70 70 70 85 125
175
175
707
01
451
35
70
701
40
β K0
M
y
Mma
x
K0
Ky
dmax
θ M’y
Mmax
My
’ M’max
d’max
K’u
θ My
Mc

Figure 14 Restoring Force Model for Braces Figure 15 Restoring Force Model for Anchors Adopted model of restoring axial force characteristics for braces is shown in Figure 14, which well represented the characteristics in friction of the damper. The anchor rebar was replaced individually to a line element model with very large flexural stiffness to resist only to the shear force. They were arranged at the divided points shown in Figure 12. Adopted model of restoring shear force characteristics for anchor rebar is shown in Figure 15 Simulated test results Lateral load – lateral displacement relationships by the analysis are compared with the test results in Figures 16, 17. In specimen No.2, analytical results were very similar to the test results. In specimen No.3, the analysts also well simulated the test result, except for the deterioration of the strength during the final large displacement reversal. Displacement histories of the existing frame and the outer new frame by the analysis of specimen No.3 are compared in Figure 18. The phenomenon that the displacement of the new outer frame could not follow that of the existing frame due to the rapid slippage and separation along the connection after the second reversal at –1/100 radian was well simulated in the analysis.
Figure 16 Result of Analysis (Specimen No.2)
D
F
K0 K0
Fy
F
D
F y
F y '
d ma xd ma x '
d y
d y 'K 0 K u
- 600
- 400
- 200
0
200
400
600
- 3 - 2 - 1 0 1 2 3
R(%)
Q(kN)
Analysis
Experiment

Figure 17 Result of Analysis (Specimen No.3)
Figure 18 Displacement Histories of Specimen No.3 Study on the quantity of anchor rebar The demanded number of anchor rebar in the beam to obtain desirable performance was analyzed in case of no anchor rebar in the columns. Displacement histories of the existing and the new outer frames in cases of 7, 11, 15, and 17 anchor rebar in the beam are shown in Figure 19. In all cases, anchor rebar were arranged at even intervals. The performance by the strengthening became better with increased number of anchor rebar. In case of 7 anchor rebar, no difference between the displacements of both frames occurred up to ± 2 percent of drift angle. In case of 14 to 17 anchor rebar in the beam, the demanded numbers of anchor rebar in the column to demonstrate a good performance up to ± 2 percent of drift angle are listed in Table 6. The demanded number of anchor rebar in the column significantly increased provided that the number in the beam slightly reduced from the demanded number in case of no anchor rebar in the column. It is concluded that arrangement of sufficient quantity of anchor rebar in the beam is effective to realize desirable performance of strengthened structure.
- 600
- 400
- 200
0
200
400
600
- 2 - 1 0 1 2
R(%)
Q(kN)
Analysis
Experiment
- 2
- 1
0
1
2
R(%)
Existing Frame
New Outer Frame

Figure 19 Displacement Histories under Different Anchor Quantity
Table 6 The Demanded Anchor Quantity in Column
Study on arrangement of anchor rebar It is expected that the shear strength of the connection change under different arrangement of anchor rebar in the beam even though the same quantity are arranged. Three cases of arrangement with 15 anchor rebar in the beam were analyzed; i.e., arrangement at even intervals, concentrating around the center of the beam, and concentrating around the both ends of the beam. Analyzed load – displacement relationships are shown in Figure 20. Good performance was clearly demonstrated in case of concentrating around the center of the beam where the shear force from the braces were carried to the beam.
Figure 20 Effect of Anchor Arrangement
-2
-1
0
1
2
Existing Frame 7Anchors 11Anchors 15Anchors 17Anchors
Cycle
R(%
)
Beam 17 16 15 14Column 0 1 3 16
-2 -1 0 1 2-600
-400
-200
0
200
400
600
Even Intervals Concentrated in Center Concentrated in End
R(%)
Q (
kN)

CONCLUSIONS From the test of strengthening existing RC frame by a new outer frame, the following main findings were obtained. It was possible to increase the strength or ductility of the strengthened frame without excessive quantity of post-installed anchor rebar to connect both frames provided that the quantity was determined based on the shear transfer along the connection. The eccentricity of the new outer frame for the existing frame should be considered to determine the quantity of the anchor rebar. Supposing the incomplete composition between the new RC frame and the inner steel frame was safe side to estimate the quantity of anchor rebar. From the inelastic frame analysis based on the test results, the following conclusions were obtained. It was possible to simulate the inelastic behavior of the strengthened frame by the proposed analysis in the paper. In order to realize good performance of strengthened frame, it was important for sufficient quantity of anchor rebar to be arranged in the beam. Concentrating arrangement of anchor rebar in the area to be transferred high shear stress was significantly effective for the strengthening.
REFERENCES 1. The Japan Building Disaster Prevention Association “Seismic Improvement Design Guidelines for
Existing Reinforced Concrete Buildings” 2001 (in Japanese). 2. Mattock AH, Hawkins NM. “Shear transfer in Reinforced Concrete Recent research” PCI Journal ,
March-April, 1972. 3. Architectural Institute of Japan “AIJ Standard for Structural Calculation of Reinforced Concrete
Structures” 1999 (in Japanese). 4. Architectural Institute of Japan “Data for Ultimate Strength Design of Reinforced Concrete
Structures” 1987 (in Japanese).