Strength and Reliability of Bolted Connections Susceptible ...
106
University of Tennessee, Knoxville University of Tennessee, Knoxville TRACE: Tennessee Research and Creative TRACE: Tennessee Research and Creative Exchange Exchange Masters Theses Graduate School 5-2020 Strength and Reliability of Bolted Connections Susceptible to Strength and Reliability of Bolted Connections Susceptible to Tearout Tearout Nicolo Franceschetti University of Tennessee, [email protected] Follow this and additional works at: https://trace.tennessee.edu/utk_gradthes Recommended Citation Recommended Citation Franceschetti, Nicolo, "Strength and Reliability of Bolted Connections Susceptible to Tearout. " Master's Thesis, University of Tennessee, 2020. https://trace.tennessee.edu/utk_gradthes/5584 This Thesis is brought to you for free and open access by the Graduate School at TRACE: Tennessee Research and Creative Exchange. It has been accepted for inclusion in Masters Theses by an authorized administrator of TRACE: Tennessee Research and Creative Exchange. For more information, please contact [email protected].
Transcript of Strength and Reliability of Bolted Connections Susceptible ...

University of Tennessee, Knoxville University of Tennessee, Knoxville
TRACE: Tennessee Research and Creative TRACE: Tennessee Research and Creative
Exchange Exchange
Masters Theses Graduate School
5-2020
Strength and Reliability of Bolted Connections Susceptible to Strength and Reliability of Bolted Connections Susceptible to
Tearout Tearout
Nicolo Franceschetti University of Tennessee, [email protected]
Follow this and additional works at: https://trace.tennessee.edu/utk_gradthes
Recommended Citation Recommended Citation Franceschetti, Nicolo, "Strength and Reliability of Bolted Connections Susceptible to Tearout. " Master's Thesis, University of Tennessee, 2020. https://trace.tennessee.edu/utk_gradthes/5584
This Thesis is brought to you for free and open access by the Graduate School at TRACE: Tennessee Research and Creative Exchange. It has been accepted for inclusion in Masters Theses by an authorized administrator of TRACE: Tennessee Research and Creative Exchange. For more information, please contact [email protected].

To the Graduate Council:
I am submitting herewith a thesis written by Nicolo Franceschetti entitled "Strength and
Reliability of Bolted Connections Susceptible to Tearout." I have examined the final electronic
copy of this thesis for form and content and recommend that it be accepted in partial fulfillment
of the requirements for the degree of Master of Science, with a major in Civil Engineering.
Mark Denavit, Major Professor
We have read this thesis and recommend its acceptance:
Nicholas Wierschem, Timothy Truster
Accepted for the Council:
Dixie L. Thompson
Vice Provost and Dean of the Graduate School
(Original signatures are on file with official student records.)

Strength and Reliability of Bolted Connections Susceptible to
Tearout
A Thesis Presented for the
Master of Science
Degree
The University of Tennessee, Knoxville
Nicolo Franceschetti
May 2020

ii
Copyright © 2020 by Nicolo Franceschetti
All rights reserved.

iii
ACKNOWLEDGEMENTS
I would like to express my appreciation to Dr. Mark Denavit, my research advisor,
for presenting me the opportunity to work on such a great project and for providing the
guidance that I needed. He has also made major contributions to this project. My committee
members, Dr. Timothy Truster and Dr. Nicholas Wierschem, have provided resources and
their expertise to move the project forward. I would like to thank Larry Roberts and Andy
Baker for their help in fabricating test specimens, despite their busy schedules, and helping
me solve problems I encountered during the experimental testing. Finally, I would like to
thank Joey Bresson for his assistance during the experimental testing. Funding for this
work was provided by the American Institute of Steel Construction (AISC).

iv
ABSTRACT
The limit state of tearout can complicate the design of steel bolted connections
since, in contrast to the limit states of bearing and bolt shear rupture, tearout strength can
vary from bolt to bolt within a connection. Under the current AISC Specification, tearout
strength is proportional to the clear distance, in the direction of force, between the edge of
the hole and the edge of the adjacent hole or edge of the material. However, recent studies
have suggested that the use of clear distance may not accurately represent tearout strength
and have proposed alternative lengths for use in strength equations. A reevaluation of the
limit state of tearout is presented in this work, including a thorough evaluation of the
proposed alternative tearout lengths using a large database of previously published
experimental work and new experiments with various edge distances and hole types.
Equations with the alternative tearout lengths were found to be more accurate than those
with clear distance, especially for small edge distances. Design recommendations including
the alternative tearout lengths were developed. A reliability study on the existing provisions
and recommended provisions was also completed to ensure the safety of these
recommendations. In addition, an alternative design approach was developed in which the
limit state of tearout is captured implicitly through reduction factors applied to the bearing
and shear rupture strength. The results of this work increase understanding of the limit state
of tearout and offer improved methods of evaluating this limit state in design.

v
TABLE OF CONTENTS
CHAPTER I: INTRODUCTION ........................................................................................ 1
Overview ......................................................................................................................... 1 Theory of Bearing and Tearout ....................................................................................... 2 History of Provisions ...................................................................................................... 6 Current Standards.......................................................................................................... 13
Objective and Scope of Research ................................................................................. 14 Objectives ................................................................................................................. 15 Scope and Outline ..................................................................................................... 15
CHAPTER II: LITERATURE REVIEW ......................................................................... 17 Overview ....................................................................................................................... 17
Creation of Experimental Database .............................................................................. 17 Overview ................................................................................................................... 17
Criteria for Database ................................................................................................. 18 Concentrically Loaded Connections ............................................................................. 20
Overview ................................................................................................................... 20 Additional Criteria .................................................................................................... 20
Database Characteristics ........................................................................................... 22 Eccentrically Loaded Connections ............................................................................... 27
Review of Database Specimens ................................................................................ 28
Review of Single and Double Angle Bolted Connections ........................................ 33 Summary ................................................................................................................... 34
Alternative Tearout Lengths ......................................................................................... 36
CHAPTER III: EVALUATION OF PUBLISHED EXPERIMENTS.............................. 39
Overview ....................................................................................................................... 39 Strength of Single-Bolt Specimens ............................................................................... 39
Strength of Multiple-Bolt Specimens ........................................................................... 45 Effects of Bolt Tightening ............................................................................................ 50 Mixed Failures .............................................................................................................. 51
CHAPTER IV: EXPERIMENTAL TESTS...................................................................... 55 Overview ....................................................................................................................... 55
Test Matrix .................................................................................................................... 55 Materials and Test Setup ............................................................................................... 56 Results ........................................................................................................................... 60 Failure Mechanisms ...................................................................................................... 60 Strength Evaluation ....................................................................................................... 63
Effect of Bolt Tightening .............................................................................................. 65 CHAPTER V: RELIABILITY ANALYSIS ..................................................................... 67
Overview ....................................................................................................................... 67 Methodology ................................................................................................................. 67 Statistical Parameters .................................................................................................... 71 Variable Sensitivity Analysis ........................................................................................ 74 Reliability Analysis and Results ................................................................................... 77

vi
CHAPTER VI: ALTERNATIVE DESIGN APPROACH ............................................... 82
Overview ....................................................................................................................... 82
Derivation of the Approach .......................................................................................... 82 CONCLUSIONS & RECOMMENDATIONS ................................................................. 88 REFERENCES ................................................................................................................. 91 VITA ................................................................................................................................. 96

vii
LIST OF TABLES
Table 1: Specimen Count in the Database ........................................................................ 19 Table 2: Summary of Experimental Data Sources ............................................................ 21 Table 3: Summary of Basic Eccentrically Loaded Bolt Groups ....................................... 31 Table 4: Summary of Single Plate Shear Connections ..................................................... 32 Table 5: Test-to-Predicted Ratio Statistics for Various Evaluations of the Load at 1/4 in.
Deformation for Single-Bolt Specimens (data from 223 specimens, data from 192
specimens meeting minimum edge distance requirements in parentheses) .............. 41 Table 6: Test-to-Predicted Ratio Statistics for Various Evaluations of Ultimate Load for
Single-Bolt Specimens (data from 301 specimens, data from 234 specimens meeting
minimum edge distance requirements in parentheses) ............................................. 41
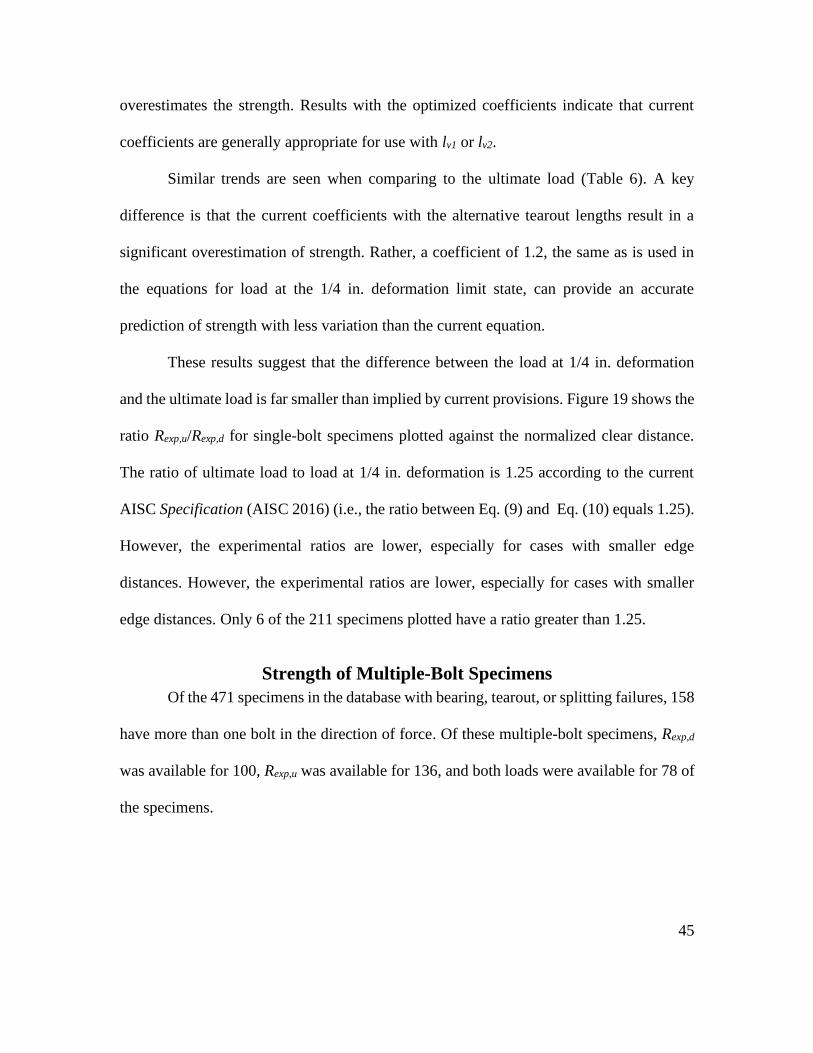
Table 7: Test-to-Predicted Ratio Statistics for Various Evaluations of the Load at 1/4 in.
Deformation for Multiple-Bolt Specimens (data from 100 specimens, data from 62
specimens meeting minimum edge distance and spacing requirements in
parentheses)............................................................................................................... 48
Table 8: Test-to-Predicted Ratio Statistics for Various Evaluations of Ultimate Load for
Multiple-Bolt Specimens (data from 136 specimens, data from 48 specimens
meeting minimum edge distance and spacing requirements in parentheses) ........... 48 Table 9: Mean values of test-to-predicted ratios based on level of tightening ................. 52 Table 10: Analysis of specimens tested by Cai and Driver (2008) that exhibited mixed
failures....................................................................................................................... 54 Table 11: Experimental Testing Summary ....................................................................... 57
Table 12: Mean Test-to-Predicted Ratio at the 1/4 in. Deformation Limit State ............. 64
Table 13: Mean Test-to-Predicted Ratio at the Ultimate Limit State ............................... 64
Table 14: Summary of Statistical Parameters ................................................................... 73 Table 15: Sensitivity of Bolt Diameter and Live-to-Dead Load Ratio on Reliability ...... 76
Table 16: Ratio of tearout strength to bearing strength for edge bolts ............................. 83 Table 17: Ratio of tearout strength to bearing strength for interior bolts ......................... 83

viii
LIST OF FIGURES
Figure 1: Comparison of Bearing and Tearout Mechanisms (Segui 2013) ........................ 3 Figure 2: Load-Deformation Plots of Varying Edge Distances (Wang et al. 2017) ........... 5 Figure 3: Common Failure Modes of Concentrically Loaded Bolted Connections ........... 7 Figure 4: Experimental Data and Lines of Fit for Normalized Edge Distance vs. Bearing
Ratio (Fisher and Struik 1974) .................................................................................. 10
Figure 5: Bearing Strength per 1993 Specification Showing Discontinuity (Carter et al.
1997) ......................................................................................................................... 12 Figure 6: Bolt Tightness.................................................................................................... 23 Figure 7: Failure Modes .................................................................................................... 23 Figure 8: Plate Yield Strength........................................................................................... 24
Figure 9: Plate Ultimate Strength ..................................................................................... 24 Figure 10: Plate Thickness ................................................................................................ 25
Figure 11: Normalized Edge Distance .............................................................................. 25 Figure 12: Bolt Diameter .................................................................................................. 26
Figure 13: Number of Bolts .............................................................................................. 26 Figure 14:Eccentrically Loaded Shear Connection Set-Up (Crawford and Kulak 1971) 29
Figure 15: Tests by Franchuk et al. showing tearout of the bottom bolt and bolt tilting .. 35 Figure 16: Tearout Length Comparison ............................................................................ 37 Figure 17: Normalized Strength Comparisons Between Tearout Lengths for Ultimate
Load .......................................................................................................................... 43 Figure 18: Normalized Strength Comparisons Between Tearout Lengths for Ultimate
Load .......................................................................................................................... 44
Figure 19: Ratio of Ultimate Load and 1/4 in. Deformation versus Normalized Clear
Distance..................................................................................................................... 46 Figure 20: Test-to-Predicted Ratio Excluding Tearout versus Normalized Clear Distance
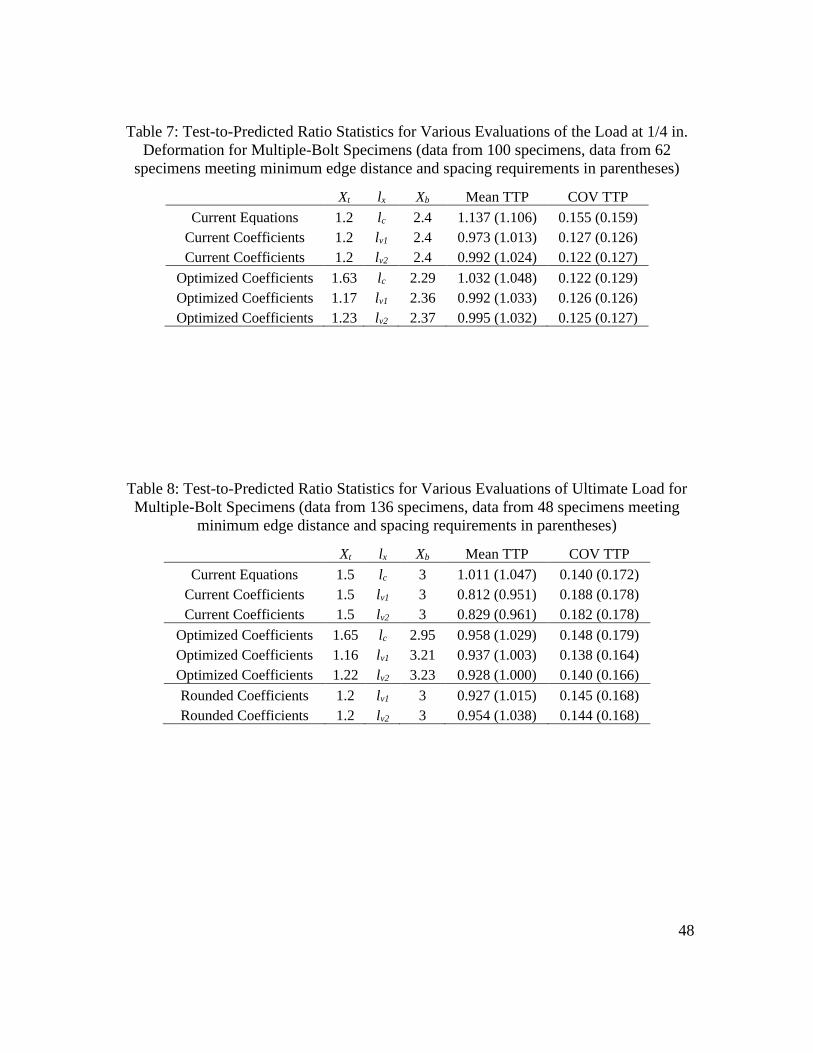
................................................................................................................................... 49 Figure 21: Experimental Test Setup ................................................................................. 59 Figure 22: Load-Deformation Curves for Experimental Tests ......................................... 61
Figure 23: Photograph of specimen OVS2 after testing ................................................... 62 Figure 24: Photograph of specimen OVS3 after testing ................................................... 62
Figure 25: Test-to-Predicted Ratios at Ultimate Limit State with Best Fit Lines ............. 66 Figure 26: Snug-Tightened Specimen versus Untightened and Greased Specimen ......... 66 Figure 27: Reliability at Minimum Edge Distance and Spacing ...................................... 79 Figure 28: Reliability at Typical Edge Distance and Spacing .......................................... 80 Figure 29: Reliability at Maximum Edge Distance and Spacing ...................................... 81
Figure 30: Example Connection for the Alternative Design Method ............................... 85

1
CHAPTER I: INTRODUCTION
Overview
Bolted connections are widely used in steel structures for their constructability and
structural reliability. Several limit states apply to bolted connections, and both the bolts
and connected material must be evaluated. In a bearing-type shear connection, load is
transferred through the fasteners in shear into the connected material in bearing. Based on
theory and experimental testing, provisions and design equations were adopted that could
estimate the strength of a bearing-type connection. Under the current AISC Specification
(AISC 2016), the effective strength of a fastener in a bearing-type bolted steel connection
is equal to the minimum strength computed for the limit states of bolt shear rupture,
bearing, and tearout. By this method, it is possible, for example, to have the strength of a
bolt group controlled by a combination of tearout for the bolts near an edge and bolt shear
rupture for the remaining bolts. The possibility of this interaction of limit states is in
contrast to a common practice where bolt shear rupture is treated as independent from
bearing and tearout (e.g., Salmon et al. 2009). Evaluating the potential interaction of bolt
shear rupture, bearing, and tearout complicates the design of bolt groups, primarily because
the strength of an individual bolt for the limit state of tearout can vary from bolt to bolt
within a group. Given the increased complexity and recently proposed alternative strength
equations (Clements and Teh 2013; Kamtekar 2012), a reevaluation of the limit state of
tearout is warranted to determine if changes can be made that lead to more accurate and
efficient connection designs.

2
Theory of Bearing and Tearout
For bolts sufficiently far from edges of material and adjacent bolts, the strength of
the connected material near the bolt is controlled by bearing. The limit state of bearing is
characterized by plastic deformations of the connected material near the bolt hole and a
long yield plateau in the load-deformation relationship. However, the connected material
eventually ruptures with continued loading. In experimental testing, the peak load has been
noted to occur upon reaching yield, prior to rupture or somewhere in between. However,
once the yield plateau is reached, the variation in load is small.
Bearing strength has been observed to depend on the diameter of the bolt, thickness
of the connected material, and the tensile strength of the connected material. The edge
distance, when large, does not impact bearing strength. A bearing failure can be described
as a function of the plate’s area directly in front of the bolt and its ultimate bearing capacity,
as shown in Eq. (1).
bP dt= (1)
where P is the failure load, d is the diameter of the bolt, t is the thickness of the connected
material, and σ𝑏 is the ultimate bearing stress of the connected material, or the bearing
stress at a desired deformation. In research and practice, σ𝑏 is determined in terms of 𝐹𝑢
(ultimate tensile capacity of the material) multiplied by an empirically derived coefficient.
In this theory, bearing stress is assumed to be uniform over the diameter of the bolt shank.
The primary limit state for connected material with smaller edge distance is tearout.
Tearout is characterized by the rupture of the connected material on either side of the bolt,
depicted in Figure 1. A tearout failure would occur when the two shear planes extending
from the bolt hole to the nearest edge reach their ultimate shear capacity, as described

3
Figure 1: Comparison of Bearing and Tearout Mechanisms (Segui 2013)

4
in Eq. (2).
2 s sP l t= (2)
where P is the failure load, 𝑙𝑠 is the shearing length to the nearest edge (plate edge or bolt
hole), t is the thickness of the connected material, and σ𝑠 is the rupture shear stress of the
connected material. The rupture shear stress is commonly taken as 0.6𝐹𝑢 as was determined
for block shear (Birkemoe and Gilmor 1978). However, other coefficients have been
proposed through testing. The shear length is most often based on edge distance from either
the edge or center of the bolt hole. Other shear lengths have been proposed and will be
evaluated in this project.
Figure 2 demonstrates the load-deformation curves of specimens of varying edge
distance tested by Wang et al. (2017). The second number in the specimen label indicates
the edge distance. SD-10-30 had a nominal edge distance of 1.0 in., whereas SD-25-30 had
a nominal edge distance of 2.5 in. Specimen SD-25-30 was the only bearing-controlled
specimen per the Specification (AISC 2016). The failed specimens all show a tearout shear
rupture of the connected material. However, the bearing-controlled specimen had much
larger deformations. The figure depicts the decrease in capacity as the edge distance is
reduced.
A similar failure mode is splitting, which involves a tensile fracture initiating at the
end of the connected material. The limit state of splitting is distinct from the limit state of
tearout. Equations have been proposed to predict splitting strength (Duerr 2006) and some
standards treat tearout and splitting separately (e.g., ASME 2017). However, splitting is
not recognized within the AISC Specification (AISC 2016). Therefore, equations for the

5
Figure 2: Load-Deformation Plots of Varying Edge Distances (Wang et al. 2017)

6
limit state of tearout are implicitly covering splitting as well. This approach is justified
since experimental results have shown the two limit states to have similar strengths.
Specimens tested by Cai and Driver (2008) show deformations and/or fracturing along the
shear planes. Based on this evidence, Cai and Driver reasoned that shear planes develop
their full capacity despite the presence of the splitting failure. A summary of failure modes
in concentrically loaded bolted connections is provided in Figure 3. Some experiments
have also shown modes of failure for bolted connections that include out-of-plane curling
of unconfined plates.
Another important characterization of bolted connections is loading location.
Concentrically loaded connections refer to connections loaded in line with the centroid of
the bolt group. Connections where loading is not applied in line with the centroid of the
bolt group are described as eccentrically loaded. Some eccentricity is present in most shear
connections, such as single plate and angle connections. Eccentricity in the loading can
cause additional forces on the bolts and connected material. Several methods to account
for eccentricity exist, although the application of these methods to bearing and tearout have
not been extensively studied (Man et al. 2006).
History of Provisions
This section will provide a history of bearing and tearout as they relate to the AISC
Specification. The changes to the provisions in the Specification over time are a key
motivation of this research. Bearing of fasteners has been a consideration in the AISC
Specifications since the first edition published in 1923 (AISC 1923). However, tearout was
not considered beyond the minimum edge distance requirements for construction tolerance.

7
Figure 3: Common Failure Modes of Concentrically Loaded Bolted Connections

8
The appendix of the 1936 Specification (AISC 1936) describes a series of tension testing
of riveted connections that revealed a tearout failure in the thinnest plate. The Specification
reflected this finding by including a provision that the edge distance and/or spacing of a
rivet be greater than the shearing area of the rivet divided by the plate thickness. This is
significantly different from the modern tearout limit state because it is a function of
geometry rather than stresses. The 1936 Specification made an exception for the case of
more than three rivets in the line of stress. The appendix justifies this as the following:
“Had the specimens contained several rivets in line, this [tearout] should not have occurred,
as the yielding of the end of the bar would no doubt have thrown more load back onto the
interior rivets.” The idea that tearout of the edge bolt can be precluded in the case of
multiple bolts is revisited in later Specifications.
The creation of the Research Council on Riveted and Bolted Connections in 1947
led to several research projects regarding bolted connections. One outcome was an increase
in the allowable bearing stress in the 1961 Specification (AISC 1961). The research
completed by the Research Council was compiled in the Guide to Design Criteria for
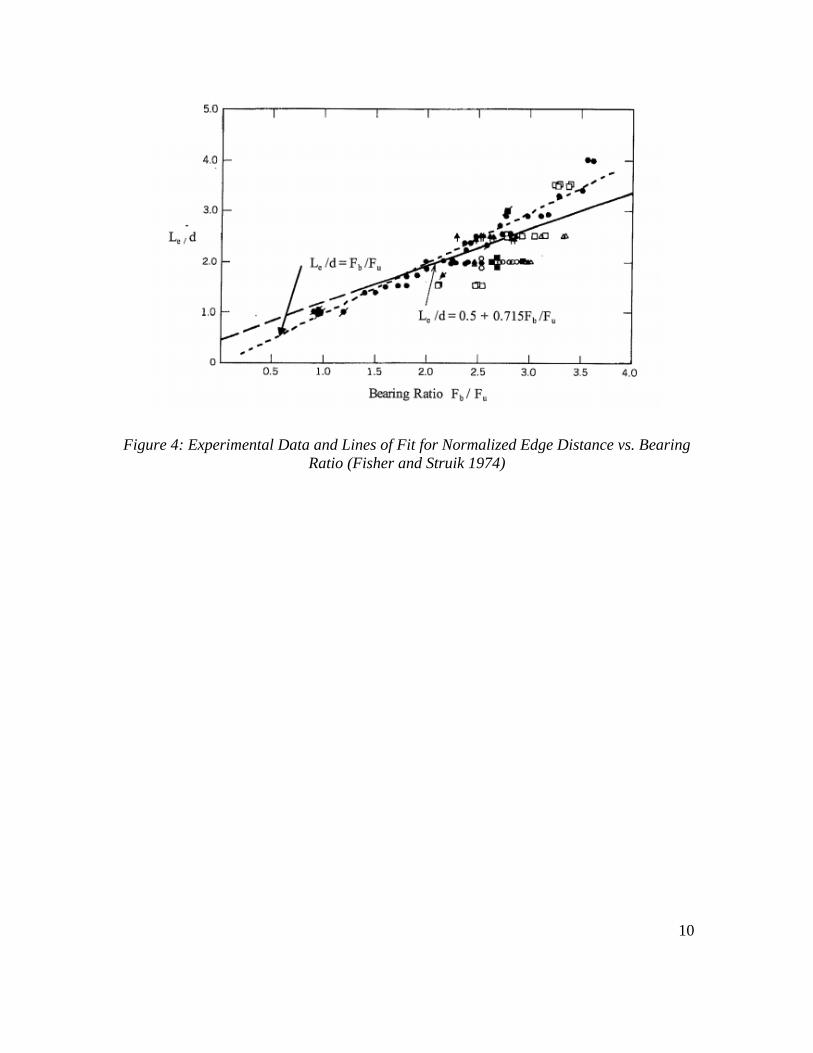
Bolted and Riveted Joints (Fisher and Struik 1974). Along with introducing LRFD design
to bolted connections, tearout was reassessed using data gathered from many tests that had
been completed. Two equations were suggested in the Guide, which were plotted as shown
in Figure 4. The solid line is equivalent to Eq. (3), which is derived from the theory
presented in Eq. (2).
(2 ) (0.7 )2
e u
dP t L F
= −
(3)

9
where P is the failure load, t is the thickness of the connected material, 𝐿𝑒 is the edge
distance from the center of the bolt, 𝐹𝑢 is the ultimate tensile strength of the connected
material, and d is the diameter of the bolt. The dashed line was a simpler equation that was
found to fit the data well. This equation was included in the AISC Specification (1978),
rearranged in terms of load as shown in Eq. (4).
e uP L tF= (4)
This was the first provision that considered the reduction of allowable stress at smaller
edge distances. The exception of the edge distance check for multiple bolts in a line that
existed since 1936 was removed with the justification that “critical bearing stress is
significantly affected by reduction of the edge distance, even with three fasteners in line”
(AISC 1978).
Frank and Yura (1981) identified that a connection with a bolt hole deformation of
0.25 in. has likely achieved much of the maximum capacity, and further loading may limit
the effectiveness of the connections due to increasing deformation. Through experimental
data, they determined a stress that would limit the deformation to 0.25 in., shown in Eq.
(5).
2.4b uF = (5)
Frank and Yura’s findings were directly incorporated in the 1986 Specification (AISC
1986). An additional condition was added to the provisions for the case where 1/4 in.
deformation is tolerable, or as the Specification notes, “deformation around the bolt hole is
not a design consideration.” This condition allowed an additional 25% higher capacity
using a multiplier of 3.0 rather than 2.4. New criteria were added in which the tearout
10
Figure 4: Experimental Data and Lines of Fit for Normalized Edge Distance vs. Bearing
Ratio (Fisher and Struik 1974)

11
provision, Eq. (4), was not required to be checked if there were two or more bolts in a line,
a minimum edge distance of 1.5d was provided, a minimum spacing of 3d was provided,
and deformation at the bolt hole was a design consideration. These criteria were a return to
previous Specifications that allowed an exception if several bolts were in the line of force.
The exceptions were justified on the premise of load redistribution to the interior fasteners
or that sufficient interior bolts in a connection would diminish the effects of reduced edge
bolt hole strength if certain minimum edge distance and bolt spacing were provided.
There were no changes to the bearing and tearout provisions until the 1999
Specification (AISC 1999). According to Carter et al. (1997) there was a desire in the early
1990s to use clear distances to accommodate long-slotted and oversize holes without
modification factors. Additionally, the existing provisions (AISC 1993) resulted in a
discontinuity at an edge distance of 1.5d, when the bearing strength begins controlling over
tearout. This is shown in Figure 5. To achieve the desired changes, a reformulation of Eq.
(3) from the Guide (1974), which uses clear distance, was recommended in the 1994 RCSC
Specification (Research Council on Structural Connections 1994). The experimental tests
performed by Kim and Yura (1999) and Lewis and Zwerneman (1996) verified the
accuracy of the new equation and concluded that the discontinuity in the 1993 Specification
resulted in overestimations of the strength. Afterwards, the 1999 Specification (AISC 1999)
adopted the RCSC provisions, as shown in Eq. (6) for the case where deformation is a
design consideration.
1.2 2.4n c u uR l tF dtF= (6)
The equation was modified to have imply a shear strength of 0.6Fu rather than 0.7Fu used

12
Figure 5: Bearing Strength per 1993 Specification Showing Discontinuity (Carter et al.
1997)
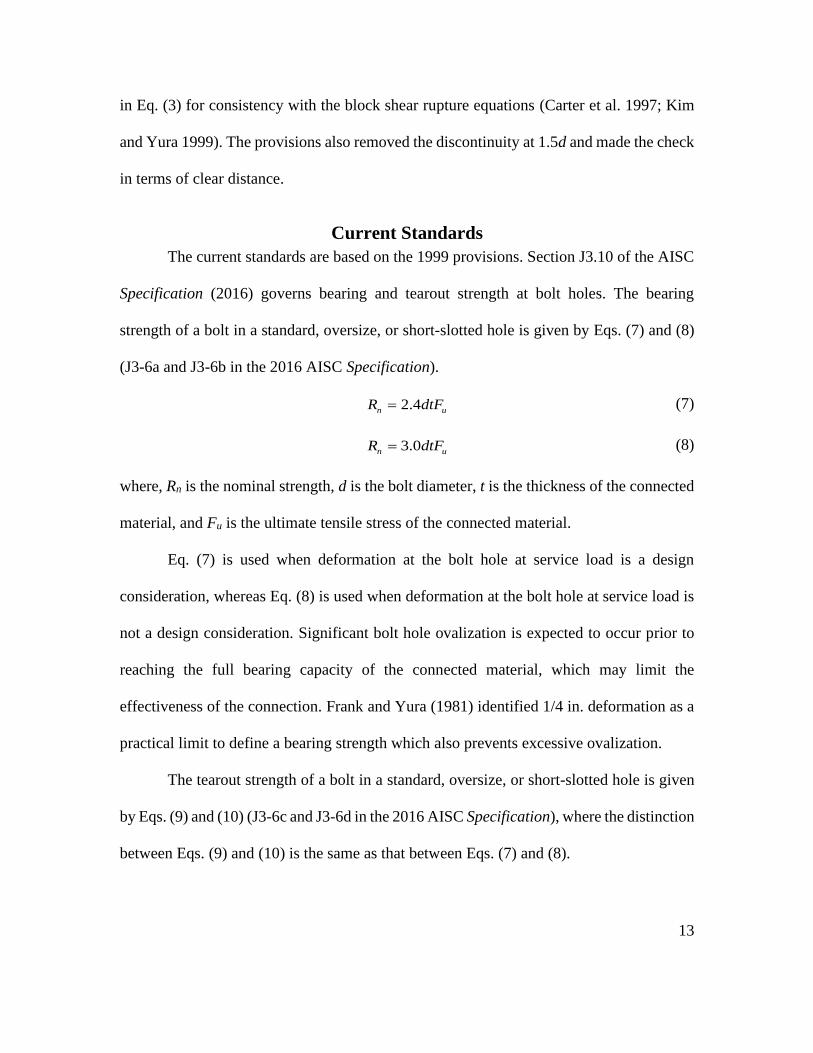
13
in Eq. (3) for consistency with the block shear rupture equations (Carter et al. 1997; Kim
and Yura 1999). The provisions also removed the discontinuity at 1.5d and made the check
in terms of clear distance.
Current Standards
The current standards are based on the 1999 provisions. Section J3.10 of the AISC
Specification (2016) governs bearing and tearout strength at bolt holes. The bearing
strength of a bolt in a standard, oversize, or short-slotted hole is given by Eqs. (7) and (8)
(J3-6a and J3-6b in the 2016 AISC Specification).
2.4n uR dtF= (7)
3.0n uR dtF= (8)
where, Rn is the nominal strength, d is the bolt diameter, t is the thickness of the connected
material, and Fu is the ultimate tensile stress of the connected material.
Eq. (7) is used when deformation at the bolt hole at service load is a design
consideration, whereas Eq. (8) is used when deformation at the bolt hole at service load is
not a design consideration. Significant bolt hole ovalization is expected to occur prior to
reaching the full bearing capacity of the connected material, which may limit the
effectiveness of the connection. Frank and Yura (1981) identified 1/4 in. deformation as a
practical limit to define a bearing strength which also prevents excessive ovalization.
The tearout strength of a bolt in a standard, oversize, or short-slotted hole is given
by Eqs. (9) and (10) (J3-6c and J3-6d in the 2016 AISC Specification), where the distinction
between Eqs. (9) and (10) is the same as that between Eqs. (7) and (8).

14
1.2n c uR l tF= (9)
1.5n c uR l tF= (10)
where, lc is the clear distance, in the direction of force, between the edge of the hole and
the edge of the adjacent hole or edge of the material.
With the revisions over time, there has come increasing recognition of potential for
interaction between bolt shear rupture, bearing, and tearout in bolt groups. User notes and
commentary have been included since the 2010 AISC Specification (AISC 2010) to
indicate that the effective strength of a bearing-type fastener is equal to the minimum
strength computed for the limit states of bolt shear rupture, bearing, and tearout. The
strength of a bolt group is computed from the strength of the individual fasteners. Except
for special cases, neither bolt shear rupture strength nor bearing strength will vary among
the individual bolts in a group. Tearout will typically vary between the edge bolt and the
interior bolts. The calculation is further complicated in eccentrically loaded connections
where the direction of loading for individual bolts, and consequently clear distance, is
difficult to determine.
Objective and Scope of Research
The purpose of this research is to further study the behavior and design methods of
steel bolted connections subject to the limit states of bearing and tearout. The focus of the
research is to gather and analyze experimental testing results in order to evaluate
improvements that could increase accuracy or simplify the design method while
maintaining reliability and safety.
15
Objectives
The specific objectives of the research are outlined below:
• Create a database of previous experimental tests, including eccentrically loaded
connections, with an emphasis on bearing and tearout limit states
• Evaluate the accuracy of the current and alternative equations that include
different tearout shear lengths and/or coefficients through the analysis of
concentrically loaded experimental testing
• Perform experimental testing to fill gaps in the existing research, particularly
the use of different hole types
• Evaluate the reliability of current and alternative equations
• Consider simplifications to the design procedure, including alternative design
methods
• Develop recommendations for design based on the results
Scope and Outline
To achieve the above objectives, the scope of the project was developed in five
stages, which form the five subsequent chapters of this thesis. Chapter II discusses the
experimental database that was created in order to evaluate general trends in experimental
testing and as a source of data for analysis. Also included in Chapter II is a detailed
literature review of eccentrically loaded connections with a focus on the limit states of
bearing and tearout. Chapter III consists of analyses of existing experimental data. The
accuracy of current and alternative equations was assessed using statistical analysis of the
test-to-predicted ratios, among other considerations. Chapter IV details the experimental
testing of single-bolt concentrically loaded connections that investigate differing hole types

16
and verify the results found in the previous analyses. Chapter V includes a reliability study
using Monte Carlo simulations to evaluate the safety level of the current and alternative
design equations. Finally, Chapter VI introduces an alternative design approach that
simplifies the design procedure through reduction factors on bearing and bolt shear rupture
such that the tearout check can be precluded.

17
CHAPTER II: LITERATURE REVIEW
Overview
Due to the quantity of literature considered, the literature review was categorized
in three parts. The first was a creation and evaluation of a database containing tests gathered
from published research. The database was then used to perform analyses in later chapters
of this thesis. The second part of the literature review encompassed a more qualitative
review of some tests of interest. In particular, the eccentrically loaded connections and
shear connections, that had many variations that could not be adequately described in a
database. The third part of the literature review compares proposed alternative tearout shear
lengths.
Creation of Experimental Database
Overview
A database of experiments on steel bolted connections was developed as part of the
literature review. Published papers and reports with relevant physical testing identified in
the literature were collected, read, and categorized. Due to differing fields between test
types, four datasets were created:
1) concentrically loaded lap splice connections in tension
2) concentrically loaded butt splice connections in tension
3) eccentrically loaded bolt groups
4) single plate bolted shear connections
Since the objectives of the research were focused on the bearing and tearout limit
states, papers and reports with these failure modes were investigated if possible. However,
other failures were present in the reviewed studies, mainly in the eccentrically loaded bolt
18
groups and single plate bolted shear connections. The number of specimens in each dataset
is shown in Table 1.
Criteria for Database
To be included in the database, each specimen must 1) have obtained bearing,
tearout, bolt shear rupture, or other failure strength in a physical experiment; 2) be
described in a published work (preferably a peer-reviewed journal publication); and 3) be
capable of being accurately described by the fields in the database. Other types of tests that
were outside the scope of this project included:
• Other connections types (e.g., welded connections and moment connections)
• Connections with stainless steel, thin gage cold-formed steel, or composite
materials
• Connections tested at elevated temperatures
Some specimens which had conflicting data reporting of important values were also
not included. Since the analyses of the concentrically loaded connection datasets was more
rigorous and included calculating predicted strengths, these connections were subject to
additional criteria, which are described in the next section.
Data entered for each specimen included general information, such as author of the
reference and specimen name; qualitative data, such as the bolt tightness and observed
failure mode; and quantitative data, such as plate thickness and material strengths. Data
was entered in original units to facilitate validation. A MATLAB script was used to read
the data and convert all values to consistent units and to prepare the data for analysis
performed in later chapters.

19
Table 1: Specimen Count in the Database
Database
Category
Number of
Specimen
Number of
Studies
Concentrically Loaded Lap Splice
Connections
197 6
Concentrically Loaded Butt Splice
Connections
702 14
Basic Eccentrically Loaded Bolt Groups 43 4
Single Plate Bolted Shear Connections 42 7
Total 984 31

20
Concentrically Loaded Connections
Overview
The purpose of the concentrically loaded connection database was to provide a
source of data to complete the analyses and to reveal any gaps in existing testing. Due to
their relative simplicity, numerous concentrically loaded connections have been tested as
compared to eccentrically loaded connections. Concentrically loaded specimens made up
92% of the reviewed tests. 20 of the 31 of the reviewed works contained concentrically
loaded connections (899 specimens). The tests completed as part of this thesis (described
in Chapter IV) were considered as well. The concentrically loaded connections were
subdivided into lap splices and butt splices. A lap splice refers to a connection in which
two plates are fastened with one or more bolts that are subject to a single shear plane. A
butt splice refers to a connection containing two exterior plates and one interior plate
fastened with one or more bolts that are subject to two shear planes. These differences
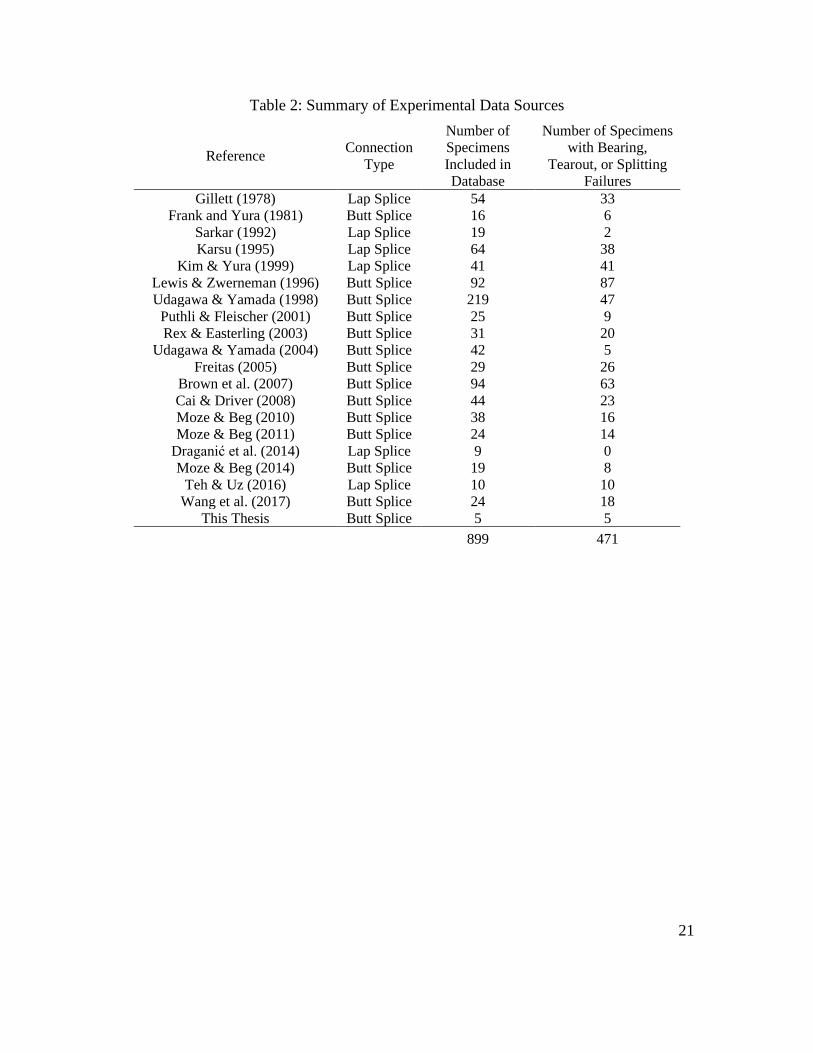
justified the use of separate datasets to organize the information. Table 2 provides a
summary of the experimental data sources.
Additional Criteria
To be included in the concentrically loaded database, either the ultimate load, Rexp,u,
or load at 1/4 in. deformation, Rexp,d, must have been recorded. For specimens where Rexp,d
was not specifically reported, but a plot of the load-deformation response of the connection
was provided, the load at 1/4 in. deformation was interpolated from the plot. If the specimen
reached its peak load prior to attaining 1/4 in. deformation, Rexp,d was set equal to the
ultimate load. Accordingly, Rexp,d should be interpreted as a failure load at which peak
strength is attained or the connection experiences 1/4 in. deformation, whichever occurs
21
Table 2: Summary of Experimental Data Sources
Reference Connection
Type
Number of
Specimens
Included in
Database
Number of Specimens
with Bearing,
Tearout, or Splitting
Failures
Gillett (1978) Lap Splice 54 33
Frank and Yura (1981) Butt Splice 16 6
Sarkar (1992) Lap Splice 19 2
Karsu (1995) Lap Splice 64 38
Kim & Yura (1999) Lap Splice 41 41
Lewis & Zwerneman (1996) Butt Splice 92 87
Udagawa & Yamada (1998) Butt Splice 219 47
Puthli & Fleischer (2001) Butt Splice 25 9
Rex & Easterling (2003) Butt Splice 31 20
Udagawa & Yamada (2004) Butt Splice 42 5
Freitas (2005) Butt Splice 29 26
Brown et al. (2007) Butt Splice 94 63
Cai & Driver (2008) Butt Splice 44 23
Moze & Beg (2010) Butt Splice 38 16
Moze & Beg (2011) Butt Splice 24 14
Draganić et al. (2014) Lap Splice 9 0
Moze & Beg (2014) Butt Splice 19 8
Teh & Uz (2016) Lap Splice 10 10
Wang et al. (2017) Butt Splice 24 18
This Thesis Butt Splice 5 5
899 471

22
first. Additionally, material testing must have been conducted to determine the tensile
strength, Fu, of the connected material in which failure occurred. Only specimens with
standard holes were included in the database to provide consistency. A few specimens with
slotted holes were identified and were evaluated separately.
Database Characteristics
In order to characterize the general trends in the tests, the variables of the datasets
were plotted on histograms shown in Figure 6 to Figure 13. The most commonly tested
materials were A36 and SS400 steel, explaining the distribution of yield and ultimate
strengths in Figure 8 and Figure 9. However, various types of higher strength steels were
prominent, including A572 Gr. 50, HQ590, and HQ780. Figure 10 shows that plate
thickness was concentrated around 0.4 in. to 0.5 in. This discontinuity in plate thickness is
mostly due to 219 specimens with 12 mm (0.472 in.) plates tested by Udagawa and Yamada
(1998). The large majority of the specimens contained one or two bolts. Tested bolt
diameters ranged from 5/8 in. to 1 in.
About half the specimens (485) did not have a valid bolt tightness as described in
the AISC Specification (2016), which requires that bolts be at least snug-tightened. Kim
& Yura (1999) justified the use of loose plates in order to achieve a lower-bound strength
of the connection that does not include frictional forces. While performing tests on loose
connections isolates the contribution of bearing and provides a lower bound for strength,
it is potentially overly conservative to base provisions on these results. The possible
effects of bolt tightening on the capacity of the connection will be described further in
Chapter III and Chapter IV.

23
Figure 6: Bolt Tightness
Figure 7: Failure Modes

24
Figure 8: Plate Yield Strength
Figure 9: Plate Ultimate Strength

25
Figure 10: Plate Thickness
Figure 11: Normalized Edge Distance

26
Figure 12: Bolt Diameter
Figure 13: Number of Bolts

27
The figures demonstrate that a wide variety of conditions were tested in existing
research. However, only 471 of the 899 concentrically loaded specimens failed in bearing,
tearout, or the related splitting type failure. This limited the database size for analysis of
these limit states.
Eccentrically Loaded Connections
A literature review was also performed for eccentrically loaded connections. The
purpose of the eccentrically loaded connections database was to have a qualitative
representation of the existing literature for investigation and future research. Eccentrically
loaded connections increase the complexity of the tearout limit state because the direction
and magnitude of the bolt force will vary between bolts. The Instantaneous Center of
Rotation method offers a solution but is applied only for the bolt shear limit state in the
current AISC Specification (AISC 2016).
Several experimental testing methods exist for eccentrically loaded connections.
The most direct method involves loading a bolted cantilevered plate at a certain distance
from the support. The plate is directly subject to an eccentricity and rotation that must be
accommodated by deformation of the bolt holes, bolts and plate. A more common
procedure is to apply a load to a beam fastened to two columns with a plate or angle. A
pinned column base and short beam is used such as to induce a rotation at the column base.
The reaction force on the column is at a certain distance, or eccentricity, from the centroid
of the bolt group. An example of this type of test is shown in Figure 14. Finally, the effects
of eccentricity can also be tested in shear connections often used in structures. In which
case, a longer span beam is loaded to induce a deflection of the beam and rotation at the

28
connection. Although these tests are larger, they can simulate a common structural element.
All these test methods can be completed with various connections elements. The most
commonly used are single plates bolted to the beam and welded to the supporting member,
and all-bolted single or double angles.
Review of Database Specimens
Two datasets were created to organize the information. The first dataset is
comprised of single plate bolted shear connections. The other dataset consists of the basic
eccentrically loaded bolted groups which do not include single plate shear connections (i.e.,
using the first two methods described in the previous section). Specimens were required to
meet the criteria for the database as described earlier. Additionally, in order to maintain
comparison between reviewed specimens, the following were not included in the database:
• Single plate shear connections that included stiffeners, slabs, or tabs
• Specimens subject to other loading such as compression
Other shear connections, such as single and double angle, were reviewed as well
but not compiled in a database. Due to the variation of tests for eccentrically loaded
connections, the literature was reviewed for testing procedures, connection design,
proposed analysis methods, and failure information that was relevant to the scope of this
project.
A brief summary of the tests included in the database are provided in this section.
The basic eccentrically loaded bolt groups do not rely on the beam stiffness to achieve
rotation and constitute a simplified approach to studying the effects of eccentricity.
Crawford & Kulak’s (1971) method used in the AISC Specification, which is based on

29
Figure 14:Eccentrically Loaded Shear Connection Set-Up (Crawford and Kulak 1971)
30
bolt shear strength. Wing and Harris (1983) and Badawi (1983) investigated bearing
failures in eccentrically loaded connections. In both studies, a thinner plate was used
compared to the other reviewed works. Both papers considered failure as a 0.3 in.
deformation of the furthest bolt from the centroid, and the failure was noted to be bearing,
indicating that can be a bearing is a limiting factor in eccentrically loaded connections.
Although the edge distance value was not given, the connections were described as
standard. It is likely that the edge distance sufficed to preclude tearout failure. Research by
Nissen (2014) used several bolt lines and rows, resulting in block shearing and large
deformations. The studies are summarized in Table 3. Studies on shear connections can
provide a more practical investigation of the limit states.
A summary of experimental testing conducted on single plate shear connections is
presented in Table 4. The table shows that the frequency of bearing and tearout in existing
single plate shear connection research is limited. Although bearing deformations were
noticed in several of the tests, only one test by Sherman and Ghorbanpoor (2002) was
described as a bearing failure. Tearout was not a failure in any of the single plate shear
connection tests investigated. The data suggests that tearout was precluded with use of
center-to-edge distances of 2d and/or stronger plate material. The specimens with smaller
edge distances had a plate thickness of at least 3/8 in. No testing in these datasets used a
plate thinner than 3/8 in. in combination with shorter edge distances, which would be more
predisposed to a bearing or tearout failure. The only tests that tested the minimum edge
distance were in Baldwin Metzger’s research. However, the horizontal distance was set at
2d.

31
Table 3: Summary of Basic Eccentrically Loaded Bolt Groups
Author Year # of
Tests
Testing
Details
Thinnest
Material
Eccentric. Smallest
Edge Dist.
Failure
Modes
Crawford
& Kulak
(1971) 8 Double
Angles
0.50"
A36
8" - 15" Not Given Bolt
Shear
Badawi (1983) 12 Double
Angles
0.305"
Gr.50
3.5" - 11.8" Not Given Bearing
Wing &
Harris
(1983) 12 Double
Angles
0.287"
Gr.50
2.5" - 6.5" Not Given Bearing
Nissen (2014) 11 Cantilevered
Single Plate
0.394"
S325
8" - 15.75" 2.66d
(horiz.)
Block
Shear
Note:
1. Bolts in Nissen 2014 are M12 Gr. 10.9. All other tests used 3/4" diameter A325

32
Table 4: Summary of Single Plate Shear Connections
Author Year # of
Tests
Testing
Details
Thinnest
Material
Eccentric. Smallest
Edge Dist.
Failure
Modes
Astaneh-Asl
et al.
(1988) 5 Cantilever
Beam
0.375"
A36
2.75" 1.5d Bolt Shear
Porter &
Astaneh-Asl
(1990) 4 Cantilever
Beam
0.375"
A36
3.125" 1.5d Bolt Shear
Sherman &
Ghorbanpoor
(2002) 8 Simply
Supported
0.371"
A36
6.3" - 10" 2d Other3,
Bearing
Creech (2005) 8 Simply
Supported
0.375"
A36
3" 2d Bolt Shear
Beam
Failure
Baldwin
Metzger
(2006) 8 Simply
Supported
0.39"
Gr.50
3" - 10.5" 1.33d
(vert.)
2d (horiz.)
Beam
Failure,
Bolt Shear
Marosi (2011) 6 Cantilever
Beam
0.247"
Gr.50
2" - 4" 2d Other3
Hertz (2014) 3 Cantilever
Beam
0.37"
Gr.50
6" - 8" 2d Other3
Notes:
1. Bolt holes are short-slotted in Porter & Astaneh-Asl (1990) and Sherman & Ghorbanpoor
(2002)
2. Bolts in Marosi (2011) and Hertz (2014) range from 3/4” to 1” and 3/4” to 7/8” diameter.
A325, respectively. All other tests used 3/4" diameter A325
3. Other failures may include plate twisting, column failure, plate buckling, plate shear
rupture, plate flexure, and weld fracture

33
Other failure modes, particularly plate failures, were more common with extended
configurations in which the eccentricity to the center of the bolt group was greater than 3
in. This includes the extended configurations tested by Sherman & Ghorbanpoor (2002),
Hertz (2014), and several of Marosi’s (2011) specimens. Beam failures were also observed
in some tests, due to insufficient lateral bracing and attempting to achieve target rotations
of 0.03 radians. Single plate shear connections are planned for the second stage of this
research project. Nevertheless, literature on other connection types (single and double
angles) was also reviewed since the limit state of bearing and tearout has been more
thoroughly researched in these connections.
Review of Single and Double Angle Bolted Connections
Birkemoe and Gilmor (1978) completed tests on a coped and uncoped double angle
connection which demonstrated horizontal splitting type failures of the beam edge and
large deformations. The beam was a W18x45 of grade 44W (44 ksi nominal yield stress)
with a measured web thickness of 0.305 in. The edge distance from the center of bolt to
edge of the beam web was 1-3/4 in. or 2.33d. Comparing to the single plate shear
connections in Table 4, the failing material was thinner but the edge distance was higher
than most specimens. The test is most comparable to the ones completed by Badawi (1983)
and Wing and Harris (1983), which failed with bearing deformation. The use of double
angles may help preclude other failure modes of the plate and beam web, and isolate the
failure to bearing, tearout, and bolt shear rupture.
Franchuk et al. (2002) investigated five single angle bolted connections with slotted
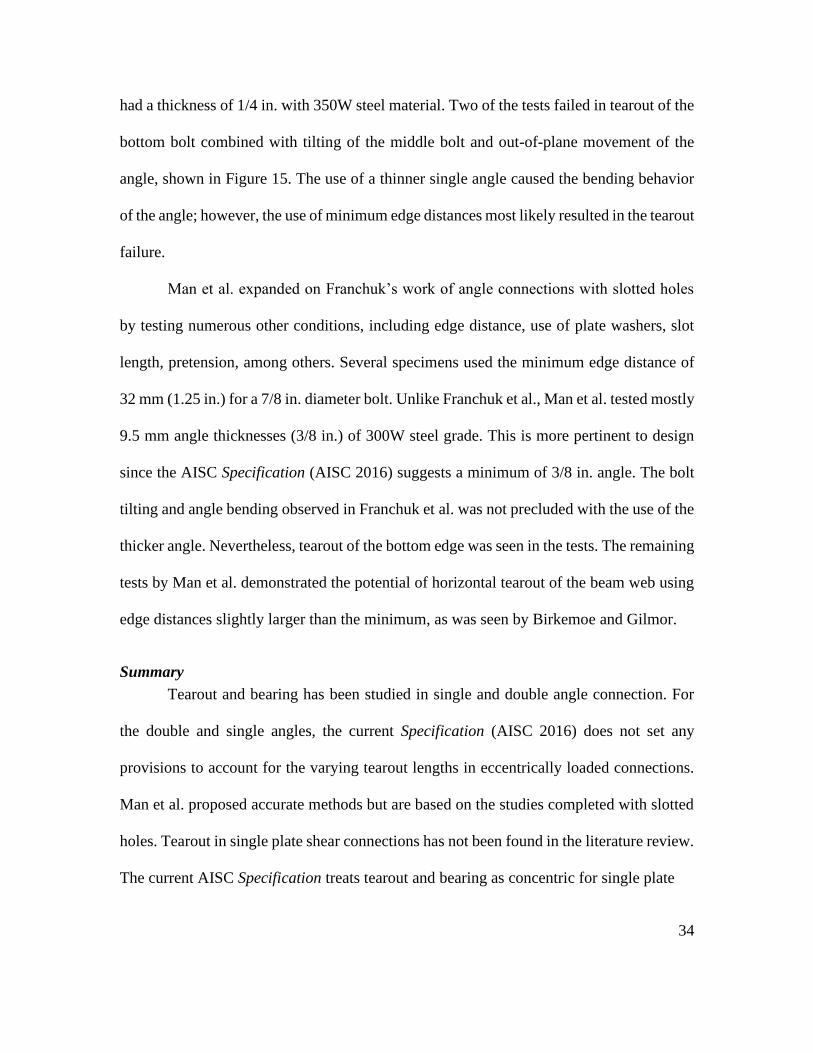
holes and minimum edge distances for 1 in. and ¾ in. diameter bolts. The failing angles
34
had a thickness of 1/4 in. with 350W steel material. Two of the tests failed in tearout of the
bottom bolt combined with tilting of the middle bolt and out-of-plane movement of the
angle, shown in Figure 15. The use of a thinner single angle caused the bending behavior
of the angle; however, the use of minimum edge distances most likely resulted in the tearout
failure.
Man et al. expanded on Franchuk’s work of angle connections with slotted holes
by testing numerous other conditions, including edge distance, use of plate washers, slot
length, pretension, among others. Several specimens used the minimum edge distance of
32 mm (1.25 in.) for a 7/8 in. diameter bolt. Unlike Franchuk et al., Man et al. tested mostly
9.5 mm angle thicknesses (3/8 in.) of 300W steel grade. This is more pertinent to design
since the AISC Specification (AISC 2016) suggests a minimum of 3/8 in. angle. The bolt
tilting and angle bending observed in Franchuk et al. was not precluded with the use of the
thicker angle. Nevertheless, tearout of the bottom edge was seen in the tests. The remaining
tests by Man et al. demonstrated the potential of horizontal tearout of the beam web using
edge distances slightly larger than the minimum, as was seen by Birkemoe and Gilmor.
Summary
Tearout and bearing has been studied in single and double angle connection. For
the double and single angles, the current Specification (AISC 2016) does not set any
provisions to account for the varying tearout lengths in eccentrically loaded connections.
Man et al. proposed accurate methods but are based on the studies completed with slotted
holes. Tearout in single plate shear connections has not been found in the literature review.
The current AISC Specification treats tearout and bearing as concentric for single plate
35
Figure 15: Tests by Franchuk et al. showing tearout of the bottom bolt and bolt tilting
36
shear connections. Further testing of single plate shear connections subject to tearout
failures can provide insight to the behavior and to the accuracy of different design methods.
Alternative Tearout Lengths
Under the current AISC Specification (AISC 2016), strength for the limit state of
tearout is based on the clear distance, in the direction of force, between the edge of the bolt
hole and the edge of the adjacent hole or edge of the material. This distance is denoted as
lc. For the case illustrated in Figure 16, the clear distance is computed as a function of the
edge distance, Le, and the diameter of the hole, dh:
2
hc e
dl L= − (11)
Examination of experimental results has shown that the length of failure planes
from specimens that exhibited tearout are somewhat longer than the clear distance.
Researchers have proposed various alternative lengths, that when used in lieu of lc, provide
a more accurate assessment of strength. The first alternative tearout length that is
investigated in this work, denoted as lv1, was proposed by Kamtekar (2012) and is equal to
the clear distance, in the direction of force, between the edge of the bolt hole and the edge
of the adjacent hole or edge of the material along lines tangent to the bolt. For the case
illustrated in Figure 16, lv1 is computed as:
2 2
12
h
v e
d dl L
−= − (12)

37
Figure 16: Tearout Length Comparison

38
The second alternative tearout length, denoted as lv2, was proposed by Clements
and Teh (2013) and is equal to the average of the clear distance, lc, and the edge distance,
Le. For the case illustrated in Figure 16, this is computed as:
2
4
hv e
dl L= − (13)
Elliot et al. (2019) evaluated the use of lv1 and lv2 in strength equations for a small
set of experiments that failed in tearout. They found them both to provide similarly
improved predictions of tearout strength in comparison to current equations. They also
evaluated alternative net areas for block shear rupture that are similar in concept to the
alternative tearout lengths.
Other tearout lengths have been proposed (e.g., Duerr 2006). However, differences
among the lengths are slight. Also, some are more complicated than lv1 and lv2 to compute
for general bolted connections. Therefore, this work focuses on evaluating lc, lv1, and lv2.

39
CHAPTER III: EVALUATION OF PUBLISHED EXPERIMENTS
Overview
Hundreds of physical experimental tests on concentrically loaded bolted
connections susceptible to tearout have been performed in past research. This data has been
collected and organized into a database for the purpose of evaluating alternative tearout
lengths. Only connections categorized as failing in bearing, tearout, or splitting were
utilized in this analysis. The limit state of splitting is distinct from the limit state of tearout.
Equations have been proposed to predict splitting strength (Duerr 2006) and some
standards treat tearout and splitting separately (e.g., ASME 2017). However, splitting is
not recognized within the AISC Specification (AISC 2016). Therefore, equations for the
limit state of tearout are implicitly covering splitting as well. This approach is justified
since experimental results have shown the two limit states to have similar strengths and
splitting failures are typically included in the evaluation of the tearout equations, as is done
in this work. Of the 899 specimens in the concentrically loaded database, 471 failed in
bearing, tearout, or splitting, as documented in Table 2. The remaining specimens
experienced other failure modes including bolt shear rupture, tensile yielding, tensile
rupture, and curling.
Strength of Single-Bolt Specimens
Specimens with a single bolt in the direction of force allow for a direct evaluation
of individual limit states. These specimens are evaluated separately from specimens with
multiple bolts in the direction of force which may experience multiple limit states (e.g.,
bearing and tearout). Of the 471 specimens in the database with bearing, tearout, or splitting
failures, 313 contained a single bolt in the direction of force. Of these single-bolt

40
specimens, Rexp,d was available for 223, Rexp,u was available for 301, and both loads were
available for 211 of the specimens. The analysis included 265 specimens with one bolt
perpendicular to the line of force and 48 with two bolts perpendicular to the line of force.
These specimens include many that do not meet current requirements in the AISC
Specification (AISC 2016) for minimum edge distance and bolt installation (i.e., installed
to a snug-tight condition or pretensioned).
Experimentally obtained strengths are compared to strengths computed from
various instances of a generic bearing and tearout strength equation given by Eq. (14).
n t x u b uR C l tF C dtF= (14)
where, Ct is the coefficient applied to the tearout strength, lx is the length used for
determining tearout strength (i.e., either lc, lv1, or lv2), and Cb is the coefficient applied to
the bearing strength.
The test-to-predicted ratio (TTP) for each specimen is computed as the ratio of the
experimentally obtained strength to the strength from Eq. (14) for various selections of Ct,
lx, and, Cb. The mean and coefficient of variation (COV) of the test-to-predicted ratio across
the specimens is presented in Table 5 for comparisons to the load at 1/4 in. deformation
and Table 6 for comparisons to the ultimate load.
Two values of the mean and COV are presented. The value outside the parentheses
includes data from specimens that did not meet AISC Specification (AISC 2016)
requirements for minimum edge distance. The value inside the parentheses excludes
specimens that did not meet the requirements.
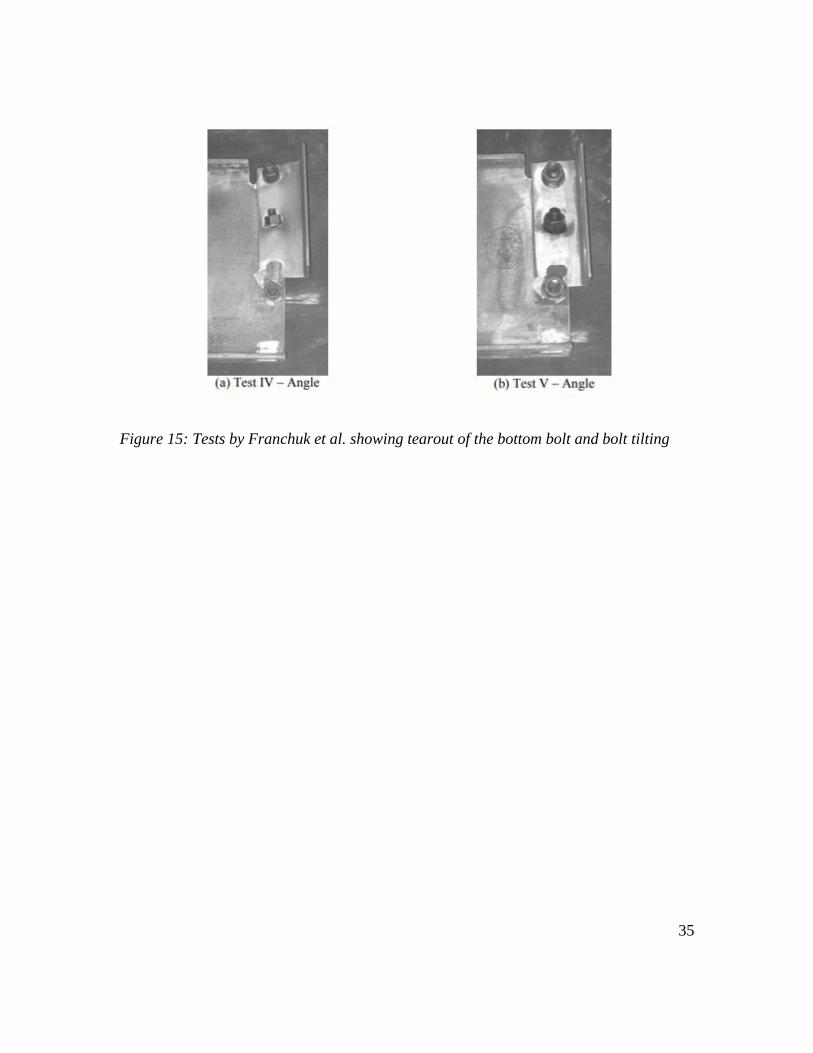
41
Table 5: Test-to-Predicted Ratio Statistics for Various Evaluations of the Load at 1/4 in.
Deformation for Single-Bolt Specimens (data from 223 specimens, data from 192
specimens meeting minimum edge distance requirements in parentheses)
Xt lx Xb Mean TTP COV TTP
Current Equations 1.2 lc 2.4 1.223 (1.180) 0.186 (0.172)
Current Coefficients 1.2 lv1 2.4 0.952 (0.953) 0.137 (0.144)
Current Coefficients 1.2 lv2 2.4 0.992 (0.988) 0.140 (0.147)
Optimized Coefficients 1.63 lc 2.29 0.957 (0.934) 0.153 (0.144)
Optimized Coefficients 1.17 lv1 2.36 0.975 (0.976) 0.137 (0.144)
Optimized Coefficients 1.23 lv2 2.36 0.975 (0.972) 0.137 (0.144)
Table 6: Test-to-Predicted Ratio Statistics for Various Evaluations of Ultimate Load for
Single-Bolt Specimens (data from 301 specimens, data from 234 specimens
meeting minimum edge distance requirements in parentheses) Xt lx Xb Mean TTP COV TTP
Current Equation 1.5 lc 3 1.065 (1.003) 0.192 (0.140)
Current Coefficients 1.5 lv1 3 0.804 (0.812) 0.139 (0.151)
Current Coefficients 1.5 lv2 3 0.841 (0.842) 0.133 (0.144)
Optimized Coefficients 1.65 lc 2.95 0.978 (0.921) 0.189 (0.145)
Optimized Coefficients 1.16 lv1 3.21 1.009 (1.010) 0.117 (0.128)
Optimized Coefficients 1.22 lv2 3.23 1.010 (1.005) 0.120 (0.129)
Rounded Coefficients 1.2 lv1 3 0.981 (0.984) 0.119 (0.130)
Rounded Coefficients 1.2 lv2 3 1.030 (1.025) 0.120 (0.129)

42
The data is also presented in Figure 17 and Figure 18, where the experimentally
obtained strength is normalized against the value of dtFu and plotted against normalized
edge distance. Where the specimen included multiple bolts perpendicular to the direction
of load, the experimental strengths were divided by the number of bolts in the connection,
n, for plotting purposes.
Optimized coefficients are among the instances of Eq. 14 that are compared in
Table 5, Table 6, Figure 17, and Figure 18 . Six sets of optimized coefficients were
computed, one for each of the three tearout lengths (i.e., lc, lv1, and lv2) at the ultimate and
1/4 in. deformation levels. The coefficients were obtained using a numerical optimization
to minimize the sum over all specimens of the square of the difference between the test-to-
predicted ratio and unity. Single-bolt and multiple-bolts specimens were included in the
optimization.
The mean test-to-predicted ratio for the current equations is 1.223 for single-bolt
specimens and 1.180 for single-bolt specimens meeting minimum edge distance
requirements (Table 5), indicating that current provisions for bearing and tearout are
conservative in predicting the load at 1/4 in. deformation. This is also seen in Figure 18 (b)
where most experimental data are above the line representative of current design equations.
This is especially true for specimens with smaller edge distances. Either of the two
alternative tearout lengths (i.e., lv1 or lv2) provides a more accurate and precise assessment
of strength when using the current coefficients as seen in both a mean value of the test-to-
predicted ratio that is closer to unity and a COV of the test-to-predicted ratio that is lower
than for the current equations. However, the use of lv1 with current coefficients somewhat

43
(a) Ultimate Load, lc
(b) Ultimate Load, lv1
(c) Ultimate Load, lv2
Figure 17: Normalized Strength Comparisons Between Tearout Lengths for Ultimate
Load

44
(a) Load at 1/4 in. Deformation, lc
(b) Load at 1/4 in. Deformation, lv1
(c) Load at 1/4 in. Deformation, lv2
Figure 18: Normalized Strength Comparisons Between Tearout Lengths for Ultimate
Load
45
overestimates the strength. Results with the optimized coefficients indicate that current
coefficients are generally appropriate for use with lv1 or lv2.
Similar trends are seen when comparing to the ultimate load (Table 6). A key
difference is that the current coefficients with the alternative tearout lengths result in a
significant overestimation of strength. Rather, a coefficient of 1.2, the same as is used in
the equations for load at the 1/4 in. deformation limit state, can provide an accurate
prediction of strength with less variation than the current equation.
These results suggest that the difference between the load at 1/4 in. deformation
and the ultimate load is far smaller than implied by current provisions. Figure 19 shows the
ratio Rexp,u/Rexp,d for single-bolt specimens plotted against the normalized clear distance.
The ratio of ultimate load to load at 1/4 in. deformation is 1.25 according to the current
AISC Specification (AISC 2016) (i.e., the ratio between Eq. (9) and Eq. (10) equals 1.25).
However, the experimental ratios are lower, especially for cases with smaller edge
distances. However, the experimental ratios are lower, especially for cases with smaller
edge distances. Only 6 of the 211 specimens plotted have a ratio greater than 1.25.
Strength of Multiple-Bolt Specimens
Of the 471 specimens in the database with bearing, tearout, or splitting failures, 158
have more than one bolt in the direction of force. Of these multiple-bolt specimens, Rexp,d
was available for 100, Rexp,u was available for 136, and both loads were available for 78 of
the specimens.

46
Figure 19: Ratio of Ultimate Load and 1/4 in. Deformation versus Normalized Clear
Distance

47
Table 7 and Table 8 provide summary statistics for the test-to-predicted ratios
computed using the various instances of Equation 14 for multiple-bolt specimens. The
values of the COV are approximately the same as those for the single-bolt cases, indicating
a good fit of the data. At the ultimate load, when including all specimens, and with rounded
coefficients, the mean test-to-predicted ratio is 0.927 for lv1 and 0.954 for lv2. These values
are lower than that for the single-bolt case and lower than is generally acceptable. A
possible reason for this is deformation compatibility between bolts. Achieving the full
bearing strength of 3.0dtFu requires significant deformation. It is possible, for example,
that by the time the full bearing capacity of the interior bolts is achieved, the end bolts have
passed their peak strength and contribute only a lower post-peak strength. Nonetheless,
when specimens not meeting minimum edge distance and spacing requirements are
excluded, the mean test-to-predicted ratios are slightly above unity.
Previous editions of the AISC Specification included exceptions to tearout
provisions when enough bolts were in a line and certain geometric conditions were met. It
was theorized that if the interior bolts fail in bearing, the tearout strength of the end bolt
would be less critical. To investigate the effect of neglecting tearout, a test-to-predicted
ratio equal to the load at 1/4 in. deformation divided by the bearing strength (the result of
Eq. (7) times the number of bolts in the connection) is plotted against the normalized clear
distance in Figure 20. Only specimens meeting the minimum edge distance and minimum
spacing requirements of the current AISC Specification (AISC 2016) are plotted.
Specimens that meet the criteria for the tearout exception in the 1993 edition of the
Specification (AISC 1993) (i.e., two or more bolts in a line, edge distance greater than 1.5d,
48
Table 7: Test-to-Predicted Ratio Statistics for Various Evaluations of the Load at 1/4 in.
Deformation for Multiple-Bolt Specimens (data from 100 specimens, data from 62
specimens meeting minimum edge distance and spacing requirements in parentheses)
Xt lx Xb Mean TTP COV TTP
Current Equations 1.2 lc 2.4 1.137 (1.106) 0.155 (0.159)
Current Coefficients 1.2 lv1 2.4 0.973 (1.013) 0.127 (0.126)
Current Coefficients 1.2 lv2 2.4 0.992 (1.024) 0.122 (0.127)
Optimized Coefficients 1.63 lc 2.29 1.032 (1.048) 0.122 (0.129)
Optimized Coefficients 1.17 lv1 2.36 0.992 (1.033) 0.126 (0.126)
Optimized Coefficients 1.23 lv2 2.37 0.995 (1.032) 0.125 (0.127)
Table 8: Test-to-Predicted Ratio Statistics for Various Evaluations of Ultimate Load for
Multiple-Bolt Specimens (data from 136 specimens, data from 48 specimens meeting
minimum edge distance and spacing requirements in parentheses)
Xt lx Xb Mean TTP COV TTP
Current Equations 1.5 lc 3 1.011 (1.047) 0.140 (0.172)
Current Coefficients 1.5 lv1 3 0.812 (0.951) 0.188 (0.178)
Current Coefficients 1.5 lv2 3 0.829 (0.961) 0.182 (0.178)
Optimized Coefficients 1.65 lc 2.95 0.958 (1.029) 0.148 (0.179)
Optimized Coefficients 1.16 lv1 3.21 0.937 (1.003) 0.138 (0.164)
Optimized Coefficients 1.22 lv2 3.23 0.928 (1.000) 0.140 (0.166)
Rounded Coefficients 1.2 lv1 3 0.927 (1.015) 0.145 (0.168)
Rounded Coefficients 1.2 lv2 3 0.954 (1.038) 0.144 (0.168)

49
Figure 20: Test-to-Predicted Ratio Excluding Tearout versus Normalized Clear Distance

50
and spacing greater than 3d) are differentiated with circular markers. The figure shows
significant variation; however, many of the specimens have low test-to-predicted ratios,
including several that meet the criteria in the 1993 Specification.
To summarize, increased accuracy in predicting tearout strength was achieved
using either lv1 or lv2 with a coefficient on the tearout strength of 1.2. This was shown to be
true for both the ultimate load and the load at 1/4 in. deformation. Based on these initial
results, the remaining analyses are conducted with the following equations for tearout
strength:
11.2n v uR l tF= (15)
21.2n v uR l tF= (16)
Effects of Bolt Tightening
The AISC Specification (AISC 2016) requires that bolts be installed to a snug-tight
condition or pretensioned. Many of the experiments in the database utilize untightened
bolts or had a gap between the plates. These loose connections do not satisfy the
requirements of the AISC Specification, but help minimize the contribution of friction to
the strength of the connection and better evaluate the strength of the connected material
alone.
Frank and Yura (1981) tested connections with different levels of tightening,
although loose connections were not considered. They found that specimens with
pretensioned bolts had 10% higher capacity at 1/4 in. deformation when compared to snug-
tightened bolts but that the ultimate capacity was unaffected by the level of tightening.

51
Table 9 presents a comparison of experimental strength to strength equations from
the current AISC Specification (AISC 2016) for all 471 specimens in the database that
failed in bearing, tearout, or splitting. No clearly identifiable trend is seen in the mean test-
to-predicted ratios at ultimate load. However, as observed by Frank and Yura (1981), the
mean test-to-predicted ratios for the load at 1/4 in. deformation tend to increase as the level
of tightening increases.
Mixed Failures
Several multiple-bolt specimens tested by Cai and Driver (2008) exhibited mixed
failures of bearing or tearout of the end bolts and shear rupture of the interior bolts. This
mode of failure is a validation of the premise underlying the use of effective strengths of
individual bolts when computing the strength of a bolt group. These specimens were not
included in the preceding discussion because they exhibited mixed failures. However, they
are examined here to validate the use of the alternative tearout lengths for connections
where a mixed failure may occur. The connected material in which the failures occurred
was the web of a wide flange with a measured thickness of 0.36 in. and a measured ultimate
tensile strength of 74.11 ksi. The connections each had six 3/4 in. diameter bolts (two lines
of three) in standard holes. The shear strength of the bolts was measured to be 50.13 kips.
Most of these specimens reached their ultimate capacity prior to reaching 1/4 in.
deformation, so only ultimate load was considered.

52
Table 9: Mean values of test-to-predicted ratios based on level of tightening
Load Level Pretensioned Snug-Tightened Untightened/Loose
Ultimate 1.049 1.023 1.067
1/4 in. Deformation 1.246 1.197 1.157

53
Table 10 summarizes the specimens along with test-to-predicted ratios calculated
using different computed strengths. The test-to-predicted ratios presented in Table 10 were
calculated with tearout strength given by the current equation (i.e., Eq. (10)) as well as
equations with the alternative tearout lengths (i.e., Eqs. (15) and (16)). Also included in
Table 10 are test-to-predicted ratios computed with the predicted strength taken as the
lower of the strengths for the bolt group for 1) the limit states of bearing and tearout and
2) the limit state of bolt shear rupture.
The results of these specimens show that it is indeed unconservative to treat bearing
and tearout separate from bolt shear rupture, given that doing so results in a 10%
overprediction of strength on average. Using this method, specimens C1E1a, C2E1b, and
C3E1c were controlled by bearing and tearout strength and the rest were controlled by bolt
shear rupture strength. More accurate but still somewhat unconservative results are
obtained when considering the potential of mixed failures and summing the effective
strengths of each individual bolt to obtain the strength of the bolt group. Little difference
is seen between the use of the clear distance and either of the two alternative tearout
lengths, all three result in a 4 to 5% overprediction of strength on average.

54
Table 10: Analysis of specimens tested by Cai and Driver (2008) that exhibited mixed
failures
Test-to-predicted ratio
Specimen Le (kips) Rexp,u (kips)
Using lc
Eq. (10)a
Using lc
Eq. (10)
Using lv1
Eq. (15)
Using lv2
Eq. (16)
C1E1a 1.00 243.27 0.850 0.981 0.955 0.968
C2E1b 1.00 249.94 0.866 1.005 0.978 0.992
C3E1c 1.00 250.17 0.868 1.007 0.981 0.993
C4E2a 1.25 279.80 0.930 1.044 1.035 1.047
C5E2b 1.26 267.61 0.890 0.993 0.984 0.996
C6E2c 1.26 259.05 0.861 0.965 0.955 0.968
C7E3a 1.50 272.40 0.906 0.946 0.950 0.962
C8E3b 1.50 259.74 0.864 0.903 0.908 0.917
C9E3c 1.51 273.21 0.908 0.947 0.952 0.962
C10E4a 1.76 273.14 0.908 0.908 0.908 0.912
C11E4b 1.75 280.81 0.934 0.934 0.934 0.937
C12E4c 1.75 265.90 0.884 0.884 0.884 0.887
C13E5a 2.00 290.70 0.966 0.966 0.966 0.966
C14E5b 2.00 267.03 0.888 0.888 0.888 0.888
C15E5c 2.01 287.71 0.957 0.957 0.957 0.957
C16E6 2.76 297.49 0.989 0.989 0.989 0.989
Mean: 0.904 0.957 0.952 0.959 a The predicted strengths for these test-to-predicted ratios were computed without
considering potential interaction between the limit states of bearing and tearout and the
limit state of shear rupture of the bolt.

55
CHAPTER IV: EXPERIMENTAL TESTS
Overview
The evaluation of published experiments showed that tearout equations using lv1
and lv2 had similarly improved results in comparison to the current equations. The database
contains results from hundreds of experiments across a broad range of parameters.
However, it only contains specimens with standard holes because the vast majority of
concentrically loaded steel bolted connection tests failing in bearing, tearout, or splitting
were performed with standard holes.
For connections with standard holes, lv1 is greater than lv2. The difference between
the two varies only slightly based on the diameter of the bolt; differing by a maximum of
7% for connections that satisfy minimum edge distance requirements and bolts as large as
1.5 in. diameter. The variation is greater, although still relatively small, over a range of
hole types. To address this gap in data, a series of experimental tests was conducted to
evaluate tearout strength for connections with different hole types.
Test Matrix
Tension tests of 22 single-bolt butt splice connections with different hole types and
edge distances were completed. The specimens consisted of two outer pull plates and a
single interior test plate as shown in Figure 21. Specimens included those with standard
holes and holes with minimal clearance, where the value of lv1 is greater than lv2. Also
included were specimens with oversize holes, holes with 1/8 in. more clearance than
oversize holes, and short-slotted holes oriented perpendicular to the load, where the value
of lv2 is greater than lv1.

56
The test matrix is presented in Table 11. Two main variables are considered: the
type of bolt hole and the edge distance. Four edge distances were investigated for each of
the five bolt hole types. Nominal values of the edge distances were: 1 in., 1.25 in., 1.5 in.,
and 2 in. The smallest edge distance (1 in.) is equal to the minimum edge distance permitted
by the AISC Specification (AISC 2016) for a 3/4 in. bolt in a standard hole. Note that the
1 in. edge distance is not permitted for oversize holes but was used in these tests for
consistency. For a 3/4 in. bolt in a standard hole, the transition between tearout and bearing
occurs at an edge distance of 1.91 in. per current equations. The largest edge distance (2.0
in.) was selected to be somewhat greater than this length and thus provide a comparison to
a bearing-controlled failure. Two additional tests beyond the main set of 20 were also
completed. Specimen NC2b was a duplicate of NC2a to investigate repeatability. Specimen
STD1g was a duplicate of STD1, but with the test bolt untightened (instead of in a snug-
tight condition) and greased plates to investigate the effect of reduced friction.
Materials and Test Setup
The test plates were 1/4 in. thick ASTM A572 Gr. 50 steel and had a yield strength
of 54.5 ksi and an ultimate tensile strength of 73.7 ksi, based on the mean of three tensile
coupon tests conducted in accordance with ASTM E8 (2016). No special preparation was
made to the plate surfaces before testing with the exception of specimen STD1g, where
grease was applied to the faying surfaces. The test plates were installed in a universal
testing machine and subjected to concentric tension load.

57
Table 11: Experimental Testing Summary
Name Hole Type Le lc lv1 lv2 lv1/lv2 dh Rexp,d
TTP using lc
(Eq. 9)
TTP using
lv1 (Eq. 15)
TTP using
lv2 (Eq. 16)Rexp,u
TTP using lc
(Eq. 9)
TTP using
lv1 (Eq. 15)
TTP using
lv2 (Eq. 16)
--- --- in in in in --- in kips --- --- --- kips --- --- ---
STD1 Standard 1.02 0.615 0.861 0.818 1.052 0.812 19.9* 1.451 1.036 1.091 19.9 1.160 1.036 1.091
STD1g1 Standard 0.99 0.578 0.818 0.784 1.044 0.823 17.6 1.359 0.960 1.002 17.8 1.098 0.970 1.012
STD2 Standard 1.16 0.750 0.992 0.954 1.039 0.817 22.9* 1.378 1.042 1.083 22.9 1.103 1.042 1.083
STD3 Standard 1.56 1.157 1.403 1.361 1.031 0.815 31.4* 1.217 1.003 1.034 31.4 0.973 1.003 1.034
STD4 Standard 2.01 1.605 1.846 1.810 1.020 0.818 37.9 1.128 0.912 0.930 43.8 1.042 1.053 1.074
NC1 No Clearance 1.03 0.650 0.983 0.838 1.173 0.753 20.7* 1.412 0.933 1.095 20.7 1.129 0.933 1.095
NC2a No Clearance 1.32 0.945 1.278 1.133 1.128 0.752 28.9 1.366 1.010 1.139 29.0 1.097 1.014 1.144
NC2b2 No Clearance 1.27 0.901 1.240 1.087 1.140 0.744 26.4 1.291 0.939 1.070 27.4 1.070 0.972 1.108
NC3 No Clearance 1.56 1.185 1.527 1.373 1.112 0.752 33.2 1.248 0.969 1.078 34.0 1.021 0.990 1.101
NC4 No Clearance 2.03 1.661 2.015 1.848 1.091 0.747 41.0 1.218 0.974 0.983 42.4 1.009 1.009 1.019
OVS1 Oversize 1.05 0.584 0.769 0.819 0.940 0.938 20.0 1.537 1.167 1.097 20.3 1.246 1.182 1.111
OVS2 Oversize 1.28 0.813 1.000 1.045 0.957 0.928 24.0 1.298 1.055 1.010 24.4 1.053 1.070 1.024
OVS3 Oversize 1.54 1.079 1.266 1.311 0.965 0.929 29.8 1.223 1.042 1.006 31.0 1.018 1.084 1.047
OVS4 Oversize 2.05 1.590 1.781 1.821 0.978 0.923 36.7 1.088 0.914 0.894 42.0 0.995 1.045 1.022
XOVS1 Extra Oversize 0.96 0.427 0.580 0.693 0.838 1.062 14.1* 1.487 1.094 0.917 14.1 1.189 1.094 0.917
XOVS2 Extra Oversize 1.29 0.766 0.920 1.030 0.893 1.056 23.3 1.360 1.132 1.012 24.2 1.131 1.177 1.051
XOVS3 Extra Oversize 1.51 0.983 1.138 1.247 0.913 1.054 26.2 1.198 1.035 0.945 27.1 0.992 1.071 0.977
XOVS4 Extra Oversize 2.04 1.506 1.661 1.771 0.938 1.058 34.7 1.042 0.938 0.880 36.8 0.885 0.996 0.935
SSLT1 Short Slot 1.02 0.616 0.730 0.819 0.891 0.812×0.994 18.1* 1.316 1.110 0.990 18.1 1.053 1.110 0.990
SSLT2 Short Slot 1.31 0.900 1.015 1.104 0.919 0.816×0.997 21.4 1.096 0.974 0.893 21.8 0.894 0.992 0.911
SSLT3 Short Slot 1.56 1.151 1.267 1.353 0.936 0.809×0.990 29.1 1.141 1.038 0.971 29.2 0.917 1.042 0.974
SSLT4 Short Slot 2.10 1.700 1.814 1.901 0.954 0.803×0.992 35.0 1.041 0.858 0.833 40.7 0.971 1.000 0.971
* Ultimate load reached prior to 1/4 in. deformation
1. Duplicate test but bolt was left untightened and plates were greased
2. Duplicate test to verify repeatability
At 1/4" Deformation At UltimateMeasured Properties

58
Two linear variable differential transformers (LVDTs) were installed on the test
specimen to record movement of the pull plate relative to the test plate over a 4 in. gauge
length. The LVDTs recorded the bolt hole deformation as well as elastic deformations of
the plates over the gauge length, however elastic deformations were minimal. An Optotrak
optical tracking system was used for supplementary deformation measurements. The
optical markers were installed on the test plate, pull plates, and the bolt. Measurements
from the optical tracking system were used to verify the LVDT measurements as well as
measure elastic elongation of the specimen and pull plate.
After applying a preload of 500 lbs to bring the connection into bearing, the test
bolt was finger tightened and then brought to a snug-tight condition with a few impacts of
an impact wrench. The plies were ensured to be in firm contact. All other bolts were finger
tightened. The preload was released prior to applying the main load. Loading was applied
in displacement control at a rate of 0.05 in/min. Most tests were stopped after a near
complete loss of load-carrying capacity, typically after one or two loud sounds that likely
indicated rupture. To investigate the progression of the failure mechanism, specimens
labeled STD1, STD2, STD3, STD4, NC1, NC2b, and SSLT1 were stopped when a steep
load drop was seen. Specimen NC2a was stopped even earlier at the first sign of any load
drop. All specimens were allowed to achieve their maximum capacity.
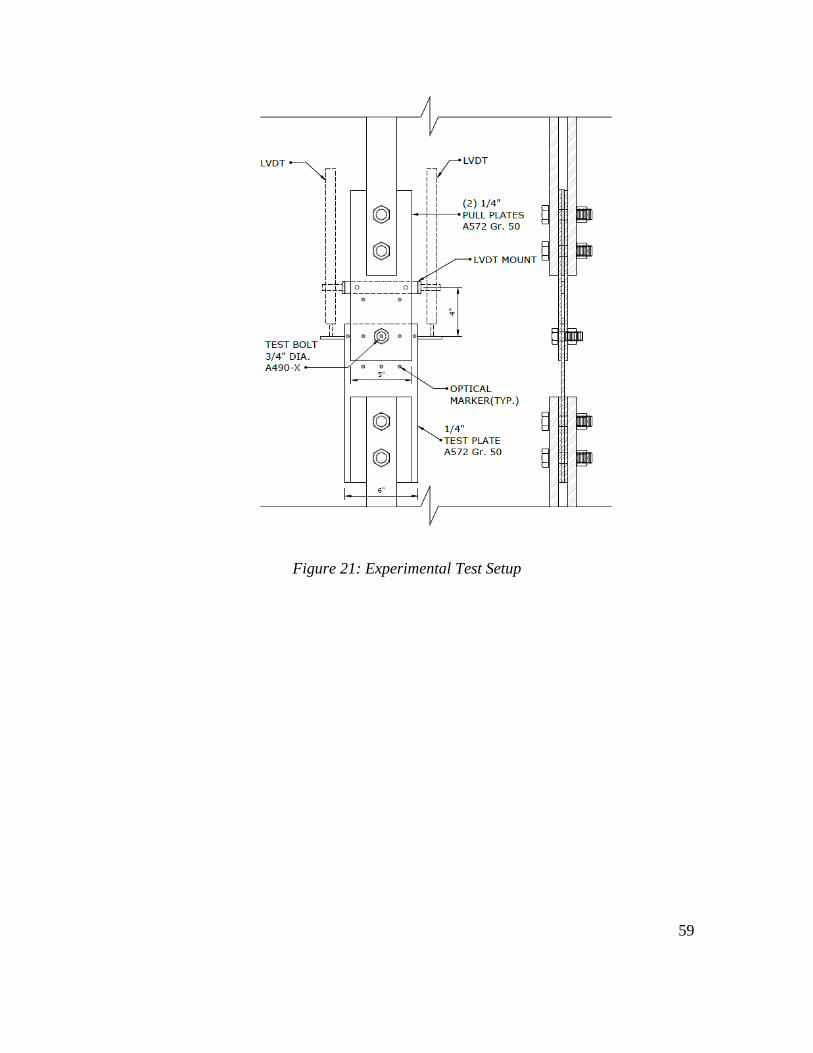
59
Figure 21: Experimental Test Setup

60
Results
Load-deformation curves for all specimens are presented in Figure 22. The load at
1/4 in. deformation (Rexp,u) and the ultimate load (Rexp,u) are presented in Table 11 along
with test-to-predicted using current and the proposed equations (Eqs. 15 and 16). Measured
values were used in calculating the predicted strengths. For specimens with short-slotted
holes, lv1 was computed graphically with computer-aided drafting software by drawing the
specimen using measured dimensions and measuring the length from the edge of the hole
to the edge of the material along lines tangent to the bolt.
Failure Mechanisms
Specimens were disassembled after testing to determine the failure mechanism.
Upon disassembly, it was observed that most specimens had a splitting tear as well as shear
rupture in the connected material along one or both sides of the bolt hole. For specimens
with smaller edge distances (i.e., nominal edge distances of 1 in. and 1.25 in.), the splitting
tear extended to the bolt hole, as shown in Figure 23. For specimens with larger edge
distances, the split did not extend all the way to the bolt hole, as shown in Figure 24.
Specimens STD4, NC4, STD1g, and NC2b did not exhibit any splitting.
For all specimens that exhibited splitting, it is likely that the initiation of splitting
occurred prior to shear rupture in the connected material and coincided with the peak load.
Testing of specimen NC2a was stopped shortly after the peak load was attained. Upon
disassembly, the initiation of a splitting tear was observed, but no initiation of shear rupture
in the connected material was observed. Interestingly, the duplicate specimen, NC2b, did
not exhibit splitting failure and achieved a 6% lower strength. The initiation
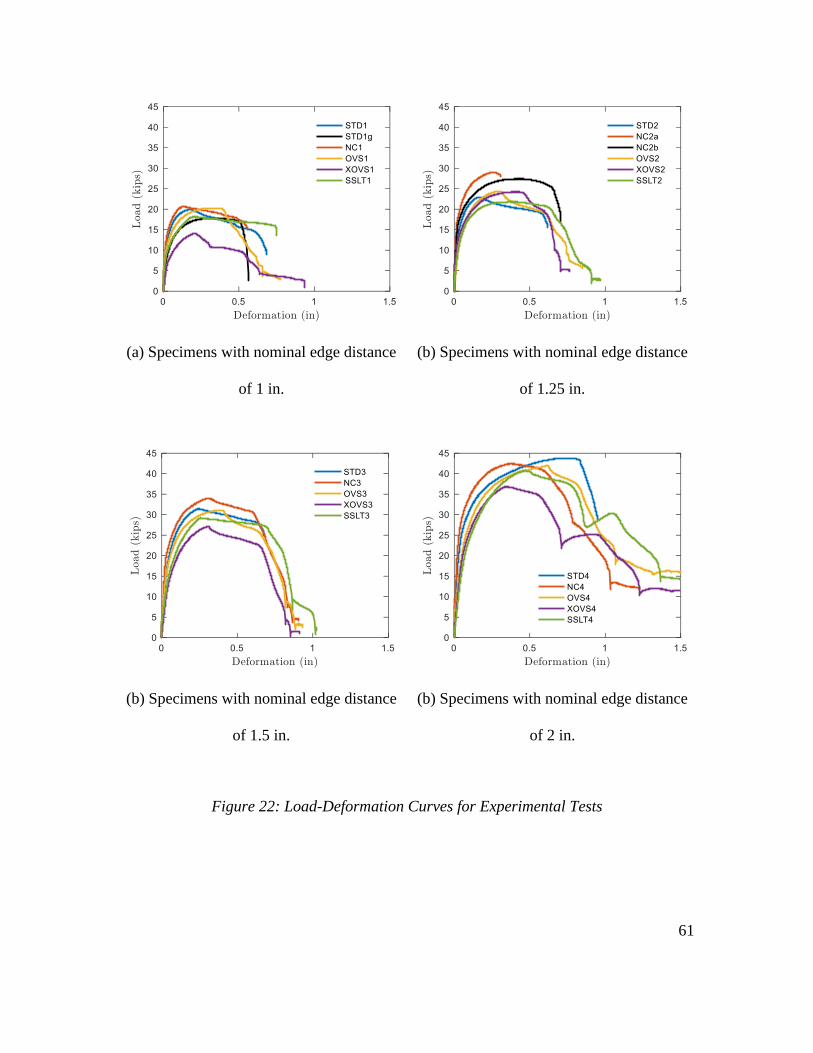
61
(a) Specimens with nominal edge distance
of 1 in.
(b) Specimens with nominal edge distance
of 1.25 in.
(b) Specimens with nominal edge distance
of 1.5 in.
(b) Specimens with nominal edge distance
of 2 in.
Figure 22: Load-Deformation Curves for Experimental Tests

62
Figure 23: Photograph of specimen OVS2 after testing
Figure 24: Photograph of specimen OVS3 after testing

63
of splitting is seen in the load-deformation curves as a dip that occurs after peak load and
flattens out prior to the steeper tearout shear rupture, as depicted in Figure 23 and in Figure
24.
Strength Evaluation
The means of the test-to-predicted ratios were calculated for each hole type to
compare the accuracy of each tearout length, shown in Table 12 and Table 13 for the 1/4
in. deformation limit state and ultimate limit state, respectively.
The results of Table 12 and Table 13 verify the trends identified in the analysis of
the previously published experiments. The current tearout equation underestimates the load
at 1/4 in. deformation, which is much closer to the ultimate load than the equations imply.
For load at 1/4 in. deformation, differences between the equations using lv1 and lv2 are
shown to be minimal for standard and oversize holes and both were more accurate than the
current equation. Across all hole types, the proposed equation with lv1 showed less variation
but was unconservative for holes with minimal clearance. The strength of short-slotted
holes was underpredicted by the equation using lv2.
Frank and Yura (1981) tested four specimens with long-slotted holes oriented
perpendicular to the load. They observed that the initial stiffness and load at 1/4 in.
deformation was reduced when compared to standard holes but that the ultimate capacity,
which was controlled by bearing for these specimens, was not reduced. As seen in Figure
22, the initial stiffness of the specimens with short-slotted holes was among the lowest of
those tested in this work. However, both Rexp,d and Rexp,u were lower for the specimens with
short-slotted holes than for the specimens with standard holes.

64
Table 12: Mean Test-to-Predicted Ratio at the 1/4 in. Deformation Limit State
Hole Type Using lc
(Eq. (10))
Using lv1
(Eq. (15))
Using lv2
(Eq. (16))
All 1.264 1.008 0.998
STD 1.293 0.998 1.035
NC 1.307 0.965 1.073
OVS 1.286 1.044 1.002
XOVS 1.272 1.050 0.938
SSLT 1.149 0.994 0.922
Table 13: Mean Test-to-Predicted Ratio at the Ultimate Limit State
Hole Type Using lc
(Eq. (10))
Using lv1
(Eq. (15))
Using lv2
(Eq. (16))
All 1.045 1.044 1.032
STD 1.070 1.034 1.071
NC 1.065 0.984 1.093
OVS 1.078 1.095 1.051
XOVS 1.049 1.085 0.970
SSLT 0.958 1.035 0.961

65
Although the mean test-to-predicted ratios for the ultimate limit state appear to be
accurate for the current equation (Table 13), the results are not consistent across edge
distances. This is seen by plotting the test-to-predicted ratios of all tested specimens using
the current equation along with the proposed equation using lv1 in Figure 25.
Effect of Bolt Tightening
All but one specimen was tested with the bolt installed to a snug-tight condition.
The exception was specimen STD1g, which was nominally identical to STD1 but with the
bolt installed loose and grease applied to the faying surfaces so as to investigate the effect
of friction. The load-deformation response of specimens STD1g and STD1 is presented in
Figure 26.
Several observations can be made from this pair of specimens: 1) the greased
specimen was less stiff than the snug-tightened specimens; 2) the load at 1/4 in.
deformation was 13% greater for the snug-tightened specimen than for the greased
specimen; 3) the ultimate load was 12% greater for the snug-tightened specimen than for
the greased specimen; 4) splitting was observed for the snug-tightened specimen, but not
the greased specimen.
While these observations were made for a single pair of specimens, the increase in
Rexp,d corresponds to the increase seen in previous testing data (Table 9). However, the
increase in Rexp,u was not seen in previous testing data. Also, it is not clear why different
failure modes occurred for the two specimens.

66
Figure 25: Test-to-Predicted Ratios at Ultimate Limit State with Best Fit Lines
Figure 26: Snug-Tightened Specimen versus Untightened and Greased Specimen

67
CHAPTER V: RELIABILITY ANALYSIS
Overview
The Commentary on the AISC Specification (AISC 2016) states that the target
reliability index for strength limit states is approximately 2.6 for members and 4.0 for
connections. The increased target reliability for connections is due to the complexity of
modeling them, sensitivity to workmanship, and the benefit that additional strength
provides. Previous reliability studies on bearing and tearout in bolted connections used a
first-order probabilistic method in which random variables modify the resistance calculated
from design equations (Galambos 1985). In this study, noting the nonlinearity arising from
multiple possible limit states, a reliability analysis was performed using Monte Carlo
simulations. The objective of the reliability study was to evaluate the reliability of current
and proposed design equations.
Methodology
A limit state function, g , can be defined as the resistance of a particular connection,
R , minus the load on that connection, Q , all three of which are assumed to be random
variables (denoted with a tilde). This is presented in Eq. (17).
g R Q= − (17)
Failure occurs when Q is greater than R , resulting in 0g . The probability of
failure, Pf, can be expressed as shown in Eq. (18)
( 0)fP P g= (18)

68
The reliability index is a common method of expressing the probability of failure
and is calculated in Eq. (19) as the inverse normal cumulative distribution function of the
probability of failure.
1( )X fF P −= − (19)
where, 𝛽 is the reliability index and 𝐹𝑋 −1 is the inverse normal cumulative distribution.
The resistance R should be the best approximation of the true resistance of the
connection and can be determined in several ways. For use with a Monte Carlo simulation,
which require many thousands of trials, code equations offer a good alternative to a finite
element analysis or other means of determining the true resistance. The proposed equation
using the alternative tearout length lv1 (Eq. 15) was used to compute resistance since this
equation resulted in less variation than the current equation when compared to
experimental results.
In order to focus on bearing and tearout reliabilities, and reduce the complexity of
the problem, it was assumed that shear rupture of the bolt or any other limit state will not
control. Therefore, the effective strength of each fastener is the minimum of the strengths
computed for the limit states of bearing and tearout. Two sets of equations for R were
formulated for each limit states, one in which deformation at service load is a design
consideration and one where it is not.
Eqs. (20) through (24) apply when deformation at service load is a design
consideration, denoted as the deformation limit state in this analysis.
1
n
d Pd d
i
R X r=
= (20)

69
where PdX is the professional factor for the deformation limit and
dr is the effective
strength of a fastener at the deformation limit state, computed as shown in Eqs. (21) to (24
).
, ,d d tearout d bearingr r r= (21)
( )( )( ), 2.4 2.4ud bearing u d n t n F unr dtF X d X t X F= = (22)
For an end bolt:
( )( )2 2
, 11.2 1.22e u
h d n
d tearout v u l en t n F un
d X dr l tF X l X t X F
− = = −
(23)
For an interior bolt:
( )( )( )2 2
, 11.2 1.2ud tearout v u h d n t n F unr l tF s d X d X t X F= = − − (24)
where 𝑑𝑛 is the nominal bolt diameter, 𝑑ℎ is the nominal bolt hole diameter, 𝑡𝑛 is the
nominal thickness of the connected material, 𝐹𝑢𝑛 is the nominal ultimate tensile strength of
the connected material, 𝑙𝑒𝑛 is the nominal center-to-edge distance, and s is the center-to-
center spacing of bolts. Most of the nominal values are multiplied by a corresponding
random variable, denoted with a tilde, representing the ratio of the actual value to the
nominal value of the variable. The random variables are described in the statistical
parameters section and in Table 14.
Eq. (25) applies when deformation at service load is not a design consideration,
denoted as the ultimate limit state in this analysis.
1
n
u Pu u
i
R X r=
= (25)

70
where PuX is the professional factor for the ultimate limit state and
ur is the effective
strength of a fastener at the ultimate limit state, computed as shown in Eq. (26) to Eq. (28
).
, ,u u tearout u bearingr r r= (26)
( )( )( ), 3.0 3.0uu bearing u d n t n F unr dtF X d X t X F= = (27)
For an end bolt:
( )( )2 2
, 11.2 1.22e u
h d n
u tearout v u l en t n F un
d X dr l tF X l X t X F
− = = −
(28)
For an interior bolt:
( )( )( )2 2
, 11.2 1.2uu tearout v u h d n t n F unr l tF s d X d X t X F= = − − (29)
The nominal load effect, Q , is equal to the sum of the dead and live load multiplied by
their respective random variable, as shown in Eq. (30) through (32). Only dead and live
load are considered in this study, as was done in previous reliability studies (Galambos
1983, 1985; Lundberg and Galambos 1996).
D LQ P P= + (30)
D D DnP X P= (31)
L L LnP X P= (32)
The nominal values of dead and live load are obtained from current or trial design equations
assuming that the connection was designed at the precise limit point as shown in Eq. (33).
n uR R = (33)
The load combinations under consideration are evaluated with Eq. (34).

71
1.4
max1.2 1.6
Dn
u
Dn Ln
PR
P P
=
+ (34)
Statistical Parameters
The professional factors, PdX and
PuX , account for the expected variation
between the actual strength of the connection and the computed strength. Statistical
parameters of the professional factor are determined through an evaluation of the test-to-
predicted ratio for a number of physical experiments. The database of experimental data
presented in the evaluation of published experiments was used to generate these
parameters. Only tearout and bearing failures were included. In order to be included, the
specimens must meet the AISC geometric requirements for edge distance and spacing, but
all bolt tightening levels were included. To evaluate the test-to-predicted ratio at the
deformation limit state and ultimate limit state, the experimental tests were required to have
a recorded load at 1/4 in. deformation or ultimate load, respectively. The predicted strength
for each specimen was computed using Eqs. (20) and (25) with the professional factor set
to unity and measured values used in place of nominal values. For the 199 specimens
meeting the criteria for the deformation limit state, the resulting mean of the test-to-
predicted ratio was 0.98 and the resulting coefficient of variation (COV) was 0.13. For the
ultimate limit state, 219 specimens met the criteria to be included. The resulting mean of
the professional factor was 1.01 and the resulting COV was 0.13.
Statistical parameters for material strength (uFX ), thickness (
tX ), bolt diameter (
dX ), and edge distance (el
X ) were explicitly assigned to calculate the expected resistance.
Due to large differences in the material strength and thickness between flanges of W-

72
sections and plates, these materials were treated separately. The parameters were derived
from literature. Test-to-predicted material strengths were researched by Liu et al. (2007)
for various steel strengths and shapes. From this study, data from A992 wide flange steel
as well as A572 steel plates were used. The random variable for flange thickness was
determined from data collected by Kennedy and Aly (1980) of 2768 measurements of
flange thicknesses. The random variable for plate thickness was determined from Schmidt
and Bartlett (2002) for plates used in welded wide flange plate girders. No previous
research on the statistical variation of bolt diameter or bolt placement was found. The
variation of bolt diameter was based on manufacturing tolerances for a heavy hex 3/4 in.
diameter bolt per (ASME 2006), and assuming a 99.7% confidence interval (within three
standard deviations). The probability distribution was truncated to be within the ASME
tolerances, which guarantees that the bolt diameter does not exceed the hole diameter (a
deterministic value). Variation of the bolt edge distance was assumed to follow a normal
distribution without bias and with an 99.7% confidence that the bolt is placed within a
tolerance of 1/8 in. Spacing of bolts was set as a deterministic value to account for the
effect of spacing correction as bolt holes are fabricated. The random variables for dead and
live load are the ones proposed by Ellingwood et al. (1980). Dead load is modeled as a
normally distributed variable whereas live load is modeled as a Type I extreme value
distribution. Table 14 summarizes the statistical parameters used in this reliability study.

73
Table 14: Summary of Statistical Parameters
Random
Variable Description Assumed Distribution
�̃�𝑃𝑑
Ratio of actual to predicted strength for
bearing and tearout failures when
deformation is a design consideration
Normal
(mean=0.98, COV=0.13)
�̃�𝑃𝑢
Ratio of actual to predicted strength for
bearing and tearout failures when
deformation is a not design consideration
Normal
(mean=1.01, COV=0.13)
�̃�𝐹𝑢𝑓
Ratio of actual to nominal ultimate tensile
strength of wide flange material
Normal
(mean=1.12, COV=0.04)
�̃�𝐹𝑢𝑝
Ratio of actual to nominal ultimate tensile
strength of plate material
Normal
(mean=1.26, COV=0.07)
�̃�𝑡𝑓 Ratio of actual to nominal thickness of
wide flange material
Normal
(mean=0.976, COV=0.042)
�̃�𝑡𝑝 Ratio of actual to nominal thickness of
plate material
Normal
(mean=1.04, COV=0.025)
�̃�𝑑 Ratio of actual to nominal bolt diameter Truncated Normal
(mean=1.00, COV=0.02)
�̃�𝑙𝑒 Ratio of actual to nominal edge distance
Normal
(mean=0.00, S.D.=0.05”)
�̃�𝐷 Ratio of actual to nominal dead load Normal
(mean=1.05, COV=0.10)
�̃�𝐿 Ratio of actual to nominal live load Type 1 Extreme Value
(mean=1.00, COV=0.25)
74
Variable Sensitivity Analysis
The methodology described in the previous sections was used to run Monte Carlo
simulations to compare the reliabilities of existing and alternative equations on butt spliced
connections. Due to the quantity of variables to be considered in the reliability analysis, it
was required to narrow the scope to the most important parameters. It was known that
variables such as the number of bolts in a line parallel to load, edge distance, spacing, and
ratio of the connected material thicknesses would have the most effect on reliability. Prior
to excluding the remaining variables, a sensitivity analysis was performed to ensure that
any further analysis would be efficient and conservative.
The ratio of the connected material thickness was selected to be 1:1, meaning that
the sum of the exterior plate thicknesses was equal to the interior plate thickness. This is
the most conservative approach since failure in either part is more likely occur, decreasing
reliability. However, it was chosen to use the wide flange material for the interior part and
plate for the exterior parts to provide a more averaged material strength. Since the wide
flange material has a lower test-to-predicted ratio ultimate strength, it was more susceptible
to fail.
The remaining variables are bolt diameter, material ultimate strength (Fu),
connected material thickness (while maintaining ratio), live to dead load ratio (L/D ratio),
and number of bolt lines. These were hypothesized to have a minimal effect on the
reliability. The first stage of the analysis was to perform a sensitivity analysis on these
variables by varying them independently on a typical connection with a constant number
of bolts in a line (3), edge distance (2d), spacing (3d), and connected material thickness
ratio (1:1). Default values of bolt diameter (3/4 in.), connected material ultimate strength
75
(65 ksi), connected material thickness (1/8 in.), L/D ratio (3), and number of bolt lines (1)
were also used. For simplicity, only the current equations against the ultimate limit state
were used to determine reliability for the sensitivity analysis.
It was found that only bolt diameter and the live-to-dead load ratio had any
influence on reliability. Changing the connected material thickness, number of bolt lines
parallel to load, and the material ultimate strength made no difference to reliability. This is
because the “true” resistance and predicted resistances are both proportionally based on
these variables, so reliability is not changed. The effects of changing bolt diameter and
live-to-dead load ratio are shown in Table 15. As expected, the reliability decreases as the
L/D ratio increases due to the additional uncertainty inherent in the live load statistical
parameter. A L/D ratio of 3.0 was chosen for further analysis in this study, as it offers a
realistic and conservative approach to calculating reliability and has been previously used
in other studies (Galambos 1983, 1985; Lundberg and Galambos 1996). Bolt diameter has
a minimal effect on reliability and 3/4 in. diameter bolts were selected for further reliability
analysis in this thesis. The material selected was 1/8 in. thickness, 65 ksi ultimate strength,
and contained one line of bolts.
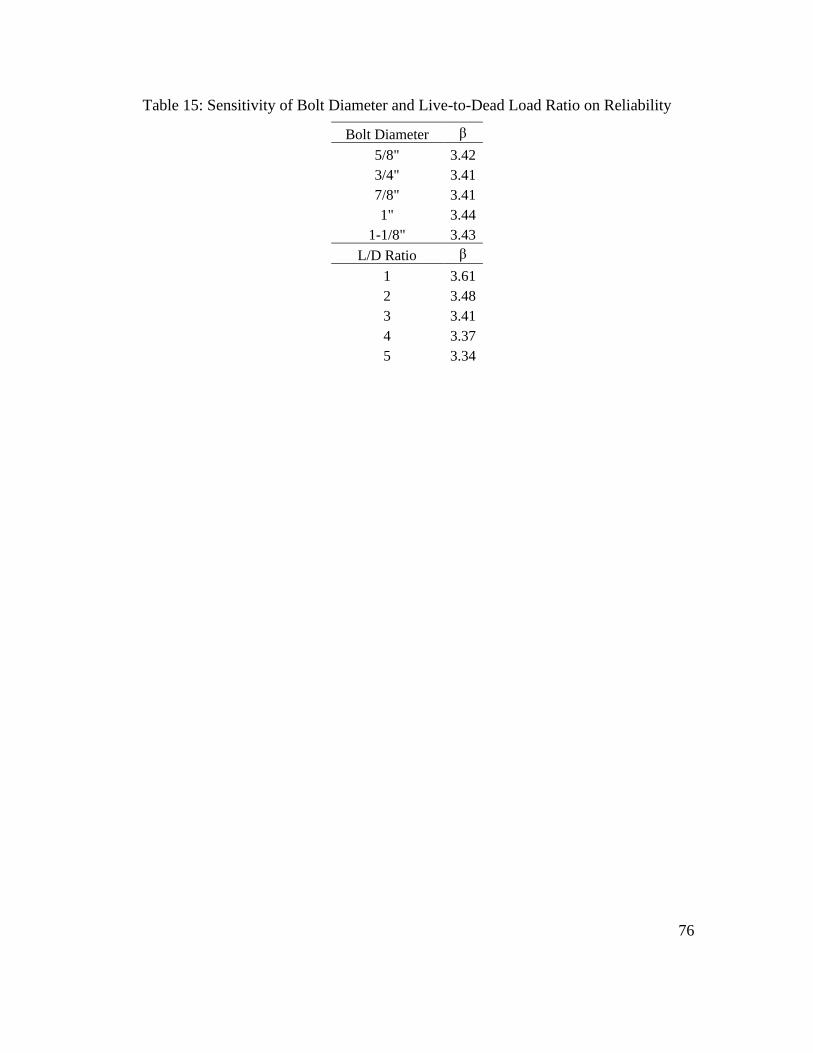
76
Table 15: Sensitivity of Bolt Diameter and Live-to-Dead Load Ratio on Reliability
Bolt Diameter β
5/8" 3.42
3/4" 3.41
7/8" 3.41
1" 3.44
1-1/8" 3.43
L/D Ratio β
1 3.61
2 3.48
3 3.41
4 3.37
5 3.34

77
Reliability Analysis and Results
After determining which variables can be maintained constant, the focus of the
reliability study was narrowed to the effects of the number of bolts in a line, the edge
distance, and spacing. Three combinations of edge distance and spacing were selected to
generate plots of reliability versus the number of bolts in a line. Two design methods were
also considered:
1. Deformation at bolt holes at service load is a design consideration (reliability
against deformation limit state).
2. Deformation at bolt holes at service load is a not design consideration
(reliability against ultimate limit state).
Each plot includes two lines indicating the current equation and proposed equation
shown in Eq. (15). A third line was included to investigate the effect of ignoring tearout in
the current equation. Although a certain number of bolts in a connection will negate the
strength reduction of a tearout controlled edge bolt, it was expected that this would require
many bolts to have a significant effect. The number of samples used in the Monte Carlo
simulations was 5x10⁷. This sample size results in a 95% confidence that the reliability
index error is within ±0.0025.
The first case, shown in Figure 27, evaluated the reliability using both minimum
edge distance (1.33d for a 3/4 in. bolt) and minimum spacing (2.33d). The second case,
shown in Figure 28 tested an edge distance of 2d and a spacing of 4d, which is more
representative of typical connection geometries. The third case, shown in Figure 29 was
designed to fail in only bearing, with the edge distance and spacing set 6d and 12d,

78
respectively. This provides the widest range of geometries so as to evaluate the ranges of
expected reliabilities.
Figure 27 through Figure 29 demonstrate that the alternative equation using the
modified tearout length provides the most consistent results (β≈3) between different edge
distances, and is also consistent between tearout and bearing-controlled cases. The
reliability index of 3.0 achieved by the alternative equations is not lower than the current
equation in a bearing-controlled connection and therefore appears to be acceptable. It is
important to note that since the “true” resistance was determined from the alternative
equation, the current design equation result in higher reliabilities for tearout since they tend
to underestimate the capacity. Ignoring tearout is shown to result in a noticeable decrease
in strength for cases with less than 6 bolts, even when using typical edge distance and
spacing. On the basis of reliability, removing the tearout equation cannot be justified.
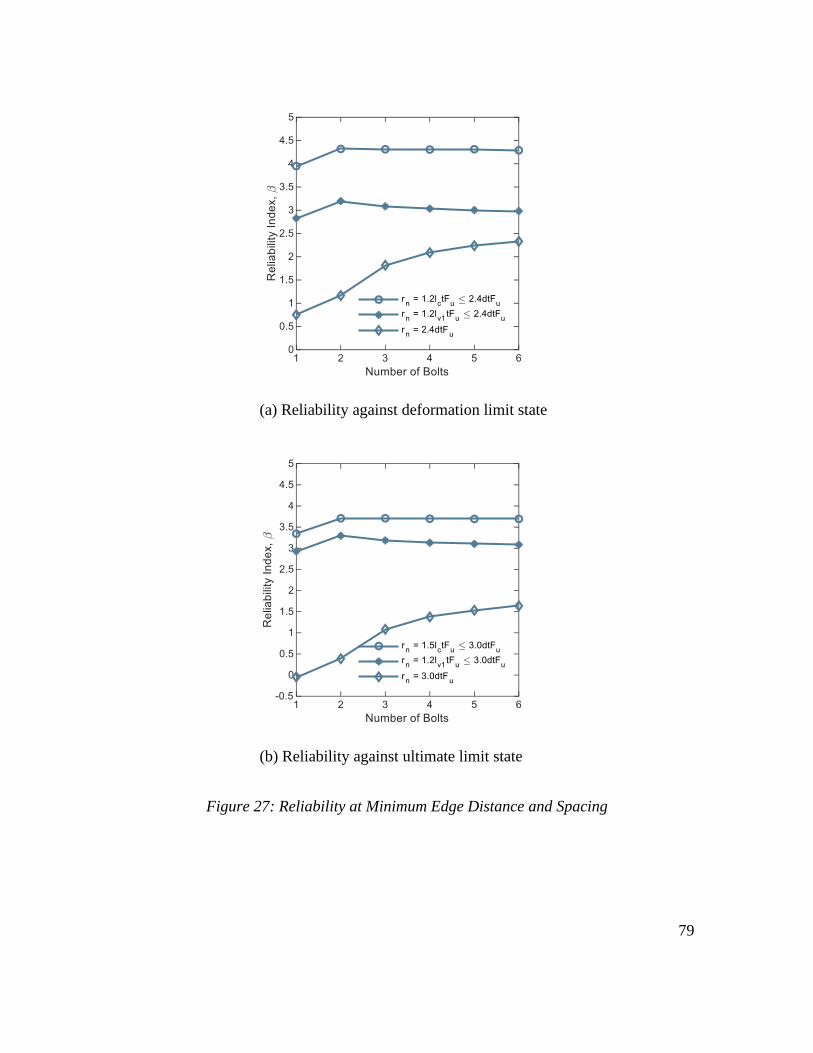
79
(a) Reliability against deformation limit state
(b) Reliability against ultimate limit state
Figure 27: Reliability at Minimum Edge Distance and Spacing
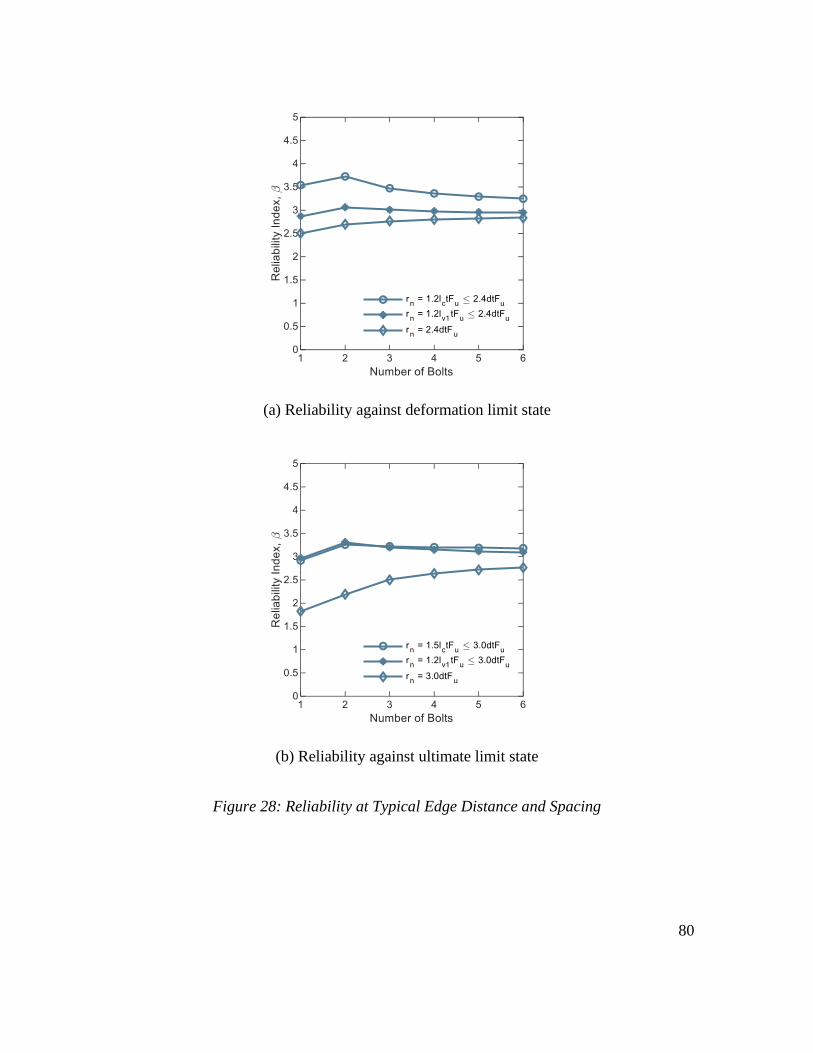
80
(a) Reliability against deformation limit state
(b) Reliability against ultimate limit state
Figure 28: Reliability at Typical Edge Distance and Spacing

81
(a) Reliability against deformation limit state
(b) Reliability against ultimate limit state
Figure 29: Reliability at Maximum Edge Distance and Spacing

82
CHAPTER VI: ALTERNATIVE DESIGN APPROACH
Overview
The proposed equations provide improved accuracy over current equations.
However, there remains the possibility of different effective strengths for bolts within a
group. These different strengths represent physical behavior, but they can be inconvenient
for design. It may be convenient to have a uniform effective strength among bolts in a
group for design, even if such an evaluation was conservative. In this section, an alternative
design approach, or rule-of-thumb, where tearout need not be check directly and the
strength of each bolt within a group can be taken as the same will be developed. For this
approach, reduction factors are applied to the bearing and bolt shear rupture strength such
that the tearout limit state need not be checked explicitly.
Derivation of the Approach
The strength equations for the limit states of bearing and tearout are similar in that
they both include the term tFu. Accordingly, the ratio between the strength for the two limit
states depends only on the bolt diameter, d, and the clear distance, lc. For the case when
deformation at the bolt hole at service load is a design consideration, the ratio of nominal
strength for the limit state of tearout for an individual bolt, rnt, to the nominal strength for
the limit state of bearing for an individual bolt, rnb, is equal to lc/2d. This ratio is calculated
for a range of bolt diameters and for both standard and oversize holes in Table 16 and Table
17. In Table 16, it is assumed that the bolt is adjacent to an edge and the minimum edge
distance per Section J3.4 of the AISC Specification is provided. In Table 17 , it is assumed
that the bolt is adjacent to another bolt and a spacing of 3d (as recommended in Section
J3.3 of the AISC Specification) is provided. From these tables it can be concluded that, for

83
Table 16: Ratio of tearout strength to bearing strength for edge bolts
Standard Holes Oversize Holes
d dh Le,min lc,min rnt,min/rnb dh Le,min lc,min rnt,min/rnb
in in in in --- in in in ---
1/2 0.563 0.750 0.469 0.469 0.625 0.813 0.500 0.500
5/8 0.688 0.875 0.531 0.425 0.813 0.938 0.531 0.425
3/4 0.813 1.000 0.594 0.396 0.938 1.063 0.594 0.396
7/8 0.938 1.125 0.656 0.375 1.063 1.188 0.656 0.375
1 1.125 1.250 0.688 0.344 1.250 1.375 0.750 0.375
1 1/8 1.250 1.500 0.875 0.389 1.438 1.625 0.906 0.403
1 1/4 1.375 1.625 0.938 0.375 1.563 1.750 0.969 0.388
1 3/8 1.500 1.719 0.969 0.352 1.688 1.844 1.000 0.364
1 1/2 1.625 1.875 1.063 0.354 1.813 2.000 1.094 0.365
Table 17: Ratio of tearout strength to bearing strength for interior bolts
Standard Holes Oversize Holes
d dh 3d lc,3d rnt,3d/rnb dh 3d lc,3d rnt,3d/rnb
in in in in --- in in in ---
1/2 0.563 1.500 0.938 0.938 0.625 1.500 0.875 0.875
5/8 0.688 1.875 1.188 0.950 0.813 1.875 1.063 0.850
3/4 0.813 2.250 1.438 0.958 0.938 2.250 1.313 0.875
7/8 0.938 2.625 1.688 0.964 1.063 2.625 1.563 0.893
1 1.125 3.000 1.875 0.938 1.250 3.000 1.750 0.875
1 1/8 1.250 3.375 2.125 0.944 1.438 3.375 1.938 0.861
1 1/4 1.375 3.750 2.375 0.950 1.563 3.750 2.188 0.875
1 3/8 1.500 4.125 2.625 0.955 1.688 4.125 2.438 0.886
1 1/2 1.625 4.500 2.875 0.958 1.813 4.500 2.688 0.896

84
the conditions considered, the tearout strength of an edge bolt is no less than 0.344 times
its bearing strength (Eq. 35) and the tearout strength of an interior bolt is no less than 0.850
times its bearing strength (Eq. 36).
0.344nt nb nbr r r = (35)
0.850nt nb nbr r r = (36)
where, α and β are minimum strength ratios determined from Table 16 and Table 17,
respectively (i.e., α = 0.344 and β = 0.850).
Consider the generic connection shown in Figure 30. The strength of the bolt group
is the summation of the effective strength of each of the bolts. Assuming that shear rupture
of the bolt does not control the effective strength of any of the bolts, then the lower bound
of the strength of the bolt group can be computed as shown in Eq. (37), noting that there
are two bolts adjacent to edges and the remaining bolts are interior.
2 ( 2)n nb nbR r n r + − (37)
where n is the total number of bolts in the line. Rearranging terms results in Eq. (38):
2 ( 2)
n nb b nb
nR n r nx r
n
+ − =
(38)
where, xb is a reduction factor applied to the bearing strength.
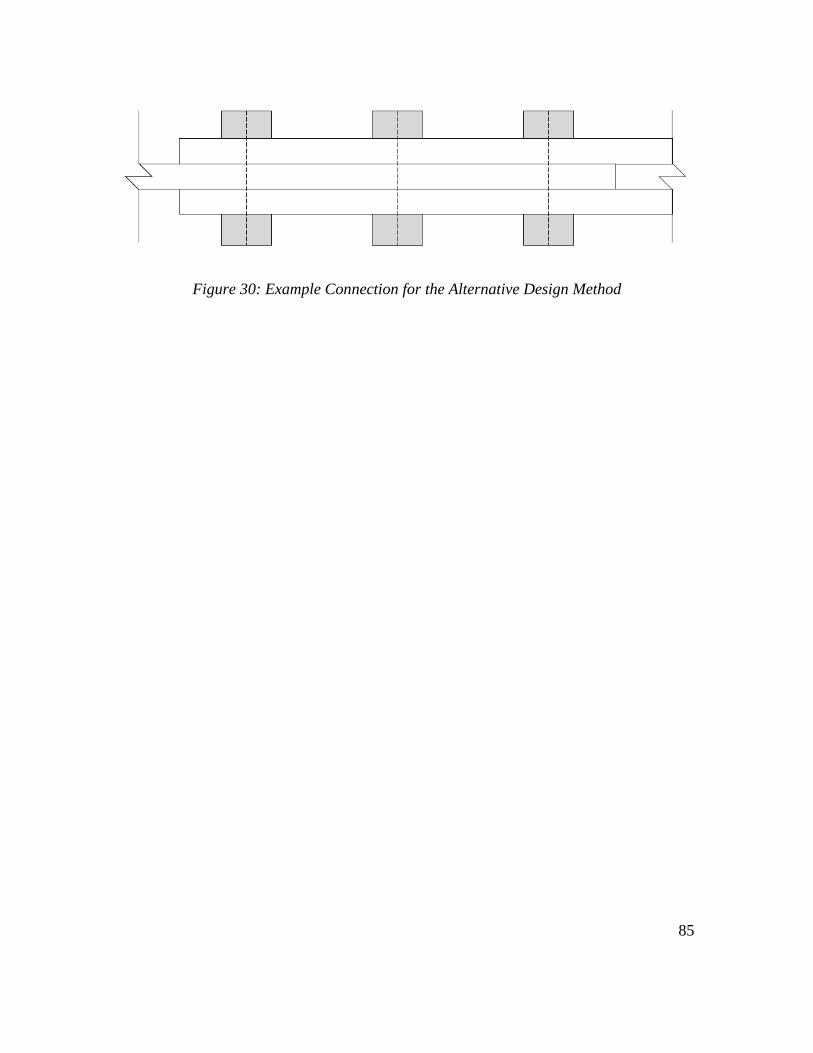
85
Figure 30: Example Connection for the Alternative Design Method

86
According to Eq. (38), a lower-bound estimate of the strength of a bolt group can
be obtained as the number of bolts times a reduced bearing strength. The reduction factor
is given by Eq. (39):
2 ( 2) 1
0.85b
nx
n n
+ −= − (39)
However, bolt shear rupture strength may not be neglected in general. A similar
reduction factor applied to the bolt shear rupture strength, rns, can be determined to address
cases where bolt shear rupture and tearout control the effective strength of the various
individual bolts. In such a case, a lower-bound estimate of the strength can be computed as
Eq. (40).
2 ( 2)n s ns nb nsR nx r r n r = + − (40)
The maximum necessary reduction will occur when the bolt shear rupture strength
is equal to the reduced bearing strength for the interior bolts (rns = βrnb):
2 ( 2)n s nb nb nbR nx r r n r = + − (41)
Solving for xs:
2 ( 2) 1
10.85
s
nx
n n
+ −= − (42)
Accordingly, a lower-bound estimate of the strength of a concentrically loaded bolt
group, can be determined using Eq. (43) without the need to directly evaluate the limit state
of tearout.
( )min ,n b nb s nsR n x r x r (43)

87
This equation, with xb defined by Eq. (39) and xs defined by Eq. (42), is applicable
to when deformation at the bolt hole at service load is a design consideration, standard or
oversize holes are used, the minimum required edge distances are met, spacing greater than
or equal to 3d is provided, and strength is computed according to the 2016 AISC
Specification (i.e., not the proposed equations in this work). However, within these
conditions, Equation 43 applies to any number of bolts, bolt diameter, and bolt grade.
Alternative reduction factors for different situations and ranges of parameters can be
computed using different values of α and β. If edge distances and spacings are large enough,
then tearout does not control and the reduction factors are no longer necessary. With current
AISC equations, this would occur when the clear distance is greater than 2d.

88
CONCLUSIONS AND RECOMMENDATIONS
A multifaceted investigation of the limit state of tearout and its impact on design of
steel bolted connections has been conducted. Previously published experimental data was
evaluated and supplemented with new experimental data to assess the accuracy of current
provisions as well as potential alternative provisions.
This study has shown that increased accuracy in design can be achieved by
replacing Equations J3-6c and J3-6d in the AISC Specification with Eq. (44).
11.2n v uR l tF= (44)
This proposed equation is shown in terms of lv1, since it provides somewhat better results
over a wider range of types of bolt holes, particularly short-slotted holes. However, the
same equation but with lv2 in lieu of lv1 would provide similar benefits. The reliability of
Eq. (44) has been shown to be at a suitable level and consistent across different parameters,
including number of bolts and edge distance.
While Eq. (44) provides increased accuracy over current equations, the
computation of the alternative tearout lengths is somewhat more complicated than the
computation of the clear distance. This is especially true for eccentrically loaded bolt
groups which are not covered in this work, but pose a challenge since the direction of force
varies from bolt to bolt. Neither of the alternative tearout lengths are well defined nor have
they been validated for loads at an angle. Additional development and validation is
necessary for eccentrically loaded connections.

89
The following additional conclusions can be made from this work:
• Tearout impacts the strength of bolt groups, even for cases of multiple bolts in
a row.
• The current equation for tearout strength when deformation at the bolt hole at
service load is a design consideration (i.e., load at 1/4 in. deformation) is
conservative, especially for shorter edge distances. On average, the current
equation underestimates the experimental strength by 20-25%.
• Ultimate load for the limit state of tearout is approximately 5% larger than the
load at 1/4 in. deformation, significantly less than the 25% implied by current
provisions.
• Bolt tightening increases the load at 1/4 in. deformation by an average of 8%
for a pretensioned bolt condition over an untightened bolt condition. No clear
effect of bolt tightening was found at the ultimate load.
• Two alternative tearout lengths, lv1 and lv2, were investigated for their potential
to improve the accuracy of design equations. Strength equations using these
alternative tearout lengths were found to be more accurate than the current
equations which use the clear distance, lc, with a mean test-to-predicted ratio
closer to 1.00 and a smaller coefficient of variation for all examined cases.
• Design equations with lv1 and lv2 are similarly accurate for connections with
standard and oversize holes. The design equation using lv2 was found to be
somewhat unconservative for short-slotted holes and hole with clearance

90
greater than oversize. The design equation using lv1 was found to be accurate of
the entire range of hole types investigated.
• The alternative provisions provide a sufficient and consistent level of reliability
across a wide range of parameters.
• An alternative design method in which reduction factors are used on bearing
and bolt shear rupture strength was developed. The method allows the tearout
check to be removed by reducing strength, which can be beneficial in some
design cases.

91
REFERENCES

92
AISC. (1923). Standard Specification for Structural Steel Buildings. American Institute
of Steel Construction, New York, NY.
AISC. (1936). Specification for the Design, Fabrication and Erection of Structural Steel
for Buildings. American Institute of Steel Construction, New York, NY.
AISC. (1961). Specification for the Design, Fabrication and Erection of Structural Steel
for Buildings. American Institute of Steel Construction, New York, NY.
AISC. (1978). Specification for the Design, Fabrication and Erection of Structural Steel
for Buildings. American Institute of Steel Construction, Chicago, IL.
AISC. (1986). Load and Resistance Factor Design Specification for Structural Steel
Buildings. American Institute of Steel Construction, Chicago, IL.
AISC. (1993). Load and Resistance Factor Design Specification for Structural Steel
Buildings. American Institute of Steel Construction, Chicago, IL.
AISC. (1999). Load and Resistance Factor Design Specification for Structural Steel
Buildings. American Institute of Steel Construction, Chicago, IL.
AISC. (2010). Specification for Structural Steel Buildings. American Institute of Steel
Construction, Chicago, IL.
AISC. (2016). Specification for Structural Steel Buildings. American Institute of Steel
Construction, Chicago, IL.
ASME. (2006). Fasteners for Use in Structural Applications. The American Society of
Mechanical Engineers.
ASME. (2017). Design of Below-the-Hook Lifting Devices. American Society of
Mechanical Engineers.
Astaneh, A., McMullin, K. M., and Call, S. M. (1988). Design of Single Plate Shear
Connections. University of California, Berkeley, California.
ASTM E8 / E8M-16ae1. (2016). Standard Test Methods for Tension Testing of Metallic
Materials. ASTM International, West Conshohocken, PA.
Badawi, H. E.-D. S. (1983). “Behaviour of eccentric bolted shear connections.” Master
Thesis, McGill University, Montreal, Quebec.
Baldwin Metzger, K. A. (2006). “Experimental Verification of a New Single Plate Shear
Connection Design Model.” Master Thesis, Virginia Polytechnic Institute and
State University, Blacksburg, VA.
Birkemoe, P. C., and Gilmor, M. I. (1978). “Behavior of Bearing Critical Double-Angle
Beam Connections.” Engineering Journal, 15(4), 7.
Brown, J. D., Lubitz, D. J., Yavor, C. C., Frank, K. H., and Keating, P. B. (2007).
Evaluation of Influence of Hole Making Upon the Performance of Structural Steel
Plates and Connections. Center for Transportation Research, The University of
Texas, Austin, TX.
Cai, Q., and Driver, R. G. (2008). End tear-out failures of bolted tension members.
Structural Engineering Report, University of Alberta, Edmonton, Alberta.
Carter, C. J., Tide, R. H. R., and Yura, J. A. (1997). “A Summary of Changes and
Derivation of LRFD Bolt Design Provisions.” Engineering Journal, 70–81.
Clements, D. D. A., and Teh, L. H. (2013). “Active Shear Planes of Bolted Connections
Failing in Block Shear.” Journal of Structural Engineering, 139(3), 320–327.

93
Crawford, S. F., and Kulak, G. L. (1971). “Eccentrically Loaded Bolted Connections.”
Journal of the Structural Division, Proceedings of the American Society of Civil
Engineers, 97(3), 765–783.
Creech, D. D. (2005). “Behavior of Single Plate Shear Connections with Rigid and
Flexible Supports.” Master Thesis, North Carolina State University, Raleigh, NC.
Draganić, H., Dokšanović, T., and Markulak, D. (2014). “Investigation of bearing failure
in steel single bolt lap connections.” Journal of Constructional Steel Research,
98, 59–72.
Duerr, D. (2006). “Pinned Connection Strength and Behavior.” Journal of Structural
Engineering, 132(2), 182–194.
Ellingwood, B., Galambos, T. V., MacGregor, J. G., and Cornell, C. A. (1980).
Development of a probability based load criterion for American National
Standard A58. NBS Special Publication, National Bureau of Standards,
Washington D.C.
Elliott, M. D., Teh, L. H., and Ahmed, A. (2019). “Behaviour and strength of bolted
connections failing in shear.” Journal of Constructional Steel Research, 153,
320–329.
Fisher, J. W., and Struik, J. H. A. (1974). Guide to Design Criteria for Bolted and
Riveted Joints. Wiley, New York.
Franchuk, C. R., Driver, R. G., and Grondin, G. Y. (2002). Block Shear Behavior of
Coped Steel Beams. Structural Engineering Report, University of Alberta,
Alberta, Canada.
Frank, K. H., and Yura, J. (1981). An Experimental Study of Bolted Shear Connections.
Department of Transportation, Washington, D.C.
Freitas, S. T. D. (2005). “Experimental research project on bolted connections in bearing
for high strength steel.” Thesis, Delft University of Technology, Delft.
Galambos, T. V. (1983). “Reliability of axially loaded columns.” Engineering Structures,
5(1), 73–78.
Galambos, T. V. (1985). Reliability of Connections, Joints and Fasteners. Structural
Engineering Report, University of Minnesota, Minneapolis, MN.
Gillett, P. E. (1978). “Ductility and Strength of Single Plate Connections.” PhD
Dissertation, The University of Arizona, Tucson, AZ.
Hertz, J. (2014). “Testing of Extended Shear Tab Connections Subjected to Shear.”
Master Thesis, McGill University, Montreal, Quebec.
Kamtekar, A. G. (2012). “On the bearing strength of bolts in clearance holes.” Journal of
Constructional Steel Research, 79, 48–55.
Karsu, B. (1995). “The load deformation response of single bolt connections.” M.S.
Thesis, Virginia Polytechnic Institute and State University, Blacksburg, VA.
Kennedy, D. J. L., and Aly, M. G. (1980). “Limit states design of steel structures—
performance factors.” Canadian Journal of Civil Engineering, 7(1), 45–77.
Kim, H. J., and Yura, J. A. (1999). “The effect of ultimate-to-yield ratio on the bearing
strength of bolted connections.” Journal of Constructional Steel Research, 49(3),
255–269.

94
Lewis, B. E., and Zwerneman, F. J. (1996). Edge Distance, Spacing, and Bearing in
Bolted Connections. Oklahoma State University, Stillwater, OK.
Liu, J., Sabelli, R., Brockenbrough, R. L., and Fraser, T. P. (2007). “Expected Yield
Stress and Tensile Strength Ratios for Determination of Expected Member
Capacity in the 2005 AISC Seismic Provisions.” Engineering Journal, AISC, 44,
15–26.
Lundberg, J. E., and Galambos, T. V. (1996). “Load and resistance factor design of
composite columns.” Structural Safety, 18(2–3), 169–177.
Man, J. C. Y., Grondin, G. Y., and Driver, R. G. (2006). Beam-to-Column Shear
Connections with Slotted Holes. Structural Engineering Report, University of
Alberta, Edmonton, Alberta.
Marosi, M. (2011). “Behaviour of Single and Double Row Bolted Shear Tab Connections
and Weld Retrofits.” Master Thesis, McGill University, Montreal, Quebec.
Može, P., and Beg, D. (2010). “High strength steel tension splices with one or two bolts.”
Journal of Constructional Steel Research, 66(8–9), 1000–1010.
Može, P., and Beg, D. (2011). “Investigation of high strength steel connections with
several bolts in double shear.” Journal of Constructional Steel Research, 67(3),
333–347.
Može, P., and Beg, D. (2014). “A complete study of bearing stress in single bolt
connections.” Journal of Constructional Steel Research, 95, 126–140.
Nissen, J. S. (2014). “Test of gusset plate connections.” BEng Thesis, Technical
University of Denmark, Kgs. Lyngby, Denmark.
Porter, K. A., and Astaneh-Asl, A. (1990). Design of single plate shear connections with
snug-tight bolts in short slotted holes. Structural Engineering Materials and
Mechanics, University of California at Berkeley, Berkeley, CA.
Puthli, R., and Fleischer, O. (2001). “Investigations on bolted connections for high
strength steel members.” Journal of Constructional Steel Research, 57(3), 313–
326.
Research Council on Structural Connections. (1994). Load and Resistance Factor Design
Specification for Structural Joints Using ASTM A325 or A490.
Rex, C. O., and Easterling, W. S. (2003). “Behavior and Modeling of a Bolt Bearing on a
Single Plate.” Journal of Structural Engineering, 129(6), 792–800.
Salmon, C. G., Johnson, J. E., and Malhas, F. A. (2009). Steel Structures: Design and
Behavior. Pearson Education International.
Sarkar, D. (1992). “Design of Single Plate Framing Connections.” Thesis, University of
Oklahoma, Norman, OK.
Schmidt, B. J., and Bartlett, F. M. (2002). “Review of resistance factor for steel: data
collection.” Canadian Journal of Civil Engineering, 29(1), 98–108.
Segui, W. T. (2013). Steel Design, Fifth Edition. Cengage Learning.
Sherman, D. R., and Ghorbanpoor, A. (2002). Design of Extended Shear Tabs. Final
Report, University of Wisconsin, Milwaukee, WI.
Teh, L. H., and Uz, M. E. (2016). “Combined Bearing and Shear-Out Capacity of
Structural Steel Bolted Connections.” Journal of Structural Engineering, 142(11).

95
Udagawa K., and Yamada T. (1998). “Failure Modes and Ultimate Tensile Strength of
Steel Plates Jointed with High-Strength Bolts.” Journal of Structural and
Construction Engineering (Transactions of AIJ), 63(505), 115–122.
Udagawa, K., and Yamada, T. (2004). “Ultimate Strength and Failure Modes of Tension
Channels Jointed with High-Strength Bolts.” Vancouver, British Columbia.
Wang, Y.-B., Lyu, Y.-F., Li, G.-Q., and Liew, J. Y. R. (2017). “Behavior of single bolt
bearing on high strength steel plate.” Journal of Constructional Steel Research,
137, 19–30.
Wing, P. C., and Harris, P. J. (1983). “Eccentrically loaded bolted beam connections.”
Canadian Journal of Civil Engineering, 10(2), 295–305.

96
VITA
Nicolo Franceschetti was born in Denver, Colorado to Alberto Franceschetti and
Paola Verzoni. He attended Bearden High School in Knoxville, Tennessee. He began
studying at the University of Tennessee, Knoxville in 2014 and graduated with a B.S. in
Civil Engineering in December 2017. He remained at the University of Tennessee to
pursue a M.S. in Civil Engineering with a concentration in Structural Engineering. He
plans to have a professional career as a structural engineer in industry.


![Bolted Connections[1]](https://static.fdocuments.in/doc/165x107/54e7f8c84a7959704f8b46b8/bolted-connections1.jpg)