
STREAMFLOW CHARACTERISTICS OF THE LOWER PASCAGOULA RIVER
11
STREAMFLOW CHARACTERISTICS OF THE LOWER PASCAGOULA RIVER, MISSISSIPPI D. Phil Turnipseed and John B. Storm U.S. Geological Survey Jackson, Mississippi INTRODUCTION Purpose and Scope Fresh surface-water discharge is an abundant and imponant nalUraI resource in the lower Pascagoula River Basin in Jackson County. Mississippi. but much is unknown of the real-time flow conditions (dynamic channel geometry. velocity distribution and direction. and other hydraulic characteristics) in complex estuarine and tide-affected riverine systems. The appropriate design of hydrodynamic flow models requires adequate understanding of the physical attributes of these complex flow phenomena. In November 1993. the U.S. Geological Survey (USGS) constructed a continuous-recording stage and velocity streamgage at the Pascagoula River at Graham Ferry to gain a better understanding of the effect tides from the Gulf of Mexico have on freshwater discharge in the lower Pascagoula River Basin. The Mississippi Department of Envinonmental Quality. Office of Land and Water Resources (OLWR). currently (1995) is involved in intensive environmental studies of the lower Pascagoula River Basin in cooperation with the USGS. the Mississippi Department of Wildlife and Fisheries. the Mississippi Depanment of Marine Resources. and other State and county agencies. In accordance with the goals of these studies. the USGS surveyed channel-bed cross sections. thalweg (lowest point of flow) profiles. water-surface profiles. and geographic positions on the lower Pascagoula River Basin in April and May 1994. Using state-of-the-science signal processing technology known as pulse-to-pulse coherent sonar (RD Instruments 1993). the USGS. in cooperation with the OLWR. profJ.led three-dimensional velocities using an Acoustic Doppler Current Profiler (ADCP) [the use of trnde or product names in this repon is for identification purposes only and does not constitute endorsement by the USGS) at five locations in about an 18-mi (mile) reach of the lower Pascagoula River in October 1994. Pulse-to-pulse coherent sonar technology greatly enhances the calibration. performance. evaluation. and design of hydrodynamic flow models used to simulate the complex flow in riverine and eslUarine systems. Velocity measurements made using this technology were also simultaneously compared to measurements obtained using standard USGS methods of measuring velocity (Rantz and others 1982). 258 This repon describes and presents streamflow data collected by the USGS in 1993-94 for the lower Pascagoula River. These data are correlated with data collected using conventional streamgaging methods. an ADCP to measure three-dimensional velocity profiles. and a continuous-recording acoustic velocity meter (AVM). Examples of continuous stage. velocity. and discharge relations computed for data obtained from the USGS continuous recording stage and acoustic velocity streamgage at the Pascagoula River at Graham Ferry are presented. Description of tbe Study Area The study area encompasses the lower 35 mi of the Pascagoula River in Jackson County. Mississippi (Figure I). The drainage area at river mile 0.0 (second pier upstream from the Mississippi Sound and 0.8 mi upstream of !he mouth on the left (east) bank) of the Pascagoula River is 9,498 mi2 (square miles). The drainage area at the USGS continuous recording stage and velocity gage at the Pascagoula River at Graham Ferry (station no. 02479310) at river mile 34.6 is 8.204 mi2. The length of the channel from the gage to the basin divide is about 230 mi. and the average slope of the channel between points located at 10 and 85 percent of the length upstream of the gage is about 1.6 ftlmi (feet per mile). Average channel and valley slopes in the vicinity of the gage are about 0.6 ftlm;. The drainage area of the Escatawpa River at its confluence with the East Pascagoula River at river mile 6.8 is 1,037 mi2. DATA COLLECTION Data describing streamflow characteristics were collected on the lower Pascagoula River during shon-term slUdies in April and October 1994 and collected continuously since November 1993 at the USGS streamgage at the Pascagoula River at Graham Ferry. These data were used by the USGS. other government agencies, and private interests to describe and document flow in the lower Pascagoula River during this period. The data-collection phase of this study is documented to detail not only what lypeS of data were
Transcript of STREAMFLOW CHARACTERISTICS OF THE LOWER PASCAGOULA RIVER

STREAMFLOW CHARACTERISTICS OF THE LOWER PASCAGOULA RIVER,MISSISSIPPI
D. Phil Turnipseed and John B. StormU.S. Geological Survey
Jackson, Mississippi
INTRODUCTION Purpose and Scope
Fresh surface-water discharge is an abundant and imponantnalUraI resource in the lower Pascagoula River Basin inJackson County. Mississippi. but much is unknown of thereal-time flow conditions (dynamic channel geometry.velocity distribution and direction. and other hydrauliccharacteristics) in complex estuarine and tide-affectedriverine systems. The appropriate design of hydrodynamicflow models requires adequate understanding of thephysical attributes of these complex flow phenomena. InNovember 1993. the U.S. Geological Survey (USGS)constructed a continuous-recording stage and velocitystreamgage at the Pascagoula River at Graham Ferry togain a better understanding of the effect tides from the Gulfof Mexico have on freshwater discharge in the lowerPascagoula River Basin.
The Mississippi Department of Envinonmental Quality.Office of Land and Water Resources (OLWR). currently(1995) is involved in intensive environmental studies of thelower Pascagoula River Basin in cooperation with theUSGS. the Mississippi Department of Wildlife andFisheries. the Mississippi Depanment of Marine Resources.and other State and county agencies. In accordance with thegoals of these studies. the USGS surveyed channel-bedcross sections. thalweg (lowest point of flow) profiles.water-surface profiles. and geographic positions on thelower Pascagoula River Basin in April and May 1994.Using state-of-the-science signal processing technologyknown as pulse-to-pulse coherent sonar (RD Instruments1993). the USGS. in cooperation with the OLWR. profJ.ledthree-dimensional velocities using an Acoustic DopplerCurrent Profiler (ADCP) [the use of trnde or product namesin this repon is for identification purposes only and doesnot constitute endorsement by the USGS) at five locationsin about an 18-mi (mile) reach of the lower PascagoulaRiver in October 1994. Pulse-to-pulse coherent sonartechnology greatly enhances the calibration. performance.evaluation. and design of hydrodynamic flow models usedto simulate the complex flow in riverine and eslUarinesystems. Velocity measurements made using thistechnology were also simultaneously compared tomeasurements obtained using standard USGS methods ofmeasuring velocity (Rantz and others 1982).
258
This repon describes and presents streamflow datacollected by the USGS in 1993-94 for the lower PascagoulaRiver. These data are correlated with data collected usingconventional streamgaging methods. an ADCP to measurethree-dimensional velocity profiles. and acontinuous-recording acoustic velocity meter (AVM).Examples of continuous stage. velocity. and dischargerelations computed for data obtained from the USGScontinuous recording stage and acoustic velocitystreamgage at the Pascagoula River at Graham Ferry arepresented.
Description of tbe Study Area
The study area encompasses the lower 35 mi of thePascagoula River in Jackson County. Mississippi (FigureI). The drainage area at river mile 0.0 (second pierupstream from the Mississippi Sound and 0.8 mi upstreamof !he mouth on the left (east) bank) of the PascagoulaRiver is 9,498 mi2 (square miles). The drainage area at theUSGS continuous recording stage and velocity gage at thePascagoula River at Graham Ferry (station no. 02479310)at river mile 34.6 is 8.204 mi2. The length of thechannel from the gage to the basin divide is about 230 mi.and the average slope of the channel between pointslocated at 10 and 85 percent of the length upstream of thegage is about 1.6 ftlmi (feet per mile). Average channeland valley slopes in the vicinity of the gage are about 0.6ftlm;. The drainage area of the Escatawpa River at itsconfluence with the East Pascagoula River at river mile 6.8is 1,037 mi2.
DATA COLLECTION
Data describing streamflow characteristics were collectedon the lower Pascagoula River during shon-term slUdies inApril and October 1994 and collected continuously sinceNovember 1993 at the USGS streamgage at the PascagoulaRiver at Graham Ferry. These data were used by theUSGS. other government agencies, and private interests todescribe and document flow in the lower Pascagoula Riverduring this period. The data-collection phase of this studyis documented to detail not only what lypeS of data were

collected. bUI when and how these data were gamered.Ihereby providing details that help document and betterdefine the methodology used in Ihe analysis phase of thestudy. This phase also established baseline information forfuture studies in me area.
November 1993 to Present (1995)
Since November 1993. me USGS has recorded stage.velocity. and other parameters at 30-minute intervalsthrough a Data Collection Platform (OCP) at thePascagoula River al Graham Ferry. These data aretransmilled by satellite to me USGS at 4-hour intervals.Stage is measured using a submersible transdueer attachedto the righl (west) main pier of me bridge. The transducermeasures water pressure in pounds per square inch andthen eonvens me pressure 10 feet of water and transmitsthis value to the OCP where it is recorded. Velocity ismeasured and transmilled to the DCP using an AVM whichreceives data from two transducers; one is mounted on Ihethird main pier east of the right (west) abulment. and thesecond is mounted on a pile eluster near the right (wesl)bank aboul 220 fl downstream of Ihe bridge. Dischargemeasurements are made at me site al 6-week intervals wimeilher a standard current meter attached to a soundingweight from the downstream side of the bridge or with anAOCP mounted to a boat.
April 1994
On April 19-23. 1994. the USGS surveyed me lower 35miles of the Pascagoula River to collect channel geometrydata mat ineluded channel-bed cross sections. thalwegelevations. and water-surface elevations. Cross sectionswere surveyed from a boal wim a graphical fathometer andgeoreferenced with a mapping-grade global positioningsystem (GPS). These data were then digitized for lateruse in a geographic information system (GIS). Fony-sevencross sections were surveyed including: 8 cross sections inthe main channel of me Pascagoula River; 18 cross sectionsin me East Pascagoula River; 18 cross sections in Ihe WestPascagoula River; and 3 cross sections in the EscatawpaRiver. Thalweg points were fathomed at near quaner-mileintervals along the Pascagoula River. me East and WestPascagoula Rivers. and me Escatawpa River. A total of 185thalweg points were surveyed and georeferenced withmapping-grade GPS equipment.
During the period me channel geometry was surveyed fromApril 19-23. 1994. me river at Graham Ferry (river mile34.6) increased in stage from 15.0 ft (1000 hrs (hours)central daylight lime. April 19) to a peak of 15.4 ft (1400hrs. April 21) and decreased 1015.1 ft (1200 hrs. April 23).Relative changes in stage were similar during this period tochanges in stage at Cumbest Bluff (river mile 25.4) and to
259
changes at me divergence of the river into an eaSI and westchannel (river mile 17.3).
May 1994
On May 11-13. 1994. me USGS surveyed temporarybenchmarks established during the April study usingsurvey-grade GPS equipment. This survey establishedaccurate elevations (within 2-cm (centimeter) accuracy) aswell as horiwntal coordinates geOleferenced to IheUniversal Transverse Mercator coordinate system for alltemporary benchmarks used in me April study. Thesurveyed channel geometry and water-surface slopes weremeasured in the following river reaches: (1) me moum ofthe East Paseagoula River at river mile -0.8 to thedivergence at river mile 17.3; (2) the rnoum of Ihe WestPascagoula River at river mile 0.7 to me divergence atriver mile 17.3; (3) the divergence of the East and WestPascagoula River at river mile 17.3 to the USGScominuous recording stage and velocity streamgage al rivermile 34.6; and (4) the mouth of the Escatawpa River at itsconfluence with me East Pascagoula River at river mile 6.8to river mile 2.8 on the Escatawpa River.
October 1994
On October 10-1 I. 1994. the USGS measured dischargeusing an AOCP at five locations and a Price AA standardcurrem meter at one location in about an 18-mi reach ofthe Pascagoula River. Water-surfaces elevations in thereach were also monitored during mis period. Dischargeand water-surface elevations were measured at thefollowing river locations: (I) the East Paseagoula River atriver mile 17.0; (2) the West Pascagoula River at river mile17.0; (3) the divergence of the Pascagoula River at rivermile 17.5; (4) the Pascagoula River about 0.4 midownstream of Cumbest Bluff at river mile 25.0; and (5)the Pascagoula River al Ihe USGS continuous recordingstage and velocity slreamgage at Graham Ferry al rivermile 34.6.
A total of 18 discharge measurements were made withinthe 18-mi reach during the period October 10-11. 1994.The river at Graham Ferry (river mile 34.6) was in atide-affected low-water flow condition. but runoff fromrainfall in the upper pans of basin on October 8 negatedthe tidal effect beginning carlyon October I I. The stageincreased steadily from 2.3 ft (1800 hrs. October 10) at thebeginning of the data-collection period [0 a stage of 3.6 ft(0830 hrs. Oclober 11) at the end of the data-colleclionperiod. Records at site indicate the stage peaked at 6.5 ft(1700 hrs. October 12).

where. for Ihe purposes of this repon. V is the meanvelocity in feet per second. and A is the cross-sectionalflow area in square feel normal to the direction of the flow.The law of continuity for unsteady flow requiresconsideration of time.
To gage velocity and compute continuous discharge al thePascagoula River at Graham Ferry during periods of lowflow in which unsteady flow conditions exist as a result oftidal influence on stage and velocity. two relations weredeveloped. First. acoustic transmitting and receivingtransducers were placed al an elevation of about -4 ft onIhe downstream side of the third main pier left (east) of theright (wesl) bridge seat and on a pile cluster near the right(west) bank about 220 ft downstream of the bridge andskewed aboul 47 degrees from normal to the flow (Figure3). Transducers are devices which conven electticalsignals to sound and vice versa. The AVM measures travellime of sound through water using a differential travel time.The differential travel time is determined by making twosuccessive travel time measurements on a given path ineach direction. The forward direction measurement is madeby measuring the travel time of sound from the upstreamtransducer to the downstream transducer. whereas thereverse direction measurement is the travel time of thesound from Ihe downstream transducer to the upslreamtransducer. Therefore. the arrival time of the sound signalfrom the forward direction measurement will be shonenedin proponion to the water velocity. When the velocity iszero. the forward and reverse travel times are equal. TheAVM in use at Ihis gage suppons both positive andnegalive directions of now. The relation can be bestdefined as;
METHODOLOGY
The procedure used to process and analyze the datacollecled for this repon was accomplished in three steps:( I) Channel geometry computations; (2) Unsteady flowcomputations; (3) Steady flow computations. All threesteps required Ihe use of both conventional and uniquecomputational processes 10 analyze Ihe data.
CHANNEL GEOMETRY COMPUTATION
Channel depths from channel cross sections and Ihalwegelevalions measured on April 19·23. 1994. were digitizedfrom the graphical fathomeler sttip·chans and entered intoa data base. Venical controls of water surfaces at thevarious temporary gages used in the April 1994 study werecompiled and stage hydrographs at each gage wereconsuucted for the period. Water·surface slopes werecomputed from near simultaneous readings of water-surfaceelevations along the lower 35 mi study reach of Ihe river.Water·surface elevations al each channel cross section andIhalweg point were computed by linear interpolation ofwater·surfaee elevations between appropriate temporarygages upstream and downstream of each cross section andIhalweg poinl. Channel·bed elevations were then obtainedby subtracting deplhs from water·surface elevalions at allchannel cross sections and thalweg locations.
Channel-bed cross sections were computed at thePascagoula River at the Roy O. Cumbesl bridge at GrahamFerry from a Mississippi Depanment of Transportation(MOOT) survey and discharge measurements made at thesite between 1958 and 1994 (Figure 2). A comparison ofthese cross sections indicates significant scour has occurredsince conslruction of the bridge in about 1961. Thalwegelevations in 1958. 1971. 1979. and 1994 are ·11.7. ·24.6.-28.4. and ·26.1 ft. respectively. These elevalions indicatethat the channel bed has lowered a maximum of 16. 7 fl.although scour near the right (west) pier appears to beapproaching about 25 fl.
Q= VA
TF = LI(C + l'I:osA}
TR = LI(C - l'I:osA}
(I)
(2)
(3)
UNSTEADY FLOW COMPUTATION
According to Harvey and others (l965). during periods oflow flow the Pascagoula River is affected by normal tidesin Ihe Mississippi Sound to at least river mile 42. but nOIupstream of river mile 53. Data collected at the PascagoulaRiver al Graham Ferry (river mile 34.6) indicated amaximum lidal fluctualion of 0.67 fl for the 1994 wateryear occurred during a lidal period from August 31 toSeptember I. 1994.
Chow (l959) documented that discharge (Q) in cubic feetper second for steady or unsleady flow at a given channelsection can be expressed as;
260
where:TF is travel time in the forward (downstream)
direction. in seconds;TR is traveltime in the reverse (upstream) direction.
in seconds;L is the path length between the two transducers.
in feet;C is the speed of sound. in feet per second;v is the velocity of Ihe water along the path. in
feel per second; andcos A is the cosine of the path angle from the direction
of flow.

Solving both equations for the speed of sound results in thefollowing equalion:
at an elevation of about -4 ft by the AVM transducers. Thisequation may be expressed as
LI(TF - .cosA) = U(TR + l'CosA) (4) v = 0.01 + 0.747. (6)
Because the speed of sound can be altered by temperature.pressure. and salinity. the elimination of the speed of soundboth simplifies the computation of an inslanlaneous pointvelocity and negates the need to measure other variables toaccount for changes in the speed of sound. Compensationwas also made for signal delays due to cable length. thetwo transducers. and electronic hardware with the AVM.The transducers measure inSlanlaneous point velocity andtransmit this value to the AVM which then transmits thedata to a data logger on 3D-minute intervals.
The equation is funher simplified by solving for v:
• = Ll2cosA (lITF - lITR) (5)
where V is the average velocity for the cross section. 0.0 Iis the y-offset. in feet. 0.747 is a dimensionless slopecoefficient and v is inslanlaneous point velocity. in feet persecond. For the purposes of this repon. it was assumed thatwhen instanlaneous point velocity was 0 fl/s. averagevelocity was 0 fl/s. so the 0.0 I ft offset was ignored.Because average velocity is inversely proportional to thearea for a given conSlant discharge. if area changes. thenvelocity also changes. Given this and the unsteady natureof tidal fluctuations at the gage. slope and offset maychange over time. For the purposes of this repon. thisequation to define average velocity is assumed valid for theperiod of the study.
Secondly. discharge measurements by conventionalmethods (Rantz et aI. 1982) and from an ADCP. whichtransmits acoustic pulses from a transducer assembly alongfour beams. were used to develop a relation between theinstantaneous point velocity measured by the AVM andaverage velocity computed from these dischargemeasurements. The ADCP has four transducers whichIransmil pulses of sound into the water. The transducersIhen measure the return sound as it is echoed from smallpanicles floating ambienlly with the water currents. UsingIhe Doppler principle. the ADCP convens the returnedsound into components of water-current velocity. TheADCP measures both the speed and direction of the watercurrents at multiple locations in the water column. It isbeyond the scope of Ihis repon to detail all the vectormechanics involved in how the ADCP computes itsposition through time. Comparison of near simullaneousdischarge measurements by personnel of the USGS haveshown the ADCP to measure discharge within acceptablelimits (within 5 percenl) of the measurement obtained usinga slandard current meter. Comparison of the typical curvesof equal velocity in a naturaJ. irregular' channel crosssection from Chow (1959) and a cross section showingsimilar velocity curves generated from the ADCP data atIhe Pascagoula River al Graham Ferry. on October II.1994. show good correlation (Figure 4).
A relation was developed between average velocitycomputed by dividing Ihe measured discharge by the areaand inSlanlaneous point velocity measured by the AVM(Figure 5). Discharge measurements made al 6-weekintervals. as well as those measurements made during theOctober 1994 sludy. were used to develop this relationbetween average velocily across the measured channel-bedcross section and the instantaneous point velocity measured
261
To complete the firsl relation. a stage/area relation wasdeveloped using a fathomed cross section surveyed onApril 20. 1994. Area was computed at I-ft elevationintervals to develop a stage/area curve for stages influencedby tidal fluctuation (Figure 5). Therefore. to computedischarge during periods of tidal fluctuation. the velocityrelation was used to compute mean velocity frominslanlaneous point velocity which was then multiplied bythe area determined from the stage/area curve. The productof these two variables produced an inslanlaneous discharge.
STEADY FLOW COMPUTATION
Upon observations of both the shape of the stagehydrograph and relative change of inSlanlaneous pointvelocity to stage. a slandard stage/discharge rating curvewas determined effective above a stage of about 7 ft.although the exact stage at which tidal fluctuation becomesinsignificant depends on the effect of the tide at the gageand the flow characteristics approaching from upstream.Discharge measurements made from 1958 to 1994 wereused to develop a stage/discharge rating for periods ofstage above 7 fl. Because the effect of tide on stage andvelocity at the site depends upon flow characteristics nearthe gage. a I-ft range of overlap was developed to providea correlation between the slandard stage/discharge ratingand the tide-affected discharges. Between 7 and 8 ft ofstage. inSlanlaneous discharge was computed using bothmethods to insure a smooth transition in dischargehydrographs compuled by the AVM and the slandardstage/discharge raling.
RESULTS
Continuous streamflow data as well as data for otherchannel characteristics have been collected. processed. and

computed since November 1993 at the USGS continuousrecording strearngage at the Pascagoula River at GrahamFerry. Mississippi. Analyses of the dam providestage/discharge infonnation through time at the gage. aswell as a variety of other characteristics of the lower riverreaches of the Pascagoula River Basin (Figure 5).Analyses of the dam also provide streamflow characteristicsat the gage during periods of tidal fluctuation as well asduring periods of high flow in which tidal influence isinsignificant. Channel geometry dam (that is. channel crosssections. water-surface elevations. thalweg profiles. andwater-surface profiles) were compiled and processed for thelower 35 miles of the Pascagoula River from dam collectedduring April and May 1994. Channel-bed cross sectionswere surveyed using a graphical fathometer. Each crosssection was georeferenced for entry into a GIS. Thechannel-bed cross section near river mile 34.6 was used todevelop a smgelarea relation for use in computingdischarge at the Pascagoula River at Graham Ferry.Mississippi. during periods of tidal fluctuation. These damwere provided to the OLWR. Markers were placed at thesecross sections for use in later studies.
Discharge was measured for unsteady and steady flowconditions at the gage using conventional velocitymeasuring instruments and an ADCP. Two ratings wereused to compute discharge. The product of an averagevelocity for the entire channel cross section (derived froman average velocity to instantaneous point velocity relation)and an area for a given range in gage height from I to 8 ftwas used to compute discharge during low flow periodsthat were affected by tidal fluctuation (Figure 5). Themaximum change in stage during a tidal cycle at the gagesince November 1993 was about 0.7 ft. For periods of flowabove a gage height of 7 ft. a standard smgeldischargerating was developed from discharge measurements madefrom 1958 through 1994 (Figure 5). Because someuncertainty exists as to at what stage tidal fluctuationsignificantly affects discharge. a I-ft overlap from a gageheight of 7 to 8 ft was created between the two ratings.Discharges computed by the two ratings at these smgescorrelated very well.
A flood-frequency relation (Table I) for the USGS gage atthe Pascagoula River at Graham Ferry was developed usingprocedures outlined by Landers and Wilson (1991). TheUSGS has inlenniuently collected stage and discharge dataat the site since 1958. A stage/discharge rating for stagesabove 7.0 ft was developed using discharge measurementsmade from 1959 through 1994. This rating representsnon-tidal affected discharge.
262
REFERENCES
Chow. V.T. 1959. Open channel hydraulics. McGraw-HiliPublishing Company.
Harvey. E.J.. H.G. Golden. and H.G. Jeffrey. 1965. Waterresources of the Pascagoula area, Mississippi:-u:5.Geological Survey Water-Supply Paper 1763.
Landers. M.L.. and K.V. Wilson. Jr. 1991. Floodcharacteristics of Mississippi streams. U.S. GeologicalSurvey Water-Resources Investigations Repon91-4037.
RD Instruments. 1993. Direct-reading broadband acousticDoppler current profiler technical manual. RDInstruments. San Diego.
Rantz. S.E.• et aI. 1982. Measurement and computation ofstreamflow: Volume I. Measurement of stage anddischarge and Volume 2. Computation of discharge.U.S. Geological Survey Water-Supply Paper 2175.
Telis. P.A. 1991. Techniques for estimating 7-day. IQ-yearlow-flow characteristics for ungaged sites on streamsin Mississippi. U.S. Geological SurveyWater-Resources Investigations Repon 91-4130.

Table I.-Elevalion. peak discharge. and recurrence interval of annual floods al the Pascagoula River at Graham Ferry.Mississippi
Elevations(feet above sea level)
16.417.718.419.219.820.4
Peak discharge(cubic Ceet per second)
71.300109.000138.000174.000206.000242.000
Recurrence interval(years)
25
102550
100
Low-flow data were computed using procedures outlined by Tetis (l991). The 7-day. Io-year low-flow discharge (7QIO)Cor the Pascagoula River at Graham Ferry is 1.140 cubic Ceet per second. This 7QIO neglects any tidal influence at thebridge.
263

Figure 1. Study area location on the lower Pascagoula River.264
Agricolao
88"30'._._._._._._._._._1_._.- -rMerrill :
!IiI
GEORGE i
Mississippi Sowui
JACKSONr---"r-_--.
INDICATES DISTANCE. IN RIVERMILES ABOVE MOUTH
STUDY AREA
o 2 4 6 8 IOMll..ESI I ! I I II i j i i
o 2 4 6 8 10 Kll..OMETERS
60
~ GAGING STATION
EXPLANATION
STONE L-._._.Iii_._._._.j-·-·-·-·-·-·-·-·-·-·-·T·-·-·-·-·'
3f 00·....,...·_·_·_·_·Ii
89'00' i~. ·_._._._._._._._._._._._._._1 _._._._.__._.1i ~ Ii ~.f iI oW~m ii ii

5.0004.7004,4004.1003.800
-30 I I I I I I
3.500
30
....lUJ>'
20 I LEFT (EAST) BANK RIGHT (WEST) BANKUJ....l<t:UJ
IOL",-"::,,, .. ,.'
.............CI)
"W '"'''''''''' .......>'0~
<t:.-:
0UJ[E~
......, , ., . 1958
Z ..._--_... 1971'" -10'" 0V> ...... --- 1979
~ -, ,>' 1994 tUJ
til -20 •
HIGHWAY STATIONING. IN FEET
Figure 2. Cross sections from soundings make during historical and recent discharge measurements at thePascagoula River at Graham Ferry. Mississippi.

@
GAGE HOUSE
220'
LOCATION OFSUBMERSIBLESTAGE SENSOR
I - TREATED TIMBER PILE CLUSTER
@ @
(f
ACOUSTICVELOCITY (AVM)TRANSDUCER
,,,,,,,,,,,",,,ti
j
,,''5.~
" ~«t-", ~,,,,,,,,,,,,,
)~OW
TREATED TIMBERS, PILES, AND FENDERS
WADE5 MILES
)ID _====)@/ - BOAT I IIPIER RAMP \
NUMBER
•~
o 25 50 FEETI I II I
o 25 50 METERS
Figure 3. Plan view of U,S, Geological Survey continuous recording stage and velocity streamgage at the PascagoulaRiver at Graham Ferry, Mississippi, showing locations of submerged transducers,
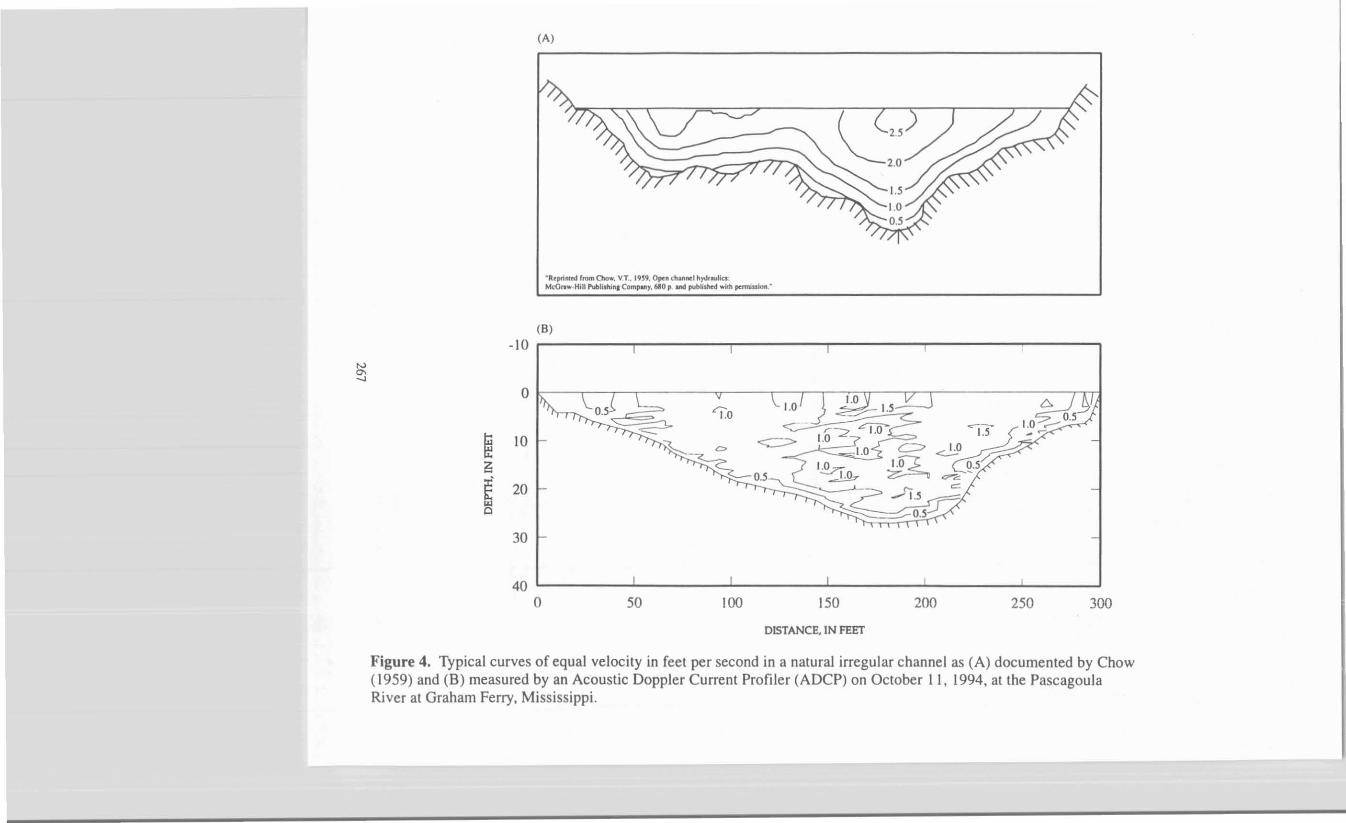
Figure 4. Typical curves of equal velocity in feet per second in a natural irregular channel as (A) documented by Chow(1959) and (8) measured by an Acoustic Doppler Current Profiler (ADCP) on October II. 1994, at the PascagoulaRiver at Graham Ferry, Mississippi.
(A)
300250200
~252.0
15010050
DISTANCE,IN FEET
20
10
(B)
ok i I I V I' I .nll 17' Illl
"Rtpl'illleel from Chow. VT.. 19n. Optll dlalllltl h)'dr.ulla:McGr.....·HlII P\lblhtlill' ComPM1. 6110 P and pub~ihed with ptnniuloll:
30
40 ' i I ! ! ! ,
o
-10iii I i I
~!;
~
~--l

31.00
21.00
11.00
'.00
3.00
I:~1.101.60UOI.'"
1.30
1.20
1.10
,,
,,
;:-
100 1,000 10.CXXI IOO.CXXI I.CXXI.CXXI
DISCHARGE, IN CUBIC FEET PER SECOND
"r--~-~-~----------------'
10 0z ,~
//~ ..... ..
w • If>::I
~~ ,w~ i5w>
~u
0..~
"Iii
/Il! , >w
i5 0
Z ~ u0 w
~ 1 / ~> /~ /
• ,'''''' 6JlOO ,"'" """ ."'" , u u .. ..
CROSS·SECTIONAL AREA. IN SQUARE FEET INSTANTANEOUS VELOCJTY. IN FEET PER SECOND
Figure S. Stage/discharge relation, stage/area relation, instantaneous point/averagevelocity relation used to compute discharge at Graham Ferry, Mississippi.
268


