Stratos hssd tech manual
48
Technical Manual Issue 2.4 Quality system cert. no. 404 Assessed to ISO 9001 afp-813
-
Upload
hans-bronkhorst -
Category
Technology
-
view
16 -
download
1
Transcript of Stratos hssd tech manual

Technical ManualIssue 2.4
Quality system cert. no. 404Assessed to ISO 9001
afp-813

World Patents Pending ©AirSense Technology Ltd. 1999
ISSUE 2.4Page 2
T E C H N I C A L . M A N U A L
Introduction 3Background 4
Heat Detectors 4Ionisation Detectors 4
General Optical Detectors 5Beam Detectors 5Light Scattering Detectors 6Light Sensing Detectors 6Point Detectors 7High Sensitivity Aspirating Systems (a.k.a. Air Sampling Systems) 9Specific types of Aspirating Systems. 11Particle counters 12Light scatter (mass detection) systems 12Light sources 13
Absolute v. relative scaling 15Absolute Scaling 15Relative Scaling 16
Stratos-HSSD® 17Description 17Histograms and Learning 17Dust 19Bargraph Scale 20Power Supplies 21Using an external power supply 21Chart recorder analogue output 22
Examination of referencing systems 22Stratos detector referencing 32Local and remote referencing 34Terminal board jumper link connections 35
Apollo Series 90 Interface 35Autronica BNX-3 36Thorn AM521 37
Remote control software 38Using the remote control software 38Setup menu 38Demonstration and log menu 40Diagnostic menu 41Chart recorder format 42Histogram format 43Product id numbers 43Remote monitor format 44Remote monitor programming API 45Chart recorder sample rates 46
PipeCAD™ for Windows 47Sampling Pipe Modelling Program 47System requirements 47Installation 47
World Patents Pending ©AirSense Technology Ltd. 1995
Contents
Produced by AirSense Technology Publications.Written by Mark Symonds - Technical Manager, Kit Girling, Technical Director
© AirSense Technology Ltd. 1999No part of this Technical Manual may be reproduced, copied or transmitted by anymeans without the express written permission of AirSense Technology Ltd.
T E C H N I C A L . M A N U A L

World Patents Pending ©AirSense Technology Ltd. 1999
ISSUE 2.4 Page 3
T E C H N I C A L . M A N U A L
Introduction There are now several air sampling smoke detection systems on the world Fire
Protection market that operate at ‘High Sensitivity’ levels as defined by the tests
described in BS6266 1992. The AirSense Technology Ltd Stratos-HSSD® detector is
at time of writing, the latest entry in this field, and is designed to overcome many of
the shortcomings found in other systems. In order to understand Stratos it is useful to
have a cursory knowledge of the fire detection systems that preceded it, whether point
detectors, large area detectors or other aspirating smoke detection systems.
It is a truism that early detection of fires is the key factor in preventing them from
developing. The earlier they are detected and extinguished, the less damage will be
caused. It is not until one looks at the evolution of detection systems that one can see
where such a simple truism can lead. The major requirement of any system is,
obviously, to detect fire, but, not quite so obviously, to not give a warning when no
fire occurs! The problem of unwanted alarms is a major one; for instance frequent call
outs to deal with non-existent fires can lead to a tendency for alarms to be ignored.
Unwanted alarms, from whatever cause, can largely negate the usefulness of any
alarm system and for this reason the ability to not give unwanted alarms must be rated
as high in importance as the ability to signal a true alarm.
United Kingdom01462 440666
Netherlands+31 1825 635696
Finland400 652131
Australia(08) 618 8443 9625
Help Lines & AirSense Technology has taken every care to ensure that Stratos is as simple to install as
possible, but in case of difficulty please contact our Help Line to ensure trouble free
installation.
About the author
The author has been involved for many years with the design of various successful fire
detection products. For many years he was also Electronic Engineering Manager of the
Company that first imported High Sensitivity aspirating Smoke Detection products to
Europe from Australia. He was subsequently involved in making this earlier generation
system suitable for application in the European fire market and developing differing
variants of this system. Since February ’93, Kit Girling has been responsible for leading
the design team that has developed the Stratos-HSSD® system.

World Patents Pending ©AirSense Technology Ltd. 1999
ISSUE 2.4Page 4
T E C H N I C A L . M A N U A L
Many principles have been used to detect fire and are still in use, although some are
only used in special applications. The following comments describe some of the more
commonly used principles:
All fires give off heat, and sensing the temperature of the air at a given point in a given
zone can indicate the presence of a fire occurring in it. The method is simply to sense
if the temperature rises above a pre-determined trigger level and give a warning. If the
trigger temperature is low, relatively early warning can be given. Unfortunately an
unwanted alarm could be generated by heating systems being switched on or a heat
wave occurring, taking it above the trigger temperature. If the trigger temperature is
high, the fire may be well alight before warning is given. Such a system is unlikely to
be ideal in many applications.
In order to improve on this situation, the ‘Rate of Rise’ temperature detector is more
often used. These sensors do not measure the actual temperature, but the rate at
which it increases. In this detector, the background temperature is largely ignored, but
if the rate at which the temperature rises is greater than a given amount, it is assumed
that this is due to a fire. Unfortunately, for general use, the unwanted alarm conditions
still occur even if not so readily as with the simple heat detector; also the fire must be
well alight to generate the rates of rise of temperature required to trigger them.
Heat detectors must either be strategically placed with respect to potential fire sources
or have a very high placement density in order to be effective. The heat of the fire must
also be transmitted to them rapidly.
Carbon products are given off in the form of smoke and gasses when a fire occurs. If
a small sample of air is ionised by means of a radioactive substance, then the ions will
allow a small electrical current to flow between two electrodes placed in the sample.
If the combustion products mix with the air in the sample then they will inhibit the
movement of the ions that then as a result de-ionises, and the electrical current will
decrease. This is the operating principle of the Ionisation detector. A low concentra-
tion in the air of the products of combustion is required to effect a detectable change
in the current, and this can make the detector quite sensitive. Unfortunately the
current is also effected by draughts in the air and to a lesser degree by humidity,
atmospheric pressure and temperature. Although these unwanted effects can be
Background
Ionisation Detectors
Heat Detectors

World Patents Pending ©AirSense Technology Ltd. 1999
ISSUE 2.4 Page 5
T E C H N I C A L . M A N U A L
minimised, the combination of them, and the very small nature of the ionisation
current (10 - 50 picoamps), limit the sensitivity and usefulness of ionisation detectors.
It should also be noted that the use of radioactive elements is generally frowned upon
by today’s society because of the difficulty in safely disposing of them. The main
advantage of this type of detector is its simplicity of manufacture and low cost.
General Optical Detectors
The standard used for measuring the concentration of smoke in air is the amount of
attenuation it will cause in the intensity of a light beam shining through it, usually
expressed as ‘percent obscuration per metre’. When the smoke is invisible, such as that
which can effect an ionisation detector, then a correlation is derived between the
different types of smoke, visible and invisible. The measurement units for optical
detection systems always end up as ‘percent attenuation per unit length’ because they
can be translated into an accurate laboratory measurements.
The different principles of Optical detection are described below.
A simplified adaptation of the laboratory meter described above immediately becomes
interesting as a smoke detector. The laboratory instrument itself is costly to manufac-
ture, and is impractical as a commercial smoke detector due to calibration problems
in an industrial situation. In order to make it commercially viable, the specification
must be changed so that dust build-up etc. does not cause unwanted alarms. A large
attenuation of the beam is required (typically 30 - 50%) and consequently it needs to
cover large areas. The attenuation in light is achieved by several means, but a
commonly used method is to shine a collimated light beam through many metres to
a reflector from which the light is reflected toward a light sensor near the beam source.
Smoke occurring in the beam will attenuate its intensity, and this reduction in intensity
will be used to trigger an alarm. Such a system is also good at detecting mist, steam
or dust, also anything that may physically interrupt or reduce the beam intensity. Dirt
build-up on lenses and reflectors have been known to cause serious problems, as have
normal movement in buildings caused by temperature changes and wind.
Beam Detectors
World Patents Pending ©AirSense Technology Ltd. 1999
ISSUE 2.4Page 6
T E C H N I C A L . M A N U A L
Another type of optical detector is immediately suggested by the beam detector, when
one considers what happens to the light in the beam that is not returned to the sensor.
Very little of this light will be ‘absorbed’ (e.g. translated to another energy form). Most
of it will be scattered out of the light beam, and hence not returned to the sensor. The
suggestion is, that if the scattered light itself is sensed, its intensity would be a direct
measure of the scattering medium or smoke. This principle is used very successfully in
many detectors although it is more expensive to realise than an ionisation type detector,
but gives a more reliable and potentially more sensitive detector.
A second type of optical light scattering detector uses a tightly focused laser beam to
produce pulses of light which are scattered from individual particles in an air stream
passing through the point of focus of the laser. This is the ‘particle counter’ detector,
which was originally designed for monitoring the quality of Clean Rooms (microelec-
tronics and pharmaceutical manufacture and research). For smoke detection it is only
viable when used in an aspirating system.
Light ScatteringDetectors
Most fires will generate light of one sort or another, infrared light being the most
prominent. Extremely sensitive infrared cameras are available, which could be used in
an alarm system. Such cameras are not used due to their high cost and the problem of
identifying the position of a fire but they could provide a means of identifying very small
temperature rises. The source of heat must be visible to the detector, either directly or
by reflection. This is not the case though with most other types of detector. A simplified
version that did not produce an image could be acceptable for fire detection although
it would not pinpoint the source of the heat in the same way that a camera would.
A flaming fire will produce a flickering ultraviolet light, and an ultraviolet sensor can be
used to detect it while also discriminating against other sources of ultraviolet, arc
welding for example, by means of the flicker rate. When materials burn they produce
light of different colours depending upon the elements that constitute the material.
These colours are produced in certain proportions and sensors can be made selectively
responsive to these colours by means of colour filters. By sensing the colours of light in
the required proportions an alarm can be triggered. The response time of such a
detector can be extremely rapid.
Light sensing fire detectors tend to have specialised uses, furthermore, although the
Light SensingDetectors

World Patents Pending ©AirSense Technology Ltd. 1999
ISSUE 2.4 Page 7
T E C H N I C A L . M A N U A L
response time to fire may be rapid enough to detect flame within a few milliseconds,
most fire situations will progress through a relatively long smouldering period, and
generally light sensing detectors are either not sensitive to this stage or are inefficient
at detecting it.
There are many variations on these principles, they are also used with varying degrees
of technical expertise in order to suit different markets and applications. In general the
sensitivity and reliability of a detector, of whatever principle, can be improved with an
increase in cost. The large majority of detector designs are ‘point’ type, for either
consumer or commercial use, where, due to the highly competitive nature of the
market, costs have to be kept to the minimum. In the great majority of cases, detectors
are operated from a remote control unit, and one control unit will usually have many
detectors connected to it. The control unit provides the power necessary for them to
operate and itself operates fire sounders, automatic signalling to a remote centre (e.g.,
the Fire Brigade), fire extinguishing systems, etc. It normally indicates the signals it is
receiving from the detectors by means of lamps but the use of special PC programmes
to display more comprehensive information, is becoming more common.
This is the name given to the type of detector normally found in most buildings
distributed on the ceilings. A point detector depends upon normal air currents and
convection to carry the smoke, products of combustion or heat to it. For this reason,
the volume covered by the detector is limited. Where large volumes need to be covered,
more detectors are used and in very large volumes a great many detectors may be
required to provide complete coverage. There needs to be more than one tier of
detectors for very high volumes.
In the earlier days of such detection, all these detectors were wired in parallel on a single
pair of wires from a control panel. The wires provided electrical power to the detector
and also carried the alarm signal. The cost of the wires makes a significant contribution
to the total cost of the installation. Since the system must continue running during a
mains power failure, back-up batteries are required to take over at such times. The
capacity of the batteries will depend upon how much power each detector needs to run
it. In order to keep the size and cost of batteries low, point detectors are designed to
draw very low currents.
Point Detectors

World Patents Pending ©AirSense Technology Ltd. 1999
ISSUE 2.4Page 8
T E C H N I C A L . M A N U A L
Any detector on the pair of wires which signals an alarm is signalled back to the control
panel. This type of control panel is unable to say which of the many detectors had
operated, so the signalling is only ‘zonal’. Later developments use an addressable system
whereby the detector is given an coded unique identification which forms part of the
signal back to the control panel. The control panel can identify which of the detectors
(or other alarm device) on a given pair of wires is signalling. The detector can also signal
back more information than a simple alarm state, for instance; it can signal back that it
has a fault or pre-alarm condition. This has the effect of allowing the ‘pinpointing’ of
which detector has given the alarm and it also allows rapid identification of certain faults
in a detector.
Since a large number of detectors is often needed in a point detection system, the cost
of each unit must be kept within tolerable limits. In order to do this the design is kept
reasonably simple and the performance is consequently comparatively modest com-
pared to that possible with modern technology. In addition to this, National Standards
always demand a limit to maximum sensitivity of these devices in an effort to reduce
unwanted alarms. Point detectors are usually set to give an alarm at a smoke density
corresponding to between 2% and 4% obscuration per metre. Although they are
capable of signalling a fault condition, they will not signal the occurrence of every
possible type of fault.
Although these detectors often provide quite adequate protection, the probability of
them giving an unwanted alarm could, in some cases, be lessened by a more costly
design, and the sensitivity could be increased if cost were no object. Their general
performance reliability, although good, may not be as high as that required by a person
wishing to protect a very valuable property, and a higher sensitivity would certainly give
an earlier warning. Where very valuable property is to be protected by point detectors,
or where certain fire extinguishing systems are to be automatically released, two
different types of point detector are commonly used in a ‘coincidence’ (or ‘double
knock’) configuration. This configuration requires an alarm to be indicated by both of
the detectors before it is accepted. Since two detectors of the same principle would be
equally susceptible to the same source of unwanted alarm, usually they are of different
operating principles, e.g. a heat detector and an ionisation detector. The probability
that such a configuration will give an unwanted alarm is very much less than with a single
detector. Normally detectors are specially selected to suit the hazards in the volume they

World Patents Pending ©AirSense Technology Ltd. 1999
ISSUE 2.4 Page 9
T E C H N I C A L . M A N U A L
are protecting; to give a rapid and sensitive alarm. The price paid for this degree of
certainty is the time delay required for both detectors to trigger an alarm and the
effective sensitivity are reduced to that of the least suitable detector of the pair.
Where a large volume is to be covered or an area is to be covered at a high sensitivity;
instead of using many low cost, inherently low sensitivity point detectors, an Aspirating
system may be used. Such a system consists of a single, more sensitive and highly
developed detector and an air sampling system to cover the required volume. The air
sampling system consists of a length or lengths of pipe with strategically placed
sampling holes along its length. An air impeller is used to draw air along the pipe from
the sampling holes and through the detector measuring chamber. The transit time for
air to travel from the sampling holes to the detector head can be significant, so there
must be significant advantages to this system to offset this delay. The detector is
designed to be stable, reliable and highly sensitive (approximately 10 to 200 times the
sensitivity of a point detector). Such additional sensitivity allows the detection of smoke
at a very much earlier stage in the development of a fire, and as a consequence, this may
reduce damage levels considerably. This saving of time more than offsets the delay due
to the transit time.
Aspirating smoke detectors are susceptible to considerable dilution of smoke in the air
sample, and it is important that this effect is understood. For example, if it is assumed
that a detector chamber has a typical sensitivity of 0.1%/metre obscuration, and it is
drawing its sample through ten holes in the length of pipe, and that each sampling hole
contributes equally to the volume through the detector measuring chamber, then if
smoke only effects one of the sampling holes, then, due to dilution from the other 9
holes, the actual detector responsiveness will only be equivalent to a 1% detector. If
however, say 5 of the 10 holes are effected by smoke, the apparent sensitivity will be
0.5%/metre. The more widespread the distribution of smoke among the sampling
holes, then the higher will be the density of smoke appearing in the chamber, and the
apparent sensitivity will be greater. Sampling pipe design should take this effect into
consideration.
The action of pulling air into the air sampling system gives a better smoke collection
method than the naturally occurring air convection relied upon by point detectors, and
the sampling pipe systems frequently allow the sampling holes to be strategically better
High SensititivityAspirating Systems(a.k.a. Air Sampling
Systems)

World Patents Pending ©AirSense Technology Ltd. 1999
ISSUE 2.4Page 10
T E C H N I C A L . M A N U A L
placed, for example in an air extraction system or within smoke strata which may be
anticipated.
.
A high sensitivity aspirating detector can cover the same volume as many point
detectors, but with added advantages. Economically speaking this allows more money
for the cost of the detector, which, in turn allows it to be designed to be considerably
more sensitive, but with the added advantages of being considerably more stable. The
removal of stringent economic factors also allow a higher degree of repeatability in
performance with a similar reliability to a great quantity of point detectors.
The added advantages of an aspirating system make it the natural choice where very
reliable performance is required. The ability to use a very sensitive system is an
advantage for protecting very clean environments such as computer rooms or micro-
electronics or pharmaceutical manufacturing clean rooms. The air sampling inlets can
be very nearly invisible which makes them ideal for use in historic buildings, where point
smoke detectors would detract from the appeal of the building. Other important
applications are found where their specific properties include; museums, art galleries,
warehouses, telephone exchanges, penal establishments, dusty or dirty areas, unusually
hot or cold areas, areas with high levels of radio energy, atrium buildings, etc.,
The detectors used in successful aspirating systems in recent times, have nearly all been
designed to work on the optical, light scattering principle. There is still one produced
in the UK that uses an Ionisation chamber and another is available from USA that uses
a variant of the Optical principle called a Wilson Cloud Chamber.
The improvements in sensitivity make the optical detector capable of detecting invisible
quantities of smoke. One of the advantages of their very high sensitivity is that indication
occurs so early that it is of a potential rather than an actual fire. This allows corrective
action to be taken long before an extinguishing action is needed, or indeed, could be
effective. This fact alone translates into savings in the cost of extinguishing agents and
the possible damage its discharge could incur. Also, some of the most common
extinguishing agents are Halons (halogenated hydrocarbons). The manufacture of
these materials is being curtailed because of its damaging effect on the Earth’s ozone
layer.
World Patents Pending ©AirSense Technology Ltd. 1999
ISSUE 2.4 Page 11
T E C H N I C A L . M A N U A L
Thus the air sampling system can overcome most of the disadvantages of other
detection methods, but tend to be economically designed to the limit of the market.
(i.e. The design maximises the possible performance advantages on the assumption
that the customer will pay more for them.)
There are many aspirating systems available around the globe, although there are only
three generally available High Sensitivity aspirating Detection systems in common
usage. It is known that there are a few products under development at this time which
may become available in this rapidly expanding market sector. In definition of the term
High Sensitivity, this is taken to mean that the system is capable of detecting the
electronic fire simulations described in the appendix of BS 6266 1992. All three
detectors have essentially similar levels of sensitivity, with no single product having any
great advantage over the other in this aspect. Interestingly, all three detectors use the
Light Scattering principle of operation, but each in a different manner; One uses a
Xenon flash bulb as its light source, whilst two take advantage of the very reliable
semiconductor laser (in this application, Mean Time Between Failure can be in excess
of 1000 years). Of the two laser based products, one is a particle counter, whilst the
other is responsive to the Mass of airborne material over a wide size range rather than
the number (count) of particles.
A potential problem with High Sensitivity Smoke Detectors is the possibility of alarm
signals being given by dust particles. This problem is dealt with in various ways
depending upon the actual system and its detection principle, but it is usually at least
partly dealt by an air filter of some description on the assumption that dust particles are
physically larger than smoke particles. The two laser based systems also use dust
discrimination to enhance this effect, although both do so in differing manners. It is also
useful to understand that there is an unfortunate effect whereby the more a filter
becomes clogged with dust, the smaller the particles are which it will remove out of the
air-stream. This is can be a very serious shortcoming, because air will still flow easily
through the filter when the size of particle being stopped is the size of smoke particles.
Specific types ofAspirating Systems.

World Patents Pending ©AirSense Technology Ltd. 1999
ISSUE 2.4Page 12
T E C H N I C A L . M A N U A L
Particle counting works on the principle of counting the number of particles in a given
volume of air sampled. In order to do this, the rate of air-flow through the chamber must
be maintained within limits, or the effect of increased counting due to increasing the
air-flow must be allowed for.
The method used is to focus a laser beam into a very small volume in the air-stream and
measure the light scattered by a particle entering this volume. This will give a light
scatter pulse of a duration and size proportional to the size of particle. By its very nature
it is an absolute measuring instrument, i.e. its reading is the number of particles per unit
volume; it is not relative to anything. At first sight this appears to be a point in its favour,
and for measuring the impurity of air in a clean room it certainly is. It should be taken
into consideration though that the smoke level that is indicative of fire is not absolute,
it may be any level depending upon the normal amount of smoke present. The increase
in the count rate above normal is an indication of unusually large numbers of particles
being present. The size of the particle being counted is not a prime factor in the count,
since either a very large particle, or a very small particle will increase the count by one
unit.
It is assumed that dust particles are larger than smoke particles, and the particle counter
can give a signal indicative of particle size and the system may be set to ignore those
above a certain size. In relatively clean environments this may entirely obviate the need
for a filter. Unfortunately, the size of a fire can only be accurately measured either by the
weight or volume (mass) of smoke particles emitted and not the number of particles.
A particle counter will reach saturation when the rate at which it is required to count
particles is beyond its capability. This can be near the normal amount of smoke present
which includes dust particles when they are present.
These systems look for the amount of light scattered by a stream of air through an
optical chamber. With perfectly clean air there is a very small amount of scatter.
As the volume of particles below a given size increases, the amount of light scatter
increases. Measuring the amount of scatter thereby gives a measure of the volume
of impurity in the air. This has a direct relationship to the size of the source fire.
The ultimate limit to the sensitivity of such a detector is set by the amount of
electrical noise being generated by the sensor, the light source and their associ-
ated circuitry. This is because the system must be able to differentiate between the
Particle counters
Light scatter (mass detection)
systems.

World Patents Pending ©AirSense Technology Ltd. 1999
ISSUE 2.4 Page 13
T E C H N I C A L . M A N U A L
true signal given by smoke, and the noise signals with sufficient reliability to
prevent an alarm being triggered by the electrical noise. The amount of light
scattered by a given volume of particles is highly dependent upon the wavelength
of the light, with the amount of scatter increasing rapidly with a decrease in
wavelength. The direction of scatter is determined by the relationship between the
wavelength of the light and the particle size and shape. This is particularly the
case with large particles. It is however of great importance to note that all shapes
and sizes of particle give a large amount of scatter in the forward direction, that is,
scatter that diverts light only a few degrees from its original path. Detectors that
rely primarily on small angle scatter will be sensitive to a wide range of particle
sizes, almost irrespective of the wavelength of light.
One type of aspirating detector, developed in the late 1960’s (although reaching the
market in the ‘70’s) uses a Xenon flash bulb as the light source. This gives a very wide
spectrum of light output extending into very short wavelengths, well below the visible
spectrum. The intensity of scattered light at these wavelengths is high but is only of use
when a light sensor is used which is sensitive to them. The best response of normal
silicon light sensors, as is used in this detector though, only covers the visible spectrum
and the light at longer wavelengths. The advantage promised by the broad spectral
light output is lost.
Other, more recently developed types use semiconductor lasers giving 5 to 100 mW.
of light power. The types used are monochromatic coherent light sources at the red
end of the visible light spectrum. The coherent wave front of a laser beam allows
excellent manipulation of it by lenses. This does not, at first sight, appear to be a
promising light source, but, as pointed out below, can be entirely satisfactory.
Light emitting diodes can give similar light powers to a semiconductor laser and are also
nearly monochromatic. They are very much cheaper than lasers, however they do not
provide a coherent light source and are usually only (able to be) used in point detectors.
An unfortunate characteristic of Xenon flash tubes is a deterioration of light output over
time. Very expensive tubes can be obtained where this effect is reduced to a minimum,
but they are neither commercially viable or used in this application. This deterioration
Light sources
World Patents Pending ©AirSense Technology Ltd. 1999
ISSUE 2.4Page 14
T E C H N I C A L . M A N U A L
provides a very difficult problem to overcome where a detector is intended to behave
as an absolute measuring instrument. Due to the deterioration in light output, the
signal will deteriorate to a commensurate degree, requiring the detector to be
frequently re calibrated. The high electrical noise generated by a Xenon tube will offset
the large signals it generates, and the promise of high sensitivity is not fully realisable.
The light from a Xenon flash tube is impossible to focus into a tight beam and it is not
possible to detect much light scattered at small angles from a wide angled beam.
However, complex (dust accumulating) iris systems in the light sensors viewing path
can allow a reasonable signal to be obtained from light scattered at larger angles. The
Xenon flash tube has a high energy requirement for its drive, which is a disadvantage
when intrinsically safe systems are required, or when a system runs from its stand-by
battery source. As a consequence, although at first sight the Xenon lamp looks ideal as
a light source, it has problems that effectively rule it out as a technically viable one with
the advent of semiconductor lasers. Although future developments could conceivably
change this situation, it is difficult to envisage that the effort required would be practical
or cost effective when the alternative of a laser exists.
The semiconductor laser is at present the subject of many semiconductor manufactur-
ers development programmes because of its application in printers, compact disc
players photo- copiers and fibre optic systems. These are expanding markets and auger
well for future improvements in cost and performance. Using a laser as the light source
in a smoke detection chamber has immediate advantages and disadvantages when
compared with a Xenon flash tube. The main disadvantage is that it gives light at a single
wavelength and this is at the long wavelength end of the visible spectrum, where the
amount of scatter signal is low. However, the single wavelength, coherent light source
that it provides, can be focused to a very tight beam allowing light scattered at very
small angles to be sensed without complex iris arrangements. This may be seen to more
than offset the disadvantage of the low intensity of scatter at these wavelengths, since
the intensity of scatter at small angles is consistently comparatively high, regardless of
particle size. Practical signals can be obtained, as with the Xenon flash tube, for particles
down to large molecule (gas) size. The semiconductor laser gives a consistent intensity
of light output with time and, when it is correctly driven, has an extraordinary length
of life. These advantages score heavily in a competition against the Xenon flash tube.

World Patents Pending ©AirSense Technology Ltd. 1999
ISSUE 2.4 Page 15
T E C H N I C A L . M A N U A L
Absolute Scaling The output of the smoke detector in the conventional aspirating smoke detector system
is assumed to be (essentially) zero for a clean air sample and a fixed known level for a
given amount of smoke pollution. It is, in effect, a meter giving an absolute measure-
ment of ‘smoke-like’ pollution. The full scale reading may be set to a minimum of 0.05%
obscuration per metre which makes it very sensitive. A usual full scale reading is between
0.1 - 0.2% obscuration per metre. The zero of the scale corresponds to zero pollution.
There are only a few applications where the air is totally free of pollution. There is
normally a constantly varying amount of background pollution. With the ‘Absolute’’
type of detector the alarm levels must be individually set to trigger at the desired level.
The correct level is one that will be reached by as low an amount of pollution as is
possible without being reached by the normally occurring background variations.
Alarms triggered by the normal background amounts of pollution will be unwanted
alarms which, as previously explained, must be avoided. The background levels will vary
according to the time of day and the particular activities in the protected area. The
requirement then, is to find what are the appropriate levels to set the pre-alarm and
alarm triggers points. In order to do this the detector output is used in the following way:
Smoke is sampled during the normal usage of the system for a period of 10 to 14 days,
and a chart recording of the levels against time is generated. This chart is assumed to
represent reasonably the future variations that will occur. The chart is examined for high
smoke levels during both the day and the night periods, and the pre-alarm and alarm
levels for day and night usage are both set to be higher than these respective peak levels.
The importance of avoiding unwanted alarms is so great that the trigger levels are
routinely set, as a matter of judgement on the part of the installer, to be well above the
peak levels, in case the chart recording is not truly representative of the future readings.
The aim of the exercise is to set the trigger levels at a point where the probability of an
unwanted alarm is very small and where there is still a high probability of detecting
unusually large signals.
There are a number of problems with the absolute scaling system;
n The background level does not always vary as it did during the first two weeks after
installation.
Absolute v. relative scaling

World Patents Pending ©AirSense Technology Ltd. 1999
ISSUE 2.4Page 16
T E C H N I C A L . M A N U A L
n The peaks indicated on the chart recorder may correspond to levels that should have
triggered an alarm.
n The two weeks required for setting it up are inconvenient and are hence frequently
omitted or reduced, and the alarm trigger levels set at a ‘safe’ level (i.e., ‘safe’ from
unwanted alarms where the system is comparatively insensitive).
As with all very sensitive equipment, variations in the detector zero point and sensitivity
will occur, and these variations must be taken into account in the installer’s judgement,
when setting the trigger levels. An arbitrary element is contained in this procedure, and
it is unlikely that two different installers will set the same trigger levels.
An alternative method of setting the detector scaling is to determine that zero on the
measurement scale will correspond to the mean (average) of the background level of
pollution, and the full scale point set a given amount above the alarm trigger level. The
alarm trigger level with this method is set by performing a continual statistical analysis
of the background pollution and continuously calculating the level at which a given
probability of a signal occurring is acceptably low. Such measurements and calculations
are well within the capability of the modern micro-processor, and all that is required is
a suitable method. Since the zero and full scale points are set relative to the background
pollution levels, this makes the detector inherently more suited to its specific environ-
ment. It also makes the movements of the detector’s output for zero pollution
immaterial since it is constantly defining its own scale. However, since the scale is set
according to a history of constantly changing background environment, the method
of implementation must place a limit on the duration of the history. For example, the
background level readings taken thirty days ago are likely to be considerably less
significant than the readings taken thirty minutes ago. This method is basically an on-
going ‘learning method’, and to be successful it must ‘learn’ logically. There are a
number of minor problems with this method but all of them may be successfully
overcome by using a micro-processor, in fact the micro-processor becomes the centre
of the detector, governing all its procedures and actions.
Relative Scaling

World Patents Pending ©AirSense Technology Ltd. 1999
ISSUE 2.4 Page 17
T E C H N I C A L . M A N U A L
Stratos is a relatively scaled detector designed around a modern microprocessor of the
same family as that used in Personal Computers. The detector chamber is based on the
light scattering principle with a high power semiconductor laser used as the light
source. The detector operates on the forward scattering detection principle and is
responsive to a wide range of particle sizes. Both dust discrimination and filtration
techniques are employed, which makes the system virtually immune to problems
caused by dust pollution. The problems encountered in its design, their solutions and
the general method of implementation, are listed below.
Histograms and LearningReadings from the detector chamber(s) are obtained by the micro-processor at the
average rate of once per second. A continually updated histogram is generated from
the detector(s) output, in which the histogram classes contain the percentage of
readings taken between different signal levels. The classes cover all possible readings
that may be obtained, and it shows the distribution of signal levels. From the histogram
the Standard Deviation and Mean of the distribution are continually calculated. A
decaying factor is used in the build up of the histogram. The effect of the decaying factor
is to limit the past time period or historical period that is represented by the histogram,
it also sets the time which the histogram requires to become truly representative of the
distribution. The method for doing this is an AirSense Technology Limited patented
process called ‘ClassiFire’. If the ClassiFire factor is set so that the a fully maintained
histogram always represents a history of the last ten hours, then it will take ten hours
running from the initial set up to build up a representative histogram. Similarly, a factor
used to make the histogram represent a ten minute history will require a ten minute
period from the initial set up to become fully representative. This is called the Learning
Time. Since the ideal should be a seven to eight hour history, this is a problem for initial
installation. The Learning Time is also a problem for a change in use of the protected
area such as a day-to-night or a night-to-day change. Both of these problems are
overcome by maintaining two histograms; one with a seven hour learning time (the
standard histogram) and the other with a fifteen minute learning time (the fast
histogram). On initial power up the alarm is disabled for fifteen minutes while the fast
histogram becomes representative of the signal distribution during this period. The
histogram so obtained is then used as the standard histogram which then has the decay
factor set to cover a multi-hour historical period. Since the historical period is initially
only fifteen minutes, the spread of the distribution will be smaller than if the historical
Stratos-HSSD®
Description

World Patents Pending ©AirSense Technology Ltd. 1999
ISSUE 2.4Page 18
T E C H N I C A L . M A N U A L
period had been several hours and it will take several hours before the distribution shows
the true normal spread. The alarm trigger level is set by the spread, in terms of the
standard deviation. In order to compensate for the initial FastLearn, the figure for this
is increased by a factor that is gradually decreased to unity over the initial period. This
gives an artificially slightly high alarm level for the first few hours after installation but
needs only fifteen minutes before the detector becomes operative. As the detector has
to discern between day and night periods, then the detector takes an initiation period
of 24 hours as part of the initial self set up.
The fast histogram is constantly maintained as well as the standard histogram, and is
used to compare with it in order to show short term changes or trends. Short term
changes will occur with changes in use of the protected area. The problem with
changes in use is that, with, say, a seven hour learning period, the detector will have
only just learned about one period after a change, when another change occurs and it
begins to learn about that. The detector never has time to settle fully to its current use.
For all practical purposes, changes of use cover only two different levels of use. These
are usually day time and night time, but for the sake of generality may be referred to
as normal time and quiet time.
The problem of maintaining correct alarm trigger levels, in spite of changes in use at
occupied and unoccupied times, is solved by having two standard histograms, one for
the normal time and the other for the quiet time. When the detector is first installed the
approximate times of day for the changes in use are programmed into the micro-
processor. Within a 140 minute period of these set day and night start times (70
minutes either side of the actual time set), the processor looks for a change of use by
comparing the fast histogram with the present standard histogram. When it is satisfied
that it has detected a change within this 140 minute period, it switches to the alternative
standard histogram and notes the time it occurs. The alternative standard histogram
will contain all the learning from the previous time it was used and consequently needs
no time to re-learn it. The time that was originally programmed for the change to occur
is compared with the time it actually occurred and if there is a difference, the
programmed time is modified to be nearer to the actual time. After some days, the
programmed time will be showing the average of the actual times the changes occur
and will have the ability to capture the next time a change occurs if it is within an hour
of it. This is useful when the clocks change from summer to winter time and activities
change according to the clock.

World Patents Pending ©AirSense Technology Ltd. 1999
ISSUE 2.4 Page 19
T E C H N I C A L . M A N U A L
If the comparison of fast histogram and the current standard histogram shows no
change of use within an hour of the programmed time, then no switch to the
alternative standard histogram is made. This is particularly beneficial if the detector
remains in a quiet period for a day or more, such as for a weekend or holiday period,
when it will remain with the quiet period histogram for the whole period, as, after all,
this type of system is usually used where the optimum in sensitivity is required, and this
feature provides a unique level of sensitivity with this artificial intelligence sensitivity
switching.
An area that requires special care with the light scattering principle, is the exclusion of
abnormal levels of dust from the detector chamber. It is as well to mention that perfect
protection against dust particles is an ideal which is unlikely to ever be fully achieved
although a method of discriminating between dust particles and smoke particles of the
same size is always being sought. It is difficult to obtain, because many dust particles
exist in the same size region as smoke particles. As such, the combination of fully
monitored and compensated (see below) dust particle separation and dust discrimina-
tion used in Stratos provides a very adequate solution.
For reasons of power economy and reliability a low power air impeller is required to
draw air down the sampling pipes. This leads to the problem that the bore of the
sampling pipes must be large in order to obtain the high flow rates required (usually
15 to 25 mm.). High flow rates are required to obtain short transit times between the
sampling holes and the detector head. Even with a well designed system these may
often be as great as 60 seconds for the furthest holes. The result of fast air flow down
large bore pipes is a large volume of air being moved. In order to overcome long term
problems, the air which passes through the detector must be filtered to some degree
to remove the majority of dust particles. The nature of this filter is critical though,
because the matter it filters from the air remains in the filter medium, and as it builds
up will increase the efficiency of the filter. This manifests itself by the filter removing
progressively smaller and smaller particles the more it becomes loaded with dust, until
it is removing the majority of the smoke particles. At this time it will still be passing air
satisfactorily and there will, unless compensated for, be no external indication that it
is blocking smoke until such time as it fails to detect a fire. One indication that occurs
for a relatively scaled detector (Stratos) is that the spread and level of readings will
gradually decrease. Stratos will automatically decrease the scale range to compensate
Dust
DustCompensation

World Patents Pending ©AirSense Technology Ltd. 1999
ISSUE 2.4Page 20
T E C H N I C A L . M A N U A L
for this, but the indication will consist of a marked decrease in the spread of readings.
The essence of the problem is not so much the filtering out of dust, which is a straight
forward design problem, but the life of the filter, and giving a reliable indication that
it is becoming fully loaded. The Stratos detector tackles the problem of dust in four
ways;
n Only a small part of the total air sample is taken through the detector head. While
a large air flow down the sampling pipes is an advantage, the detector head itself
can measure the pollution density equally well for a small sample as a big sample.
As a consequence, only the small part of the total air sample flowing through the
detector head requires filtering and the filter and detector chamber life is
consequently greatly extended. Additionally the frictional resistance that would
otherwise restrict air flow is greatly reduced.
n Progressive decreases in the variance and mean of readings in the histogram give
a warning that the filter is becoming fully loaded. This progressive reduction in
signal spread causes the detector to compensate, thereby automatically maintain-
ing the sensitivity of the Stratos detector.
n The flow rate through the detector sampling chamber is relatively fast and an
individual dust particle which does get into the chamber will give just one
abnormally high reading from paired light pulses from the laser. Stratos looks for
such individual, abnormally high readings and ignores them, only accepting a
signal from the lower of the paired pulses. This process is known as Dust
Discrimination.
n The filter itself is specifically designed to have a very high capacity for holding dust,
which further extends the filter life.
The Stratos scale is represented on the front panel of the Master Stratos detector
by a ten segment bargraph display, with the segments numbered 1 to 10. The
bargraph illuminates continuously from 1 upwards, to the measured amount of
pollution. The alarm trigger level is always pre-set at bargraph level eight. If there
were a segment numbered zero, then this is where the measured mean level of
background signal would be indicated. The main purpose of the bargraph is to
Bargraph Scale

World Patents Pending ©AirSense Technology Ltd. 1999
ISSUE 2.4 Page 21
T E C H N I C A L . M A N U A L
indicate the pollution level being accepted by the micro-processor as actual smoke
pollution. Unlike other High Sensitivity Smoke Detectors, it does not indicate the
level of background pollution. The normal indication on the bargraph will be no
segments illuminated, although in environments that are normally very smoky,
bargraph 1 may be periodically illuminated. The trigger levels are set according
to the bargraph. If bargraph number 8 is illuminated an alarm condition is
indicated, although not necessarily accepted. If it is not illuminated, an alarm
condition is not indicated. A Pre-Alarm trigger level may also be set to a bargraph
level below number 8 and an Auxiliary trigger level may be set at any bargraph.
Once a trigger level is illuminated the actual function will not be accepted (i.e.
signalled to the control unit) until the end of a pre-set delay time. The appropriate
segment must be illuminated continuously for the whole duration of the delay
time in order to be signalled unless the signal has risen very rapidly to beyond full
scale. If this is the case then the time delays may be programmed to be ignored.
The bargraph has other uses during the initial fifteen minute installation period
and the Test mode. These are detailed in the Stratos-HSSD Installers Handbook.
The power supply to the system is 11 to 25 Volts DC. The source for this voltage is either
the backup battery through a diode or a mains transformer and rectifying bridge. When
the mains power is connected, then the battery is under charge (the battery charge
capacity is 3.0 Amps max.) and the battery diode is reverse biased. When the mains is
not connected the battery diode is forward biased and the battery provides the supply.
See the installers handbook for the terminal board connector details.
Stratos can be run from an external power supply which may be between 11 and 25
Volts. When an external power supply is used the supply voltage is fed in through the
DC connector PL6. This connector is not normally fitted and so must be specified at time
of ordering.
Power Supplies
Using an externalpower supply

World Patents Pending ©AirSense Technology Ltd. 1999
ISSUE 2.4Page 22
T E C H N I C A L . M A N U A L
The following graph shows the value sent to the D/A converter for a given bargraph
reading. this voltage is present on pin 22 of the interface connector. On the universal
terminal interface module, the connection is marked as ‘Chart Rec.’.
Chart recorderanalogue output
70
13
0 1 2 3 4 5 6 7 9 10
1823
2833
3843
48
5858
6360
50
40
30
20
10
0
Fault
Fire
Each D/A count is equal to approximately 159mV. Full scale is 10V.
Bargraph Reading
With very high sensitivity detectors the problem of external pollution entering an area gets
more acute. This examination describes problems associated with the use of a reference
detector and shows how special features of the STRATOS® detector may be used in providing
a solution.
When a room is to be protected with smoke detectors, there are two prime considera-
tions. The first is that it should not give an alarm which, for any reason at all, does not
correspond to a real fire situation as required by the user. The second requirement is
that it should give an alarm for a real fire situation.
One possible source of unwanted alarms is the ingress of smoke into the protected area
from an outside source. With very high sensitivity systems, such as aspirating systems,
this can be a very real problem. Outside sources of smoke pollution may easily rise to
levels above 10% obs/m., more than a hundred times the alarm level of a high
sensitivity air sampling detector system such as Stratos. Where such situations are likely,
Examinationof referencing
systems

World Patents Pending ©AirSense Technology Ltd. 1999
ISSUE 2.4 Page 23
T E C H N I C A L . M A N U A L
the system designer will frequently employ a reference detector.
A referencing system depends upon the basic equation:-
[pollution entering the area] - [pollution leaving the area] = [pollution added from
within the area]
On the face of it, this seems to offer a complete solution to the problem. One detector
is sited to measure the level of pollution at the air inlet to the area and another is sited
to measure the pollution of the air at the outlet from the area. The difference between
these two readings is used to trigger an alarm if it rises above a given alarm level. If no
pollution is added from inside the area the difference between the two readings will be
zero.
There are certain problems which occur in implementing the theory. The most obvious
one is that, for a detector with a sensitivity of 0.1% obs/m full scale, the two
measurements must track one another to within 1%. Another is that the signal from a
detector does not carry on rising indefinitely, it reaches a ceiling where, in spite of
increasing pollution the output signal will no longer rise. If the signal from the reference
detector is at this level, the detector will not be able to rise above it.
example: reference detector at inlet can give a signal of 1 volt per 1% obs/m.with a maximum output of 10 volts.
detector at outlet can give a signal of 1 volt per 1% obs/m. with amaximum output of 10 volts.
alarm will be signalled if the difference becomes greater than 0.1 volts.
If the inlet detector senses 10% obs/m or more, its output will be 10 volts and this is
the maximum it can give. The same, or more, will be detected by the detector at the
outlet, but it too cannot give an output above 10 volts.
[pollution entering the area] - [pollution leaving the area] = [pollution added] [10] - [10] = [0] regardless of pollution
added within the area
Stratos™ solves this problem by ensuring the detector is always able to go into alarm
using it’s patented ClassiFire™ technology. However there is another problem which

World Patents Pending ©AirSense Technology Ltd. 1999
ISSUE 2.4Page 24
T E C H N I C A L . M A N U A L
cannot be solved by the designer of the detector but must be solved by the system
designer. This is the transient problem of the changes which occur when pollution starts
to be detected at the inlet and when it ceases to be detected.
In order to examine what occurs, it is easiest to examine a simple case and then examine
the effect of variations. The following examinations make 2 assumptions. The first is that
a constant level of external pollution occurs. The second is that perfect mixing of
incoming air occurs instantaneously. Although this will not be realised in any practical
case, it will be closely approached. An area is taken which either has filtered air fed into
it from outside or has air being extracted from it and air entering it where possible.
Figures 1 & 2 depict such areas. The graph in Fig. 3 shows how the pollution rises at
the outlet of the area with time and the graph in Fig. 4 shows how the pollution falls
at the outlet of the area with time. Both show the result of the basic referencing equation
assuming theoretically perfect detectors.
Fig. 1. Simple case offiltered air input and
natural venting.
Plant Room
Filter
OutletFresh AirSource
Pump
Protected Room
Inlet
Plant Room
OutletExhaust
Pump
Protected Room
Fresh Air Source & Inlet
Fig. 2. Simple case offorced air venting and
natural inlet of air.

World Patents Pending ©AirSense Technology Ltd. 1999
ISSUE 2.4 Page 25
T E C H N I C A L . M A N U A L
At the onset of pollution at the inlet the pollution at the outlet will not immediately rise
to the same level. For a pollution level of X% arriving at the inlet, the pollution level
at the outlet will rise with the inverse exponential of time towards X% and in theory
never actually reach it. This effect is illustrated in Figs. 3 & 4.
Plant Room
A
A
Filter
Air Inlet
0
Pollution at Inlet
(as seen by reference detector)
Transportdelay through
duct work
During this period aspirating smokedetection system has low sensitivity
Referencecompensation
added here
Time
D
Smok
e D
ensi
ty
Pump
Inlet
0
Pollution at Outlet
Time
D(1-E)
Smok
e D
ensi
ty
0
CALCULATED POLLUTION ADDED
Time
Density required for alarm
D(1-E)
Smok
e D
ensi
ty
Fig. 3. Smokelevels at the onset of
an external sourceof smoke.

World Patents Pending ©AirSense Technology Ltd. 1999
ISSUE 2.4Page 26
T E C H N I C A L . M A N U A L
The SOURCE is considered as the point where pollution from an external source enters
the controllable system. In most cases this is the building in which the protected room
is sited.
In Fig. 1. there is some distance between the source and the room. There is thus a delay
in air reaching the room corresponding to the time taken for air to travel the distance.
The graphs in Figs. 3. & 4. label this as TRANSPORT DELAY. For Fig. 2. there is no
distance between the SOURCE and the protected room, therefore the TRANSPORT
DELAY is zero. It is important to note that this situation is not inherent in the forced air
ventilation case because the INLET may be from another part of the same controllable
system.
The INLET is the point where air enters the protected room. For the sake of simplicity,
this is considered to be a single point but in practice this is not necessarily the case.
The OUTLET is the point where air leaves the protected room. Again, for the sake of
simplicity, this is considered to be a single point but in practice this is not necessarily
the case.
Filtering indicated in Fig. 1. may have an effect in reducing the amount of pollution in
the incoming air. Its efficiency is shown as E in Figs. 3 & 4. If it is 100% efficient then
E = 1 and there is no apparent need for referencing.
The rate of change of pollution at the OUTLET is shown to be inversely exponential. The
assumption is that polluted air entering the room is instantly mixed with the existing
air in the room. Since air is entering the room air must also be leaving the room and
a proportion of this air must be polluted air. The proportion of polluted air leaving will
increase as its proportion in the room increases. This is a classic case indicating an
inverse exponential increase. If air is not perfectly mixed and is not mixed at all, a “wave
front” of polluted air will advance across the room and the pollution at the OUTLET will
suddenly rise when the wave front reaches it. This will correspond to a delay which is
the time taken for the “wave front” to traverse the room. This is an unlikely state of
affairs. If the mixing is short of being perfect but exists, then the rise will be similar to
that shown but not follow an exact inverse exponential path. Assuming perfect mixing
is fairly close to what can be expected in practice and allows a mathematical analysis
of the situation.
It will be noted from Fig. 3 that there is a period for the CALCULATED POLLUTION ADDED when

World Patents Pending ©AirSense Technology Ltd. 1999
ISSUE 2.4 Page 27
T E C H N I C A L . M A N U A L
the detector is in a state of low sensitivity. This is one of the major errors the system
designer is trying to avoid by using a reference system. The exact duration of this period
and the extent of the low sensitivity will be assessed later from a mathematical analysis.
In Fig. 4 the same items are illustrated as in Fig. 3. but which correspond to the time
when the external source of pollution ceases.
0
Transportdelay through
duct work
In Alarm
Time
D
Smok
e D
ensi
ty
0
Pollution at Outlet
Pollution at Source
Time
D (1-E)
Smok
e D
ensi
ty
0
CALCULATED POLLUTION ADDED
Time
Density required for alarmSmok
e D
ensi
ty
D (1-E)
It is a common error made by many people, that the time scale for pollution increasing
in a room is different from that of pollution decreasing. This is not true but may be
subjectively enforced due to the more rapid change seen at the start of inverse
exponential function. Exactly the same mechanism is working in both increasing and
decreasing pollution. The only difference is that in one the added air is polluted and
in the other the added air is clean. As can be seen from Fig. 4. there is a period
immediately following the end of the input of pollution when the detector is in alarm.
This is exactly what the system designer is trying to avoid by using a reference system.
Fig. 4. Smoke levels atthe end of an external
source of smoke.
World Patents Pending ©AirSense Technology Ltd. 1999
ISSUE 2.4Page 28
T E C H N I C A L . M A N U A L
Cs = pollution at the source.
Cr = pollution in the room.
t = elapsed time.
T = time constant
R = rate of air introduction(cu.m./min.)
V = volume of room (cu.m.)
E = efficiency of filter.
A = X-sect. area of duct (sq.m.)
L = length of duct. (m.)
td = transport delay time. (mins)
For the case when pollution is increasing in theroom:-
Cr = Cs 2 ( 1 - ˆ -t / T )where T is determined by the volume of the roomand the rate at which air is introduced:T = V/R (mins)
For the case when pollution is decreasing in theroom:-
Cr = Cs 2 ˆ -t/T
For the transport delay time:td = L / ( A 2 R )
Example:
A room has a volume of 5,000 cu.m. and the air conditioning is such that it provides
5 changes of air per hour and the fresh air make-up is 10%. Air enters the building via
an air filter which is 30% efficient at removing pollution and travels 25 metres down
an air duct (2m2 area) to the room. A reference detector is placed after the air filter to
provide reference for a standard detector which samples air leaving the room. The
detector will indicate an alarm if pollution rises to 0.1% obs/m.
If a diesel lorry draws up outside and emits a pollution level of 5% obs/m at the reference
detector; what is the period for which the detector will alarm at more than 0.2% obs/
m and how long will it remain in an alarm condition when the lorry moves away.
5 changes per hour = 5 x 5000 cu.m. per hour
= 416 cu.m per minute
10% make up = 41.6 cu.m. per minute
Transport delay in 2 sq.m. duct = L / ( A 2 R )
= 25 / (41.6 x 2)
= 0.30 minutes
Effective pollution = (1 - E ) 2 [absolute pollution]
= (1 - 0.3) x 5 % obs/m
= 3.5 % obs/m
The alarm will be activated by 0.2% added pollution when the pollution at the outlet
has risen to (3.5 - 0.1) % obs/m = 3.4 % obs/m. This allows for 0.1% added to reach

World Patents Pending ©AirSense Technology Ltd. 1999
ISSUE 2.4 Page 29
T E C H N I C A L . M A N U A L
the alarm level and 0.1% to overcome the residual reference signal. The time taken for
the pollution level at the outlet to rise is “t” in the equation:
Cr = Cs 2 ( 1 - ˆ -t/T ) where Cr = 3.4%
Cs = 3.5%
T = V / R = 5000/41.6
= 120 mins.
transposing:
t = T 2 ln( Cs / (Cr - Cs) )
= 120 x ln( 3.5 / 0.1)
= 427 mins
The alarm will be activated until the pollution at the output has fallen from 3.5% obs/
m to 0.1% obs/m. It is given as “t” in the equation:
Cr = Cs 2 ˆ -t/T where Cr = 0.1%
Cs = 3.5%
T = 120 mins.
transposing:
t = T 2 ln( Cs / Cr )
= 427 mins as before
These figures must have added to them the transport time (which is insignificant
compared to them) and they illustrate, very clearly, a very large problem. It can be
argued that a step change in the external pollution will never occur and represents the
worst case. This is true, but, specifying that the pollution at the source will take 1 minute
to rise to 5% will not provide significant improvement on the figures calculated above.
A possible solution is to increase the effectiveness of the filter. If the filter is made 90%
efficient then Cs becomes 0.5% in the above equations and:-
t = T 2 ln( Cs / Cr )
= 193 mins
If the filter could be made better than 98% efficient then the detector would approach
alarm and, although it would not be sent into alarm, it would become extremely
sensitive to any smoke added in the room. Added to this, if the filter is this efficient,
then it could arguably be improved to remove nearly all pollution from an outside

World Patents Pending ©AirSense Technology Ltd. 1999
ISSUE 2.4Page 30
T E C H N I C A L . M A N U A L
source. In this case no reference system would be required to compensate for it.
The main factor in the determination of time in alarm or time in low sensitivity is the time
constant “T”. This, as given above, is the volume of the room divided by the rate at
which outside air is added. That is the time it would take a room to be filled with external
polluted air if none of the pollution was allowed to escape. For this reason it is called
the filling time constant. If the example worked through above, was concerned with
a room of 500 cu.m. but all other data remained the same, then the filling time constant
(T) would be 12 minutes instead of 120 minutes. The alarm level would be exceeded
for 42.7 minutes instead of 427 minutes. The same would be true if the rate of fresh
air make up was 100% instead of 10% and the volume of the room stayed at 5,000
cu.m. However, shortening the period in unwanted alarms by this amount is not a real
solution because 1 second in alarm constitutes as much of a problem as 42.7 minutes.
It has been shown that in a simple case the performance of a reference system can be
analysed by “rounding off a few corners”. The main problem has been identified as the
filling time constant.
When considering a more complex system as in Fig. 5 the number of unknown variables
become so many and so large that the system is no longer amenable to analysis.

World Patents Pending ©AirSense Technology Ltd. 1999
ISSUE 2.4 Page 31
T E C H N I C A L . M A N U A L
Fig. 5. Complex situationwith more than one room
serviced by a single airconditioning unit.
Filter
Exhaust
Fresh AirMake up Source
Air Duct
OutletInlet
Room A
Room B
Room C
Room D
Room E
Pump
Outlet Inlet
Outlet Inlet
Outlet Inlet
Outlet Inlet
Plant Room
The ability to vary the air conditioning in one of the rooms can effect the flow into all
the rooms. Air ducts will become long with the result that transport delays will vary and
be significant. Some rooms may have the ability to turn off their air conditioning
completely and rely on the opening of windows. Referencing under these conditions
will only provide a false sense of security. Unwanted alarms may easily occur from one

World Patents Pending ©AirSense Technology Ltd. 1999
ISSUE 2.4Page 32
T E C H N I C A L . M A N U A L
of the rooms as a result of a change in conditions in another room. Such causes are very
difficult to trace. The only solution in this instance is to have individual referencing in
each room and the ability to turn it off when it is not required. With individual
referencing a reference detector will be sited at the inlet to a room and will reference a
detector at the outlet. Problems can still occur due to the change of flow rates, but the
requirements for a particular room can be analysed and errors can be identified as
originating from a given room.
Because of the difficulties associated with complex systems, the Stratos detector does
not cater for transport delays or rooms with a very long time constant. The general
advice to system designers is to keep a reference system as simple as possible because
of the inherent pitfalls.
Stratos does contain a function to program in the filling time constant which is
separately programmable for each detector in a system. The variations of smoke density
and signals associated with this are shown in Fig. 6. The intent is to modify the reference
signal such that:-
[modified sig. representing] [signal representing] [signal representing]
[pollution entering the area] - [pollution leaving the area] = [pollution added from]
[within the area.]
There are two variables which can be programmed into the Stratos which modify the
reference signal to suit it to the situation of the detector. The first is the filling time
constant and the second is the attenuation. The effect of these on the reference signal
is illustrated in the curve “MODIFIED REFERENCE SIGNAL” in Fig. 6. The filling time constant
entry is labelled as “Reference back off time delay (mins)” in function 8. This should be
set to be equal to the filling time constant and has a maximum value of 99. It will modify
the reference signal for the one detector concerned by providing an inverse exponential
rise and fall to the reference signal. The second programmable variable is “Reference
level” at function 7. This should be set to be equal to (1 - E) where E is the efficiency
of a relevant filter as defined above. It is the factor “K” shown in the curve “MODIFIED
REFERENCE SIGNAL” in Fig. 6. The purpose of these two programmable variables is to match
the effect of external reference to the response to external pollution of the detector at
the outlet. Perfect matching will only be achieved if there is very good mixing in the
Stratos detectorreferencing

World Patents Pending ©AirSense Technology Ltd. 1999
ISSUE 2.4 Page 33
T E C H N I C A L . M A N U A L
room resulting in an inverse exponential change of pollution within the room, as
previously explained. Providing that the external pollution level is not exorbitantly
high, some trial and error adjustments around the setting of the “Reference back off
time delay (mins)” in function 8 will achieve good results. Very good matching can be
obtained under most normal conditions and will be a very great improvement on using
an unmodified reference signal.
0 Time
D
Smok
e D
ensi
ty
0
Modified Reference Signal
Pollution at Source
Time
D . K
Ref
eren
ce S
igna
l
0
CALCULATED POLLUTION ADDED
Time
Density required for alarmSmok
e D
ensi
ty
0
Pollution at Outlet
Time
D (1-E)
Smok
e D
ensi
ty
Fig. 6.
World Patents Pending ©AirSense Technology Ltd. 1999
ISSUE 2.4Page 34
T E C H N I C A L . M A N U A L
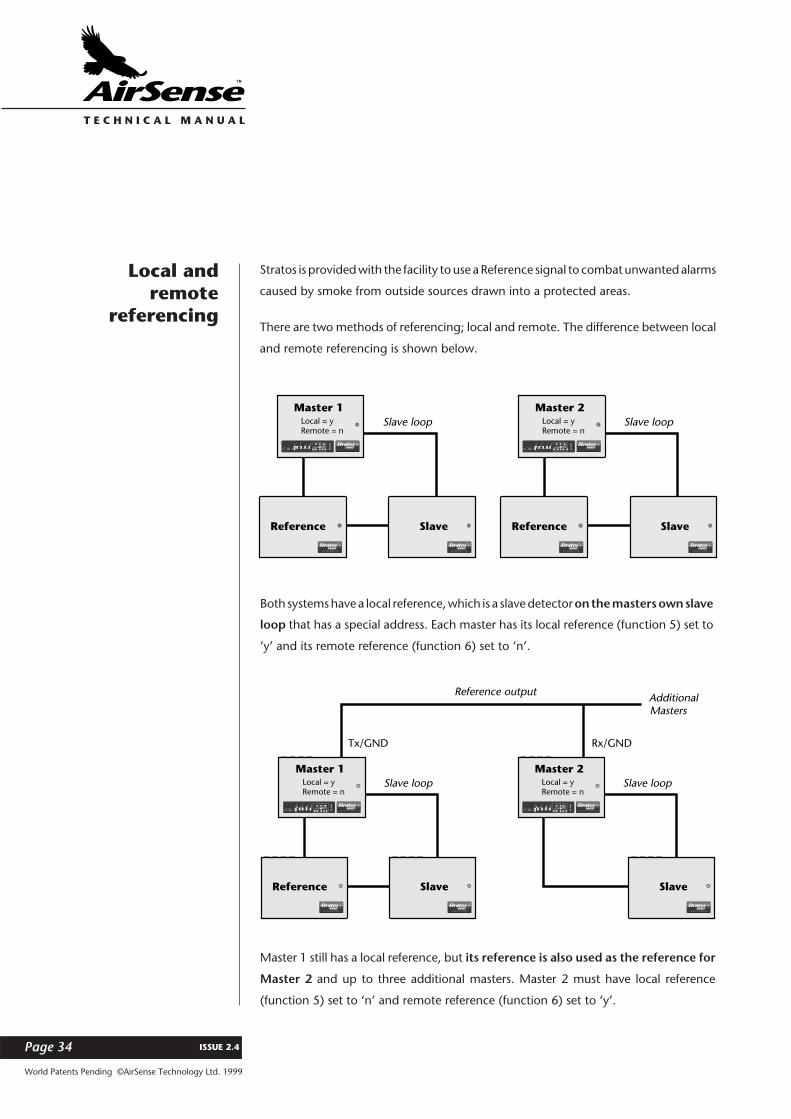
Stratos is provided with the facility to use a Reference signal to combat unwanted alarms
caused by smoke from outside sources drawn into a protected areas.
There are two methods of referencing; local and remote. The difference between local
and remote referencing is shown below.
Local andremote
referencing
Both systems have a local reference, which is a slave detector on the masters own slave
loop that has a special address. Each master has its local reference (function 5) set to
‘y’ and its remote reference (function 6) set to ‘n’.
Master 1 still has a local reference, but its reference is also used as the reference for
Master 2 and up to three additional masters. Master 2 must have local reference
(function 5) set to ‘n’ and remote reference (function 6) set to ‘y’.
H I G H S E N S I T I V I T Y S M O K E D E T E C T O R
TM
ISOLATE
TEST
RESETS M O K E D E N S I T Y
AUX FIREPRE-ALARM
RENEWOK
FAULTOK
ISOL.ON
FAULTOK
HIGHOK
LOW 1 2 3 4Ref.
Ai r Fl ow
1 2 3 4 5 6 7 8 9 10
De te c
t or
Po w
e r
Se p
a ra to r
Artificial Intelligence
With
S L A V E D E T E C T O R SMASTER
S L A V E D E T E C T O R
TM
S L A V E D E T E C T O R
TM
Master 1Local = yRemote = n
Slave loop
Reference Slave
H I G H S E N S I T I V I T Y S M O K E D E T E C T O R
TM
ISOLATE
TEST
RESETS M O K E D E N S I T Y
AUX FIREPRE-ALARM
RENEWOK
FAULTOK
ISOL.ON
FAULTOK
HIGHOK
LOW 1 2 3 4Ref.
Ai r Fl ow
1 2 3 4 5 6 7 8 9 10
De te c
t or
Po w
e r
Se p
a ra to r
Artificial Intelligence
With
S L A V E D E T E C T O R SMASTER
S L A V E D E T E C T O R
TM
S L A V E D E T E C T O R
TM
Master 2Local = yRemote = n
Slave loop
Reference Slave
H I G H S E N S I T I V I T Y S M O K E D E T E C T O R
TM
ISOLATE
TEST
RESETS M O K E D E N S I T Y
AUX FIREPRE-ALARM
RENEWOK
FAULTOK
ISOL.ON
FAULTOK
HIGHOK
LOW 1 2 3 4Ref.
Ai r Fl ow
1 2 3 4 5 6 7 8 9 10
De te c
t or
Po w
e r
Se p
a ra to r
Artificial Intelligence
With
S L A V E D E T E C T O R SMASTER
S L A V E D E T E C T O R
TM
S L A V E D E T E C T O R
TM
Master 1Local = yRemote = n
Slave loop
Tx/GND Rx/GND
Reference output Additional Masters
Reference Slave
H I G H S E N S I T I V I T Y S M O K E D E T E C T O R
TM
ISOLATE
TEST
RESETS M O K E D E N S I T Y
AUX FIREPRE-ALARM
RENEWOK
FAULTOK
ISOL.ON
FAULTOK
HIGHOK
LOW 1 2 3 4Ref.
Ai r Fl ow
1 2 3 4 5 6 7 8 9 10
De te c
t or
Po w
e r
Se p
a ra to r
Artificial Intelligence
With
S L A V E D E T E C T O R SMASTER
S L A V E D E T E C T O R
TM
Master 2Local = yRemote = n
Slave loop
Slave

World Patents Pending ©AirSense Technology Ltd. 1999
ISSUE 2.4 Page 35
T E C H N I C A L . M A N U A L
Using a Slave detector as a local reference does not reduce the number of slaves
available on the slave loop. The remote reference cable is a screened 2-core cable.
Patch links are used on the terminal board to configure the line connections for different
interface boards. These links need to be connected to bring the line connections from
the interface board out to the back box. Given below are connections for various
addressable boards. These connections are for Terminal board issue 2.0. or later.
Terminal boardjumper linkconnections
Apollo Series 90Interface
Master + 3 Slaves
Master + 2 Slaves
Master + 1 Slave
SingleMaster
Line in ± Line 1Line in ± Line 2Line out ± Line 3Line out ± Line 4
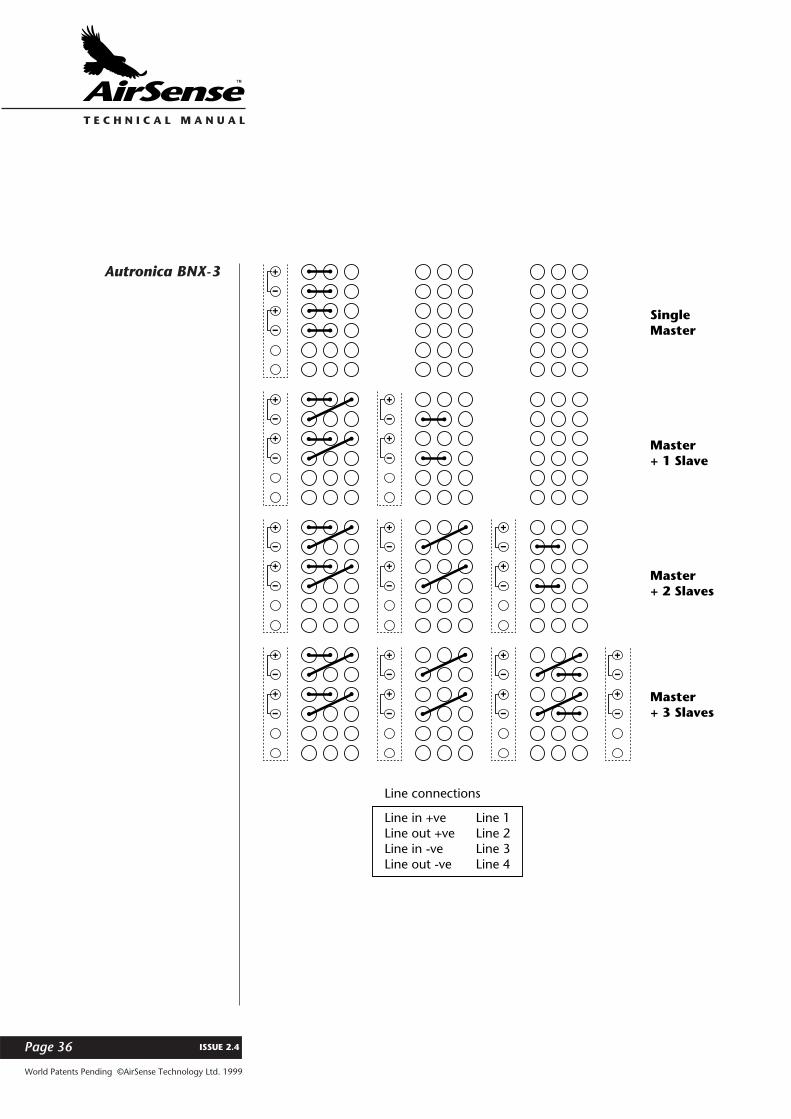
World Patents Pending ©AirSense Technology Ltd. 1999
ISSUE 2.4Page 36
T E C H N I C A L . M A N U A L
Autronica BNX-3
Master + 3 Slaves
Master + 2 Slaves
Master + 1 Slave
SingleMaster
Line in +ve Line 1Line out +ve
Line connections
Line 2Line in -ve Line 3Line out -ve Line 4

World Patents Pending ©AirSense Technology Ltd. 1999
ISSUE 2.4 Page 37
T E C H N I C A L . M A N U A L
Thorn AM521
Master + 3 Slaves
Master + 2 Slaves
Master + 1 Slave
SingleMaster
Line in -ve Line 1Line in +ve
Line connections
Line 2Line out -ve Line 3Line out +ve Line 4

World Patents Pending ©AirSense Technology Ltd. 1999
ISSUE 2.4Page 38
T E C H N I C A L . M A N U A L
Remote control software
Stratos can be connected to any PC compatible using the remote control software and
the appropriate serial cable (connections for a suitable cable are given in the installers
handbook under the heading ‘Connection to a computer’).
The Stratos master asks for an access code upon pressing the carriage return button.
This access code is the same code that is entered in functions 01 and 02 on the
programmer on the back of the front panel.
The Stratos remote software is fully menu driven for ease of use and consists of three
major parts; setup menu, demonstration and log menu and diagnostic menu. These
are covered more fully below.
1. Time and date
The time and date must be set correctly for the event log and chart recorder log. The
time is set in 24 hour format HH:MM and the date set in DD/MM/YY. Typing an invalid
time or date causes an error message to be printed followed by a prompt to enter the
data again.
2. Detector
This menu sets the alarm levels and time delays, alarm factor and ClassiFire override.
The current setting is displayed followed by a prompt for a new value. Pressing enter
only will leave the value untouched.
3. Alarm actions
This menu sets the detector actions taken after an alarm has occurred. Latching and
cascading alarms are set on this menu. The current setting of each functions shown
(either Yes or No), followed by a prompt to change it. Pressing enter on it’s own has
no effect on the current setting.
4. Detectors
The number of detectors on the master is set with this function. This figure is
automatically set on default reset.
Using the remotecontrol software
Setup menu

World Patents Pending ©AirSense Technology Ltd. 1999
ISSUE 2.4 Page 39
T E C H N I C A L . M A N U A L
5. Reference
Setting of the reference time delay and reference back off for each detector is handled
in this menu.
6. Front panel
The front panel keys on a Stratos master can be individually enabled or disabled. Note
that disabling a key on the front panel of the Stratos master has the same effect on the
mimic, if connected.
7. Power monitoring
Battery check or mains check can be enabled or disabled. This may be necessary when
using an external power supply.
8. Air flow
Entering this menu is not possible if the flow is currently being set up. During flow set
up the aspirator is cycled through it’s different speeds and a note is taken of the flow
readings. The flow limits are set either side of this nominal value. This can be manually
changed in this menu if ‘tighter’ or ‘looser’ limits are required. The aspirator speed can
also be set up on this menu or a flow set up started.
9. Miscellaneous
This menu groups together all of those functions not covered by the other menus. The
chart recorder sampling rate, the access code or setting a default reset are set in this
menu.
10. Language
The Stratos has various languages built into it. In this menu, the required language is
prompted. Pressing Enter with no country code selected resets the detector language
back to English.

World Patents Pending ©AirSense Technology Ltd. 1999
ISSUE 2.4Page 40
T E C H N I C A L . M A N U A L
1. Event log
Any alarm or fault that occurs or any operation of the front panel keys is stored in the
event log along with a time and date and any other relevant information. Selecting
this menu item lists the event log with the last recorded event being printed first.
Pressing the SPACE bar at any point pauses the listing of the event log, pressing SPACE
again will resume printing.
2. Histogram dump
Will provide a textual printout of the Stratos histograms for all attached detectors is
printed out. This format is the same that is sent to a printer by function 44.
3. Histogram viewer
This screen graphically displays the operation of the ClassiFire function. The detector
to display can be selected by pressing F1-F4.
4. Chart recorder log
Stratos has the facility of storing a chart recording in it’s memory of up to a month
(depending on the sampling rate). This menu item displays the chart recording in a
graphical format. The chart recording can be scrolled using the cursor keys. F2 saves
the log and F3 loads the chartlog from disk. F4 selects which detector to display and
F5 gives a directory listing. Press SPACE Bar to exit.
5. Dump function settings
The settings of all of the programmable functions is listed. The printout can be paused
by pressing the SPACE bar.
6. Remote monitor
This mode is not supported by the remote software. This mode provides support for
various systems management packages. See the SenseNET manual for more details.
Demonstrationand log menu

World Patents Pending ©AirSense Technology Ltd. 1999
ISSUE 2.4 Page 41
T E C H N I C A L . M A N U A L
1. detector diagnostics
Detector diagnostics cover all major circuits on the detector head and detector
controller boards. Each test is indicated as it is being carried out, followed by a pass/
fail.
2. Detector continuous read
This menu item shows the detector output and air flow rate as continuously varying
percentages. Press any key to end the display.
3. Controller diagnostics
The control board is the board on the front panel of the Stratos. All circuits tested are
followed by a pass/fail.
4. Slave loop error rate
Interference on the slave loop can cause corruption of the data passed between a
master and it’s slaves. This is compensated for by the Stratos master but too much
interference could indicate an installation problem. The slave loop error rate is the ratio
of good to bad transmissions over the slave loop.
5. Display dust separator condition
Selecting this menu item displays the current dust separator condition for all detectors.
The condition starts at 99% and when it drops to 80% a separator renew is displayed
on the front panel and the fault relay is activated.
6. Relay test
Prompts for a detector number of the relays to test and then goes through the
following sequence of relay activation:
AuxPre Alarm + FaultFire + FaultFault
Pressing the 'RETURN' key goes to the next test.
Diagnostic menu

World Patents Pending ©AirSense Technology Ltd. 1999
ISSUE 2.4Page 42
T E C H N I C A L . M A N U A L
Information Size
Chart data length in 16-bit words. In this case 4 word
Number of detectors byte
Selected detector to display byte
Sample rate in seconds word
Day of last sample byte
Month byte
Year byte
Hour byte
Minute byte
Second byte
The following lines are the chart recorder data itself
Alarm level (Master) byte
Detector level (Master) byte
Alarm level (Slave 2) byte
Detector level (Slave 2) byte
Alarm level (Master) byte
Detector level (Master) byte
Alarm level (Slave 2) byte
Detector level (Slave 2) byte
The format of the chart recorder data, as sent to the chart recorder software is detailed
below. All items marked as word size are 16-bit sent LSB first. Chart recorder data is
shown here for a two detector system with four
Chart recorder format
7. Status report
Runs detector diagnostics and controller diagnostics; dumps the event log and
histogram and prints the function settings. This function is designed to be used as a
final commissioning check to take a complete status report.

World Patents Pending ©AirSense Technology Ltd. 1999
ISSUE 2.4 Page 43
T E C H N I C A L . M A N U A L
1 Stratos-HSSD
2 Stratos-ES
3 Stratos-Quadra
4 SpeedScan
Number Product
The product id numbers stored in the histogram data packet are shown below.Product id numbers
The shaded areas on the histogram packet have been changed for revision 3.2 of the
Stratos software.
Data Size
0x10 byte
packet version number or 0x00 byte
product id number (see following list for types) byte
number of detectors or 0x00 byte
0xff word
0x01 word
0xff word
Fast histogram data 32 words
obscuration * 100 or 0x00 word
detector number or 0x00 byte
period (DAY/NIGHT) byte
Normal histogram data 32 words
Low limit of data window byte
Top limit of data window byte
Sum height of histogram byte
A/D input class byte
Alarm level word
Pre alarm level word
Aux. level word
Histogram mean * 100 word
Histogram variance * 100 word
Minutes left of FastLearn otherwise zero if no FastLearn word
Alarm factor word
The format of a histogram packet as sent to the remote software is detailed following.Histogramformat
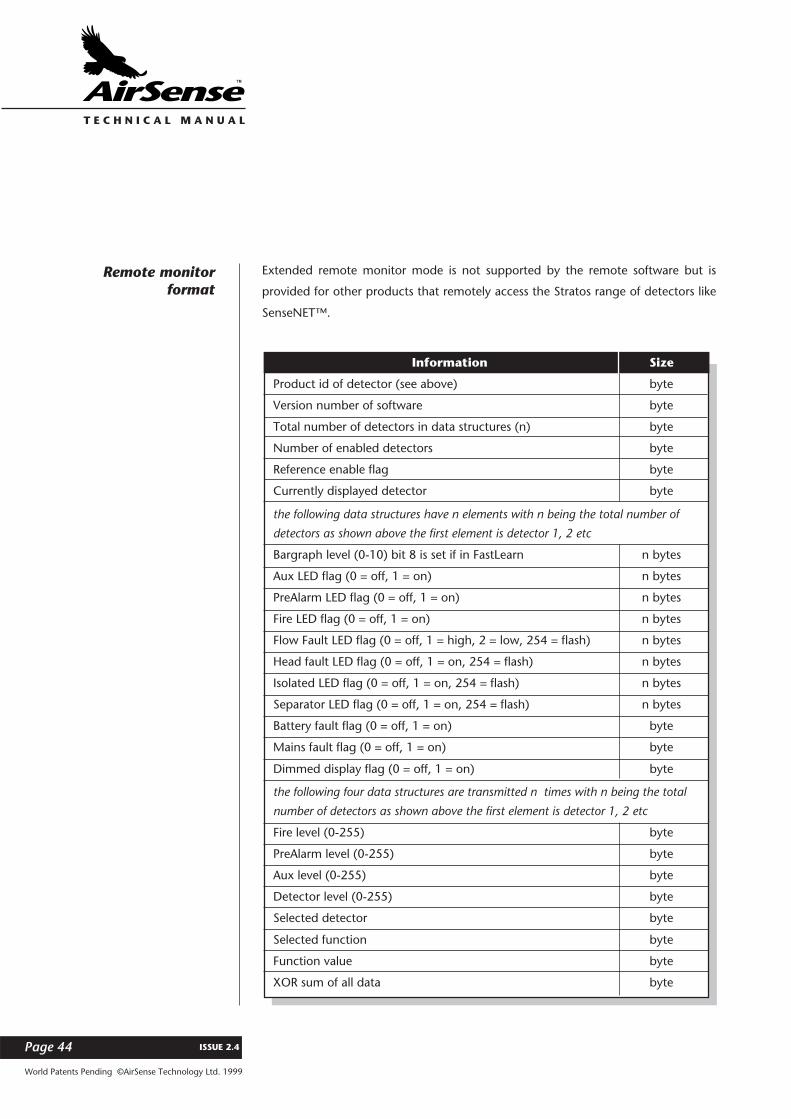
World Patents Pending ©AirSense Technology Ltd. 1999
ISSUE 2.4Page 44
T E C H N I C A L . M A N U A L
Information Size
Product id of detector (see above) byte
Version number of software byte
Total number of detectors in data structures (n) byte
Number of enabled detectors byte
Reference enable flag byte
Currently displayed detector byte
the following data structures have n elements with n being the total number of
detectors as shown above the first element is detector 1, 2 etc
Bargraph level (0-10) bit 8 is set if in FastLearn n bytes
Aux LED flag (0 = off, 1 = on) n bytes
PreAlarm LED flag (0 = off, 1 = on) n bytes
Fire LED flag (0 = off, 1 = on) n bytes
Flow Fault LED flag (0 = off, 1 = high, 2 = low, 254 = flash) n bytes
Head fault LED flag (0 = off, 1 = on, 254 = flash) n bytes
Isolated LED flag (0 = off, 1 = on, 254 = flash) n bytes
Separator LED flag (0 = off, 1 = on, 254 = flash) n bytes
Battery fault flag (0 = off, 1 = on) byte
Mains fault flag (0 = off, 1 = on) byte
Dimmed display flag (0 = off, 1 = on) byte
the following four data structures are transmitted n times with n being the total
number of detectors as shown above the first element is detector 1, 2 etc
Fire level (0-255) byte
PreAlarm level (0-255) byte
Aux level (0-255) byte
Detector level (0-255) byte
Selected detector byte
Selected function byte
Function value byte
XOR sum of all data byte
Extended remote monitor mode is not supported by the remote software but is
provided for other products that remotely access the Stratos range of detectors like
SenseNET™.
Remote monitorformat

World Patents Pending ©AirSense Technology Ltd. 1999
ISSUE 2.4 Page 45
T E C H N I C A L . M A N U A L
When the detector is in remote monitor mode it is possible to send program commands
to set function values and isolate, reset or test the detector.
API programming strings consist of one or more commands terminated with a carriage
return (CR). Multiple commands can be sent, terminated with a CR character (0x0d)
to indicate the end of the programming string. Each CR terminated packet must be
separated by at least 630mS to allow internal processing and the maximum string
length is 30 characters. Exceeding these limits will result in strings being lost or ignored.
In addition the time between the first character and the terminating CR must be less
than 33 mS.
Sending the following command strings will perform RESET, TEST and ISOLATE.
Command strings are always preceded by ‘>C’ (0x3e 0x43) characters which are not
shown in the table.
Remote monitorprogramming API
action command
RESET selected detector 0x02
TEST selected detector 0x80
ISOLATE selected detector 0x04
RESET detector d 0x53 0x7f + d (uppercase S character)
TEST detector d 0x54 0x7f + d (uppercase T character)
ISOLATE detector d 0x49 0x7f + d (uppercase I character)
exit mode 0x58 (uppercase X character)
reset all detectors 0x52 (uppercase R character)

World Patents Pending ©AirSense Technology Ltd. 1999
ISSUE 2.4Page 46
T E C H N I C A L . M A N U A L
Refer to “Programming Function 47” for more information on this setting. The chart
recorder display automatically adjusts the time display for different sample rates.
action command
select detector d 0x44 0x7f + d (uppercase D character)
read function f value 0x52 0x7f + f (uppercase R character)
write function f with value v 0x57 0x7f + f 0x7f +v (uppercase W character)
Chart recordersample rates
n For a selected sampling period the highest reading taken during that period is
stored.
n For a multiple detector system all detectors have their readings stored. The
maximum duration is divided by the number of detectors.
n Changing the sample rate will clear the data in the chart log
NB +
Setting Sampling period Maximum duration (time between samples) (hours)
0 no sampling 0
1 10 second 5
2 3 minute 9
3 10 minute 30 1.2 days
4 50 minute 150 6.2 days
5 200 minute 600 25 days
The following strings allow programming of the functions. These commands are
preceded by ‘>’ (0x3e). The command string should be terminated with a CR
character (0x0d). Note that to prevent the command string being terminated by a
0x0d in the command being interpreted as end of string all binary parameter values
have 0x7f (127 decimal) added to them. Invalid values for detector, function or value
are ignored.

World Patents Pending ©AirSense Technology Ltd. 1999
ISSUE 2.4 Page 47
T E C H N I C A L . M A N U A L
PipeCAD™ for Windows
PipeCAD is a sophisticated Computerised sampling pipe modelling package which is
designed to operate with PC’s running Microsoft Windows.
The program allows the sampling pipe layout to be drawn onto a ‘snap-grid’ on the
PC screen, either in 2 or 3 dimensional layout. When the pipe layout is drawn, the
sampling holes, pipe diameters, capillary pipes, end caps and bend radii may be
added. The program computes the design, either using balanced suction principles,
which will necessitate varying hole sizes, or compromise layouts, which will employ
sampling holes of equal diameter.
PipeCAD takes both laminar and turbulent air flow types into account, and offers
unequalled accuracy in sampling pipe design.
Due to the extremely high air flow characteristics of the Stratos Aspirator, PipeCAD is
incompatible with other aspirating smoke detection system types.
The pipe design software for the Stratos system requires an IBM PC compatible with
a 386 processor or better running Microsoft Windows version 3.1, Windows ’95 or
Windows NT 4.0. The program needs 3 Megabytes of disk space and 2 Megabytes of
free memory.
To install PipeCAD in Windows 3.1 from program manager select File/Run and select
the drive that the PipeCAD installation disk is inserted in. Select SETUP.EXE and click
on OK to start the installation procedure. A dialogue box will prompt for the installation
directory and user details and, once these have been entered, the software is
automatically installed and icons are set up.
To install PipeCAD on Windows 95/Windows NT 4.0 go into the control panel and
select add/remove programs. Click on install. The program will find SETUP.EXE on the
floppy drive. Press OK to install.
Sampling pipeModelling Program
System requirements
Installation

In line with continuous product improvement AirSense Technology Ltd. reserves the right to modify or update specifications without notice.Stratos, HSSD, AirSense, ClassiFire and FastLearn are registered trade marks of AirSense Technology Ltd.
AirSense Technology Limited1 Oak House • Knowl Piece • Wilbury Way • Hitchin • Hertfordshire • SG4 0TY
Tel. 01462 440666 • Fax. 01462 440888e-mail: [email protected]
AirSense Technology Benelux BVNoordkade 64 • Gebouw C3, 2741 EZ
Waddinxveen • NederlandTelephone: +31 1825 635696Facsimile: +31 1825 635691e-mail: [email protected]
AirSense OyUkonkellonkatu 19
Karhula 48800 • FinlandTel. (+358) (9) 400 652131 Fax. (+358) (9) 207 652131
AirSense Technology Australia (Pty) LtdP.O. Box 7 • Hackham • S.A. 5163
Tel: (08) 618 8443 9625Fax: (08) 618 234 2525
ACe-mail: [email protected]
AirSense Asia Sdn BhdLot 602 • Block A • Kelana Business Centre
47301 Petaling Jaya • Selangor Darul Ehsan • MalaysiaTel. (+60) 3-5828883 Fax. (+60) 3-5828885
e-mail: [email protected]
AirSense Korea Co.5 Kara Bon-Dong
Song Pa-Ku • Seoul • KoreaTel. +822 404 0417 • Fax. +822 404 1206
e-mail: [email protected]