Singapore. Find Singapore Singapore Singapore: Singapore city.
© SBM Offshore 2012. All rights reserved. www.sbmoffshore.com
Strategy presentation, Singapore, 16 November 2012

© SBM Offshore 2012. All rights reserved. www.sbmoffshore.com
Disclaimer
Some of the statements contained in this presentation that are not historical facts are statements of future expectations and other forward-looking statements based on management’s current views and assumptions and involve known and unknown risks and uncertainties that could cause actual results, performance, or events to differ materially from those in such statements. Such forward-looking statements are subject to various risks and uncertainties, which may cause actual results and performance of the Company’s business to differ materially and adversely from the forward-looking statements.
Should one or more of these risks or
uncertainties materialize, or should
underlying assumptions prove incorrect,
actual results may vary materially from
those described in this presentation as
anticipated, believed, or expected. SBM
Offshore NV does not intend, and does not
assume any obligation, to update any
industry information or forward-looking
statements set forth in this presentation to
reflect subsequent events or
circumstances.
2

© SBM Offshore 2012. All rights reserved. www.sbmoffshore.com
Agenda - Who we are, where we are - Transformation - Challenges and opportunities - Our Strategy
© SBM Offshore 2012. All rights reserved. www.sbmoffshore.com
Who we are, where we are
© SBM Offshore 2012. All rights reserved. www.sbmoffshore.com
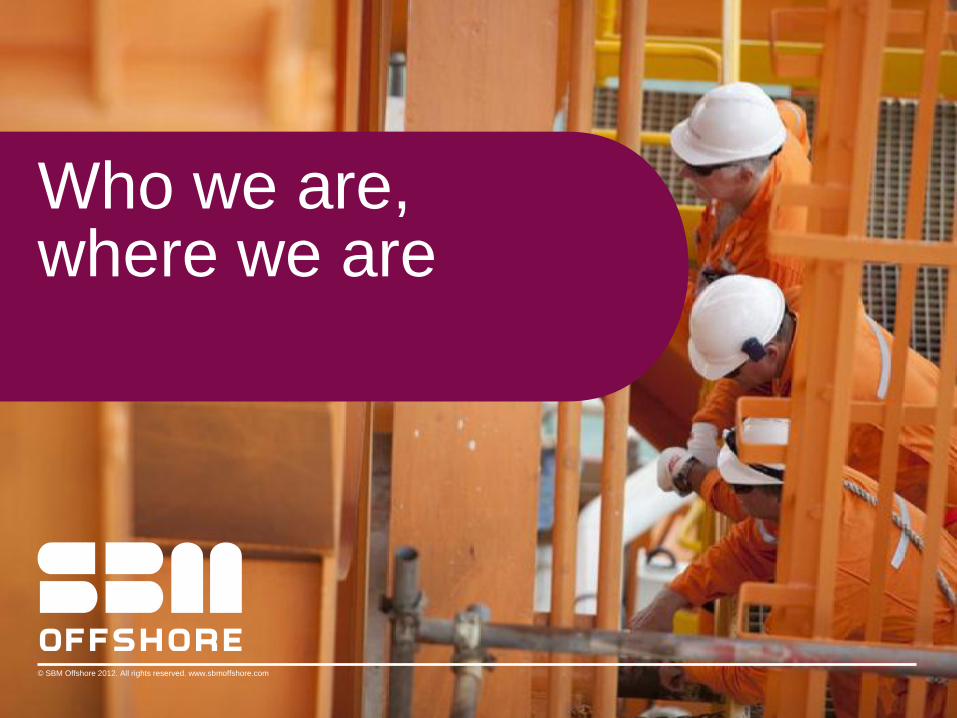
SBM Offshore No.1 FPSO player worldwide
Financials FY 2011 in US$
Turnover 3.2 billion
Backlog 16.9 billion
Market Cap 3.53 billion
Performance
200+ years of operations
99.1% Uptime
1 million barrels of throughput per day
4,734 Tanker Offloads (3.7 bln barrels)
The Company
4 Project execution centres
9 Shore bases
4 Representative offices
6,922 Employees (HY 2012)
Lease Fleet
15 FPSOs
2 FSOs
1 Semi Sub
2 MOPUs
5
© SBM Offshore 2012. All rights reserved. www.sbmoffshore.com
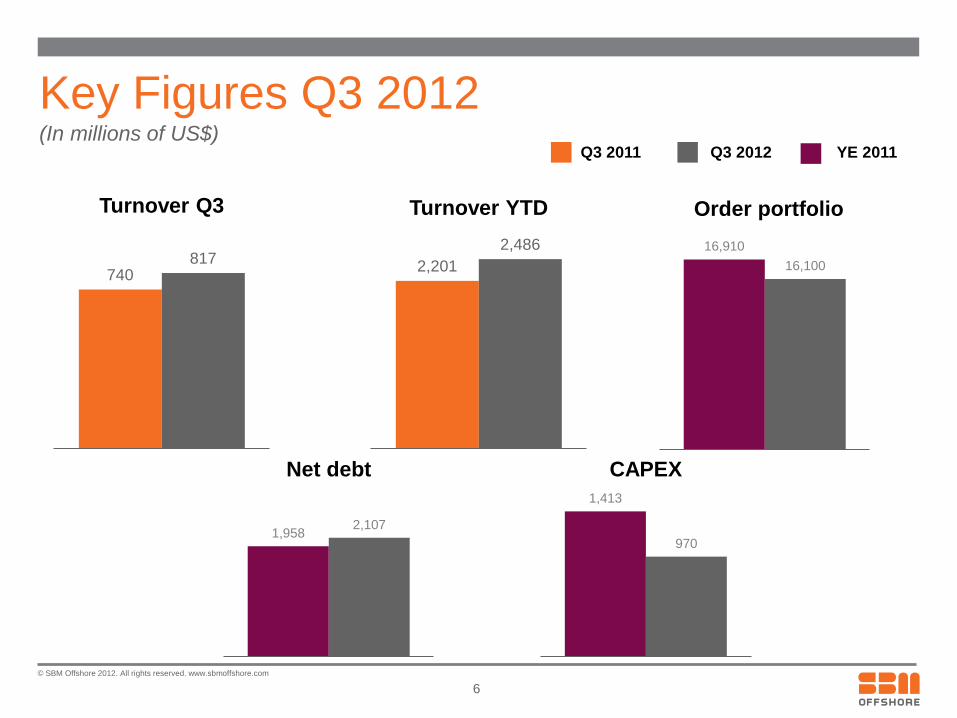
Key Figures Q3 2012 (In millions of US$)
Q3 2011 Q3 2012 YE 2011
6
740 817
Turnover Q3
2,201
2,486
Turnover YTD
16,910
16,100
Order portfolio
1,958 2,107
Net debt
1,413
970
CAPEX
© SBM Offshore 2012. All rights reserved. www.sbmoffshore.com
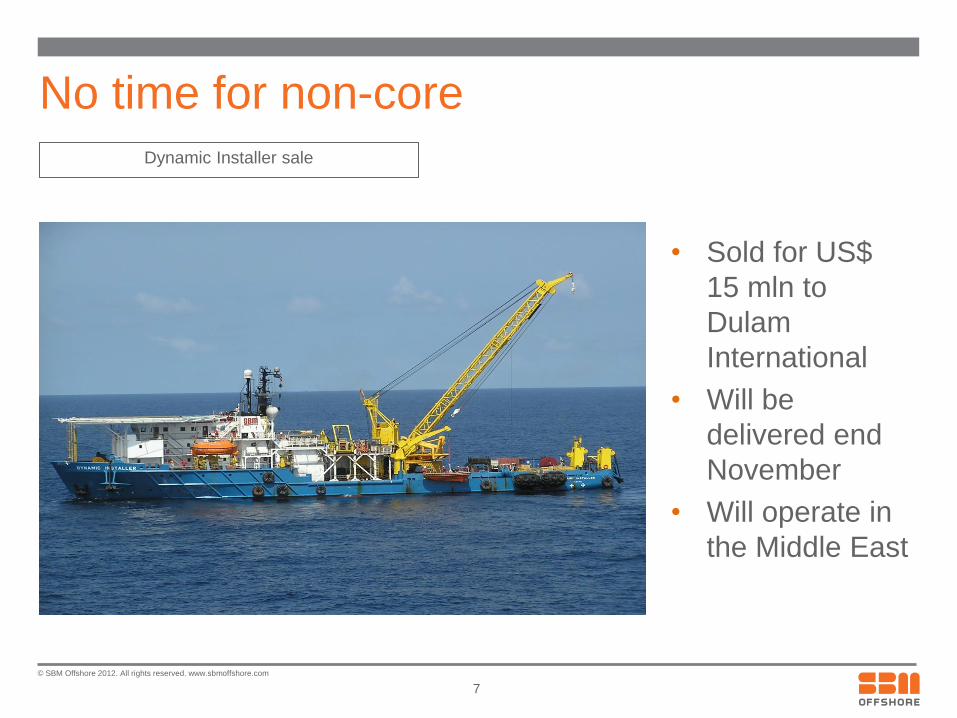
No time for non-core
• Sold for US$
15 mln to
Dulam
International
• Will be
delivered end
November
• Will operate in
the Middle East
7
Dynamic Installer sale
© SBM Offshore 2012. All rights reserved. www.sbmoffshore.com
No time for non-core
• Gusto-MSC:
Sold for approximately US$ 185 mln
• Next step: Sale and lease back of real estate (offices) and potentially
other divestments
• Total: around US$ 400 mln
• Targeted schedule: within 6-12 months
8

© SBM Offshore 2012. All rights reserved. www.sbmoffshore.com
First USPP and Ilhabela financing
• First US Private Placement project bond for SBM Offshore
• First US Private Placement project bond for a FPSO
• Cidade de Anchieta on hire since September 2012 for 18 year lease
contract
• US$ 500mn for 15 year maturity with 5.5% fixed coupon
• Duration of project bond in line with duration of lease contract
• Record US$ 1.05 billion financing secured for Cidade de Ilhabela
9
© SBM Offshore 2012. All rights reserved. www.sbmoffshore.com
20
12
20
13
20
14
20
15
20
16
20
17
20
18
20
19
20
20
20
21
20
22
20
23
20
24
20
25
20
26
20
27
20
28
20
29
20
30
20
31
20
32
20
33
20
34
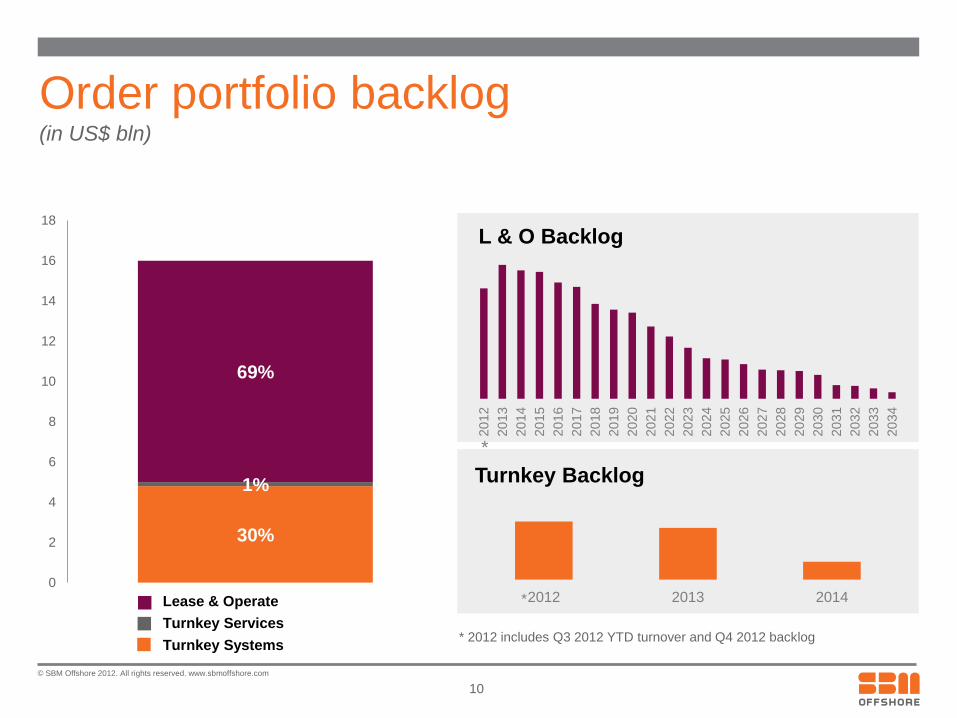
L & O Backlog
30%
1%
69%
0
2
4
6
8
10
12
14
16
18
*
* 2012 includes Q3 2012 YTD turnover and Q4 2012 backlog
10
Order portfolio backlog (in US$ bln)
Lease & Operate
Turnkey Systems
Turnkey Services
2012 2013 2014
Turnkey Backlog
*
© SBM Offshore 2012. All rights reserved. www.sbmoffshore.com
Transformation
11
© SBM Offshore 2012. All rights reserved. www.sbmoffshore.com
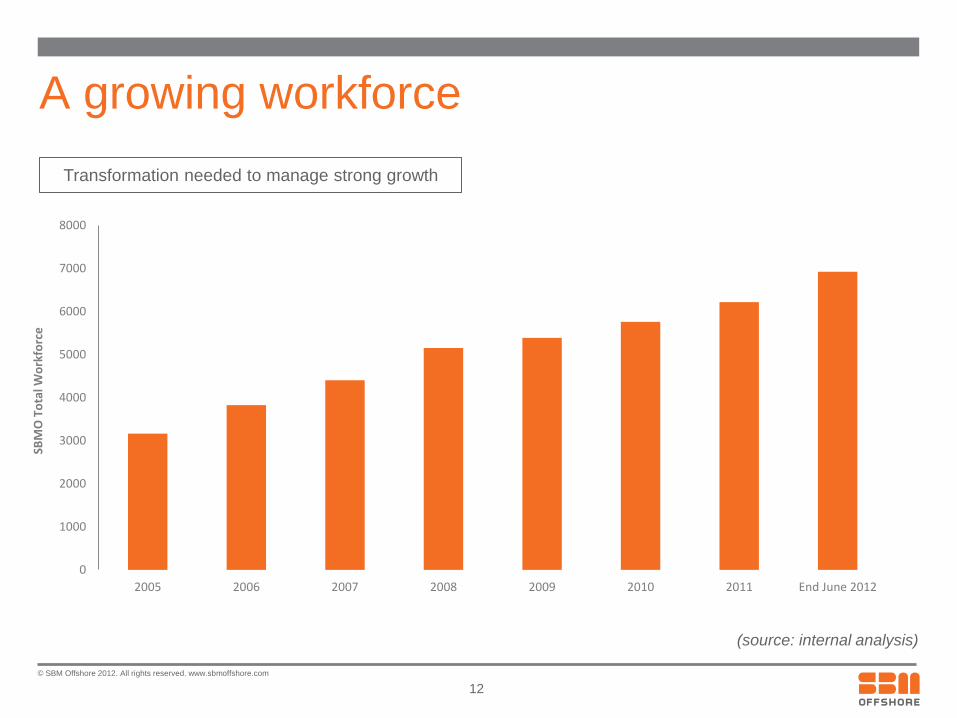
A growing workforce
12
(source: internal analysis)
Transformation needed to manage strong growth
0
1000
2000
3000
4000
5000
6000
7000
8000
2005 2006 2007 2008 2009 2010 2011 End June 2012
SBM
O T
ota
l Wo
rkfo
rce

© SBM Offshore 2012. All rights reserved. www.sbmoffshore.com
Growing production volume
13
(source: internal analysis)
Transformation needed to manage strong growth
700.00
750.00
800.00
850.00
900.00
950.00
1,000.00
2007 2008 2009 2010 2011
Th
ou
sa
nd
s
Average production in bl/day

© SBM Offshore 2012. All rights reserved. www.sbmoffshore.com
Group transformation in progress
14
FPSO strategy focus
Lead the industry transition towards improving risk/reward balance
New organisation profit
and cash flow
accountable
Strengthened
management team
Selective growth in
buoyant market

© SBM Offshore 2012. All rights reserved. www.sbmoffshore.com
Strengthened management team • The Board of Management
• Executive Committee: 5 Managing directors+ group functions
15
Wim Janse
MD SBM Monaco
Mike Wyllie
MD SBM PC (acting)
Bernard van Leggelo
MD SBM Houston Ivan Replumaz
MD SBM Kuala Lumpur
Yves Paletta
MD SBM Schiedam
Didier Beynet
Group HR director
Saskia Kunst
Group Strategy director
Erik van Kuijk
Group HSSE director
Bernard Verwilghen
Group Secretary
Oliver Kassam
Group Sales director
Bruno Chabas
CEO Peter van Rossum
CFO
Sietze Hepkema
CGCO
J.P. Laures
COO
Mike Wyllie
CTO
© SBM Offshore 2012. All rights reserved. www.sbmoffshore.com
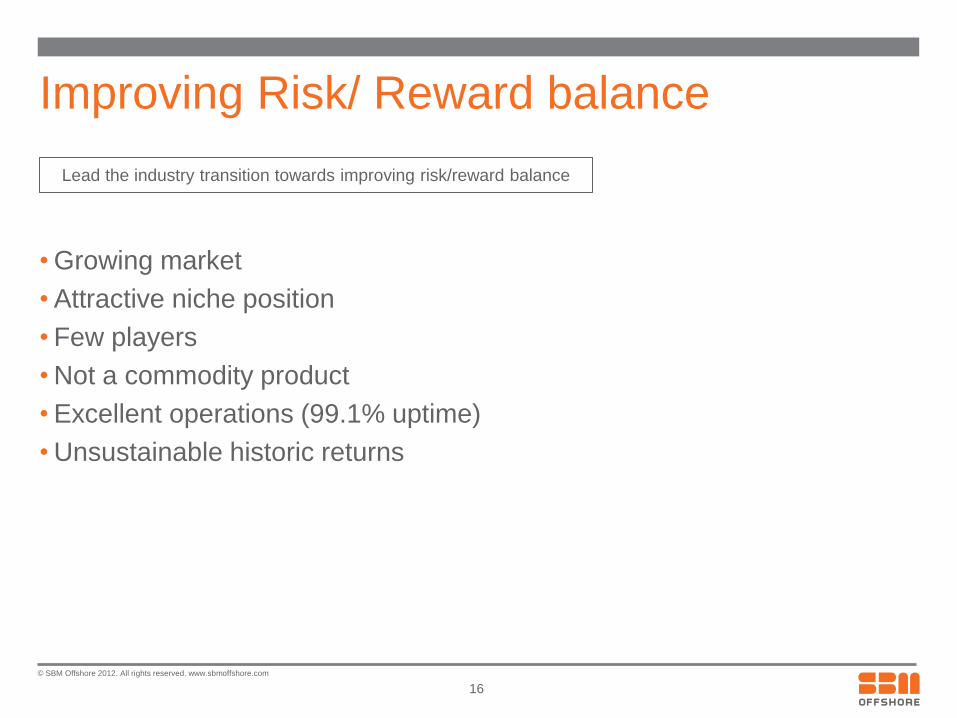
Improving Risk/ Reward balance
• Growing market
• Attractive niche position
• Few players
• Not a commodity product
• Excellent operations (99.1% uptime)
• Unsustainable historic returns
16
Lead the industry transition towards improving risk/reward balance
© SBM Offshore 2012. All rights reserved. www.sbmoffshore.com
Challenges and opportunities High demand for complex FPSOs Unsustainable industry returns
© SBM Offshore 2012. All rights reserved. www.sbmoffshore.com
0
5000
10000
15000
20000
25000
30000
Onshore 0-500 500-1000 1000-1500 1500-2000 2000+
in M
n b
ls
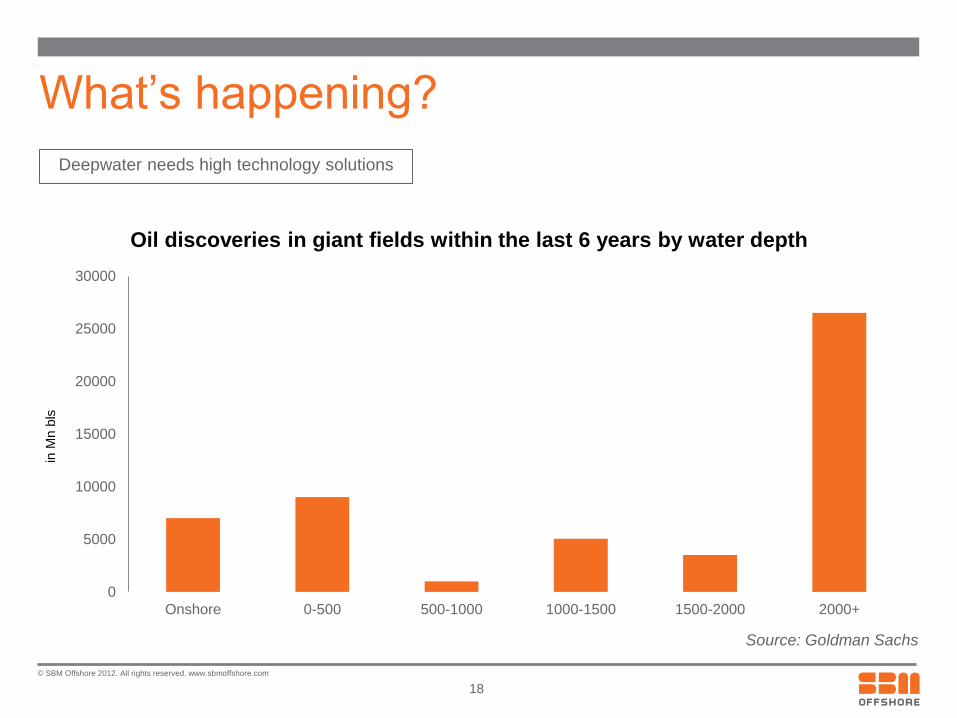
Oil discoveries in giant fields within the last 6 years by water depth
What’s happening?
Source: Goldman Sachs
18
Deepwater needs high technology solutions
© SBM Offshore 2012. All rights reserved. www.sbmoffshore.com
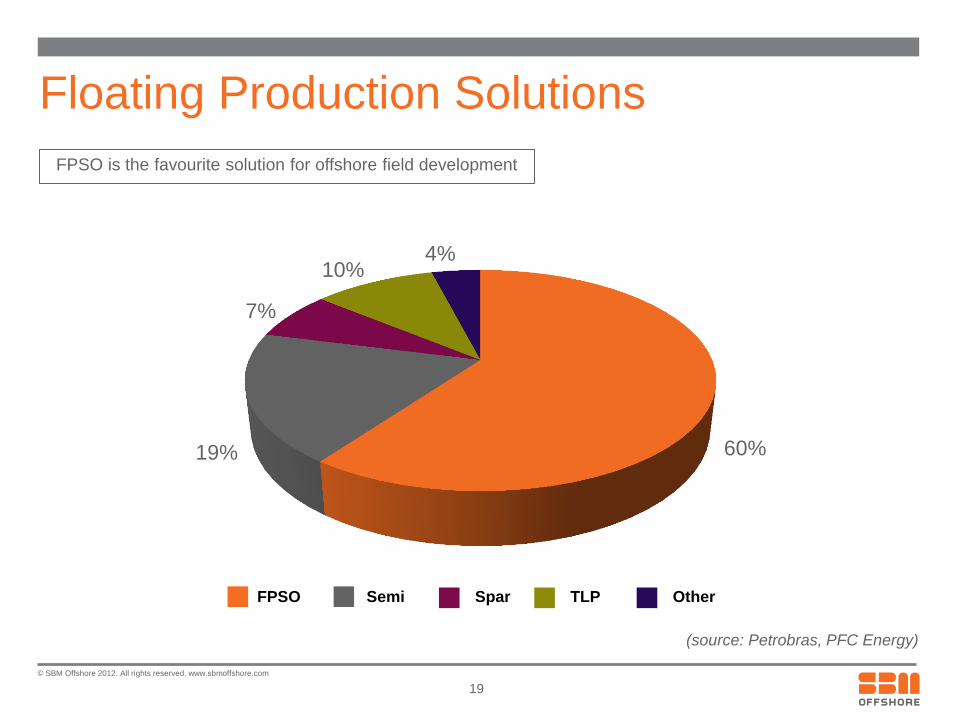
Floating Production Solutions
60% 19%
7%
10% 4%
19
(source: Petrobras, PFC Energy)
FPSO Semi Spar TLP Other
FPSO is the favourite solution for offshore field development
© SBM Offshore 2012. All rights reserved. www.sbmoffshore.com
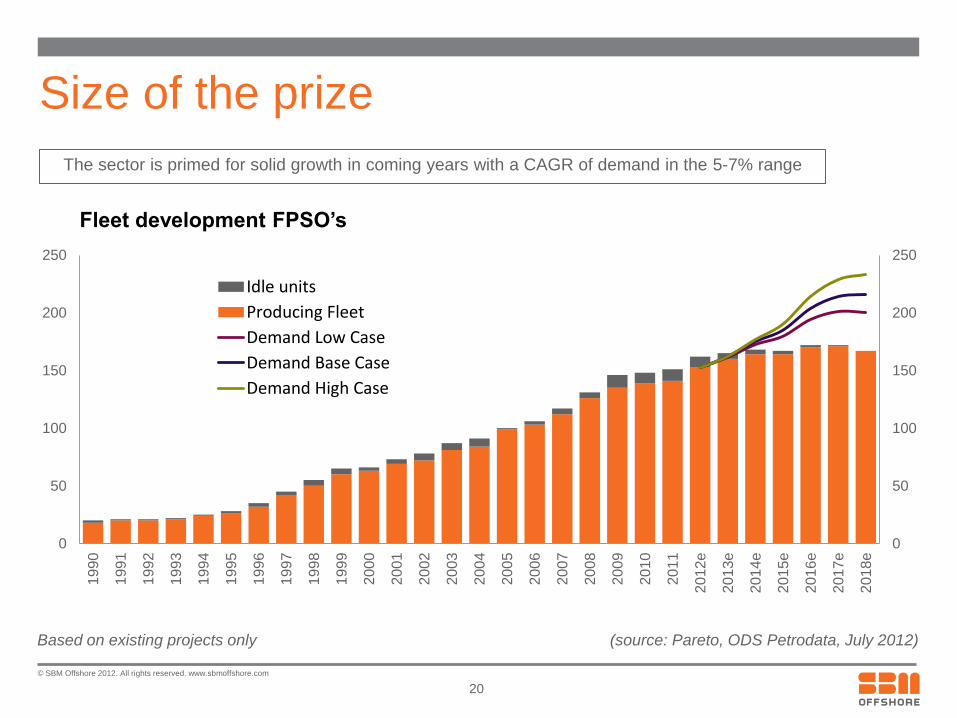
Size of the prize
20
Based on existing projects only (source: Pareto, ODS Petrodata, July 2012)
The sector is primed for solid growth in coming years with a CAGR of demand in the 5-7% range
0
50
100
150
200
250
0
50
100
150
200
250
1990
1991
1992
1993
1994
1995
1996
1997
1998
1999
2000
2001
2002
2003
2004
2005
2006
2007
2008
2009
2010
2011
2012e
2013e
2014e
2015e
2016e
2017e
2018e
Fleet development FPSO’s
Idle units
Producing Fleet
Demand Low Case
Demand Base Case
Demand High Case
© SBM Offshore 2012. All rights reserved. www.sbmoffshore.com
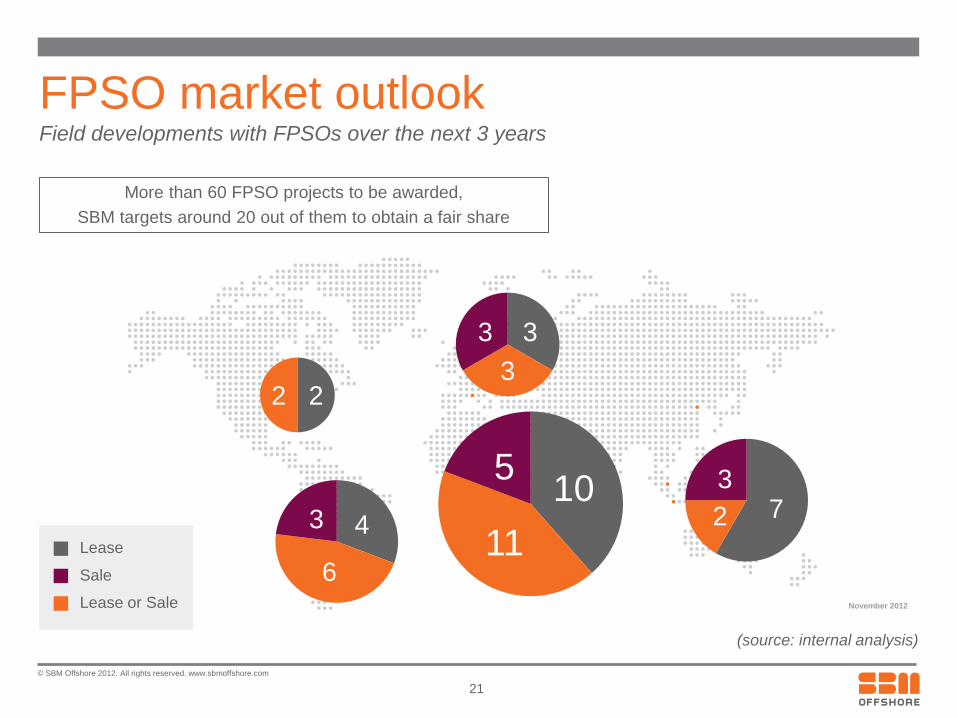
Field developments with FPSOs over the next 3 years
FPSO market outlook
November 2012
Lease
Sale
Lease or Sale
21
(source: internal analysis)
More than 60 FPSO projects to be awarded,
SBM targets around 20 out of them to obtain a fair share
10
11
5 7 2
3
4
6
3
3
3
3
2 2

© SBM Offshore 2012. All rights reserved. www.sbmoffshore.com
0
4,000
8,000
12,000
16,000
20,000
1996 1998 2000 2002 2004 2006 2008 2010 2012 2014 2016
To
psid
es W
eig
ht (t
on
)
Year of first oil
Rang Dong
Brasil Cachalote
Cd de Anchieta
FPSOs are getting heavier
22
Kuito
Espadarte
Xikomba
Falcon
Marlim
Sul
Serpentina
Cd de Paraty
Capixaba
P 57
Mondo Saxi
N’Goma
Cd de Ilhabela
Kikeh
Frade
BC 10 Aseng
(source: internal analysis)
Our clients are more and more technology demanding
SBM addresses this challenge
© SBM Offshore 2012. All rights reserved. www.sbmoffshore.com
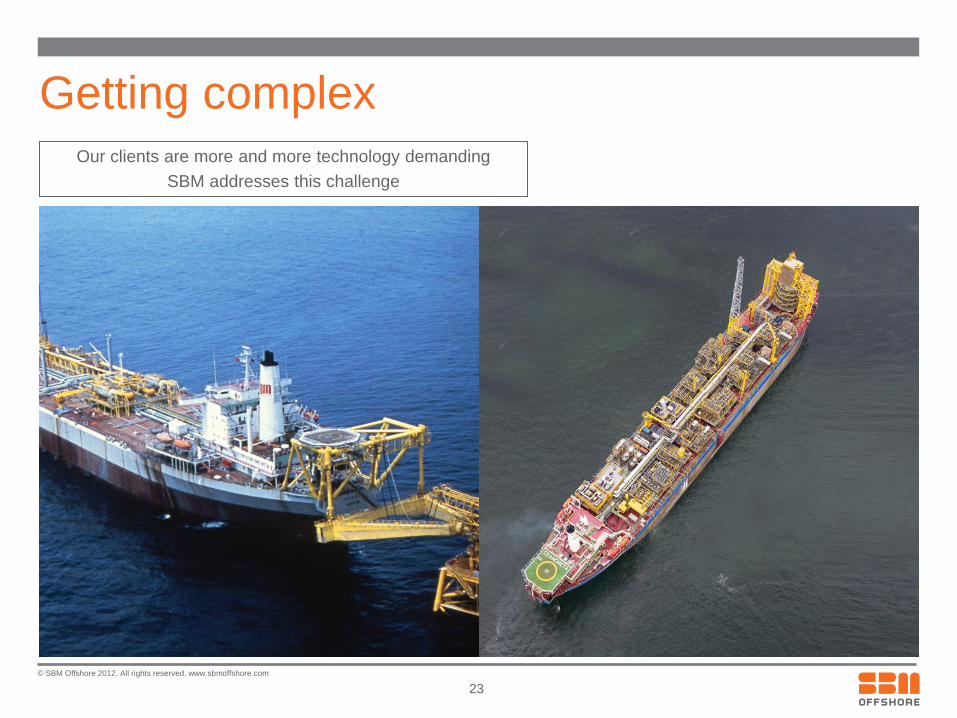
Getting complex
23
Our clients are more and more technology demanding
SBM addresses this challenge
© SBM Offshore 2012. All rights reserved. www.sbmoffshore.com
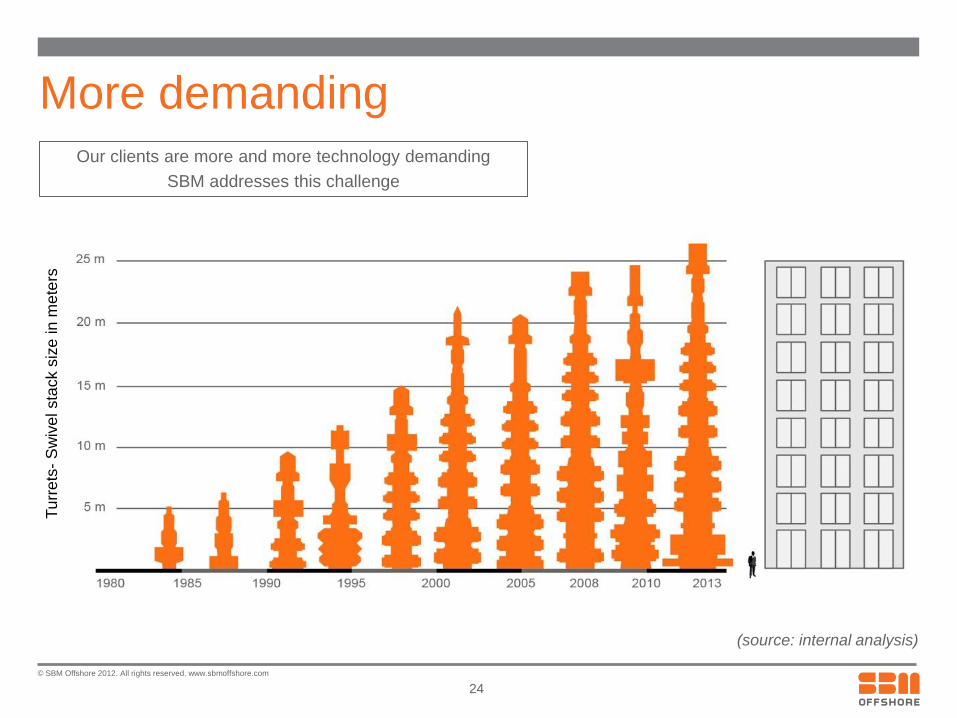
More demanding
24
(source: internal analysis)
Turrets – Swivel stack size
Our clients are more and more technology demanding
SBM addresses this challenge
Tu
rre
ts-
Sw
ive
l sta
ck s
ize
in m
ete
rs
© SBM Offshore 2012. All rights reserved. www.sbmoffshore.com
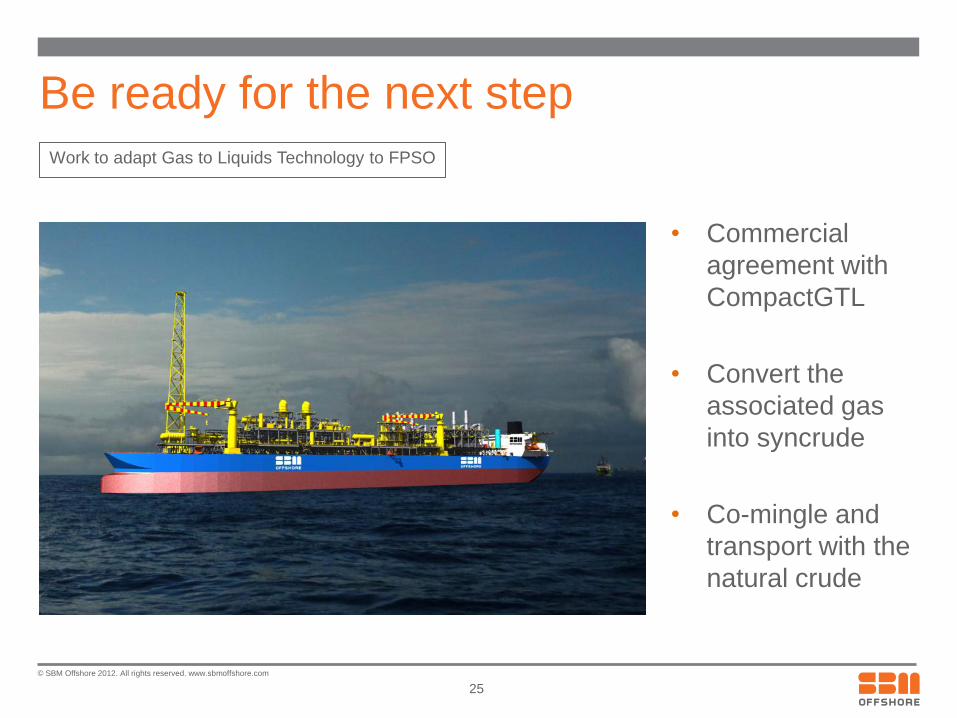
Be ready for the next step
• Commercial
agreement with
CompactGTL
• Convert the
associated gas
into syncrude
• Co-mingle and
transport with the
natural crude
25
Work to adapt Gas to Liquids Technology to FPSO
© SBM Offshore 2012. All rights reserved. www.sbmoffshore.com
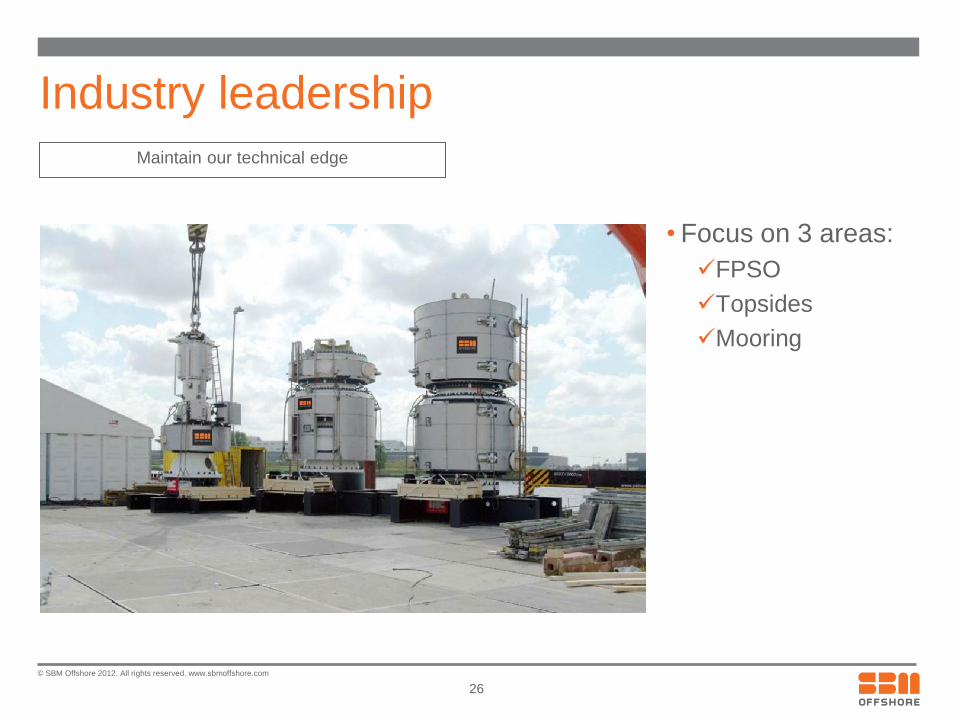
Industry leadership
• Focus on 3 areas:
FPSO
Topsides
Mooring
26
Maintain our technical edge

© SBM Offshore 2012. All rights reserved. www.sbmoffshore.com
FPSOs are not a commodity
• Full life
production
solution
• Qualitative
differentiation
• Non
exchangeable
27
Bespoke solutions for full product lifecycle
© SBM Offshore 2012. All rights reserved. www.sbmoffshore.com
Challenges and opportunities High demand for complex FPSOs Unsustainable industry returns
28

© SBM Offshore 2012. All rights reserved. www.sbmoffshore.com
FPSO: unsustainable industry ranking
-24.9%
-14.1%
-13.9%
-7.2%
-6.8%
-5.0%
-3.9%
-3.9%
-2.7%
1.9%
2.0%
2.2%
6.0%
9.5%
14.3%
14.6%
16.0%
16.5%
16.9%
20.3%
22.2%
24.4%
31.1%
-50.0% -40.0% -30.0% -20.0% -10.0% 0.0% 10.0% 20.0% 30.0% 40.0% 50.0%
BW OFFSHORE
SBM OFFSHORE
HELIX ENERGY SOLUTIONS
TEEKAY
AP MOELLER-MAERSK
MODEC
JACOBS ENGINEERING GROUP
MCDERMOTT INTL
AKER SOLUTIONS
SUBSEA 7
KBR
FOSTER WHEELER
CHICAGO BRIDGE & IRON
FUGRO NV-CVA
TECHNIP
WORLEY PARSONS
AMEC
SAIPEM
WOOD GROUP (JOHN)
OIL STATES INTERNATIONAL
OCEANEERING INTL
FMC TECHNOLOGIES
PETROFAC
SBM OFFSHORE
BW OFFSHORE
TEEKAY
AP MOELLER-MAERSK
MODEC
TSR Peer Group Ranking 2007 – 1H2012, %CAGR
29
(source: Bloomberg, internal data)
Total Shareholders Return for FPSO industry negative
© SBM Offshore 2012. All rights reserved. www.sbmoffshore.com
-25.0%
-20.0%
-15.0%
-10.0%
-5.0%
0.0%
5.0%
10.0%
2007 2008 2009 2010 2011 5yr avg
SBMO Modec BWO Teekay Aker Floating Production Bluewater Group
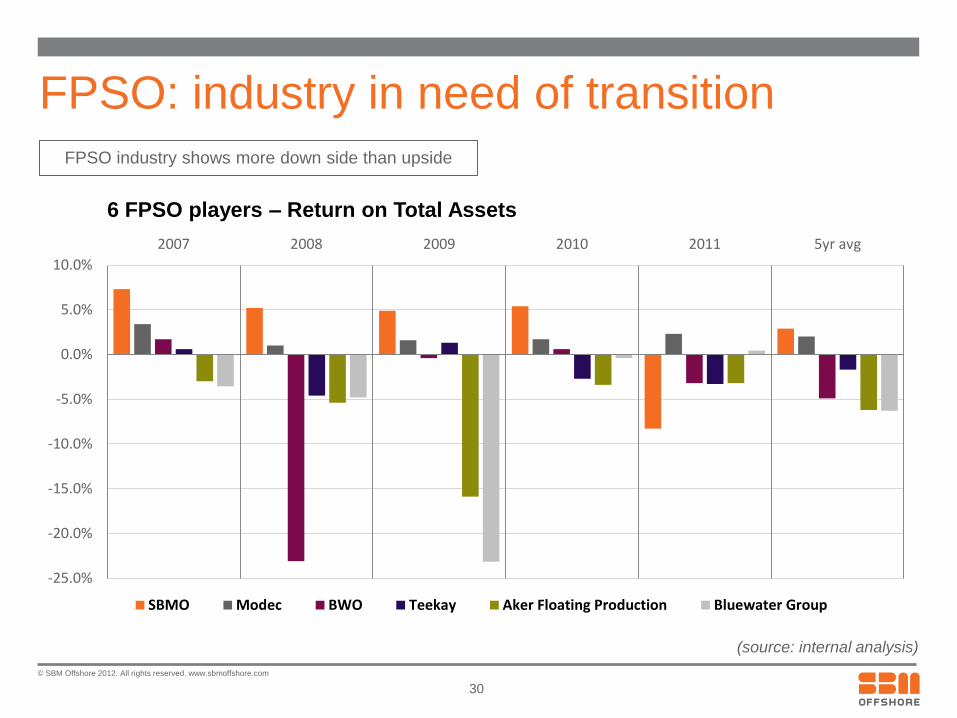
FPSO: industry in need of transition
6 FPSO players – Return on Total Assets
30
FPSO industry shows more down side than upside
(source: internal analysis)
© SBM Offshore 2012. All rights reserved. www.sbmoffshore.com
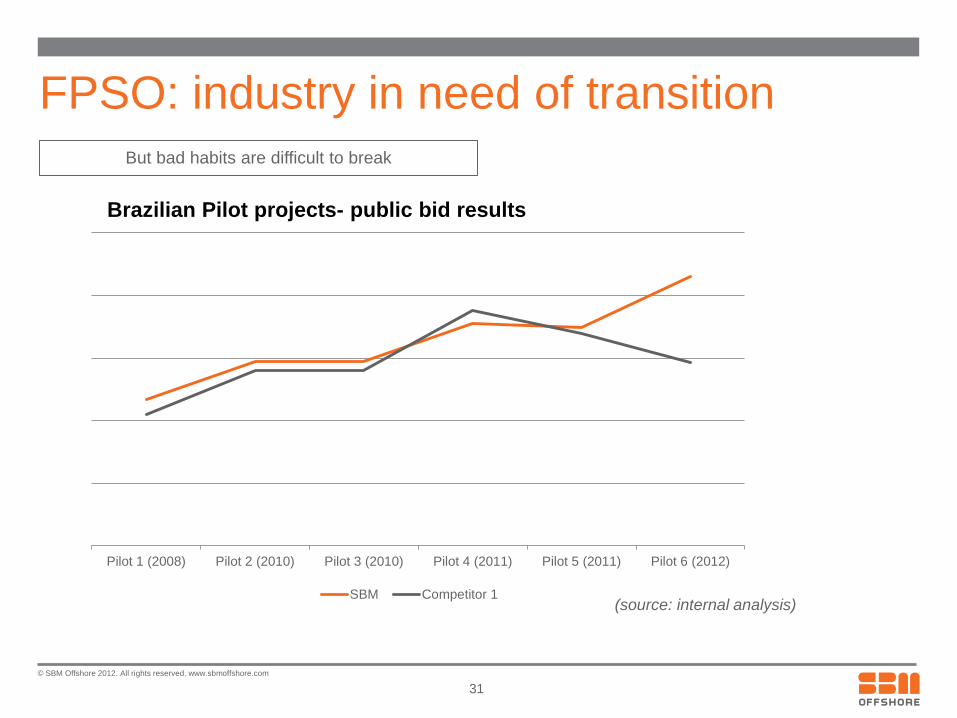
FPSO: industry in need of transition
Brazilian Pilot projects- public bid results
31
But bad habits are difficult to break
(source: internal analysis)
Pilot 1 (2008) Pilot 2 (2010) Pilot 3 (2010) Pilot 4 (2011) Pilot 5 (2011) Pilot 6 (2012)
SBM Competitor 1

© SBM Offshore 2012. All rights reserved. www.sbmoffshore.com
Our Strategy
32
© SBM Offshore 2012. All rights reserved. www.sbmoffshore.com
33
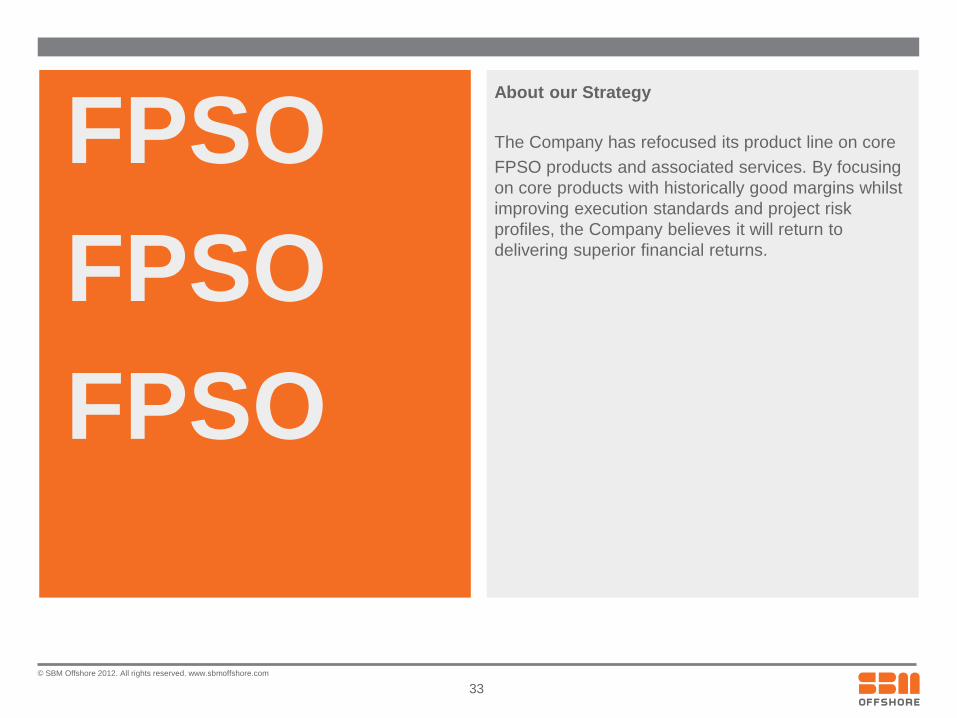
FPSO
FPSO
FPSO
About our Strategy
The Company has refocused its product line on core
FPSO products and associated services. By focusing
on core products with historically good margins whilst
improving execution standards and project risk
profiles, the Company believes it will return to
delivering superior financial returns.
© SBM Offshore 2012. All rights reserved. www.sbmoffshore.com
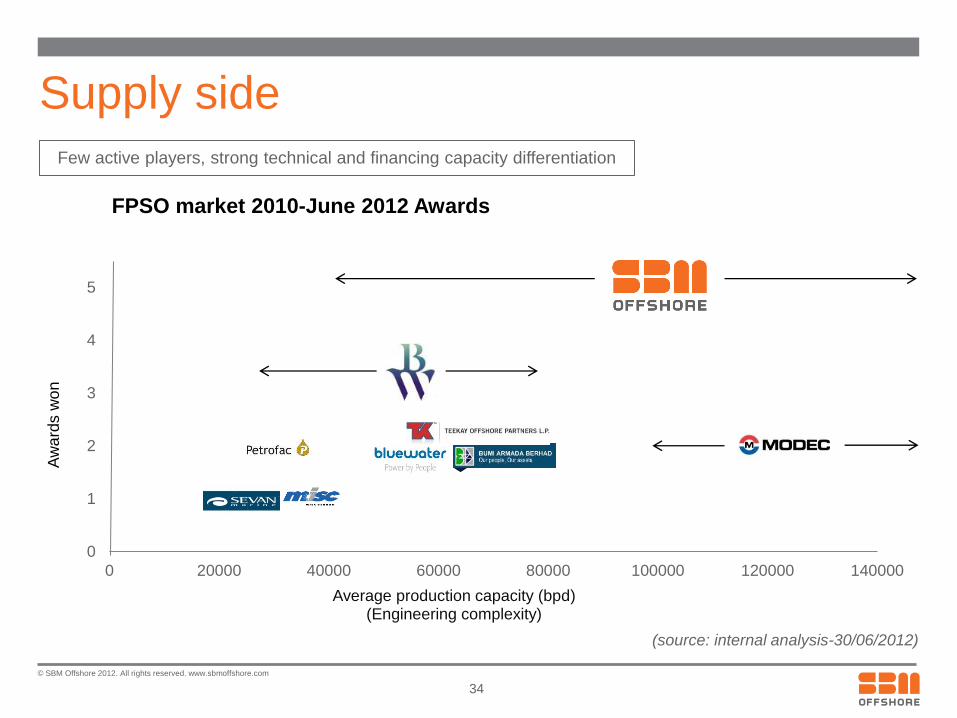
0
1
2
3
4
5
0 20000 40000 60000 80000 100000 120000 140000
Aw
ard
s w
on
Average production capacity (bpd) (Engineering complexity)
Supply side
34
(source: internal analysis-30/06/2012)
FPSO market 2010-June 2012 Awards
Few active players, strong technical and financing capacity differentiation
© SBM Offshore 2012. All rights reserved. www.sbmoffshore.com
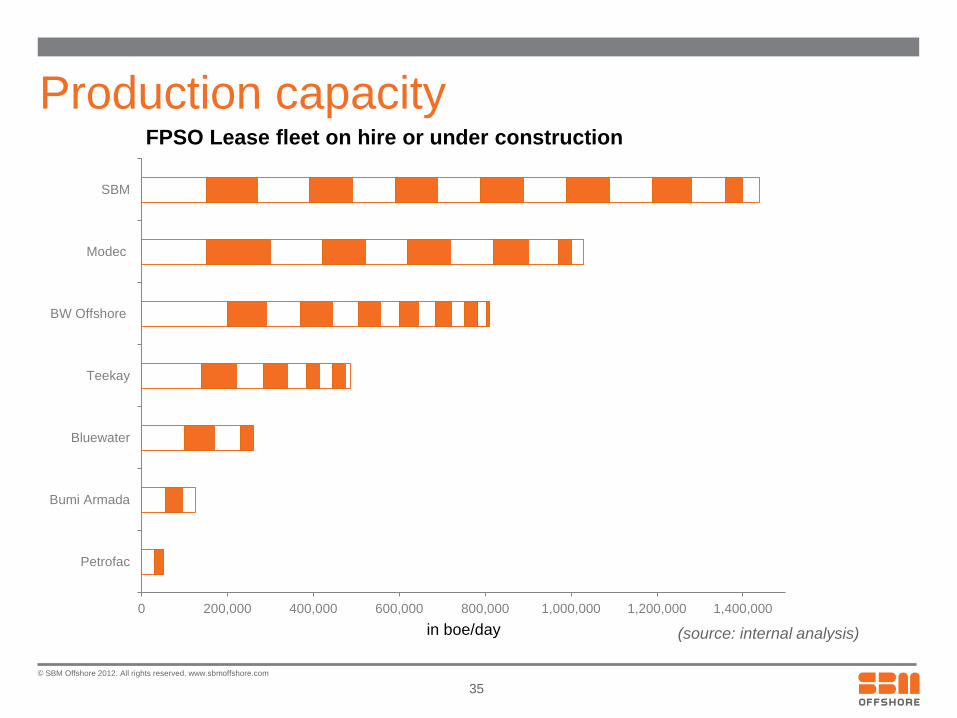
Production capacity
(source: internal analysis)
0 200,000 400,000 600,000 800,000 1,000,000 1,200,000 1,400,000
Petrofac
Bumi Armada
Bluewater
Teekay
BW Offshore
Modec
SBM
in boe/day
FPSO Lease fleet on hire or under construction
35
© SBM Offshore 2012. All rights reserved. www.sbmoffshore.com
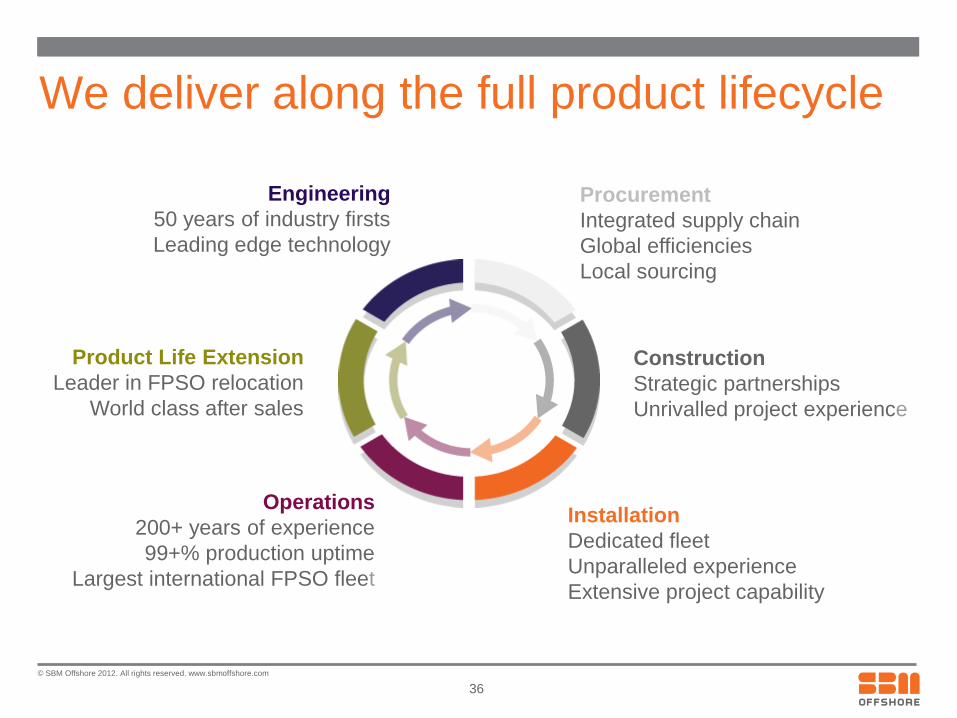
We deliver along the full product lifecycle
SBM Offshore - Running head. 6pt Arial Regular SBM Offshore - Running head. 6pt Arial Regular
Product Life Extension
Leader in FPSO relocation
World class after sales
Operations
200+ years of experience
99+% production uptime
Largest international FPSO fleet
Installation
Dedicated fleet
Unparalleled experience
Extensive project capability
Construction
Strategic partnerships
Unrivalled project experience
Procurement
Integrated supply chain
Global efficiencies
Local sourcing
Engineering
50 years of industry firsts
Leading edge technology
36
© SBM Offshore 2012. All rights reserved. www.sbmoffshore.com
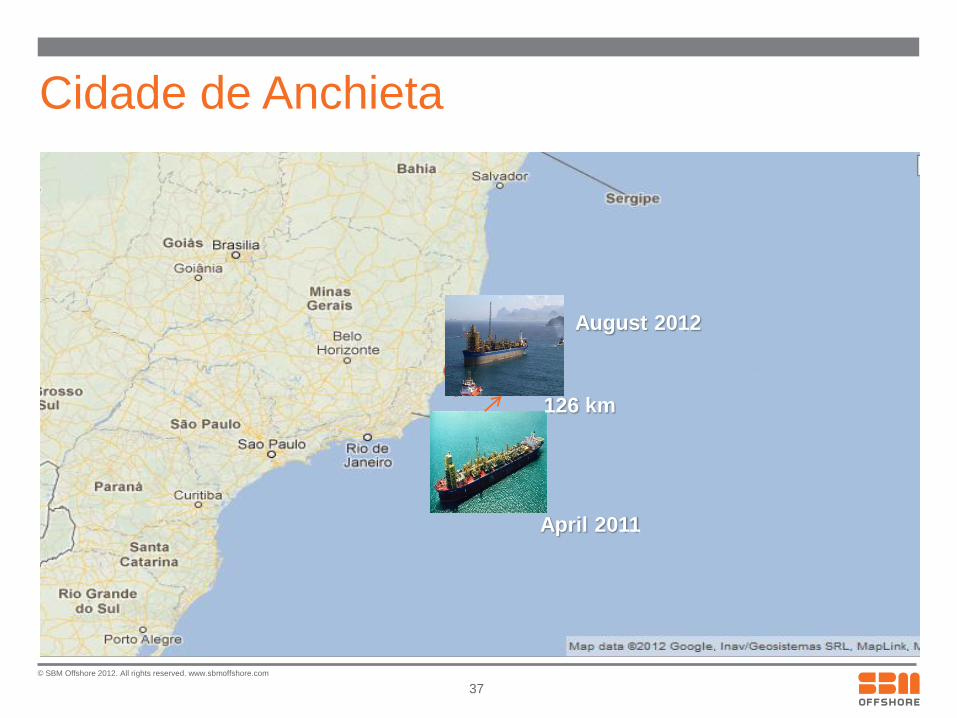
Cidade de Anchieta
37
August 2012
April 2011
126 km
© SBM Offshore 2012. All rights reserved. www.sbmoffshore.com
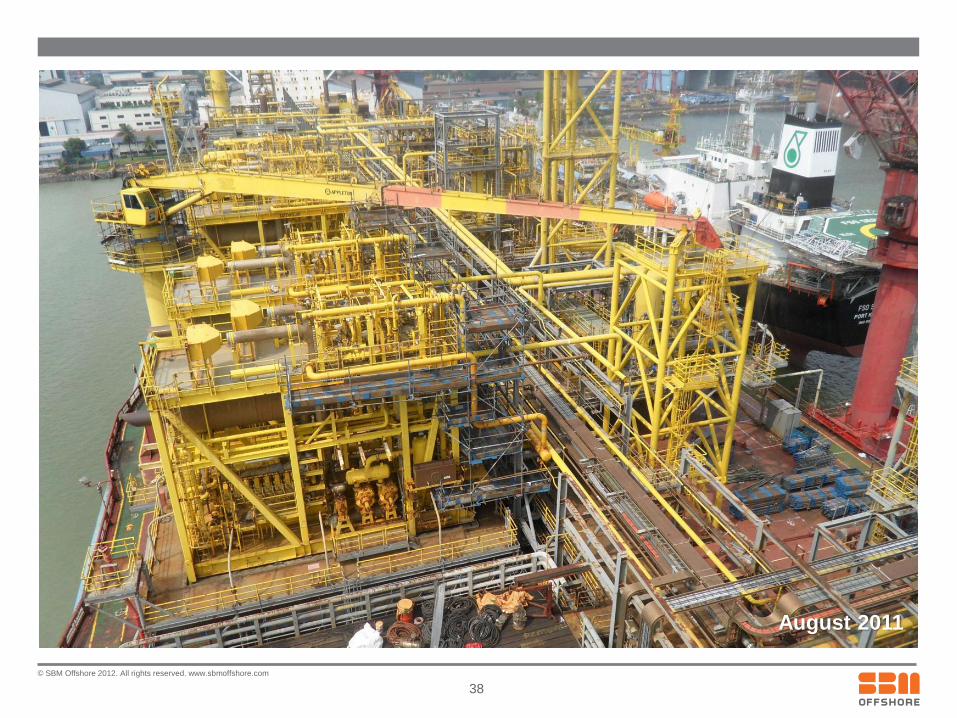
August 2011
38
© SBM Offshore 2012. All rights reserved. www.sbmoffshore.com
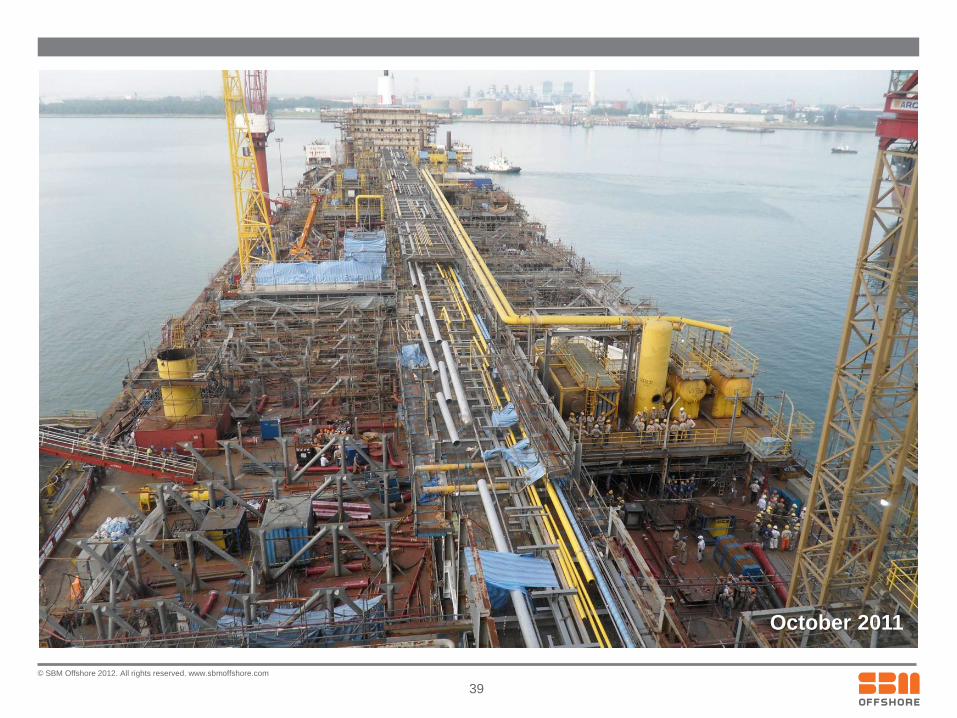
October 2011
39

© SBM Offshore 2012. All rights reserved. www.sbmoffshore.com
Year-end 2011
40

© SBM Offshore 2012. All rights reserved. www.sbmoffshore.com
41