STRATEGY & FUNDING FOR THE DEPARTMENT OF BASIC …
69
DG: Department of Basic Education Mr HM Mweli Date: 19-20 June 2017 STRATEGY & FUNDING FOR THE DEPARTMENT OF BASIC EDUCATION IN THE MEDIUM-TERM BRIEFING ON BASIC EDUCATION
Transcript of STRATEGY & FUNDING FOR THE DEPARTMENT OF BASIC …

DG: Department of Basic Education Mr HM Mweli
Date: 19-20 June 2017
STRATEGY & FUNDING FOR THE DEPARTMENT OF BASIC EDUCATION IN THE
MEDIUM-TERM
BRIEFING ON BASIC EDUCATION

PRESENTATION OUTLINE 1. Purpose
2. Introduction
3. Size and Shape of Basic Education Sector
4. Strategic Direction
5. Key trend in Education General Household Survey (GHS) till 2015
6. 2017 MTEF Sector Allocation
7. Conclusion
2

1. PURPOSE
To make an overview presentation on the strategic priorities and progress in the Basic Education Sector.
3

2. INTRODUCTION “By 2030, South Africans should have access to education and training of the highest quality, leading to significantly improved learning outcomes. The performance of South African learners in international standardised tests should be comparable to the performance of learners from countries at a similar level of development and with similar levels of access.”
National Planning Commission: National Development Plan, November 2011)
4

3. THE SIZE AND
SHAPE OF BASIC
EDUCATION SECTOR
5

Provincial Education Department (9)
Education Districts (81) Circuit Offices
Schools (25 574)
Public schools (23 719) Independent (Private) schools (1 855)
Section 20 Public schools Section 21 Public Schools (former
Model C) Registered independent schools Unregistered independent schools
(illegal)
Non-subsidised
independent schools
Subsidised independent
schools
Greater financial autonomy
National Department of
Basic Education
BASIC EDUCATION SECTOR
7
6
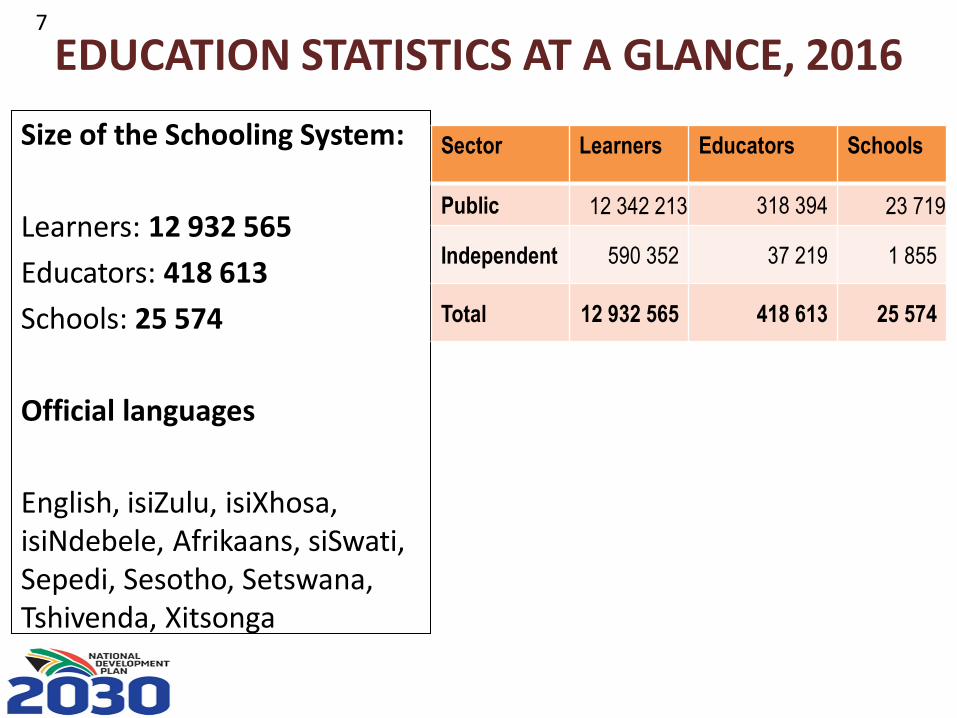
EDUCATION STATISTICS AT A GLANCE, 2016
Size of the Schooling System:
Learners: 12 932 565
Educators: 418 613
Schools: 25 574
Official languages
English, isiZulu, isiXhosa, isiNdebele, Afrikaans, siSwati, Sepedi, Sesotho, Setswana, Tshivenda, Xitsonga
Sector Learners Educators Schools
Public 12 342 213 318 394 23 719
Independent 590 352 37 219 1 855
Total 12 932 565 418 613 25 574
7

NUMBER OF LEARNERS, EDUCATORS AND SCHOOLS IN THE ORDINARY SCHOOL SECTOR, BY PROVINCE IN 2016
PROVINCE
PUBLIC INDEPENDENT
LEARNERS EDUCATORS SCHOOLS LEARNERS EDUCATORS SCHOOLS
EC 1 898 723 58 372 5 469 62 824 3 257 207
FS 671 712 22 465 1 214 16 637 1 058 68
GP 2 048 558 63 092 2 083 278 026 18 986 730
KZN 2 808 137 84 810 5 895 69 407 989 247
LP 1 706 725 51 650 3 867 58 830 2 768 151
MP 1 046 234 34 034 1 725 28 118 370 122
NC 287 435 8 841 545 4 080 295 30
NW 811 340 24 876 1 471 19 207 1 232 63
WC 1 063 349 33 254 1 450 53 223 4 264 237
South Africa
12 342 213 381 394 23 719 590 352 37 219 1 855
8

9
4.
STRATEGIC
DIRECTION
Our future -
make it work
9

4.1 THE 2015 WORLD EDUCATION FORUM DECLARATION
'Inclusion and equity in and through education is the cornerstone of a transformative education agenda, and we therefore commit to addressing all forms of exclusion and marginalization, disparities and inequalities in access, participation and learning outcomes. No education target should be considered met unless met by all.'
World Education Forum: Incheon Declaration, 2015, article 7.
10

4.2 SUSTAINABLE DEVELOPMENT GOALS (SDG4)
Towards inclusive and equitable quality
education and promote lifelong learning
opportunities for all
11

4.3 AU VISION
“The African Union envisions a “peaceful and prosperous Africa, integrated, led by its own citizens and occupying the place it deserves in the global community and in the knowledge economy” CESA 16-25 is meant to deliver the necessary human capital for the realization of the AU Vision”.
Continental Education Strategy for Africa (CESA) 2016-2025
12

4.4 MISSION OF CESA 16-25
“Reorienting Africa’s education and training systems to meet the knowledge, competencies, skills, innovation and creativity required to nurture African core values and promote sustainable development at the national, sub-regional and continental levels.”
Continental Education Strategy for Africa (CESA) 2016-2025
13

4.5 MTSF 2014-2019 • Basic Education priorities for the 2014-2019 MTSF are as
follows: – Improved quality of teaching and learning through development,
supply and effective utilisation of teachers.
– Improved quality of teaching and learning through provision of adequate, quality infrastructure and Learning and Teaching Support Materials (LTSM).
– Improving assessment for learning to ensure quality and efficiency in academic achievement.
– Expanded access to Early Childhood Development (ECD) and improvement of the quality of Grade R, with support for pre-Grade R provision.
– Strengthening accountability and improving management at the school, community and district level.
– Partnerships for education reform and improved quality.
14
14

4.6 ACTION PLAN TO 2019: TOWARDS THE REALISATION OF SCHOOLING 2030
Linked to the National Development Plan and MTSF is the Sector Plan: Action Plan to 2019: Towards the Realisation of schooling 2030 with 27 goals summarised as follows: • Goals 1-13: Learner outputs at grade 3, 6, 9 and 12 • Goal 14-17: Educators • Goal 18: Curriculum completion • Goal: 19: Textbooks • Goal: 20: Computers, media • Goal 21: Functionality of schools • Goal 22: Community participation • Goal 23: Minimum levels of funding schools • Goal 24: Infrastructure • Goal 25: Social cohesion and support services • Goal 26: Inclusive Education • Goal 27: School Monitoring
15
15
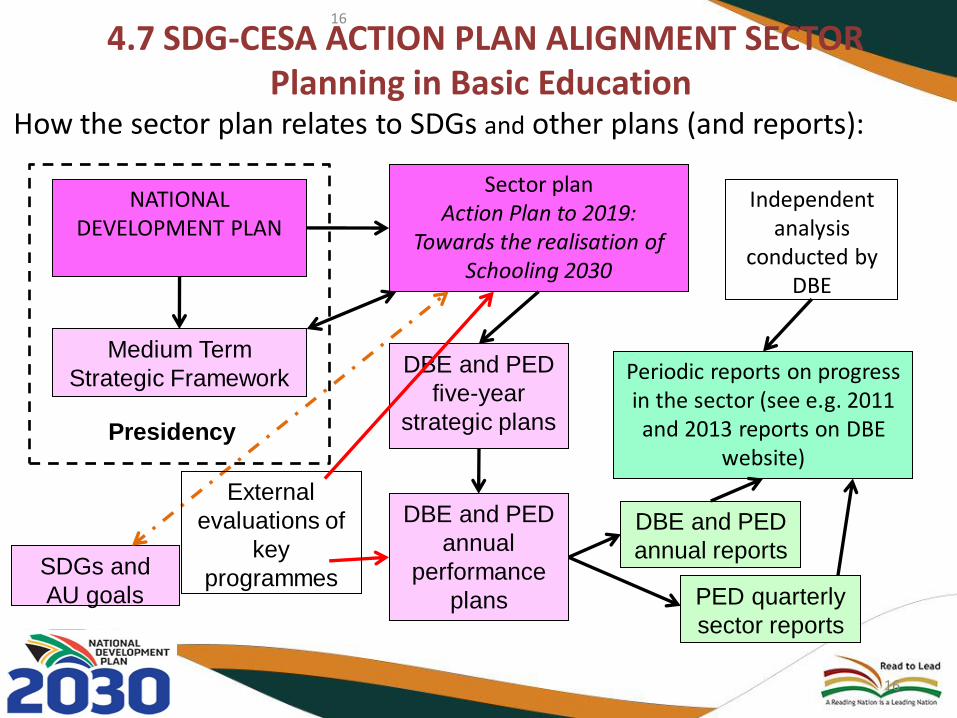
4.7 SDG-CESA ACTION PLAN ALIGNMENT SECTOR Planning in Basic Education
16
How the sector plan relates to SDGs and other plans (and reports):
Sector plan
Action Plan to 2019: Towards the realisation of
Schooling 2030
Medium Term
Strategic Framework
NATIONAL DEVELOPMENT PLAN
DBE and PED
five-year
strategic plans
DBE and PED
annual
performance
plans
Periodic reports on progress in the sector (see e.g. 2011 and 2013 reports on DBE
website)
DBE and PED
annual reports
Presidency
Independent analysis
conducted by DBE
PED quarterly
sector reports
SDGs and
AU goals
External
evaluations of
key
programmes
16
4.8 Alignment between the National Development Plan, Education Sector Plan (Action Plan 2019), the Medium-Term Strategic Framework 2014-2019, Sustainable Development
Goals and the African Union Strategic Objectives
17
17


5. THE 2017 MTEF
SECTOR ALLOCATION
19

5.1 IMPLICATIONS OF THE 2017 MTEF 2017 MTEF AND BASELINE CHANGES:
Provincial Education Budgets…
R'000
Province 2017/18 2018/19 2019/20 2017/18 2018/19 2019/20 Total
EC 32 989 055 35 097 333 37 587 452 31 315 267 494 737 482 1 036 291
FS 12 739 378 13 614 009 14 586 931 -283 522 -99 162 78 396 -304 288
GP 40 843 869 44 378 271 46 754 956 296 945 1 481 086 1 369 734 3 147 766
KZN 47 476 599 50 631 848 53 791 211 -51 960 382 770 627 686 958 496
LP 28 783 149 30 440 345 32 194 772 690 982 928 225 970 949 2 590 156
MP 19 322 742 20 921 129 22 095 256 -26 126 356 190 337 551 667 615
NC 5 857 848 6 139 973 6 496 564 189 393 126 956 134 792 451 140
NW 15 150 111 16 123 204 17 252 786 -21 462 -17 513 175 907 136 932
WC 20 629 914 21 913 385 23 107 146 340 492 442 551 391 004 1 174 047
TOTAL 223 792 665 239 259 497 253 867 074 1 166 057 3 868 596 4 823 501 9 858 154
2017 MTEF BASELINE INCREASE 2017 MTEF
20
20

2017 MTEF AND BASELINE CHANGES:
Provincial Education Budgets…
• North West data exclude the programme: Sports and Recreation; • Additional baseline increase of R9.8 billion over the 2017 MTEF; • All PEDs have positively contributed to this baseline increase except the Free State; • KwaZulu-Natal and Mpumalanga have recorded a baseline decrease only in the first year of the 2017 MTEF; and • The North West has recorded a baseline decrease in the first two years of the MTEF, i.e. 2017/18 and 2018/19
R'000
Province 2017/18 2018/19 2019/20 2017/18 2018/19 2019/20 Total
EC 32 989 055 35 097 333 37 587 452 31 315 267 494 737 482 1 036 291
FS 12 739 378 13 614 009 14 586 931 -283 522 -99 162 78 396 -304 288
GP 40 843 869 44 378 271 46 754 956 296 945 1 481 086 1 369 734 3 147 766
KZN 47 476 599 50 631 848 53 791 211 -51 960 382 770 627 686 958 496
LP 28 783 149 30 440 345 32 194 772 690 982 928 225 970 949 2 590 156
MP 19 322 742 20 921 129 22 095 256 -26 126 356 190 337 551 667 615
NC 5 857 848 6 139 973 6 496 564 189 393 126 956 134 792 451 140
NW 15 150 111 16 123 204 17 252 786 -21 462 -17 513 175 907 136 932
WC 20 629 914 21 913 385 23 107 146 340 492 442 551 391 004 1 174 047
TOTAL 223 792 665 239 259 497 253 867 074 1 166 057 3 868 596 4 823 501 9 858 154
2017 MTEF BASELINE INCREASE 2017 MTEF
21
21

2017 MTEF AND BASELINE CHANGES: Programme Level…
22
22

2017 MTEF AND BASELINE CHANGES: Economic Classification Level (i)…
Overall
R'000
2016/17 Adjusted
appropriation 2017/18 2018/19 2017/18 2018/19 2019/20
Personnel 165 441 166 176 989 499 187 844 754 7% 176 753 731 189 674 533 202 380 352 7%
NPNC 35 773 632 35 085 868 36 542 809 3% 36 866 286 39 372 958 41 171 890 5%
Capital 11 758 544 10 551 242 11 003 336 1% 10 172 649 10 212 006 10 314 832 -4%
TOTAL 212 973 342 222 626 609 235 390 899 6% 223 792 665 239 259 497 253 867 074 6%
2016 MTEF Average
annual
growth
(2016/17 to
2018/19)
2017 MTEF Average
annual
growth
(2017/18 to
2019/20)
OVERALL
R'000 2017/18 2017/19 2017/20 Total
Personnel -235 768 1 829 779 3 640 602 5 234 613
NPNC 1 780 418 2 830 149 2 509 598 7 120 164
Capital -378 593 -791 330 -1 326 697 -2 496 620
TOTAL 1 166 056 3 868 598 4 823 503 9 858 157
2017 MTEF -- Baseline changes in economic classification
23
23

2017 MTEF AND BASELINE CHANGES: Economic Classification Level (ii)…
Economic Classification
2017/18 2018/19 2019/20 2017/18 2018/19 2019/20
Current payments 196 680 122 211 110 786 224 883 024 1 446 432 4 065 375 5 828 979 11 340 786
Compensation of employees 176 753 734 189 674 527 202 380 345 (235 765) 1 829 773 3 640 595 5 234 603
Goods and services 19 926 388 21 436 259 22 502 679 1 682 197 2 235 602 2 188 384 6 106 183
Transfers and subsidies16 902 559 17 930 943 18 663 122 92 775 588 791 315 125 996 691
Payments for capital assets10 209 983 10 217 768 10 320 928 (373 152) (785 568) (1 320 601) (2 479 321)
Total economic classification223 792 664 239 259 497 253 867 074 1 166 055 3 868 598 4 823 503 9 858 156
2017 MTEF Changes to Baseline
Total changes to
baseline
24
24
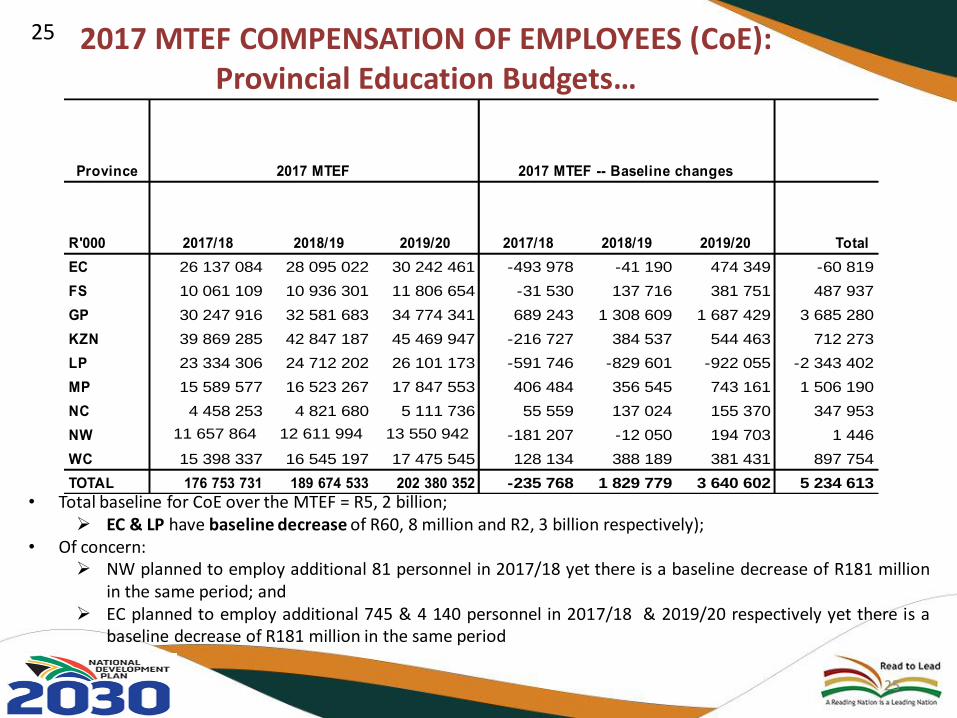
2017 MTEF COMPENSATION OF EMPLOYEES (CoE): Provincial Education Budgets…
Province
R'000 2017/18 2018/19 2019/20 2017/18 2018/19 2019/20 Total
EC 26 137 084 28 095 022 30 242 461 -493 978 -41 190 474 349 -60 819
FS 10 061 109 10 936 301 11 806 654 -31 530 137 716 381 751 487 937
GP 30 247 916 32 581 683 34 774 341 689 243 1 308 609 1 687 429 3 685 280
KZN 39 869 285 42 847 187 45 469 947 -216 727 384 537 544 463 712 273
LP 23 334 306 24 712 202 26 101 173 -591 746 -829 601 -922 055 -2 343 402
MP 15 589 577 16 523 267 17 847 553 406 484 356 545 743 161 1 506 190
NC 4 458 253 4 821 680 5 111 736 55 559 137 024 155 370 347 953
NW 11 657 864 12 611 994 13 550 942 -181 207 -12 050 194 703 1 446
WC 15 398 337 16 545 197 17 475 545 128 134 388 189 381 431 897 754
TOTAL 176 753 731 189 674 533 202 380 352 -235 768 1 829 779 3 640 602 5 234 613
2017 MTEF -- Baseline changes2017 MTEF
• Total baseline for CoE over the MTEF = R5, 2 billion; EC & LP have baseline decrease of R60, 8 million and R2, 3 billion respectively);
• Of concern: NW planned to employ additional 81 personnel in 2017/18 yet there is a baseline decrease of R181 million
in the same period; and EC planned to employ additional 745 & 4 140 personnel in 2017/18 & 2019/20 respectively yet there is a
baseline decrease of R181 million in the same period
25
25

PERSONNEL TREND OVER 2017 MTEF…
Changes in the number of personnel
Province 2016/17 2017/18 2018/19 2019/20 2017/18 2018/19 2019/20
EC 73 338 74 083 74 087 78 227 745 4 4 140
FS 30 968 28 734 28 638 28 389 -2 234 -96 -249
GP 100 041 113 381 115 564 117 354 13 340 2 183 1 790
KZN 115 635 115 635 115 635 115 635 0 0 0
LP 68 687 68 511 68 511 68 511 -176 0 0
MP 42 535 43 101 42 687 45 074 566 -414 2 387
NC 12 890 13 860 13 860 13 861 970 0 1
NW* 32 512 32 593 32 593 32 593 81 0 0
WC 40 305 40 442 40 442 40 442 137 0 0
Total 516 911 530 340 532 017 540 086 13 429 1 677 8 069
2017 MTEF
• Key cost drivers = Learners and educators/ personnel • PEDs should ensure that before increasing the number of personnel, there is adequate budget for that. E.g. EC CoE
has a baseline decrease over the 2017 MTEF but is projecting to increase the number of personnel (significantly in 2017/18 and 2019/20).
26
26

PERCENTAGE OF CoE BUDGET AGAINST THE TOTAL BUDGET OVER THE 2017 MTEF…
Province 2017/18 2018/19 2019/20 Average over the MTEF
EC 79.2% 80.0% 80.5% 79.9%
FS 79.0% 80.3% 80.9% 80.1%
GP 74.1% 73.4% 74.4% 74.0%
KZN 84.0% 84.6% 84.5% 84.4%
LP 81.1% 81.2% 81.1% 81.1%
MP 80.7% 79.0% 80.8% 80.1%
NC 76.1% 78.5% 78.7% 77.8%
NW 76.9% 78.2% 78.5% 77.9%
WC 74.6% 75.5% 75.6% 75.3%
TOTAL 79.0% 79.3% 79.7% 79.3%
• FS, KZN, LP AND MP budgets over the 2017 MTEF: Not in line with the recommended 80:20 personnel & non-personnel split (EC only in 2019/20 financial year).
27
27

SCHOOL ENROLLMENT PATTERN: 2015 AND 2016
• School enrolment: Increased by 11 9 400, i.e. from 12 779 597 in 2015 to 12 898 997 in 2016 • KZN and MP: number of learners have decreased by 1 735 and 5 221 respectively; • Reduction of learner numbers will also be reflected/ factored-in in the equitable share,
i.e. the budget will also decrease to reflect the declining number of learners; and • In most cases, the number of educators remain constant or does not decrease by the same margin.
2015 2016
Eastern Cape 1 856 317 1 948 855 1 957 187 8 332
Free State 657 489 681 310 687 072 5 762
Gauteng 2 231 793 2 247 389 2 310 810 63 421
Kw aZulu-Natal 2 758 594 2 875 074 2 873 339 -1 735
Limpopo 1 536 294 1 752 451 1 764 551 12 100
Mpumalanga 1 053 846 1 077 372 1 072 151 -5 221
Northern Cape 288 839 289 233 291 650 2 417
North West 824 724 813 161 828 674 15 513
Western Cape 1 174 625 1 094 752 1 113 563 18 811
Total 12 382 521 12 779 597 12 898 997 119 400
School enrolment Changes in
enrolment
Age cohort
5 – 17
28
28

6. KEY TRENDS IN EDUCATION GENERAL HOUSEHOLD SURVEY
(GHS) TILL 2015
29
29

THE GENERAL HOUSEHOLD SURVEY (GHS)
- Household survey data collected by Stats SA yearly
- Purpose: to measure the quality of service delivery in a number of key service sectors
- Education is identified as a key service sector
- Indicators of interest: -Participation rates -Learners with disabilities -Out of school children -Learner pregnancy -School repetition -Delivery of LTSM -Corporal Punishment -NSNP
30

PARTICIPATION RATES
31

PARTICIPATION IN ECD PROGRAMMES
0 – 4 YEAR OLDS
7.3
11.6 11.5 14.3
16.0 16.1 16.7
30.4 32.8
35.0 36.5
44.7
48.3 45.7
0.0
10.0
20.0
30.0
40.0
50.0
60.0
2002 2003 2004 2005 2006 2007 2008 2009 2010 2011 2012 2013 2014 2015
Pe
rce
nta
ge
32
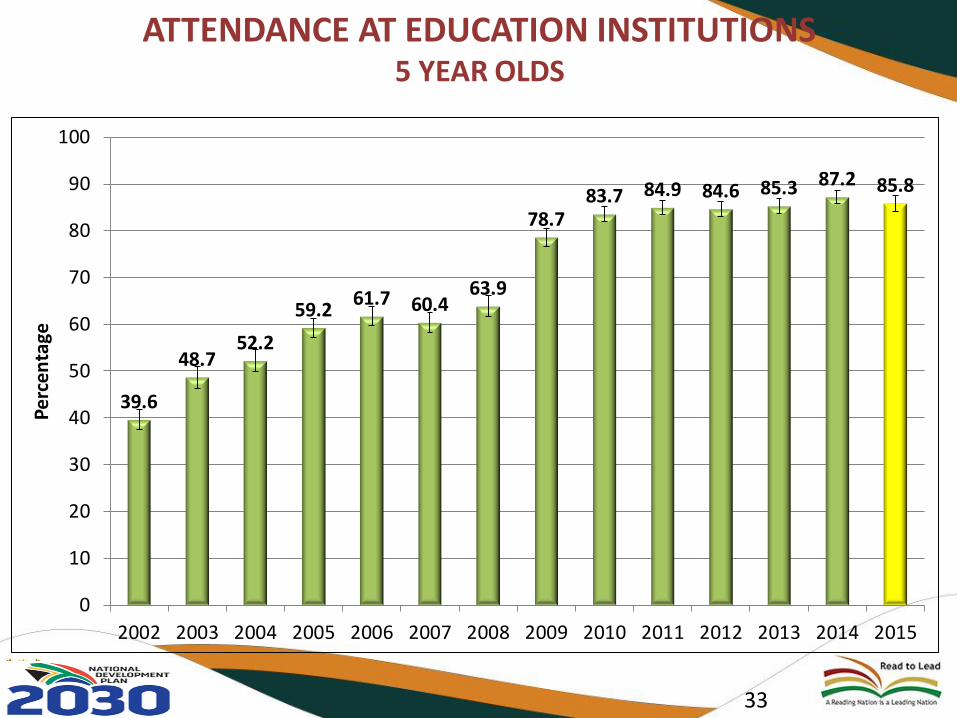
39.6
48.7 52.2
59.2 61.7 60.4
63.9
78.7 83.7 84.9 84.6 85.3 87.2 85.8
0
10
20
30
40
50
60
70
80
90
100
2002 2003 2004 2005 2006 2007 2008 2009 2010 2011 2012 2013 2014 2015
Perc
enta
ge
ATTENDANCE AT EDUCATION INSTITUTIONS
5 YEAR OLDS
33

GRADE R PARTICIPATION
97.1 94.8 95.0 92.2
94.9 94.8 94.8
0.0
10.0
20.0
30.0
40.0
50.0
60.0
70.0
80.0
90.0
100.0
2009 2010 2011 2012 2013 2014 2015
Pe
rce
nta
ge
34

PARTICIPATION IN EDUCATION PROGRAMMES 7 – 15 YEAR OLDS
96.4 97.2 97.8 97.8 97.6 97.9 97.9 98.5 98.7 98.8 98.8 98.8 99.0 98.8
0.0
10.0
20.0
30.0
40.0
50.0
60.0
70.0
80.0
90.0
100.0
2002 2003 2004 2005 2006 2007 2008 2009 2010 2011 2012 2013 2014 2015
Perc
enta
ge
35

87.8 88.2 88.3 88.3 88.0 89.7 89.2 89.0 88.7 90.1 90.5 90.3 90.7 90.2
0.0
10.0
20.0
30.0
40.0
50.0
60.0
70.0
80.0
90.0
100.0
2002 2003 2004 2005 2006 2007 2008 2009 2010 2011 2012 2013 2014 2015
Pe
rce
nta
ge
PARTICIPATION IN EDUCATION PROGRAMMES 14 – 18 YEAR OLDS
36

2002 2003 2004 2005 2006 2007 2008 2009 2010 2011 2012 2013 2014 2015
Number 324 575 251 506 203 120 200 219 218 843 192 758 190 500 139 992 118 526 108 171 108 597 112 864 92 631 112 508
Proportion 3.6% 2.8% 2.2% 2.2% 2.4% 2.1% 2.1% 1.5% 1.3% 1.2% 1.2% 1.2% 1.0% 1.2%
0.0%
0.5%
1.0%
1.5%
2.0%
2.5%
3.0%
3.5%
4.0%
0
50 000
100 000
150 000
200 000
250 000
300 000
350 000
Pe
rce
nta
ge
Nu
mb
er
OUT OF SCHOOL LEARNERS 7 – 15 YEAR OLDS
37

2002 2003 2004 2005 2006 2007 2008 2009 2010 2011 2012 2013 2014 2015
Number 818 672 754 091 700 727 710 419 749 040 654 076 695 360 636 133 649 176 582 002 548 306 543 076 530 589 564 680
Proportion 6.9% 6.3% 5.8% 5.8% 6.1% 5.3% 5.6% 5.2% 5.3% 4.8% 4.5% 4.5% 4.3% 4.6%
0.0%
1.0%
2.0%
3.0%
4.0%
5.0%
6.0%
7.0%
8.0%
0
100 000
200 000
300 000
400 000
500 000
600 000
700 000
800 000
900 000
Pe
rce
nta
ge
Nu
mb
er
OUT OF SCHOOL LEARNERS 7 – 18 YEAR OLDS
38

2002 2003 2004 2005 2006 2007 2008 2009 2010 2011 2012 2013 2014 2015
Number 494 097 502 585 497 607 510 200 530 197 461 318 504 860 496 141 530 650 473 831 439 709 430 212 437 958 452 172
Proportion 17.4% 17.1% 17.3% 17.7% 17.6% 14.8% 16.1% 16.4% 17.0% 15.3% 14.1% 13.9% 13.9% 15.0%
0.0%
2.0%
4.0%
6.0%
8.0%
10.0%
12.0%
14.0%
16.0%
18.0%
20.0%
0
100 000
200 000
300 000
400 000
500 000
600 000
Per
cen
tage
Nu
mb
er
OUT OF SCHOOL LEARNERS 16 – 18 YEAR OLDS
39

MAIN REASONS FOR NOT ATTENDING AN EDUCATIONAL INSTITUTION
7 – 15 year olds:
- Disability
- Education is not interesting
- Has completed education
- Unable to perform at school
- Not accepted for enrolment
- No money for fees
- Illness
16 – 18 year olds: - No money for fees
- Has completed education
- Education is not interesting
- Failed exams
- Unable to perform at school
- Started working
- Family commitments
40

SELF REPORTED HOUSEHOLD COMPLAINTS ABOUT ASPECTS OF SCHOOLING
2002 2003 2004 2005 2006 2007 2008 2009 2010 2011 2012 2013 2014 2015
Lack of Books 20.3 18.0 14.0 15.0 12.9 10.0 9.7 6.3 6.2 6.1 6.3 6.5 3.7 4.3
Fees to high 17.7 16.7 14.1 13.4 11.7 7.1 7.8 5.2 5.4 6.0 3.7 4.4 4.2 4.3
Classes too large 6.6 6.7 6.9 6.6 7.4 4.9 4.8 3.8 4.8 4.9 4.4 4.1 3.2 4.3
Facilities in bad condition 10.2 9.7 7.7 7.4 7.7 5.4 5.4 3.4 3.9 4.2 3.8 3.6 2.9 3.6
Lack of teachers 5.1 4.2 3.8 4.5 4.0 8.4 3.7 2.7 2.1 2.6 2.8 2.1 2.0 2.7
Poor quality of teaching 4.4 3.5 2.8 3.7 3.4 6.0 3.5 2.3 2.3 2.9 2.1 1.9 1.7 3.0
0.0
5.0
10.0
15.0
20.0
25.0
Pe
rce
nta
ge
41

LEARNER TEACHER SUPPORT MATERIAL (LTSM)
42

PROPORTION COMPLAINED ABOUT ACCESS TO LTSM
20.3
18.0
14.0
15.0
12.9
10.0 9.7
6.3 6.2 6.1 6.3 6.5
3.7 4.3
0.0
5.0
10.0
15.0
20.0
25.0
2002 2003 2004 2005 2006 2007 2008 2009 2010 2011 2012 2013 2014 2015
Pe
rce
nta
ge
43

0.0
5.0
10.0
15.0
20.0
25.0
30.0
35.0
2002 2003 2004 2005 2006 2007 2008 2009 2010 2011 2012 2013 2014 2015
Pe
rce
nta
ge
EC FS GP KZN LP MP NW NC WC
PROPORTION COMPLAINED ABOUT ACCESS TO LTSM BY PROVINCE
44

ACCESS TO WORKBOOKS & TEXTBOOKS GRADES 1-12 IN 2015
Grade1
Grade2
Grade3
Grade4
Grade5
Grade6
Grade7
Grade8
Grade9
Grade10
Grade11
Grade12
Workbooks Textbooks
Do not know 0.4 0.2 0.1 0.1 0.1 0.1 0.2 0.1 0.1 0.3 0.2 0.2
No Access 3.1 2.3 1.6 1.7 3.5 1.9 2.7 3.4 2.5 1.1 1.0 2.1
Access 96.5 97.6 98.4 98.2 96.5 98.1 97.2 96.6 97.4 98.6 98.9 97.7
0%
10%
20%
30%
40%
50%
60%
70%
80%
90%
100%
Per
cen
tage
45

EFFICIENCY IN THE SCHOOLING SYSTEM
46

REPEATERS BY GRADE 2009-2015
Grade 1 Grade 2 Grade 3 Grade 4 Grade 5 Grade 6 Grade 7 Grade 8 Grade 9 Grade 10 Grade 11 Grade 12
2009 6.9 7.4 7.2 7.1 6.8 6.5 5.0 8.2 10.7 17.1 16.3 8.3
2010 5.8 8.4 8.9 6.2 7.0 6.6 5.3 6.6 11.3 19.0 18.2 10.6
2011 6.9 8.3 7.7 8.2 6.0 7.3 6.1 7.6 13.4 21.0 18.1 10.9
2012 9.0 9.7 9.5 10.7 8.2 7.2 6.5 10.3 15.0 22.1 19.9 8.9
2013 10.7 9.1 9.7 9.2 9.4 7.6 7.9 8.6 16.2 24.5 21.1 8.9
2014 9.2 9.0 9.6 7.6 7.8 8.4 6.8 9.8 17.3 21.0 17.7 6.4
2015 7.0 8.7 8.9 9.5 6.9 7.4 7.9 12.3 14.8 20.4 15.6 7.6
0.0
5.0
10.0
15.0
20.0
25.0
30.0
Pe
rce
nta
ge
47

REPEATERS BY GRADE AND GENDER 2015
Grade 1 Grade 2 Grade 3 Grade 4 Grade 5 Grade 6 Grade 7 Grade 8 Grade 9Grade
10Grade
11Grade
12
Primary School Secondary School
Male 9.5 10.6 10.4 12.8 8.5 9.7 9.9 14.8 16.9 20.3 15.0 7.7
Female 4.4 6.6 7.3 5.7 5.3 5.0 5.8 9.8 12.6 20.5 16.3 7.6
0.0
5.0
10.0
15.0
20.0
25.0
Pe
rce
nta
ge
48
PREVALENCE OF CORPORAL PUNISHMENT
49

LEARNERS WHO EXPERIENCED CORPORAL PUNISHMENT BY PROVINCE
EC FS GP KZN LP MP NW NC WC SA
2013 24.0 17.5 5.4 23.5 12.2 11.7 12.8 12.2 5.8 14.9
2014 21.3 13.2 4.2 21.6 12.0 6.7 11.4 13.3 7.8 13.3
2015 17.1 14.1 4.2 21.1 11.1 8.4 15.6 11.8 7.6 12.8
0.0
5.0
10.0
15.0
20.0
25.0
30.0
Pe
rce
nta
ge
50

PERCENTAGE OF LEARNERS WHO EXPERIENCED CORPORAL PUNISHMENT AT SCHOOL BY AGE, 2009─2015
7 yrs 8 yrs 9 yrs 10 yrs 11 yrs 12 yrs 13 yrs 14 yrs 15 yrs 16 yrs 17 yrs 18 yrs
2009 18.3 18.4 18.2 18.7 18.0 19.1 19.4 18.6 18.0 19.8 17.4 17.7
2010 14.3 15.3 16.7 16.9 15.4 15.7 17.3 16.5 14.9 15.5 13.9 15.7
2011 16.9 17.8 17.4 18.8 19.9 19.4 19.8 18.3 16.8 17.2 17.8 17.1
2012 16.9 16.7 16.5 17.6 17.5 16.0 18.9 19.4 18.7 18.7 15.2 16.5
2013 13.0 15.1 16.2 16.4 14.8 15.3 13.3 15.9 16.6 15.6 16.5 16.4
2014 11.7 12.5 14.0 14.0 13.4 14.6 13.7 12.7 14.7 12.9 16.4 16.3
2015 13.1 13.4 12.3 14.4 13.0 13.4 13.8 11.7 12.0 13.2 13.5 15.3
0.0
5.0
10.0
15.0
20.0
25.0
Per
cen
tage
51

LEARNER PREGNANCY
52

Grade 5 Grade 6 Grade 7 Grade 8 Grade 9Grade
10Grade
11Grade
12
2013 0.6 0.5 0.7 0.7 2.0 4.4 5.8 4.3
2014 0.3 1.1 0.4 0.7 1.3 4.1 5.0 5.8
2015 1.0 0.2 0.8 0.8 1.8 2.8 5.7 4.9
0.0
1.0
2.0
3.0
4.0
5.0
6.0
7.0
Per
cen
tage
LEARNER PREGNANCY
BY GRADE
53
NATIONAL SCHOOL NUTRITION PROGRAM
(NSNP)
54

LEARNERS BENEFITING FROM NSNP
Prov 2010 2011 2012 2013 2014 2015
EC 75.3 82.9 85.3 86.7 88.3 88.9
FS 65.8 75.3 77.0 78.7 78.0 80.3
GP 53.8 55.3 55.3 59.8 63.4 63.1
KZN 67.5 76.0 79.2 80.5 79.4 81.0
LP 84.7 94.4 94.7 93.5 94.3 93.9
MP 75.5 84.2 85.9 85.7 88.8 87.1
NW 69.6 80.7 83.4 82.8 85.3 85.1
NC 89.3 89.7 88.0 84.7 84.0 89.3
WC 66.7 64.0 63.4 66.0 65.0 67.2
SA 69.9 76.2 77.4 78.7 79.7 80.2
Year Yes,
everyday
Yes, a few times a week
Yes, some times Total
2010 90.7 4.3 5.1 100.0
2011 92.9 3.5 3.6 100.0
2012 92.2 3.6 4.2 100.0
2013 90.6 4.9 4.5 100.0
2014 90.5 5.1 4.4 100.0
2015 90.4 4.7 4.9 100.0
55

LEARNERS WITH DISABILITIES
56
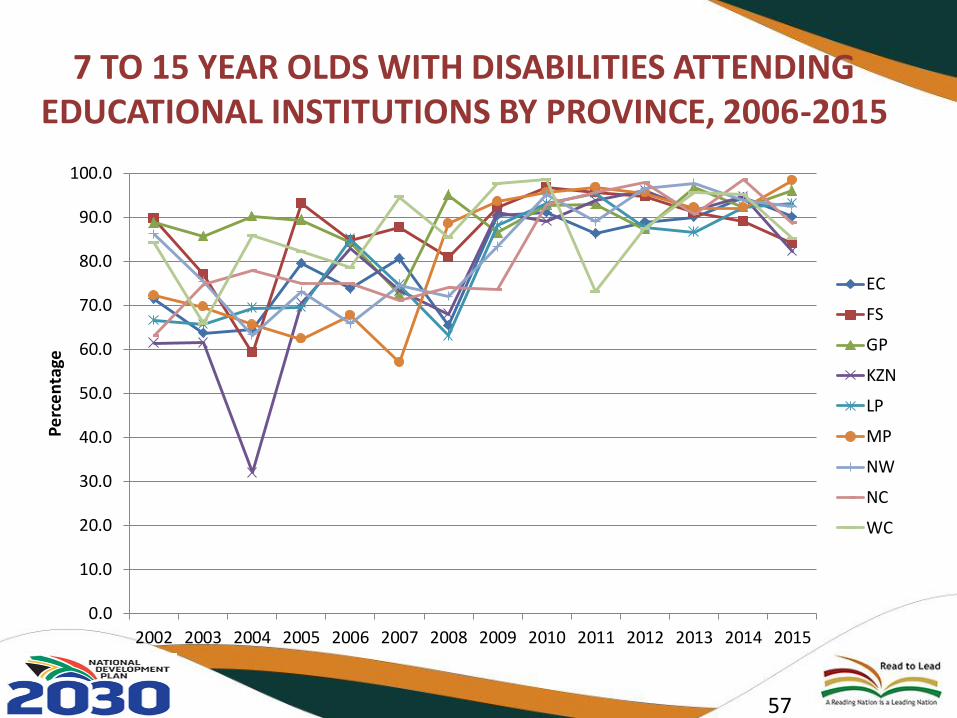
7 TO 15 YEAR OLDS WITH DISABILITIES ATTENDING EDUCATIONAL INSTITUTIONS BY PROVINCE, 2006-2015
0.0
10.0
20.0
30.0
40.0
50.0
60.0
70.0
80.0
90.0
100.0
2002 2003 2004 2005 2006 2007 2008 2009 2010 2011 2012 2013 2014 2015
Pe
rce
nta
ge
EC
FS
GP
KZN
LP
MP
NW
NC
WC
57

LEARNER TRANSPORT
58

PROPORTIONS OF 7-18 YEAR OLDS BY MODE OF TRANSPORT, 2009-2015
Means of transport 2009 2010 2011 2012 2013 2014 2015
Walking 74.9 73.6 74.1 71.8 72.3 71.3 69.2
Bicycle/motorcycle 0.4 0.4 0.5 0.6 0.7 0.8 0.8
Minibus taxi/sedan taxi/bakkie
taxi 6.6 6.9 6.1 5.7 5.1 5.1 5.4
Bus 3.3 3.1 3.0 2.5 3.2 3.2 3.4
Train 0.4 0.4 0.4 0.5 0.4 0.4 0.3
Minibus/bus provided by
institution/government and not
paid for
2.1 2.2 1.8 1.9 1.9 1.9 2.4
Vehicle hired by a group of
parents 4.2 5.2 6.6 8.6 7.5 8.5 0.0
Own car or other private vehicle 7.9 8.1 7.5 8.5 8.7 8.7 9.8
Other 0.2 0.1 0.1 0.1 0.2 0.1 8.8
Total 100.0 100.0 100.0 100.0 100.0 100.0 100.0
59

ORPHANS (BOTH FATHER AND MOTHER DECEASED)
60

PROPORTION OF LEARNERS WHO ARE ORPHANS
2.3 2.7
3.2
4.3 4.7
5.2
5.8 6.2 6.1
6.4 6.0
5.7
4.8 4.6
0.0
1.0
2.0
3.0
4.0
5.0
6.0
7.0
2002 2003 2004 2005 2006 2007 2008 2009 2010 2011 2012 2013 2014 2015
Per
cen
tage
61
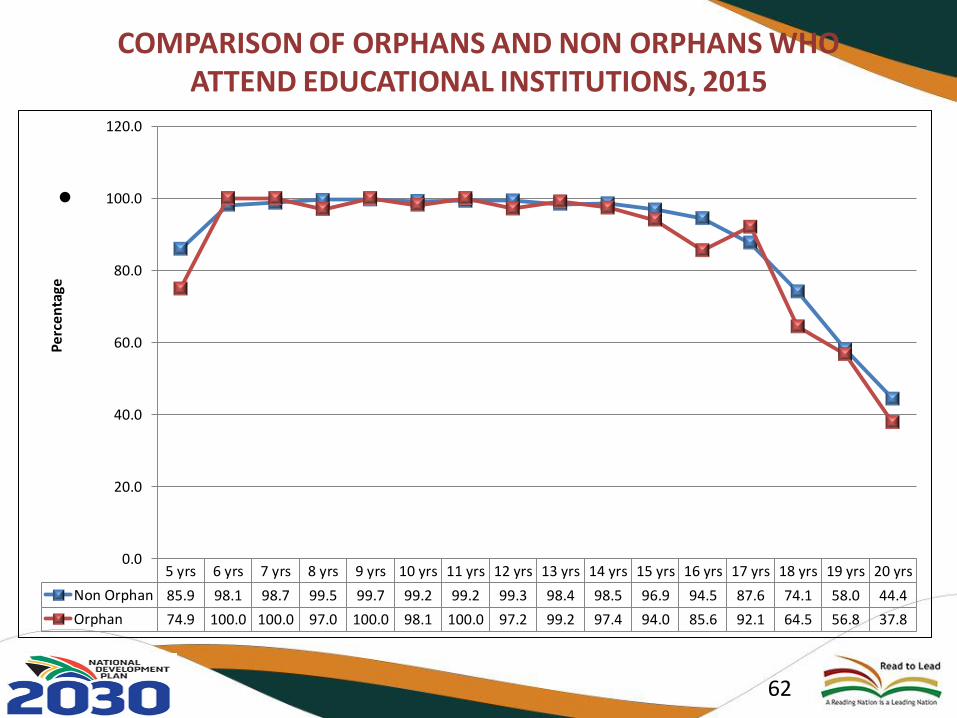
COMPARISON OF ORPHANS AND NON ORPHANS WHO ATTEND EDUCATIONAL INSTITUTIONS, 2015
•
5 yrs 6 yrs 7 yrs 8 yrs 9 yrs 10 yrs 11 yrs 12 yrs 13 yrs 14 yrs 15 yrs 16 yrs 17 yrs 18 yrs 19 yrs 20 yrs
Non Orphan 85.9 98.1 98.7 99.5 99.7 99.2 99.2 99.3 98.4 98.5 96.9 94.5 87.6 74.1 58.0 44.4
Orphan 74.9 100.0 100.0 97.0 100.0 98.1 100.0 97.2 99.2 97.4 94.0 85.6 92.1 64.5 56.8 37.8
0.0
20.0
40.0
60.0
80.0
100.0
120.0
Pe
rce
nta
ge
62
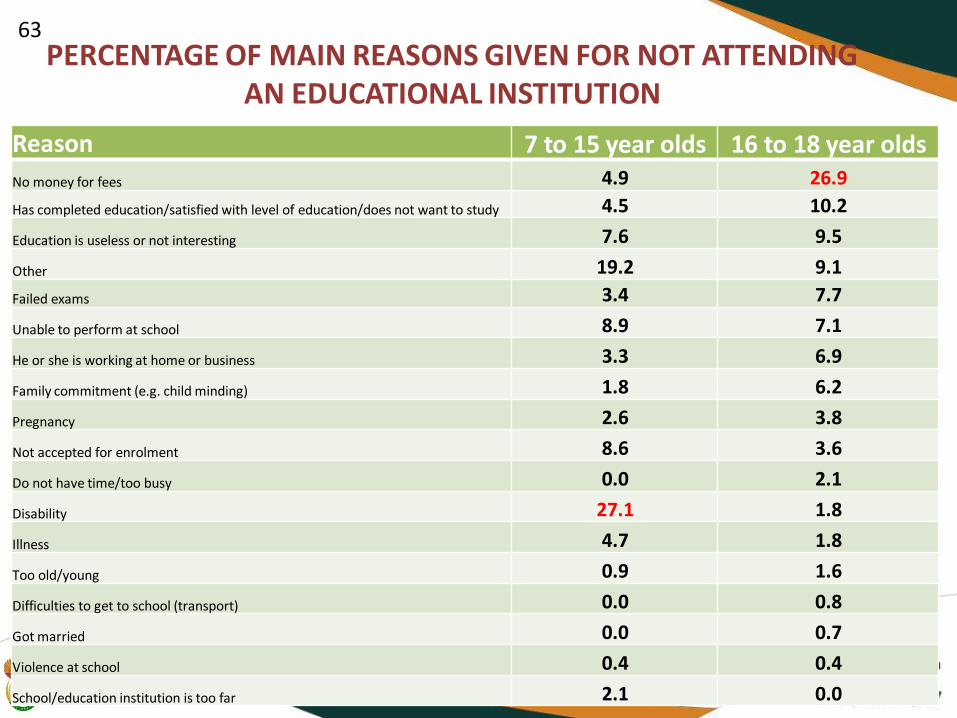
PERCENTAGE OF MAIN REASONS GIVEN FOR NOT ATTENDING AN EDUCATIONAL INSTITUTION
Reason 7 to 15 year olds 16 to 18 year olds
No money for fees 4.9 26.9
Has completed education/satisfied with level of education/does not want to study 4.5 10.2
Education is useless or not interesting 7.6 9.5
Other 19.2 9.1
Failed exams 3.4 7.7
Unable to perform at school 8.9 7.1
He or she is working at home or business 3.3 6.9
Family commitment (e.g. child minding) 1.8 6.2
Pregnancy 2.6 3.8
Not accepted for enrolment 8.6 3.6
Do not have time/too busy 0.0 2.1
Disability 27.1 1.8
Illness 4.7 1.8
Too old/young 0.9 1.6
Difficulties to get to school (transport) 0.0 0.8
Got married 0.0 0.7
Violence at school 0.4 0.4
School/education institution is too far 2.1 0.0
63

PERCENTAGE OF MAIN REASONS GIVEN FOR NOT ATTENDING NEAREST INSTITUTION, 2015
Reasons 7 to 15 year olds 16 to 18 year olds
Current institution better than closest 35.7 33.1
Quality of teaching is poor 19.8 19.3
Preferred courses/subject not offered 12.6 18.1
Other 8.7 8.0
Not accepted for enrolment 6.9 7.9
Lack of resources/equipment 5.5 5.2
Overcrowded classes 5.0 3.2
Inadequate facilities 1.8 0.9
Lack of discipline 1.3 1.9
No/too few extra-mural activities 1.2 0.5
Lack of safety 0.9 0.7
Weak management 0.6 1.0
Lack of services 0.2 0.1
64

PERCENTAGE OF 7 TO 18 YEAR OLD LEARNERS ATTENDING SCHOOLS WHO ARE ORPHANS BY GENDER,2002-2015
2002 2003 2004 2005 2006 2007 2008 2009 2010 2011 2012 2013 2014 2015
Male 2.4 2.8 3.4 4.3 4.7 5.4 6.0 6.4 6.2 6.7 6.2 5.9 4.9 4.6
Female 2.2 2.6 3.0 4.3 4.7 4.9 5.7 6.0 5.8 6.1 5.8 5.6 4.6 4.7
0.0
1.0
2.0
3.0
4.0
5.0
6.0
7.0
8.0
Per
cen
tage
65

PERCENTAGE OF ORPHANS BY GRADE, 2010-2015
GradeR
Grade1
Grade2
Grade3
Grade4
Grade5
Grade6
Grade7
Grade8
Grade9
Grade10
Grade11
Grade12
2010 2.1 3.1 3.6 4.2 4.5 6.1 7.8 6.6 7.6 7.3 8.7 8.8 8.4
2011 2.3 3.0 3.3 3.7 5.0 5.5 7.1 8.0 7.8 8.3 9.2 10.4 8.4
2012 1.8 2.7 3.1 3.7 4.1 5.6 6.1 5.5 7.9 10.6 8.6 9.0 8.4
2013 2.5 1.7 2.7 3.0 4.2 5.6 5.7 6.8 7.1 7.4 9.7 9.7 7.4
2014 1.0 2.1 1.8 2.5 3.5 3.4 4.8 4.9 6.5 6.8 7.8 7.8 7.4
2015 0.6 1.1 1.2 1.9 2.8 3.1 4.5 5.6 5.5 7.1 7.9 9.1 8.5
0.0
2.0
4.0
6.0
8.0
10.0
12.0
Pe
rce
nta
ge
66

NDP VISION STATEMENT
“We, the people of South Africa, have journeyed far since the long lines of our first democratic election on 27 April 1994, when we elected a government for us all.
We began to tell a new story then. We have lived and renewed that story along the way.
Now in 2030 we live in a country which we have remade…”
National Planning Commission: National Development Plan, November 2011) 67


Website: www.education.gov.za
Call Centre: 0800 202 933 | [email protected]
witter: @DBE_SA | Facebook: DBE SA