STRATEGIC TRADE DEVELOPMENT ROADMAP FOR SME COMPETITIVENESS IN QATAR · 2018-04-19 · The goal of...
80
STRATEGIC TRADE DEVELOPMENT ROADMAP FOR SME COMPETITIVENESS IN QATAR 2018-2022
Transcript of STRATEGIC TRADE DEVELOPMENT ROADMAP FOR SME COMPETITIVENESS IN QATAR · 2018-04-19 · The goal of...

STRATEGIC TRADE DEVELOPMENT ROADMAP FOR SME COMPETITIVENESS IN QATAR2018-2022
STRATEGIC TRADE DEVELOPMENT ROADMAP FOR SME COMPETITIVENESS IN QATAR
2018-2022
STRATEGIC TRADE DEVELOPMENT ROADMAP FOR SME COMPETITIVENESS IN QATAR2018-2022

This Strategic Trade Development Roadmap ( STDR ) was developed on the basis of the process, methodology and technical assistance of the International Trade Centre ( ITC ) within the framework of its Trade Development Strategy programme.
ITC is the joint agency of the World Trade Organization and the United Nations. As part of the ITC mandate of fostering sustainable development through increased trade opportunities, the Export Strategy section offers a suite of trade-related strat-egy solutions to maximize the development payoffs from trade. ITC-facilitated trade development strategies and roadmaps are oriented to the trade objectives of a country or region and can be tailored to high-level economic goals, specific develop-ment targets or particular sectors, allowing policymakers to choose their preferred level of engagement.
The views expressed herein do not reflect the official opinion of ITC. Mention of firms, products and product brands does not imply the endorsement of ITC. This document has not been formally edited by
The International Trade Centre ( ITC )
Street address : ITC, 54-56, rue de Montbrillant, 1202 Geneva, Switzerland
Postal address : ITC Palais des Nations 1211 Geneva, Switzerland
Telephone : + 41- 22 730 0111
Postal address : ITC, Palais des Nations, 1211 Geneva, Switzerland
Email : [email protected]
Internet : http :// www.intracen.org
Layout: Jesús Alés – www.sputnix.es

v
ACKNOWLEDGMENTS
This Strategic Trade Development Roadmap ( STDR ) was led by the Qatar Development Bank ( QDB ) with the technical assistance of ITC. This document represents the ambitions of the private and public sector stakeholders for the development of Small and Medium Enterprises ( SME ) competitiveness in Qatar. Stakeholders’ commitment and comprehensive collaboration have helped build consensus around a common vision that reflects the realities and limitations of the private sector, as well as of policymakers and trade-related institutions.
The document benefited particularly from the inputs and guidance provided by the members of the national STDR core team.
Organization Name Designation
1
Qatar Development Bank
Hamad Khamis Al-Kubaisi Executive Director of Strategy & Business Development
2 Farha Al-Kuwari Research and Statistics Manager
3 Kholoud Ali Al-HajriManager of International Cooperation
& Local Stakeholder
4 Iqbal Kaundal Head of SME, Supporting Programs
5 TASDEER Ayedh Hassan Al-Qahtani Export Promotion Manager
6Ministry of Economy and
Commerce Abdulbasit Al AjjiDirector of Business Development
and Investment Promotion
7 Minister of Industry and Energy Abdullah Maadeed Department of Industrial Development
8Ministry of Municipality and
EnvironmentSH. Dr. Faleh Bin Naser
Al ThaniUndersecretary Assistant for Agriculture Affairs
and Fisheries Resources
9 General Authority of Customs Sultan Abdullatif Al-Naimi Acting Director of Customs Affairs Department
10Qatar Tourism Authority
Marla Haims Policy and planning consultant
11 Karthik Gopalan Swaminathan Tourism Investment Coordinator
12Qatar Chamber
Aly Hussein Aly Abdullateef Head of Research Section
13 Dr. Mohammed Ibrahim Economic Expert
14 Ministry for Foreign Affairs Abdulfatah Mohamed Advisor
Technical support and guidance from ITC was rendered through Alexandra Golovko, Olga Khomula and Victor Deleplancque.

vi
CONTENTS
Acknowledgments v
EXECUTIVE SUMMARY XV
AN ECONOMY FACING AN IMPORTANT TRANSITION – A MACROECONOMIC OVERVIEW 17
DIVERSIFICATION EFFORTS ARE UNDER WAY BUT NOT YET TRANSLATING INTO CONCRETE RESULTS – TRADE AND INVESTMENT ANALYSIS 29
A MULTITUDE OF NATIONAL AMBITIONS – DEVELOPMENT AND TRADE POLICIES 43
NATIONAL ORIENTATIONS AND PRIORITIES 43
TRADE POLICY OVERVIEW 45
REGIONAL INTEGRATION PERSPECTIVES 46
INVESTMENT CLIMATE 47
THE TRADE SUPPORT NETWORK FAILS TO CATCH UP WITH A RAPIDLY GROWING ECONOMY 49
THE TRADE AND INVESTMENT SUPPORT INSTITUTION STRUCTURE 49
ANALYSIS OF TRADE SUPPORT NETWORK EFFECTIVENESS 51
THE WAY FORWARD 55
THE VISION AND STRATEGIC OBJECTIVES 56
PRIORITY SECTORS FOR THE ECONOMY 57
DEFINING A SECTOR FROM THE STDR PERSPECTIVE 57
SELECTION CRITERIA 57
LIST OF PRIORITY SECTORS 58
CROSS-SECTORS TO BE CONSIDERED 63
PROPOSED INITIATIVES 65
NATIONAL PROPOSED INITIATIVES 66
vii
viii
FIGURES
Figure 1 : GDP at market prices ( constant 2005 QAR ) and GDP growth ( annual % ), Qatar, 1990–2015 17
Figure 2 : GDP growth in Gulf Cooperation Council ( GCC ) countries, 2012–2014 ( % ) 18
Figure 3 : GNI per capita, PPP ( constant 2011 international US $ ), 2004–2014 ( US $ thousands ) 18
Figure 4 : GDP and GDP per capita in the GCC region, CAGR 2001–2014 ( constant 2005 US $ ) 19
Figure 5 : HDI and HDI components, Qatar, 1980–2014 19
Figure 6 : HDI Index in GCC countries, 2014 20
Figure 7 : CO2 emissions per capita ( tons ), GCC countries, world ranking indicated in parentheses 21
Figure 8 : Contributions to GDP growth between 2006 and 2013, Qatar 21
Figure 9 : Sources of economic growth, Qatar, 2000–2014 ( % GDP ) 22
Figure 10 : Population pyramid of Qatar, 2014 22
Figure 11 : Employment rate by age group, gender and nationality, Qatar, 2014 23
Figure 12 : Active population by nationality and gender, Qatar, 2008–2014 23
Figure 13 : Active population by nationality, gender and sector, Qatar, 2014 24
Figure 14 : Active population by economic activity, Qatar, 2014 24
Figure 15 : Percentage of employment by economic activity, Qatar, 2008–2014 25
Figure 16 : Non-Qatari workers’ skills composition, 2013 ( % ) 26
Figure 17 : Correlation between crude oil prices and Qatar exports, 2006–2015 ( US $ billions ) 26
Figure 18 : Composition of fiscal revenue and total revenue growth, Qatar, 2009/10–2014/15 27
Figure 19 : Contributions to real GDP growth, Qatar, 2010–2014 ( % ) 27
Figure 20 : Oil and non-oil real GDP growth, Qatar, 2008–2016 ( %, constant prices ) 28
Figure 21 : Current account balance in GCC countries, 2006–2020 ( US $ billions ) 29
Figure 22 : Trade balance ( goods only ), Qatar, 2006–2015 ( US $ billions ) 30
Figure 23 : Qatar imports by products, 2015 ( % ) 30
Figure 24 : Supplying markets for Qatar imports ( % ) 31
Figure 25 : Qatar exports by product category, 2015 ( % ) 31
Figure 26 : Qatar exports by product category, 2014–2015 ( US $ billions ) 32
Figure 27 : Export composition in GCC countries, average 2012–2014 ( % ) 32
Figure 28 : Hydrocarbon and non-hydrocarbon exports, Qatar, 2006–2015 ( US $ billions ) 33
Figure 29 : Growth of national supply and international demand for products exported by Qatar in 2015 34
Figure 30 : Non-hydrocarbon trade balance, Qatar, 2006–2015 ( US $ billions ) 34
Figure 31 : Importing markets for Qatari exports, by region, 2015 ( % ) 35
Figure 32 : Decomposition of export growth along margins of trade, Qatar, 2010–2014 35
Figure 33 : Probability of survival of Qatar export relationships 36

ix
Figure 34 : List of services exported by Qatar, exported value, 2006 –2014 ( US $ millions ) 36
Figure 35 : Services subsector growth ( % change ), Qatar, 2010–2014 37
Figure 36 : Imports of services, Qatar, 2014 ( % ) 37
Figure 37 : Net trade in services, Qatar, 2005–2014 ( US $ billions ) 38
Figure 38 : FDI net inflows, Qatar, 2001–2014 ( US $ billions ) 38
Figure 39 : Qatar investment stock, 2004–2013 ( US $ billions ) 39
Figure 40 : The most problematic factors for doing business in Qatar 40
Figure 41 : Distance to frontier scores on Doing Business topics ( 2016 ) 40
Figure 42 : Projected total number of jobs in the tourism sector 2012–2030 ( in thousands of employees ) 44
Figure 43 : Projected tourist arrivals in Qatar 2012–2030 ( in millions ) 44
Figure 44 : Travel exports from Qatar, 2005–2014 ( US $ millions ) 59
Figure 45 : Insurance and pension services exports from Qatar, 2005–2014 ( US $ millions ) 60
Figure 46 : Exports of petrochemicals, Qatar, 2006–2015 ( US $ billions ) 62

xi
ACRONYMS
The following abbreviations are used :
CAGR Compound Annual Growth RateCO2 Carbon dioxideEU European UnionFDI Foreign Direct InvestmentGCC Gulf Cooperation CouncilGDP Gross Domestic ProductGNI Gross National IncomeHDI Human Development IndexHR Human ResourcesIMF International Monetary FundISO International Organization for
StandardizationITC International Trade CentreMENA Middle East and North AfricaMICE Meetings, Incentives, Conferences
and ExhibitionsMoADLSA Ministry of Administrative Development,
Labour and Social AffairsMoDPS Ministry of Development Planning
and StatisticsMoEC Ministry of Economy and CommerceMoEHE Ministry of Education and Higher EducationMoEI Ministry of Energy and IndustryMoF Ministry of FinanceMoJ Ministry of JusticeMoME Ministry of Municipality and Environment
MSME Micro, Small and Medium-sized EnterpriseNDS National Development Strategy 2011–2016PPP Purchasing Power ParityQBIC Qatar Business Incubation CentreQCB Qatar Central BankQCCI Qatar Chamber of Commerce and IndustryQDB Qatar Development BankQFC Qatar Financial CentreQFCRA Qatar Financial Centre Regulatory AuthorityQIA Qatar Investment AuthorityQNV Qatar National Vision 2030QSTP Qatar Science and Technology ParkQTA Qatar Tourism AuthorityR&D Research and DevelopmentSDPN SME Development Partners NetworkSEZ Special Economic ZoneSME Small and Medium-Sized EnterpriseSTDR Strategic Trade Development RoadmapTFP Total Factor ProductivityTISI Trade and Investment Support InstitutionTVET Technical and Vocational Education
and TrainingUAE United Arab EmiratesUNCTAD United Nations Conference on Trade
and DevelopmentWTO World Trade Organization


xiv
[ STRATEGIC TRADE DEVELOPMENT ROADMAP FOR SME COMPETITIVENESS IN QATAR 2018-2022 ]
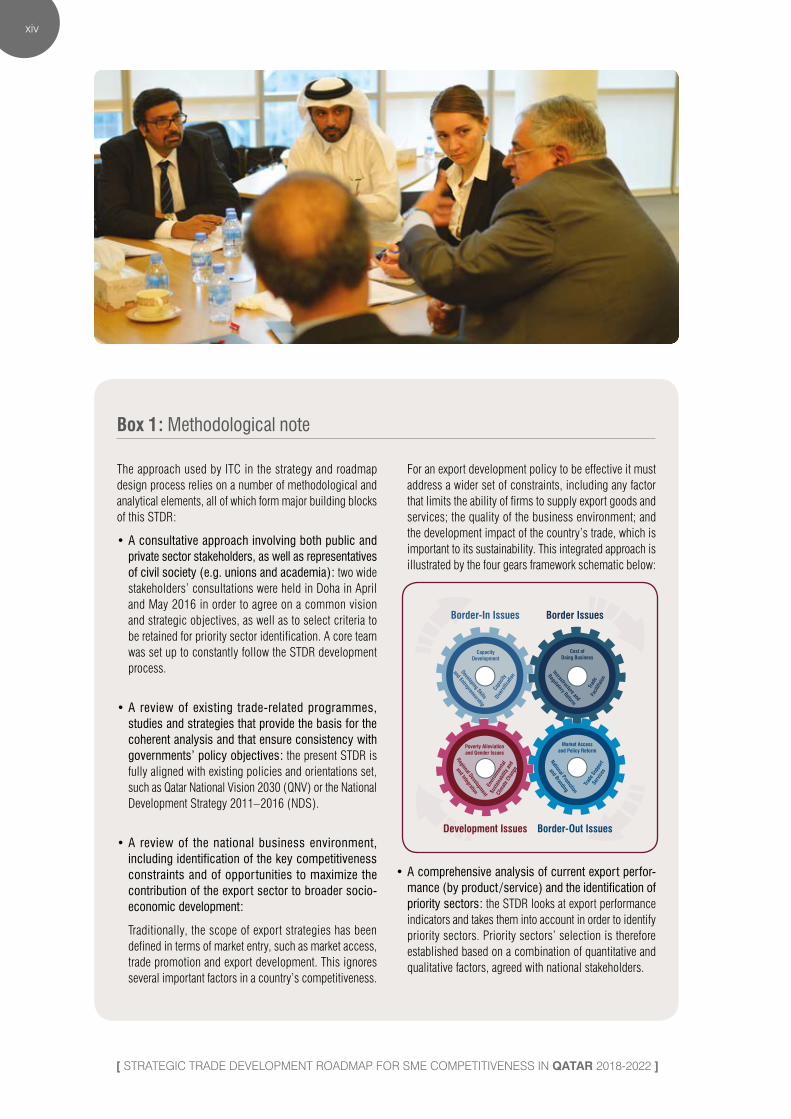
Box 1 : Methodological note
The approach used by ITC in the strategy and roadmap design process relies on a number of methodological and analytical elements, all of which form major building blocks of this STDR :
• A consultative approach involving both public and private sector stakeholders, as well as representatives of civil society ( e.g. unions and academia ) : two wide stakeholders’ consultations were held in Doha in April and May 2016 in order to agree on a common vision and strategic objectives, as well as to select criteria to be retained for priority sector identification. A core team was set up to constantly follow the STDR development process.
• A review of existing trade-related programmes, studies and strategies that provide the basis for the coherent analysis and that ensure consistency with governments’ policy objectives : the present STDR is fully aligned with existing policies and orientations set, such as Qatar National Vision 2030 ( QNV ) or the National Development Strategy 2011– 2016 ( NDS ).
• A review of the national business environment, including identification of the key competitiveness constraints and of oppor tunities to maximize the contribution of the export sector to broader socio-economic development :
Traditionally, the scope of export strategies has been defined in terms of market entry, such as market access, trade promotion and export development. This ignores several important factors in a country’s competitiveness.
For an export development policy to be effective it must address a wider set of constraints, including any factor that limits the ability of firms to supply export goods and services; the quality of the business environment; and the development impact of the country’s trade, which is important to its sustainability. This integrated approach is illustrated by the four gears framework schematic below:
• A comprehensive analysis of current export perfor-mance ( by product / service ) and the identification of priority sectors : the STDR looks at export performance indicators and takes them into account in order to identify priority sectors. Priority sectors’ selection is therefore established based on a combination of quantitative and qualitative factors, agreed with national stakeholders.
Border-In Issues Border Issues
Development Issues
CapacityDevelopment
Developing Skills
and Entrepreneurship
Capa
city
Dive
rsifi
catio
n
Cost ofDoing Business
Insrastructure and
Regulatory Reform
Trad
eFa
cilitt
aion
Market Accessand Policy Reform
National Promotion
and Branding
Trad
e Sup
port
Serv
ices
Poverty Alleviationand Gender Issues
Regional Development
and Integration
Envir
onm
enta
l
Susta
inab
ility
and
Clim
ate
Chan
ge
Border-Out Issues
xv
[ EXECUTIVE SUMMARY ]
EXECUTIVE SUMMARYThe goal of Qatar’s Strategic Trade Development Roadmap ( STDR ) is to set the small and medium-sized enterprise ( SME ) sector on the course of strategic development by addressing constraints in a comprehensive manner and defining concrete opportunities that can be real-ized through the specific steps detailed in the initiatives’ section.
Considering the pressing need to unlock the potential of SMEs and to operationalize economic transition in Qatar, the present STDR aims to provide practical orientations around a dual objective. First it gives a set of concrete and realistic initiatives to improve the SME ecosystem and facilitate firms’ operations at the national level, answering the current constraints. Second, it prioritizes specific sectors of the economy which represent particular potential and that have been selected through a set of commonly agreed criteria. These criteria encompass quantita-tive factors such as export potential and existing demand, and key qualitative aspects such as the possibility for the sector to substitute imports and integrate local value chains, as well as societal and environmental benefits. Priority sectors represent inherent success potential for SMEs willing to engage in them, as they offer a unique proposition of Qatar vis-à-vis its peers, in addition to fostering innovation and a highly skilled economy.
Qatar has experienced outstanding economic growth over the past two decades, relying on the exploration and production of hydrocarbons as the main source of exports and fiscal revenues. Qatar has emerged as the highest per capita income country in the world. In addition to economic performance, the Qatar growth model has delivered strong social outcomes over the years, including in education, as well as improved welfare and standards of living. The substantial wealth accumulated in recent years from oil and gas revenues leads to high domestic public investment reinforcing the development of the economy. However, this economic growth has been the result of factor accumulation rather than productivity. Labour productivity has proven to be low and stagnant over the past decade. Similarly, the impressive growth of the capital stock has not been accompanied by strong productivity gains.
The recent steep fall in oil prices has highlighted the vulnerability of the economy to volatility in the global hydrocarbons market and the need for greater diversi-fication. Deeply impacted by the deterioration of its trade balance. The significant contraction of the oil and natural gas sector provides a context in which the non-hydrocarbon sector will progressively need to become the new engine for economic growth.
Qatar has taken steps to anticipate the transition to a knowledge-based econo-my, but export diversification remains limited. In 2008, Qatar developed the Qatar National Vision 2030 ( QNV ) and the National Development Strategy 2011–2016 ( NDS ), both of which pledged a transition to a knowledge-based economy through diversification. However, the last decade’s figures indicate that export growth has
xvi
[ STRATEGIC TRADE DEVELOPMENT ROADMAP FOR SME COMPETITIVENESS IN QATAR 2018-2022 ]
been almost exclusively driven by a greater volume of trade in traditional products. Foreign direct investment ( FDI ) coming into Qatar has also been declining and remained concentrated in traditional sectors, failing to stimulate diversification.
Stimulating the growth of the SME sector will be vital to spearhead the long-awaited diversification but constraints need to be addressed on multiple fronts. SMEs represent the seeds for diversification as they form the entirety of the non-oil-and-gas economic sectors today. Stimulating their development will thus be crucial for Qatar. Nevertheless, it will be important to prioritize support to the areas which have the most potential for success. It will be also important to resolve the current bottlenecks that prevent SME development. A lot of these bottlenecks are related to the nascent nature of the SME sector in Qatar, such as the lack of entrepreneurial spirit, the misalignment of the business environment with the needs of SMEs and the lack of incentive to export. Others are rather structural, such as the juxtaposition of comfortable public sector employment with entrepreneurship which is still relatively precarious.
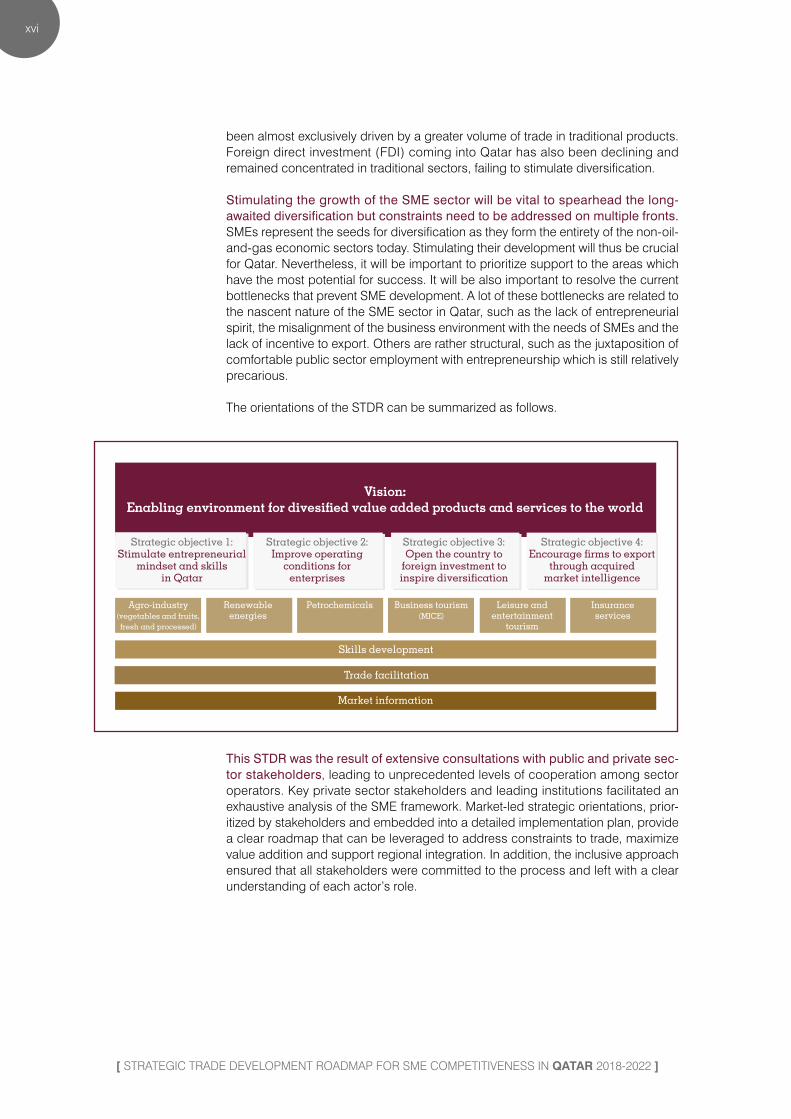
The orientations of the STDR can be summarized as follows.
This STDR was the result of extensive consultations with public and private sec-tor stakeholders, leading to unprecedented levels of cooperation among sector operators. Key private sector stakeholders and leading institutions facilitated an exhaustive analysis of the SME framework. Market-led strategic orientations, prior-itized by stakeholders and embedded into a detailed implementation plan, provide a clear roadmap that can be leveraged to address constraints to trade, maximize value addition and support regional integration. In addition, the inclusive approach ensured that all stakeholders were committed to the process and left with a clear understanding of each actor’s role.

17
[ AN ECONOMY FACING AN IMPORTANT TRANSITION A MACROECONOMIC OVERVIEW ]
AN ECONOMY FACING AN IMPORTANT TRANSITION A MACROECONOMIC OVERVIEW
Relying on the exploration and production of hydrocar-bons as the main source of export and fiscal revenues, Qatar has experienced strong economic growth over the past two decades. Boosted by the exploitation of its large natural gas reserves since in the 1990s ( Qatar has the third-largest reserves of natural gas in the world after the Russian Federation and the Islamic Republic of Iran ), Qatar has be-come one of the world’s fastest-growing economies.
Since the first exports of liquefied natural gas in 1996, Qatar’s gross domestic product ( GDP ) has grown expo-nentially, from around QAR 100 billion in the early 1990s to QAR 764 billion in 2014, at constant prices. Driven by high hydrocarbon prices and supported by rising Government
spending, the country’s economy grew at an impressive compound annual growth rate ( CAGR ) of 11.9 % between 2001 and 2014 ( see figure 4 ). However, following the re-cent contraction in oil and natural gas exports observed after 2011, and after six consecutive years of double-digit economic growth, Qatar’s GDP growth rate fell to 4.9 % in 2012, its lowest level since the 3.7 % growth rate reported in 2003. Since then Qatar has experienced stable growth at around 4–5 %, driven by non-oil-and-gas sector growth ( see figure 19 ). With hydrocarbon prices unlikely to show significant increases in the coming years, the trend is likely to continue, as confirmed by International Monetary Fund ( IMF ) estimates ( see figure 1 ).
Figure 1 : GDP at market prices ( constant 2005 QAR ) and GDP growth ( annual % ), Qatar, 1990–2015
IMF estimates
0
200
400
600
800
1.000
1.200
-20
-10
0
10
20
30
40
1990
1992
1994
1996
1998
2000
2002
2004
2006
2008
2010
2012
2014
2016
2018
2020
QAR
billi
ons
% c
hang
e
GDP (QAR billions) GDP (% change)
Source : International Monetary Fund ( 2016 ).

18
[ STRATEGIC TRADE DEVELOPMENT ROADMAP FOR SME COMPETITIVENESS IN QATAR 2018-2022 ]
Figure 2 : GDP growth in Gulf Cooperation Council ( GCC ) countries, 2012–2014 ( % )
-2%
-1%
0%
1%
2%
3%
4%
5%
6%
7%
8%
Qatar Bahrain Oman Kuwait Saudi Arabia
UAE
2012 2013 2014
Source : World Bank ( 2016 ).
Qatar has emerged as the highest per capita income country in the world but GDP growth in per capita terms has been limited over the past decades. With gross nation-al income ( GNI ) per capita reaching US $ 128,734 in 2014, Qatar is by far the highest per capita income country in the world at purchasing power parity ( PPP ). By way of compari-son, the average GNI per capita at PPP in the world did not exceed US $ 37,895 that same year. At the regional level, Qatar also compares positively with other GCC countries, notably with the United Arab Emirates ( UAE ) ( US $ 64,604 ) and Saudi Arabia ( US $ 49,645 ) ( see figure 3 ).
However, despite Qatar’s impressive rates of output growth over the years, improvements in income per capita have been limited as the country recorded a weak annual per capita GDP growth of 1.5 % over the period 2001–2014. This situation is due to fast population growth driven by inflows of expatriate workers to the country. However, Qatar’s contrast-ed performance must be put in perspective, as other GCC hydrocarbon-producing countries have recorded negative annual per capita GDP growth over the same period, with the exception of Saudi Arabia which benefits from a sig-nificantly larger population and is therefore less reliant on a foreign labour force ( see figure 4 ).
Figure 3 : GNI per capita, PPP ( constant 2011 international US $ ), 2004–2014 ( US $ thousands )
2014:$128,734
0
20
40
60
80
100
120
140
2004
2005
2006
2007
2008
2009
2010
2011
2012
2013
2014
US$
thou
sand
s
Qatar Kuwait UAESaudi Arabia High income BahrainOman
Source : World Bank ( 2016 ).

19
[ AN ECONOMY FACING AN IMPORTANT TRANSITION A MACROECONOMIC OVERVIEW ]
Figure 4 : GDP and GDP per capita in the GCC region, CAGR 2001–2014 ( constant 2005 US $ )
Saudi Arabia
UAE
Qatar
Kuwait Oman
Bahrain
-5%
-4%
-3%
-2%
-1%
0%
1%
2%
3%
4%
2% 4% 6% 8% 10% 12% 14%
GDP
per c
apita
(CAG
R 20
01-2
014)
GDP at market prices (CAGR 2001-2014)
The bubble size is proportionnal to the GDP at market prices of each country in 2014
Source : World Bank ( 2016 ).
Figure 5 : HDI and HDI components, Qatar, 1980–2014
5
6
7
8
9
1
1980
1985
1990
1997
2000
2005
2010
2015
Life Expectancy Education
Year
GNI per capitaHDI
Source : United Nations Development Programme ( 2016 ).

20
[ STRATEGIC TRADE DEVELOPMENT ROADMAP FOR SME COMPETITIVENESS IN QATAR 2018-2022 ]
In addition to economic performance, the Qatar growth model has delivered strong social outcomes over the years, including in the field of education, as well as im-proved welfare and standards of living. Qatar ranks 32 in the Human Development Index ( HDI ) rankings with an index of 0.850. Supported by its GNI index, the highest in the world, the country compares positively with its GCC peers and is closely followed by Saudi Arabia ( 0.837 ) and the UAE ( 0.835 ) ( see figure 6 ).
The breakdown of the HDI confirms the upward trends in terms of human development across all components ( see figure 5 ). Notably, life expectancy at birth has significantly increased over the past decades to reach 78.2 years in 2014, the highest level among the GCC countries, support-ed by massive public investment in the health-care system. Similarly, the Government has significantly increased public sector spending on education, namely with the inauguration of the Education City in 2003, leading to a surge in the coun-try’s education index. However, although expected years spent in schooling reached 13.8 years in 2014, Qatar is still lagging behind other Gulf states, including Saudi Arabia ( where this indicator is 16.3 years ) and, to a lesser extent, Kuwait ( 14.7 years ) and Bahrain ( 14.4 years ).
Although significant improvements have been achieved in terms of human development overall, some inequali-ties persist, notably as income distribution remains highly skewed, with an ‘income Gini coefficient’ 1 of 41.1, where a value of 0 represents absolute equality and a value of 100 ab-solute inequality. This suggests that continuous efforts must
1.– The Gini coefficient is a measure of the deviation of the distribution of income among individuals or households within a country from a perfectly equal distribution.
be made in order to fight inequalities and further improve the welfare and living standards of the entire population.
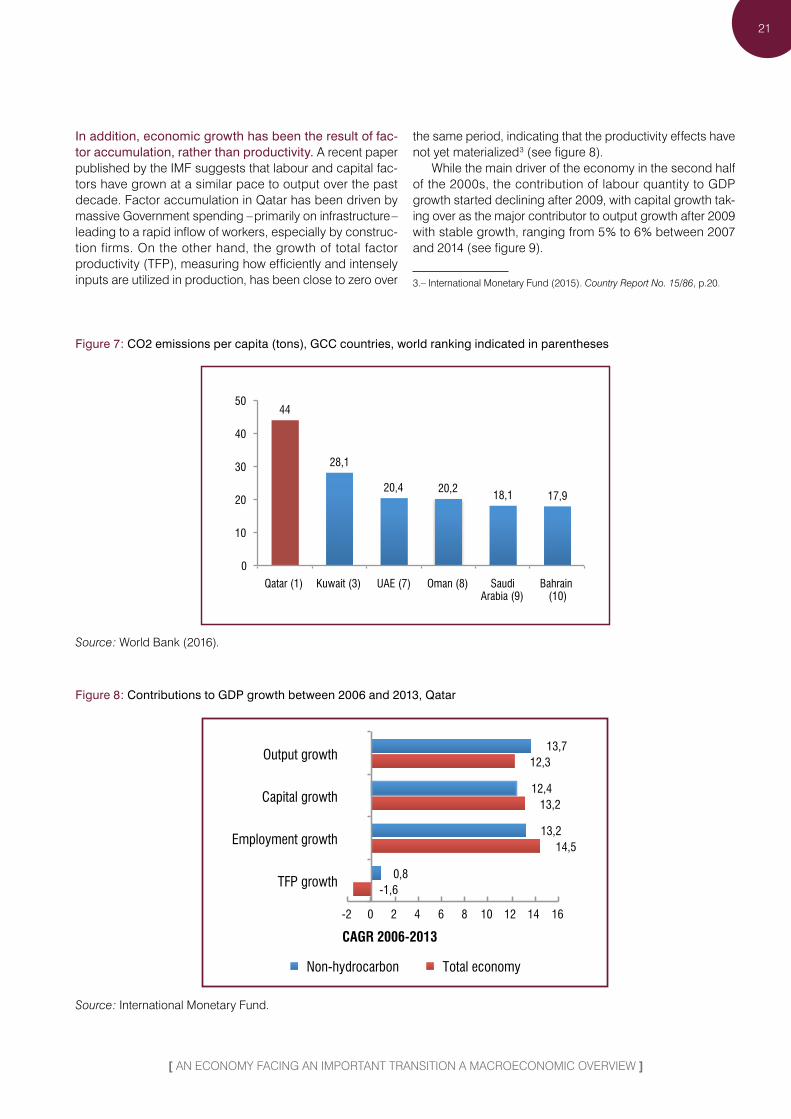
Qatar is also facing important environmental challenges due to high carbon dioxide ( CO2 ) emissions and water overconsumption. Qatar has the unfortunate title of being – by far – the world’s largest per capita greenhouse gas emitter, hence contributing to global climate change. With CO2 emissions estimated at 44 tons per capita, mostly from energy production, the country is well ahead of other GCC countries, even if the latter also rank among the top 10 greenhouse gas emitters in the world ( see figure 7 ). Another air quality challenge lies in the fact that ‘various local pol-lutants mix with particulates in the air to cause air quality problems that contribute to respiratory illnesses’.2
Another important environmental challenge is overcon-sumption of water. It is estimated that Qatar consumes al-most twice as much water as the global average and that its per capita water use is one of the highest in the world. Several factors explain the situation : chief among them is the enormous irrigation losses in the agricultural sector due to unsustainable irrigation methods that are depleting the country’s underground water resources. Large volumes of water are also lost in distribution due to leakage in transmis-sion and the fact that important volumes of wastewater go uncollected, untreated and unused. It is also noteworthy that Qatar largely depends on desalinating seawater, which is an energy-intensive process accounting for about 50 % of energy consumption in Qatar according to the IMF, therefore imposing a cost on the economy and the environment.
2.– Qatar General Secretariat for Development Planning ( 2011 ). Qatar National Development Strategy 2011–2016, p.21.
Figure 6 : HDI Index in GCC countries, 2014
Qatar UAE
Bahrain Kuwait
Saudi Arabia
Oman
0,75
0,77
0,79
0,81
0,83
0,85
0,87
0,89
- 20 40 60 80 100 120 140
HDI I
ndex
GNI per capita PPP (2011 US$ thousands)
Source : United Nations Development Programme ( 2016 ).
21
[ AN ECONOMY FACING AN IMPORTANT TRANSITION A MACROECONOMIC OVERVIEW ]
In addition, economic growth has been the result of fac-tor accumulation, rather than productivity. A recent paper published by the IMF suggests that labour and capital fac-tors have grown at a similar pace to output over the past decade. Factor accumulation in Qatar has been driven by massive Government spending – primarily on infrastructure – leading to a rapid inflow of workers, especially by construc-tion firms. On the other hand, the growth of total factor productivity ( TFP ), measuring how efficiently and intensely inputs are utilized in production, has been close to zero over
the same period, indicating that the productivity effects have not yet materialized 3 ( see figure 8 ).
While the main driver of the economy in the second half of the 2000s, the contribution of labour quantity to GDP growth started declining after 2009, with capital growth tak-ing over as the major contributor to output growth after 2009 with stable growth, ranging from 5 % to 6 % between 2007 and 2014 ( see figure 9 ).
3.– International Monetary Fund ( 2015 ). Country Report No. 15/86, p.20.
Figure 7 : CO2 emissions per capita ( tons ), GCC countries, world ranking indicated in parentheses
44
28,1
20,4 20,2 18,1 17,9
0
10
20
30
40
50
Qatar (1) Kuwait (3) UAE (7) Oman (8) Saudi Arabia (9)
Bahrain (10)
Source : World Bank ( 2016 ).
Figure 8 : Contributions to GDP growth between 2006 and 2013, Qatar
13,7
12,4
13,2
0,8
12,3
13,2
14,5
-1,6
-2 0 2 4 6 8 10 12 14 16
Output growth
Capital growth
Employment growth
TFP growth
CAGR 2006-2013
Non-hydrocarbon Total economy
Source : International Monetary Fund.

22
[ STRATEGIC TRADE DEVELOPMENT ROADMAP FOR SME COMPETITIVENESS IN QATAR 2018-2022 ]
The rapid inflows of expatriate workers that have support-ed the economic growth of Qatar have led to high popula-tion growth and caused the employment–population ratio to rise dramatically. Being a geographically small economy with a small native population, Qatar is highly dependent on inputs from abroad and has been in need of workers, specifically in the construction sector. The population of Qatar has consequently dramatically increased, reaching 2.53 million in March 2016 from 224,000 in 1980, with a mere 13 % of the population being Qatari nationals. Most expatriates come from Asian countries, with Indians being the largest community, followed by Nepalese, Filipinos, Egyptians, Bangladeshis, Sri Lankans and Pakistanis. The massive inflows of male workers, generally aged 25– 45, has led to a gender imbalance in the population ( see figure 10 ),
with females accounting for less than a quarter of the total population ( 24 % ).
The migration of workers led to a surge in the employ-ment rate at 87.6 % of the total population in 2014, from 48 % in 2001 and 68 % in 2007. However, significant disparities exist depending on gender, age and nationality, with the employment rate of non-Qatari males reaching an impres-sive 97.8 % compared with 68.9 % for their Qatari peers. The employment rate for women, in comparison, is significantly lower for both Qataris and non-Qataris, only reaching 35 % and 59.4 %, respectively ( see figure 11 ). By way of conse-quence the unemployment rate is extremely low in Qatar, at 0.2 %, affecting 3,262 people in 2014, of which 68 % are women. Non-Qatari females alone account for more than half of the unemployed population.
Figure 9 : Sources of economic growth, Qatar, 2000–2014 ( % GDP )
-5
0
5
10
15
20
25
2000
20
02
2004
20
06
2008
20
10
2012
20
14
%
Capital Labor TFP
Source : The Conference Board ( 2015 ).
Figure 10 : Population pyramid of Qatar, 2014
959085807570656055504540353025201510
50
99948984797469645954494439342924191494
––––––––––––––––––––
100+
Male
300 300240 240180 180120 12060 600 0
Female
Population (in thousands) Age Group Population (in thousands)
Source : Index Mundi ( 2016 ).

23
[ AN ECONOMY FACING AN IMPORTANT TRANSITION A MACROECONOMIC OVERVIEW ]
Figure 11 : Employment rate by age group, gender and nationality, Qatar, 2014
0
20
40
60
80
100
15-19
20-24
25-29
30-34
35-39
40-44
45-59
50-54
55-59
60-64 65
+
Qatari male Qatari female
Non-Qatari male Non-Qatari female
Total population
Source : Qatar Ministry of Development Planning and Statistics ( 2014 ).
Expatriates, in particular men, account for the bulk of the active population, mostly working in the private sector. Accounting for more than 84 % of the active population, non-Qatari males’ employment is highly concentrated in the lower-skilled and lower-paid private sector, mostly in the construction sector, while the majority of non-Qatari women are employed in the even lower-paid household sector ( see
figure 13 ). On the other hand, most Qataris – both males and females – are working in Government, where the monthly average wage is much higher, at around QAR 24,000 com-pared to QAR 7,600 in the private sector ( and as low as QAR 6,000 in the construction sector ).4
4.– According to : Qatar Ministry of Development Planning and Statistics ( 2014 ). Annual Bulletin of Labour Force Sample Survey 2014.
Figure 12 : Active population by nationality and gender, Qatar, 2008–2014
1.171.27 1.28 1.35
1.541.69
0,0
0,5
1,0
1,5
2,0
2008 2009 2011 2012 2013 2014
Popu
la1o
n, m
illio
ns
Non-Qatari males Non-Qatari females Qatari males Qatari females
Source : Qatar Ministry of Development Planning and Statistics ( 2014 ).

24
[ STRATEGIC TRADE DEVELOPMENT ROADMAP FOR SME COMPETITIVENESS IN QATAR 2018-2022 ]
Figure 13 : Active population by nationality, gender and sector, Qatar, 2014
14% 7%
82% 81%
3% 3%
5% 8%
26%
86%
13% 12%
56%
4%
Non-Qatari females
Non-Qatari males
Qatari females
Qatari males
Government Mixed Private Domestic
Source : Qatar Ministry of Development Planning and Statistics ( 2014 ).
Looking at the distribution of the labour force by sector, it appears that construction employment remains predomi-nant, employing more than 636,000 people or 38 % of the total workforce in 2014, despite a decline observed after 2008. Other important sectors in terms of employment in-clude wholesale and retail trade activities ( 12 % ), household workers ( 9 % ) and manufacturing ( 8 % ) ( see figure 14 ). More generally, employment trends indicate that, even though
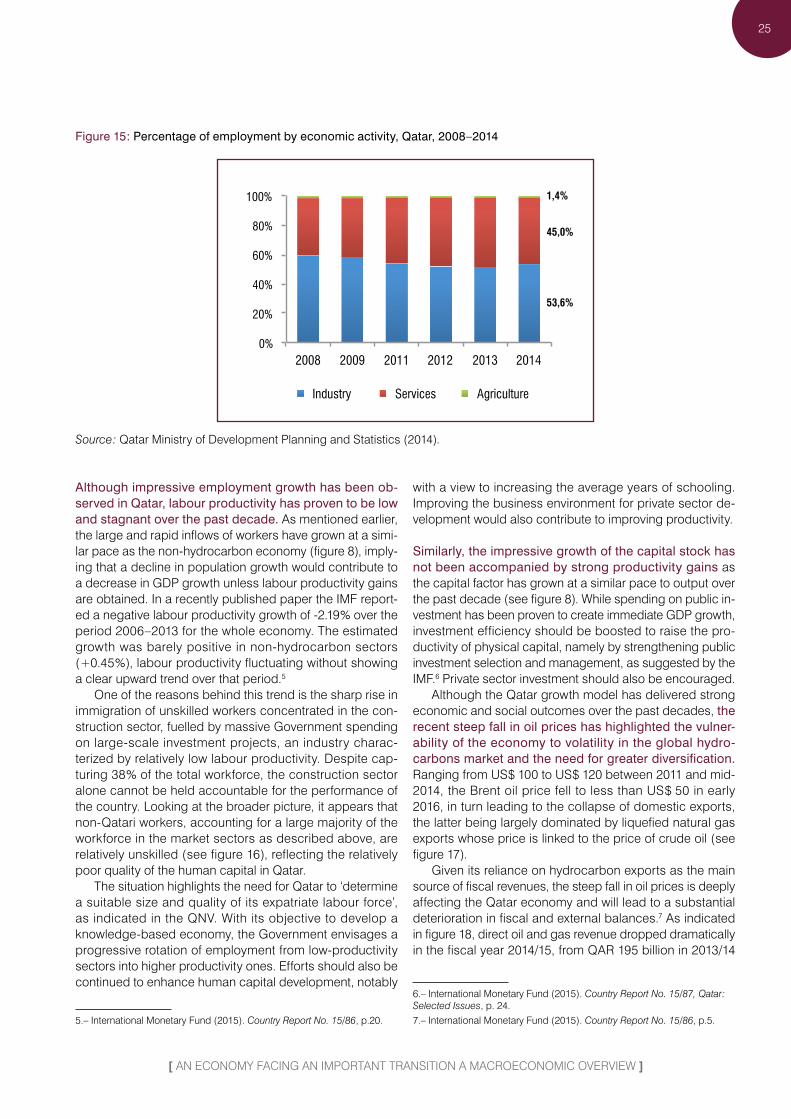
they remain predominant, the share of industrial jobs in to-tal employment has declined since 2008 while the services sector has gained importance over the years, accounting for 45 % of total employment in 2014, up from 39 % in 2008. This reflects the ongoing, though timid, transition towards a more diversified economy. Agricultural employment has remained stable over the years, accounting for a mere 1.4 % of total employment in 2014.
Figure 14 : Active population by economic activity, Qatar, 2014
0 200 400 600
Construction
Wholesale and retail trade
Household activities
Manufacturing
Mining and quarrying
Public administration
Transportation & storage
Administrative services
Accommoda.on & food services
Education
Pro., Sc. & technical activities
Health
Other activities
Population (thousands)
Source : Qatar Ministry of Development Planning and Statistics ( 2014 ).
25
[ AN ECONOMY FACING AN IMPORTANT TRANSITION A MACROECONOMIC OVERVIEW ]
Figure 15 : Percentage of employment by economic activity, Qatar, 2008–2014
53,6%
45,0%
1,4%
0%
20%
40%
60%
80%
100%
2008 2009 2011 2012 2013 2014
Industry Services Agriculture
Source : Qatar Ministry of Development Planning and Statistics ( 2014 ).
Although impressive employment growth has been ob-served in Qatar, labour productivity has proven to be low and stagnant over the past decade. As mentioned earlier, the large and rapid inflows of workers have grown at a simi-lar pace as the non-hydrocarbon economy ( figure 8 ), imply-ing that a decline in population growth would contribute to a decrease in GDP growth unless labour productivity gains are obtained. In a recently published paper the IMF report-ed a negative labour productivity growth of -2.19 % over the period 2006–2013 for the whole economy. The estimated growth was barely positive in non-hydrocarbon sectors ( +0.45 % ), labour productivity fluctuating without showing a clear upward trend over that period.5
One of the reasons behind this trend is the sharp rise in immigration of unskilled workers concentrated in the con-struction sector, fuelled by massive Government spending on large-scale investment projects, an industry charac-terized by relatively low labour productivity. Despite cap-turing 38 % of the total workforce, the construction sector alone cannot be held accountable for the performance of the country. Looking at the broader picture, it appears that non-Qatari workers, accounting for a large majority of the workforce in the market sectors as described above, are relatively unskilled ( see figure 16 ), reflecting the relatively poor quality of the human capital in Qatar.
The situation highlights the need for Qatar to ‘determine a suitable size and quality of its expatriate labour force’, as indicated in the QNV. With its objective to develop a knowledge-based economy, the Government envisages a progressive rotation of employment from low-productivity sectors into higher productivity ones. Efforts should also be continued to enhance human capital development, notably
5.– International Monetary Fund ( 2015 ). Country Report No. 15/86, p.20.
with a view to increasing the average years of schooling. Improving the business environment for private sector de-velopment would also contribute to improving productivity.
Similarly, the impressive growth of the capital stock has not been accompanied by strong productivity gains as the capital factor has grown at a similar pace to output over the past decade ( see figure 8 ). While spending on public in-vestment has been proven to create immediate GDP growth, investment efficiency should be boosted to raise the pro-ductivity of physical capital, namely by strengthening public investment selection and management, as suggested by the IMF.6 Private sector investment should also be encouraged.
Although the Qatar growth model has delivered strong economic and social outcomes over the past decades, the recent steep fall in oil prices has highlighted the vulner-ability of the economy to volatility in the global hydro-carbons market and the need for greater diversification. Ranging from US $ 100 to US $ 120 between 2011 and mid-2014, the Brent oil price fell to less than US $ 50 in early 2016, in turn leading to the collapse of domestic exports, the latter being largely dominated by liquefied natural gas exports whose price is linked to the price of crude oil ( see figure 17 ).
Given its reliance on hydrocarbon exports as the main source of fiscal revenues, the steep fall in oil prices is deeply affecting the Qatar economy and will lead to a substantial deterioration in fiscal and external balances.7 As indicated in figure 18, direct oil and gas revenue dropped dramatically in the fiscal year 2014/15, from QAR 195 billion in 2013/14
6.– International Monetary Fund ( 2015 ). Country Report No. 15/87, Qatar : Selected Issues, p. 24.7.– International Monetary Fund ( 2015 ). Country Report No. 15/86, p.5.

26
[ STRATEGIC TRADE DEVELOPMENT ROADMAP FOR SME COMPETITIVENESS IN QATAR 2018-2022 ]
to QAR 130 billion in 2014/15. The situation is expected to worsen for the fiscal year to come given the continued low oil prices. It is also to be noted that if direct oil and gas rev-enue amounted to approximately 55 % of total revenue over the past three fiscal years, on average, the IMF suggests
that since the bulk of investment income and corporate income tax comes from hydrocarbon activities, more than 90 % of total revenue would in fact be hydrocarbon revenue.8
8.– International Monetary Fund ( 2015 ). Country Report No. 15/87, Qatar : Selected Issues, p.8.
Figure 16 : Non-Qatari workers’ skills composition, 2013 ( % )
Unskilled 24%
Semi-skilled48%
Skilled 12%
Highly Skilled 16%
Source : Qatar Ministry of Development Planning and Statistics ( 2014 ).
Figure 17 : Correlation between crude oil prices and Qatar exports, 2006–2015 ( US $ billions )
Qatar exports
Crude oil prices, Brent
0
20
40
60
80
100
120
140
160
0
20
40
60
80
100
120
140
160
dic-05
dic-06
dic-07
dic-08
dic-09
dic-10
dic-11
dic-12
dic-13
dic-14
dic-15
$/bb
l, no
min
al $
US $
bill
ion
Sources : World Bank ( 2016 ) ( b ); and United Nations Comtrade.

27
[ AN ECONOMY FACING AN IMPORTANT TRANSITION A MACROECONOMIC OVERVIEW ]
Figure 18 : Composition of fiscal revenue and total revenue growth, Qatar, 2009/10–2014/15
162.2 155.9
222.6
284.3
342-8
288.5
19,9%
-7,8%
42,8%
-15,8%-20%
-10%
0%
10%
20%
30%
40%
50%
0
50
100
150
200
250
300
350
400
FY09/10 FY10/11 FY11/12 FY12/13 FY13/14 FY14/15
% c
hang
e
QAR
billi
ons
Oil and gas Investment Other % growth
20,6%
27,7%
Source : Qatar Ministry of Development Planning and Statistics ( 2015 ).
The significant contraction of the oil and natural gas sec-tor provides a new context whereby the non-hydrocarbon sector is spearheading economic growth. After years of double-digit GDP expansion, Qatar has experienced stable growth at around 4–5 % since 2012 ( World Bank ), driven almost exclusively by the expansion of the non-oil-and-gas sector. The services sector has notably emerged as the major driver of GDP growth with a contribution of 4.4 % in 2014, followed by the construction industry ( 2.2 % ) and the manufacturing sector ( 0.4 % ) ( see figure 19 ).
While this trend primarily reflects the fall in oil and gas prices, and the contraction of hydrocarbon exports, it also
highlights the fast growth of the non-oil-and-gas sector and the recent progress achieved by Qatar in its efforts towards greater economic diversification. While almost no growth has been observed in the hydrocarbons sector since 2012, the non-hydrocarbon sector has reported double-digit growth in recent years, driven notably by solid growth in the services, construction and manufacturing sectors ( see fig-ure 20 ). The share of non-hydrocarbons’ output in GDP has steadily increased over the years, and notably after 2004, from 41.9 % in 2011 to 48.9 % in 2014.
Figure 19 : Contributions to real GDP growth, Qatar, 2010–2014 ( % )
11,6%
6,9%
0,6%
-0,5%
1,6%
0,9%
1,0% 0,5% 0,4%
1,1%
1,2%
1,0% 2,1% 2,2%
2,8%
4,5%
3,5% 4,3% 4,4%
-5%
0%
5%
10%
15%
20%
2010 2011 2012 2013 2014
Hydrocarbons Manufacturing Construction Services
Source : MoDPS estimates, from Qatar Ministry of Development Planning and Statistics ( 2015 ).

28
[ STRATEGIC TRADE DEVELOPMENT ROADMAP FOR SME COMPETITIVENESS IN QATAR 2018-2022 ]
Figure 20 : Oil and non-oil real GDP growth, Qatar, 2008–2016 ( %, constant prices )
Non-oil real GDP growth 9,5%
Oil real GDP growth
0,2%
-5%
0%
5%
10%
15%
20%
25%
30%
2009
20
10
2011
20
12
2013
20
14
2015
2016
e
Non-oil real GDP growth Oil real GDP growth
Source : International Monetary Fund.
Despite recent signs of economic diversification and the rapid growth of the non-oil non-gas sector, the economy remains highly dependent on hydrocarbons, the latter still accounting for more than half of the nominal GDP in 2014 ( Qatar Ministry of Development Planning and Statistics ( MoDPS ) estimates ). Intensification of diversification efforts
is therefore needed to reduce exposure to uncertainty in the global oil market and make the Qatar economy less reliant on volatile hydrocarbon revenues, all the more so as hydro-carbon prices are unlikely to show significant increases in the coming years.
Implication for the STDR :
• Sustained but low levels of economic growth and high reliance on an uncertain hydrocarbon resource – the STDR to focus on maintaining sustainable growth through trade diversification in order to reduce vulnerability.
• Economic growth has been driven by factor accumulation rather than productivity – the STDR to favour productivity gains.
• High environmental impact with current economic model – he STDR to focus on reversing the trend through selection of sustain-able diversification paths.
• Growth has translated into improved well-being but certain inequalities remain – the STDR to seek social values and adjust immigration policies to even welfare distribution.
60-
40-
20-
0
20
40
60
80
100
120
140
160
200520062007200820092010201120122013201420152016
US$
billio
ns
Exports Imports Trade Balance
80-
40-
0
40
80
120
160
2005 2006 2007 2008 2009 2010 2011 2012 2013 2014 2015 2016
US$
billio
ns
Exports Imports Trade balance
20-
0
20
40
60
80
2006 2007 2008 2009 2010 2011 2012 2013 2014 2015 2016 2017 2018 2019 2020 2021 2022
US$
bill
ions
Kuwait Oman Qatar UAE
IMF estimates
29
[ DIVERSIFICATION EFFORTS ARE UNDER WAY BUT NOT YET TRANSLATING INTO CONCRETE RESULTS TRADE AND INVESTMENT ANALYSIS ]
DIVERSIFICATION EFFORTS ARE UNDER WAY BUT
NOT YET TRANSLATING INTO CONCRETE RESULTS
TRADE AND INVESTMENT ANALYSIS
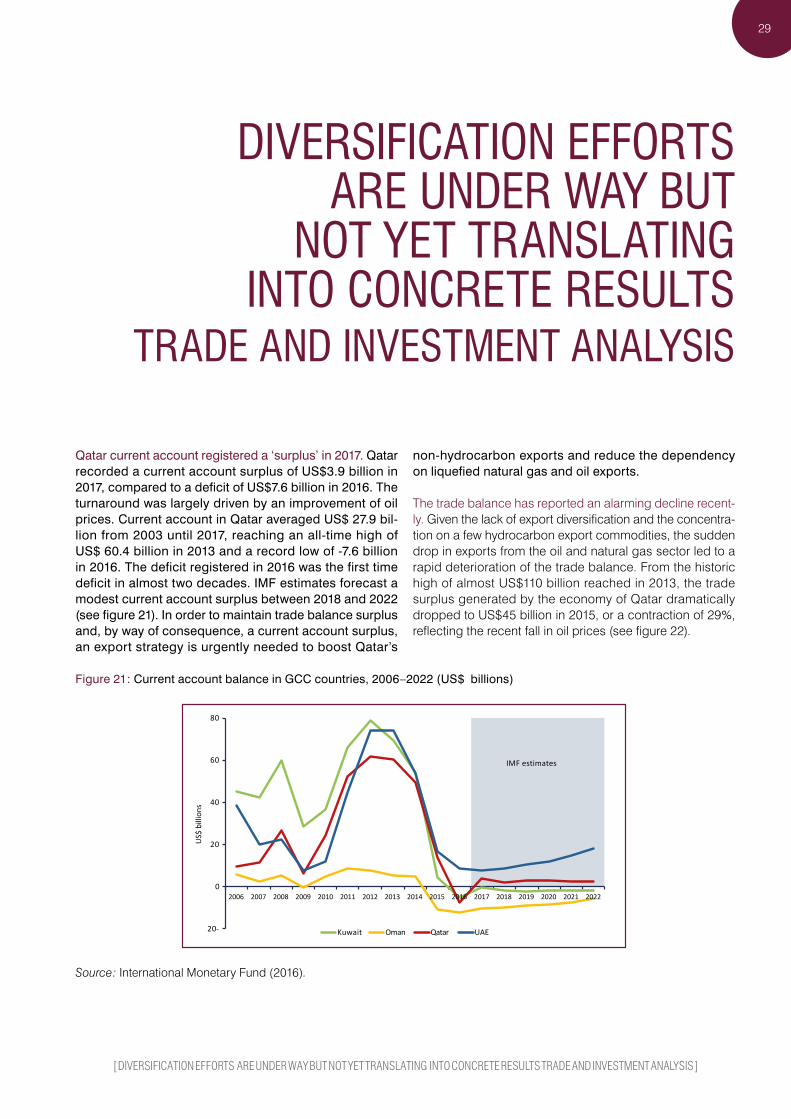
Qatar current account registered a ‘surplus’ in 2017. Qatar recorded a current account surplus of US$3.9 billion in 2017, compared to a deficit of US$7.6 billion in 2016. The turnaround was largely driven by an improvement of oil prices. Current account in Qatar averaged US$ 27.9 bil-lion from 2003 until 2017, reaching an all-time high of US$ 60.4 billion in 2013 and a record low of -7.6 billion in 2016. The deficit registered in 2016 was the first time deficit in almost two decades. IMF estimates forecast a modest current account surplus between 2018 and 2022 (see figure 21). In order to maintain trade balance surplus and, by way of consequence, a current account surplus, an export strategy is urgently needed to boost Qatar’s
non-hydrocarbon exports and reduce the dependency on liquefied natural gas and oil exports.
The trade balance has reported an alarming decline recent-ly. Given the lack of export diversification and the concentra-tion on a few hydrocarbon export commodities, the sudden drop in exports from the oil and natural gas sector led to a rapid deterioration of the trade balance. From the historic high of almost US$110 billion reached in 2013, the trade surplus generated by the economy of Qatar dramatically dropped to US$45 billion in 2015, or a contraction of 29%, reflecting the recent fall in oil prices (see figure 22).
Figure 21 : Current account balance in GCC countries, 2006–2022 ( US $ billions )
Source : International Monetary Fund ( 2016 ).

60-
40-
20-
0
20
40
60
80
100
120
140
160
200520062007200820092010201120122013201420152016
US$
billio
ns
Exports Imports Trade Balance
80-
40-
0
40
80
120
160
2005 2006 2007 2008 2009 2010 2011 2012 2013 2014 2015 2016
US$
billio
ns
Exports Imports Trade balance
20-
0
20
40
60
80
2006 2007 2008 2009 2010 2011 2012 2013 2014 2015 2016 2017 2018 2019 2020 2021 2022
US$
bill
ions
Kuwait Oman Qatar UAE
IMF estimates
30
[ STRATEGIC TRADE DEVELOPMENT ROADMAP FOR SME COMPETITIVENESS IN QATAR 2018-2022 ]
Figure 22 : Trade balance ( goods only ), Qatar, 2005–2016 ( US $ billions )
Source : United Nations Comtrade.
The deterioration of the trade balance has also been fuelled by the steady expansion of imports in recent years. Imports of machinery and transportation equipment dominate, reflecting capital investments and supporting in-frastructure development.9 Food products, including basic agricultural products such as meat, dairy products and cere-als, are also mostly imported given the limited output of do-mestic agriculture due to the arid climate and the absence of arable land. The country’s imports grew at a CAGR of 7.9 %
9.– World Trade Organization ( 2014 ). Trade Policy Review : Qatar, p. 8.
between 2006 and 2015, reaching a record US $ 32.6 billion in value in 2015. The trade balance declined for the second year in 2016 in a row to reach US$25.2 billion given the de-layed impact of low oil prices on the country’s exports. Most imported commodities come from the European Union ( EU ) ( the 28 EU Member States accounted for 29 % of Qatar’s to-tal imports in 2015 ), with Germany being the main European trading partner, followed by the United Kingdom of Great Britain and Northern Ireland, Italy and France ( see figure 24 ). Other key trading partners include China, representing a share of 12 % in the country’s imports, the United States of America ( 11 % ), the UAE ( 11 % ) and Japan ( 9 % ).
Figure 23 : Qatar imports by products, 2015 ( % )
Machinery 15,6%
Vehicles 13,6%
Electrical, electronic equipment
10,4%
Aircraft, spacecraft, and parts
6,0% Articles of
iron or steel 5,6%
Other 48,8%
Sources : International Trade Centre ( ITC ) calculations based on United Nations Comtrade and MoDPS statistics.

31
Figure 24 : Supplying markets for Qatar imports ( % )
China 12%
United States
[PERCENTAGE]
UAE 9%
Japan 7%
Saudi Arabia
4%
India 4% Other
24%
Germany 7%
United Kingdom
[PERCENTAGE]
Italy 4%
France 4%
Other EU 28 MS
8%
EU 28 29%
Sources : ITC calculations based on United Nations Comtrade and MoDPS statistics.
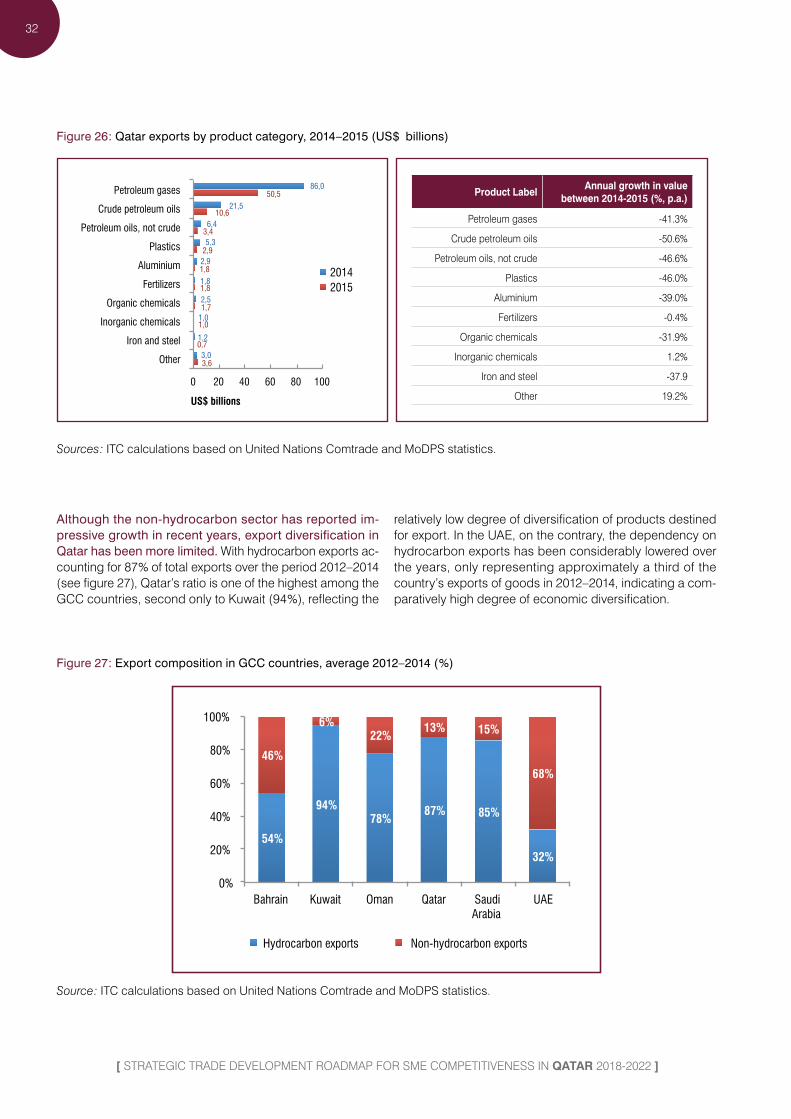
Largely dominating exports of goods in Qatar, the trade performance of the hydrocarbon sector is deeply affected by the recent drop in oil prices. Exports from the oil and natural gas sector declined by 43 % in 2015, from US $ 113.9 billion worth of goods exported in 2014 to US $ 64.5 billion in 2015 ( see figure 26 ). Hydrocarbon exports in Qatar ac-counted for approximately 83 % of total exports, largely dominated by petroleum gases, and liquefied natural gas more precisely, which alone captured 64.8 % of the country’s
total exports in 2015. Despite a sharp decline of 11 % in the annual growth of world imports for hydrocarbons ( see fig-ure 29 ), Qatar remained the biggest exporter of petroleum gases in 2015 with a share in world exports of 20.2 %, for an exported value of US $ 50.5 billion. Other important hydro-carbon products include crude petroleum oils, accounting for 13.6 % of the country’s exports, and other petroleum oils, not crude ( 4.4 % ).
Figure 25 : Qatar exports by product category, 2015 ( % )
Plastics 3,7%
Aluminium 2,3%
Fertilizers 2,2%
Organic chemicals
2,2%
Other 6,8% Petroleum
gases 64,8%
Crude petroleum oils
13,6%
Petroleum oils, not crude
4,4%
Mineral fuels, oils, distillation products
82.8%
Sources : ITC calculations based on United Nations Comtrade and MoDPS statistics.
[ DIVERSIFICATION EFFORTS ARE UNDER WAY BUTNOT YET TRANSLATING INTO CONCRETE RESULTSTRADE AND INVESTMENT ANALYSIS ]
32
[ STRATEGIC TRADE DEVELOPMENT ROADMAP FOR SME COMPETITIVENESS IN QATAR 2018-2022 ]
Figure 26 : Qatar exports by product category, 2014–2015 ( US $ billions )
86,0
21,5
6,4
5,3
2,9
1,8
2,5
1,0
1,2
3,0
50,5
10,6
3,4
2,9
1,8
1,8
1,7
1,0
0,7
3,6
Petroleum gases
Crude petroleum oils
Petroleum oils, not crude
Plastics
Aluminium
Fertilizers
Organic chemicals
Inorganic chemicals
Iron and steel
Other
0 20 40 60 80 100
US$ billions
2014 2015
Product LabelAnnual growth in value
between 2014-2015 (%, p.a.)
Petroleum gases -41.3%
Crude petroleum oils -50.6%
Petroleum oils, not crude -46.6%
Plastics -46.0%
Aluminium -39.0%
Fertilizers -0.4%
Organic chemicals -31.9%
Inorganic chemicals 1.2%
Iron and steel -37.9
Other 19.2%
Sources : ITC calculations based on United Nations Comtrade and MoDPS statistics.
Although the non-hydrocarbon sector has reported im-pressive growth in recent years, export diversification in Qatar has been more limited. With hydrocarbon exports ac-counting for 87 % of total exports over the period 2012–2014 ( see figure 27 ), Qatar’s ratio is one of the highest among the GCC countries, second only to Kuwait ( 94 % ), reflecting the
relatively low degree of diversification of products destined for export. In the UAE, on the contrary, the dependency on hydrocarbon exports has been considerably lowered over the years, only representing approximately a third of the country’s exports of goods in 2012–2014, indicating a com-paratively high degree of economic diversification.
Figure 27 : Export composition in GCC countries, average 2012–2014 ( % )
54%
94% 78%
87% 85%
32%
46%
6% 22%
13% 15%
68%
0%
20%
40%
60%
80%
100%
Bahrain Kuwait Oman Qatar Saudi Arabia
UAE
Hydrocarbon exports Non-hydrocarbon exports
Source : ITC calculations based on United Nations Comtrade and MoDPS statistics.

33
Figure 28 : Hydrocarbon and non-hydrocarbon exports, Qatar, 2006–2015 ( US $ billions )
Hydrocarbon exports
Non hydrocarbon
exports
0
20
40
60
80
100
120
140
160
2006
20
07
2008
20
09
2010
20
11
2012
20
13
2014
20
15
US$
billi
ons
Source : ITC calculations based on United Nations Comtrade and MoDPS statistics.
Non-hydrocarbon exports have, however, progressed over the past decade. With US $ 13.4 billion worth of goods exported, the non-hydrocarbon sector accounted for a mere 17 % of Qatar’s total exports in 2015. Despite a contraction reported that year, non-hydrocarbon exports grew at an im-pressive CAGR of 16.1 % over the period 2006–2014, though from a very low base. This surge in exports has notably been driven by the emergence of commodities such as plastics, aluminium, fertilizers and organic and inorganic chemicals. As indicated in figure 29 though, Qatari exports of these products appear to be underperforming on the international scene in the sense that the country’s annual increase in world market share for these products decreased over the period 2011–2015.
While non-oil-and-gas exports have increased signifi-cantly over the past decade, Qatar imports have increased at a higher pace, notably after 2011, leading to a deteriora-tion of the non-hydrocarbon trade balance ( see figure 30 ). This once again highlights the need to intensify diversifica-tion efforts in Qatar, notably targeting exports in order to keep up with the increase in imported goods.
Qatar’s exports are heavily dependent on the Asian mar-ket. Asian countries are by far the largest importers of Qatari products, together capturing 82 % of the country’s total ex-ports. With an imported value of US $ 16.2 billion in 2015, Japan emerged as the top importer of commodities from Qatar, capturing 21 % of the country’s exports. Other major importers include the Republic of Korea, accounting for 17 % of Qatar’s exports, India ( 12 % ), China ( 7 % ) and the UAE, the main importer in the Gulf region ( 6 % ). Europe only ac-counted for 12 % of Qatar’s total exports in 2015 with US $ 9.3 billion worth of commodities imported in 2015. The relatively untapped European markets could offer significant opportu-nities for Qatar’s exports in the near future. From a regional perspective, the share of GCC countries in Qatar’s exports represented US $ 6.5 billion, or 8.4 % of the total exports in 2015, largely driven by UAE imports, alone attracting 73 % of the region’s share.
Taking a closer look at the evolution of imports over time, it appears that the same import trends have been observed in each destination market, closely reflecting oil price de-velopments with little change in the actual demand of these markets.
[ DIVERSIFICATION EFFORTS ARE UNDER WAY BUTNOT YET TRANSLATING INTO CONCRETE RESULTSTRADE AND INVESTMENT ANALYSIS ]

34
[ STRATEGIC TRADE DEVELOPMENT ROADMAP FOR SME COMPETITIVENESS IN QATAR 2018-2022 ]
Figure 29 : Growth of national supply and international demand for products exported by Qatar in 2015
Source : ITC calculations based on United Nations Comtrade statistics.
Figure 30 : Non-hydrocarbon trade balance, Qatar, 2006–2015 ( US $ billions )
-40
-20
0
20
40
2006
20
07
2008
20
09
2010
20
11
2012
20
13
2014
20
15
US$
billi
ons
Non hydrocarbon exports
Imports
Sources : ITC calculations based on United Nations Comtrade and MoDPS statistics.

35
Figure 31 : Importing markets for Qatari exports, by region, 2015 ( % )
Oceania 1%
Africa 2%
[US PERCENTAGE]
Europe 12%
Japan 21%
Rep. of Korea 17%
India 12%
China 7%
UAE 6%
Singapore 4%
Other Asian countries
15%
Asia 82%
Sources : ITC calculations based on United Nations Comtrade and MoDPS statistics.
The decomposition of export growth in Qatar indicates that export growth in the last decade has been almost exclusively driven by a greater volume of trade in tradi-tional products – hydrocarbons in this case – to traditional, or established, markets, dominated by Asian countries ( see figure 32 ). Overall the market diversification for Qatar ex-ports over the period 2010–2014 was extremely limited or
non-existent. In addition, very few new products have been exported, reflecting a very low level of innovation. This de-composition highlights the limited results obtained by Qatar so far in its objective of achieving greater economic diversi-fication. There is an urgent need for the country to diversify its export markets and improve the competitiveness of its products on international markets.
Figure 32 : Decomposition of export growth along margins of trade, Qatar, 2010–2014
Crea
tion
of o
ldpr
oduc
ts in
old
mar
kets
Deco
mpo
sitio
n of
Tot
al E
xpor
t Gro
wth
1.33
1.1
1.33
0.3
1.33
0.0
1.33 -1.5-6.8
98.67
106.9100
80
60
40
20
0
100
80
60
40
20
0
Intensive MarginExtensive Margin
98.67 98.67
0.0
Avg.
Tot
al
Incr
ease
old
prod
ucts
inne
w m
arke
ts
Incr
ease
of n
ewpr
oduc
ts in
old
mar
kets
Incr
ease
of
new
pro
duct
s in
new
mar
kets
Extin
ctio
n of
expo
rts
of o
ldpr
oduc
ts in
old
mar
kets
Fall
of o
ldpr
oduc
ts in
old
mar
kets
Incr
ease
of o
ldpr
oduc
ts in
old
mar
kets
Source : World Bank ( 2016 ) ( c ).
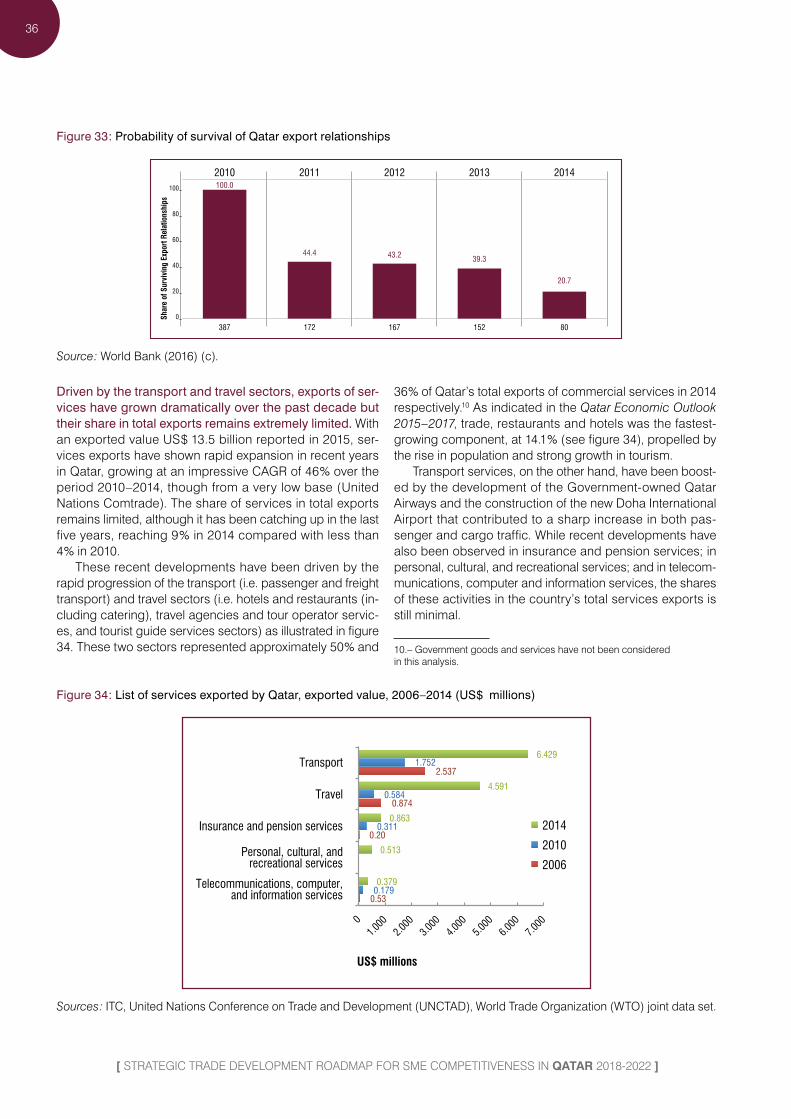
Supplementary to the above diagnostic, an analysis of the duration of Qatari export relationships reveals that Qatari ex-porters are having difficulties sustaining export relationships over a prolonged period. The performance is alarming, as the probability of an export relationship surviving until the second year is 44.4 %, this probability falling to 20.7 % after three years ( see figure 33 ).
[ DIVERSIFICATION EFFORTS ARE UNDER WAY BUTNOT YET TRANSLATING INTO CONCRETE RESULTSTRADE AND INVESTMENT ANALYSIS ]
36
[ STRATEGIC TRADE DEVELOPMENT ROADMAP FOR SME COMPETITIVENESS IN QATAR 2018-2022 ]
Figure 33 : Probability of survival of Qatar export relationships
387
Shar
e of
Sur
vivi
ng E
xpor
t Rel
atio
nshi
ps
100
80
60
40
20
0
172 167 152 80
100.0
44.4 43.2 39.3
20.7
2010 2011 2012 2013 2014
Source : World Bank ( 2016 ) ( c ).
Driven by the transport and travel sectors, exports of ser-vices have grown dramatically over the past decade but their share in total exports remains extremely limited. With an exported value US $ 13.5 billion reported in 2015, ser-vices exports have shown rapid expansion in recent years in Qatar, growing at an impressive CAGR of 46 % over the period 2010–2014, though from a very low base ( United Nations Comtrade ). The share of services in total exports remains limited, although it has been catching up in the last five years, reaching 9 % in 2014 compared with less than 4 % in 2010.
These recent developments have been driven by the rapid progression of the transport ( i.e. passenger and freight transport ) and travel sectors ( i.e. hotels and restaurants ( in-cluding catering ), travel agencies and tour operator servic-es, and tourist guide services sectors ) as illustrated in figure 34. These two sectors represented approximately 50 % and
36 % of Qatar’s total exports of commercial services in 2014 respectively.10 As indicated in the Qatar Economic Outlook 2015–2017, trade, restaurants and hotels was the fastest-growing component, at 14.1 % ( see figure 34 ), propelled by the rise in population and strong growth in tourism.
Transport services, on the other hand, have been boost-ed by the development of the Government-owned Qatar Airways and the construction of the new Doha International Airport that contributed to a sharp increase in both pas-senger and cargo traffic. While recent developments have also been observed in insurance and pension services; in personal, cultural, and recreational services; and in telecom-munications, computer and information services, the shares of these activities in the country’s total services exports is still minimal.
10.– Government goods and services have not been considered in this analysis.
Figure 34 : List of services exported by Qatar, exported value, 2006 –2014 ( US $ millions )
6.429
4.591
0.863
0.513
0.379
1.752
0.584
0.311
0.179
2.537
0.874
0.20
0.53
0
1.000
2.000
3.000
4.000
5.000
6.000
7.000
Transport
Travel
Insurance and pension services
Personal, cultural, and recreational services
Telecommunications, computer, and information services
US$ millions
2014
2010
2006
Sources : ITC, United Nations Conference on Trade and Development ( UNCTAD ), World Trade Organization ( WTO ) joint data set.

37
Figure 35 : Services subsector growth ( % change ), Qatar, 2010–2014
0
2
4
6
8
10
12
14
16
2010 2011 2012 2013 2014
% c
hang
e Hotels
Transport and Communications
Finance, insurance, real estate and business services
Source : MoDPS estimates, from Qatar Ministry of Development Planning and Statistics ( 2015 ).Note : Output is measured in constant 2004 prices.
In analysing exports of services, a distinction between mod-ern and traditional services is useful. Modern services in-clude communications, insurance, finance, computer and information, royalties and licence fees and other business services; whereas traditional services include transport, travel, construction, and personal, cultural and recreational services. Modern services generate higher value added and present a higher degree of sophistication. According to this classification, Qatar is currently extremely dependent on tra-ditional services, the latter accounting for more than 90 % of all exports of services in 2014. While efforts should be made to strengthen and consolidate the recent developments ob-served in the services sector, notably in the transport and tourism industries, this analysis also highlights the need for Qatar to diversify its services from traditional services to-wards higher value services.
While services exports have recently shown significant improvements, imports of services ( in value ) have grown at a faster pace than domestic exports, resulting in the deterioration of the services balance. Driven notably by a sharp increase in travel and transportation services in recent years, services imports grew at a CAGR of 39 % over the past five years, from US $ 5.8 billion in 2010 to a record US $ 32.9 billion in 2014. Business services, including trade-related services, research and development ( R&D ), advertising and market research, among others, have also significantly progressed, accounting for 9 % of Qatar’s ser-vices imports in 2011, while no trade data were reported under this component before 2011. As a result of this dra-matic increase in imports the services deficit widened over the years to reach an historic high of US $ 19.3 billion in 2014 ( see figure 37 ).
Figure 36 : Imports of services, Qatar, 2014 ( % )
Transport 40%
Travel 29%
Other business services
9%
ICT 9%
Insurance and pension
services 8%
Personal, cultural, and recreational
services 5%
Sources : ITC, UNCTAD, WTO joint dataset.
[ DIVERSIFICATION EFFORTS ARE UNDER WAY BUTNOT YET TRANSLATING INTO CONCRETE RESULTSTRADE AND INVESTMENT ANALYSIS ]

38
[ STRATEGIC TRADE DEVELOPMENT ROADMAP FOR SME COMPETITIVENESS IN QATAR 2018-2022 ]
Figure 37 : Net trade in services, Qatar, 2005–2014 ( US $ billions )
-40
-30
-20
-10
0
10
20
2005
20
06
2007
20
08
2009
20
10
2011
20
12
2013
20
14
US$
billi
ons
Imports Exports Trade balance
Sources : ITC, UNCTAD, WTO joint dataset.
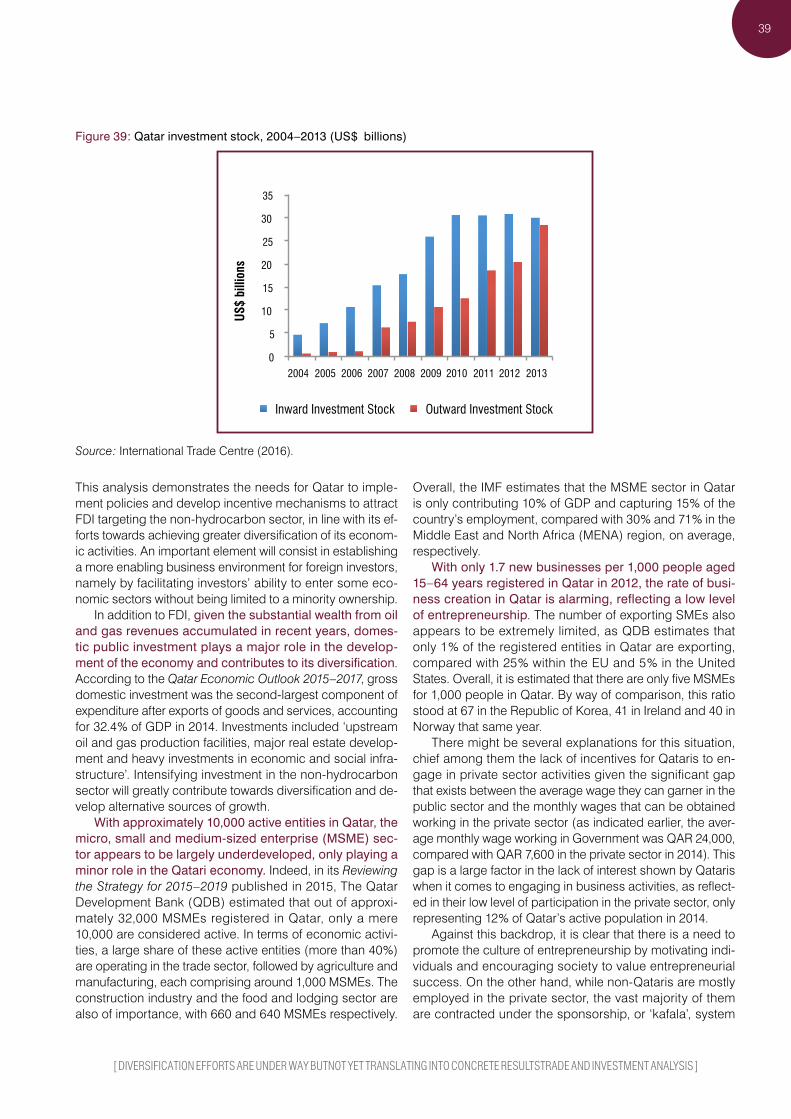
According to the World Bank’s World Development Indicators, Qatar FDI net inflows dropped dramatically after 2009, from more than US $ 8.1 billion that year to less than US $ 1 billion in 2011. Since then, net inflows have stag-nated, accounting for less than 1 % of GDP ( see figure 38 ). The inward FDI stocks are, however, significant, approach-ing US $ 30 billion in 2013 ( see figure 39 ). In terms of sourc-es of FDI, the United States was by far the largest source, alone accounting for 34.5 % of the Qatar inward stocks in 2012, followed by the Netherlands ( 15.3 % ), France ( 10.6 % ), Saudi Arabia ( 8.1 % ) and Italy ( 6.3 % ).11 These five countries
11.– Qatar Ministry of Development Planning and Statistics ( 2014 ) ( b ). Foreign Investment Survey, 2013. Doha.
dominated with 74.8 % of total foreign investment by the end of 2012.
Looking at the economic activities targeted by foreign investors, the Qatar Foreign Investment Survey for the year 2013 indicates that FDI inflows in Qatar are largely domi-nated in the mining and quarrying industry and manufac-turing, accounting for 44.2 % and 21.9 % of the inward stock reported in 2012, respectively. The remainder was concen-trated in the building and construction sector ( 13.9 % ) and in professional, scientific, technical, administrative and support service activities ( 10.7 % ).
Figure 38 : FDI net inflows, Qatar, 2001–2014 ( US $ billions )
-2
0
2
4
6
8
10
-2
0
2
4
6
8
10
2003
20
05
2007
20
09
2011
20
13
% G
DP
Curr
ent U
S$ b
illio
ns
FDI, net inflows (BoP, current US$)
FDI, net inflows (% of GDP)
Source : International Monetary Fund.
39
Figure 39 : Qatar investment stock, 2004–2013 ( US $ billions )
0
5
10
15
20
25
30
35
2004 2005 2006 2007 2008 2009 2010 2011 2012 2013
US$
billi
ons
Inward Investment Stock Outward Investment Stock
Source : International Trade Centre ( 2016 ).
This analysis demonstrates the needs for Qatar to imple-ment policies and develop incentive mechanisms to attract FDI targeting the non-hydrocarbon sector, in line with its ef-forts towards achieving greater diversification of its econom-ic activities. An important element will consist in establishing a more enabling business environment for foreign investors, namely by facilitating investors’ ability to enter some eco-nomic sectors without being limited to a minority ownership.
In addition to FDI, given the substantial wealth from oil and gas revenues accumulated in recent years, domes-tic public investment plays a major role in the develop-ment of the economy and contributes to its diversification. According to the Qatar Economic Outlook 2015–2017, gross domestic investment was the second-largest component of expenditure after exports of goods and services, accounting for 32.4 % of GDP in 2014. Investments included ‘upstream oil and gas production facilities, major real estate develop-ment and heavy investments in economic and social infra-structure’. Intensifying investment in the non-hydrocarbon sector will greatly contribute towards diversification and de-velop alternative sources of growth.
With approximately 10,000 active entities in Qatar, the micro, small and medium-sized enterprise ( MSME ) sec-tor appears to be largely underdeveloped, only playing a minor role in the Qatari economy. Indeed, in its Reviewing the Strategy for 2015–2019 published in 2015, The Qatar Development Bank ( QDB ) estimated that out of approxi-mately 32,000 MSMEs registered in Qatar, only a mere 10,000 are considered active. In terms of economic activi-ties, a large share of these active entities ( more than 40 % ) are operating in the trade sector, followed by agriculture and manufacturing, each comprising around 1,000 MSMEs. The construction industry and the food and lodging sector are also of importance, with 660 and 640 MSMEs respectively.
Overall, the IMF estimates that the MSME sector in Qatar is only contributing 10 % of GDP and capturing 15 % of the country’s employment, compared with 30 % and 71 % in the Middle East and North Africa ( MENA ) region, on average, respectively.
With only 1.7 new businesses per 1,000 people aged 15–64 years registered in Qatar in 2012, the rate of busi-ness creation in Qatar is alarming, reflecting a low level of entrepreneurship. The number of exporting SMEs also appears to be extremely limited, as QDB estimates that only 1 % of the registered entities in Qatar are exporting, compared with 25 % within the EU and 5 % in the United States. Overall, it is estimated that there are only five MSMEs for 1,000 people in Qatar. By way of comparison, this ratio stood at 67 in the Republic of Korea, 41 in Ireland and 40 in Norway that same year.
There might be several explanations for this situation, chief among them the lack of incentives for Qataris to en-gage in private sector activities given the significant gap that exists between the average wage they can garner in the public sector and the monthly wages that can be obtained working in the private sector ( as indicated earlier, the aver-age monthly wage working in Government was QAR 24,000, compared with QAR 7,600 in the private sector in 2014 ). This gap is a large factor in the lack of interest shown by Qataris when it comes to engaging in business activities, as reflect-ed in their low level of participation in the private sector, only representing 12 % of Qatar’s active population in 2014.
Against this backdrop, it is clear that there is a need to promote the culture of entrepreneurship by motivating indi-viduals and encouraging society to value entrepreneurial success. On the other hand, while non-Qataris are mostly employed in the private sector, the vast majority of them are contracted under the sponsorship, or ‘kafala’, system
[ DIVERSIFICATION EFFORTS ARE UNDER WAY BUTNOT YET TRANSLATING INTO CONCRETE RESULTSTRADE AND INVESTMENT ANALYSIS ]

40
[ STRATEGIC TRADE DEVELOPMENT ROADMAP FOR SME COMPETITIVENESS IN QATAR 2018-2022 ]
whereby the employer is responsible for the workers’ visas and legal status, leaving them with relatively little flexibility and opportunity to move between jobs, and even less so to register their own business.
A more enabling business environment would be needed to improve the ease of doing business in Qatar and to encourage more people to engage in private sec-tor activities. As developed further under the business en-vironment component of the competitiveness constraints analysis ( also referred to as the ‘four gears analysis’ ), a
number of obstacles hinder the development of the private sector in Qatar. Chief among them, as briefly mentioned above and as confirmed by the World Economic Forum Global Competitiveness Report 2015–2016, are strict la-bour regulations and the inadequately educated workforce ( see figure 40 ). The World Bank Doing Business survey also indicates that the business community is facing important constraints in Qatar, including factors such as challenges in accessing finance, as well as challenges in accessing electricity and protecting minority investors ( see figure 41 ).
Figure 40 : The most problematic factors for doing business in Qatar12
Restrictive labor regulations . . . . . . . . . . . . . . . . . . . . . 13.0Inadequately aducated workforce . . . . . . . . . . . . . . . . . 12.5Inefficient government bureaucracy. . . . . . . . . . . . . . . . 11.1Inflation. . . . . . . . . . . . . . . . . . . . . . . . . . . . . . . . . . . . . 10.4Poor work ethic in labor force . . . . . . . . . . . . . . . . . . . . 10.0Inadequate supply of infrastructure . . . . . . . . . . . . . . . . 6.8Access to financing. . . . . . . . . . . . . . . . . . . . . . . . . . . . 6.2Tax rates . . . . . . . . . . . . . . . . . . . . . . . . . . . . . . . . . . . . 6.1Poor public health . . . . . . . . . . . . . . . . . . . . . . . . . . . . . 4.8Foreign currency regulations . . . . . . . . . . . . . . . . . . . . . 4.3Corruption . . . . . . . . . . . . . . . . . . . . . . . . . . . . . . . . . . 3.5Insufficient capacity to innovate. . . . . . . . . . . . . . . . . . . 3.0Policy instability . . . . . . . . . . . . . . . . . . . . . . . . . . . . . . 2.9Government instability / coups . . . . . . . . . . . . . . . . . . . 1.9Complexity of tax regulations. . . . . . . . . . . . . . . . . . . . . 1.9Crime and theft . . . . . . . . . . . . . . . . . . . . . . . . . . . . . . . 1.7
0 5 10 15 20
Source : World Economic Forum ( 2015 ).
Figure 41 : Distance to frontier scores on Doing Business topics ( 2016 )
0 20
40 60
80
100
Starting a business
Dealing with Construction
Permits
Getting Electricity
Registering Property
Getting Credit Protecting Minority Investors
Paying Taxes
Trading Across Borders
Enforcing Contracts
Resolving Insolvency
Qatar GCC OECD high income
Source : World Bank Doing Business Reports ( 2016 ).Note : Score 0 centre, Score 100 outer edge.
12.– From : World Economic Forum ( 2015 ). The Global Competitiveness Report 2015–2016. Geneva. From the list of factors, respondents were asked to select the five most problematic for doing business in their country and to rank them between one ( most problematic ) and five. The score corresponds to the responses weighted according to their rankings.

41
Implication for the STDR :
• Non-hydrocarbon exports are rising over the past five years but the currently exported products face adverse world trends – the STDR will identify new potential sectors with high long term export growth potential.
• Low export product innovation and market diversification – the STDR to move away from traditional intensification strategies to new products and markets.
• Services are on the rise but yet limited to traditional types of services – the STDR should focus to consolidate the recent developments in the traditional services sector, notably in the transport and tourism industries, but also on diversifying towards higher value services.
• The incoming FDI is unequally distributed amongst the economic sectors – the STDR to target better distribution of FDI through adequate policy adjustments.
• The non-hydrocarbon products’ exporters are predominantly SMEs – the STDR should focus on SME development and strengthening, especially on stimulating entrepreneurial spirit and engaging into exports for non-exporting SMEs.
• Business environment has not been conducive for SMEs to de-velop – the STDR to increase its focus on business environment constraints.
[ DIVERSIFICATION EFFORTS ARE UNDER WAY BUTNOT YET TRANSLATING INTO CONCRETE RESULTSTRADE AND INVESTMENT ANALYSIS ]


43
[ A MULTITUDE OF NATIONAL AMBITIONS DEVELOPMENT AND TRADE POLICIES ]
A MULTITUDE OF NATIONAL AMBITIONS
DEVELOPMENT AND TRADE POLICIES
The ongoing national development plans provide a broad framework for economic and social policy, within which trade policy must fit. This section summarizes the current development orientations, the trade policy itself, and the var-ious trade and investment support institutions ( TISIs ) meant to operationalize those policies. These represent the players
and the guidelines for the design and implementation of the STDR. However, the STDR has also recommended changes to policies and institutions where necessary to improve the business environment and the support exporters receive from public institutions.
NATIONAL ORIENTATIONS AND PRIORITIES
Qatar possesses a strong policy framework that sets broad directions for the development of the country. This frame-work contains an important number of potential orienta-tions for the country, and is articulated around a vision and a national development plan which give the directions for development priorities.
In 2008, Qatar adopted the Qatar National Vision 2030. This development plan was elaborated by the General Secretariat for Development Planning. This document es-tablishes a diagnosis and sets a roadmap for Qatar’s fu-ture development. It rests on four pillars : human, social, economic and environmental development. The main goals are to transform from a resource-based economy to a knowledge-based one, become more environmentally sustainable, and attain diversification from hydrocarbon de-pendency. This vision was supported by shorter-term plans, including the National Development Strategy 2011-2016. The next plan for 2017–2021 is in currently under preparation.
The NDS is a plan that paves the way for the country’s long-term social and economic goals, concentrating on the eco-nomic, social, human and environmental development of Qatar. It identifies the direction around these four develop-ment pillars and promotes the idea of achieving identified goals. The main goal is to ensure the growth of the economy, social development and environmental conservation by lead-ing the country’s modernization while preserving its traditions.
The NDS stresses the need for delivery of new services for the population through public–private partnerships. The private sector’s input to Qatar’s economy is relatively small.
Very few private firms outside of the oil and gas sector pro-duce and compete in regional or global markets. QDB in re-cent years has re-oriented its services to serve a larger base of SMEs. ‘Qatar’s interest in public–private partnerships stems primarily from the planning, technical, implementation and operational expertise that private partners can offer and the beneficial impacts of this expertise on local capabilities and service quality’ ( Ibrahim and Harrigan, 2012 ).
The orientations under the vision and the NDS are shown in the following schematic.
Qatar National Vision 2030
National Development
Strategy
2011-2016
Transition to knowledge-
based economy
Development of new
sectors
Services developmentImport
substitution
SME development
throughQDB

44
[ STRATEGIC TRADE DEVELOPMENT ROADMAP FOR SME COMPETITIVENESS IN QATAR 2018-2022 ]
Under the QNV and the NDS, specific ministries have devel-oped sector-specific strategies. However, sector strategies are followed solely by the leading ministry and are not shared among public sector institutions nor publicized. This creates multiple ambitions and orientations which sometimes are not in line with each other. The only publi-cally available sector-specific policy frameworks are the fol-lowing : health, tourism and education.
The National Health Strategy 2011–2016 offers a pro-gramme of reform aligned to the QNV and that forms the health part of Qatar’s NDS. It defines objectives on how to
achieve the National Health Vision and presents changes to the health-care system through specific projects aligned to the goals of the QNV.
The Qatar National Tourism Sector Strategy 2030 is a long-term strategy that will support the development of the tourism industry in the State and offer economic, social, cul-tural and environmental benefits. The priority areas of Qatar tourism are culture, urban and MICE ( meetings, incentives, conferences and exhibitions ) tourism; but also sports, health and wellness, nature, education, sun and beach tourism.
Figure 42 : Projected total number of jobs in the tourism sector 2012–2030 ( in thousands of employees )
25 32
60
8092
127
0
50
100
150
2012 2015 2020 2022 2025 2030
Source : Qatar Tourism Authority ( 2014 ). Qatar National Tourism Sector Strategy 2030 – Sector Economic Impact Model; Booz and Company analysis.
Figure 43 : Projected tourist arrivals in Qatar 2012–2030 ( in millions )
1.21.6
2.9
3.8
4.7
7
0
1
2
3
4
5
6
7
8
2012 2015 2020 2022
11% annually
2025 2030
Source : Qatar Tourism Authority ( 2014 ). Qatar National Tourism Sector Strategy 2030 – Euromonitor, World Bank, WTTX, Qatar Tourism Authority, Booz and Company analysis.

45
[ A MULTITUDE OF NATIONAL AMBITIONS DEVELOPMENT AND TRADE POLICIES ]
The education and research sectors have also received specific attention by the Government in recent years due to their pivotal role in the transition to a knowledge-based economy. An Education and Training Sector Strategy 2011–2016 was developed in line with the NDS. Sheikh Hamad bin Khalifa Al Thani himself maintained that the future of the country depended on education. The Qatar Foundation for Education, Science and Community Development is one of the most ambitious institutions in the country. Led by Her Highness Sheikha Mozah, spouse of the Father Emir , it has been tasked with transitioning Qatar from a carbon econ-omy to a future-oriented, knowledge economy based on human potential. The idea is also to support the formation of a middle class with international education and profes-sional experience facilitating access to the labour market. Agreements have been made with prominent American and European universities that will build campuses in Doha and invest in the health and information technology industries. In 2000, Doha’s Education City was established, which hosts top high schools and universities, as well as Al Jazeera’s children’s television channel.
In November 2002, the Emir created the Supreme Education Council. The Council oversees the education system at all levels, from preschool to university level, and implements the reform programme ‘Education for a New Era’. Independent schools financed by the State have emerged in the years that followed the Council’s creation. These institutions are guided by new educational programmes in Arabic, English, mathematics and science ( Hasni, 2012 ).
In 2011, the World Innovation Summit for Education Prize for Education ( equivalent of the Nobel Prize ) was created in order to emphasize the crucial role of education in all societies; it is a reward of a gold medal and US $ 500,000 that is given during the annual World Innovation Summit for Education, the premier international platform dedicated to innovation and creative action in education.
The Qatar Science and Technology Park ( QSTP ) was es-tablished in 2004 and is an incubator of start-up technology businesses in such areas as life sciences, oil and chemi-cals, environment, electronics and software engineering. It attracts the interest of research centres and large corpora-tions such as oil companies ( Total, ExxonMobil ) and high tech companies ( EADS, Apple, Microsoft ).
TRADE POLICY OVERVIEW
Qatar has been a Member of the WTO since January 1996, as well as a member of the GCC, created in 1981. The GCC Economic Agreement was signed in 2001 with the aim of creating a Customs union, including a common external tar-iff; common Customs regulations and procedures; a single entry point; elimination of all tariff and non-tariff barriers; and national treatment provisions ( Article ( 1 ) of the GCC Economic Agreement ). This Economic Agreement incor-porates the establishment of a GCC Common Market and Economic and Monetary Union. According to the WTO :
intra-GCC trade has grown rapidly since the inception of the Customs union. As a whole, the GCC ranks eighth in total global trade flows, just behind the United Kingdom. Qatar ranks third among GCC countries in terms of trade, behind the Kingdom of Saudi Arabia and the UAE.
Additionally, Qatar allows free movement for GCC nationals. The first free trade agreement was signed with Singapore, covering ‘trade in goods and services, Government pro-curement, rules of origin, and Customs procedures among others’.
Membership in the Pan-Arab Free Trade Area,13 estab-lished in 1997, ‘provides the facilitation and development of inter-Arab trade in goods with a view to establishing a Pan-Arab trade area. Customs duties have been gradually
13.– Also known as the Greater Arab Free Trade Area.
reduced since 1997 with final elimination in 2009 of all ag-ricultural and industrial products’ ( WTO, 2014 ). It includes 18 members.14
Qatar is also a member of the Gas Exporting Countries Forum,15 created in 2001. It is an intergovernmental organi-zation of the world’s leading natural gas producers that to-gether control over 70 % of the world’s natural gas reserves. Its headquarters is situated in Doha.
Qatar gained membership in the League of Arab States ( created in 1945 ) in 1971. This multinational Arab organiza-tion aims to support the economic, political, cultural, na-tional and religious interests of its member states.
Qatar has signed 52 Bilateral Investment Treaties for FDI with multiple states. Of these treaties, 23 are in force. There are a further 13 regional investment agreements, aiming to develop the international trade and economic re-lationship between two states or entities : for instance, an Agreement for Trade, Economic, Investment and Technical Cooperation between the GCC and the United States; a Free Trade Agreement between the GCC and the European Free Trade Association states; an Agreement on Economic Cooperation between the GCC and India; etc.
14.– Algeria, Bahrain, Egypt, Iraq, Jordan, Kuwait, Lebanon, Libya, Morocco, Oman, the State of Palestine, Qatar, Saudi Arabia, Sudan, the Syrian Arab Republic, Tunisia, the UAE and Yemen.15.– Algeria, Bolivia, Egypt, Equatorial Guinea, Islamic Republic of Iran, Libya, Nigeria, Qatar, the Russian Federation, Trinidad and Tobago and Venezuela ( Bolivarian Republic of ).

46
[ STRATEGIC TRADE DEVELOPMENT ROADMAP FOR SME COMPETITIVENESS IN QATAR 2018-2022 ]
More than 20 investment-related instruments have been adopted by Qatar, including :
� The Organizat ion of the Petroleum Expor t ing Countries Fund Model Agreement ( 2001 )
� Doha Declaration ( 2001 ) � International Labour Organization Tripartite Declaration
on Multinational Enterprises ( 2006 ) � United Nations Guiding Principles on Business and
Human Rights ( 2011 ) � World Bank Investment Guidelines ( 1992 ).
Fifty-eight double taxation treaties were signed by Qatar with partner countries to eliminate double taxation in these countries.
Qatar benefits from a number of trade agreements, in particular signed through the GCC with several countries ( Singapore, India, Australia, the United States and the European Free Trade Association ). A number of agreements are under negotiation, completion of which would consid-erably facilitate trade transactions between the states : for instance, with European and Asian countries, some of which are important trading partners of Qatar. Therefore, there is still some way to go in improving some of Qatar’s trade poli-cies. On the other side of the equation, Qatari SMEs that are ready to export may not yet be aware of preferential treatment and advantages in partner states. This Roadmap will suggest several activities for capacity-building of SMEs.
REGIONAL INTEGRATION PERSPECTIVES
Of all the above-mentioned alliances and treaties signed, the GCC Economic Agreement succeeded at different de-grees in terms of trade integration, labour creation, capital mobility and set up of common standards. Not only geo-graphical proximity, but also similar economic resources, similar political systems, customs, traditions and languages are meant to achieve comprehensive integration between member states.16 While all GCC countries export oil, they also compete with each other. Further, several issues at administrative and political level remain unresolved, as a result of which the idea of unifying fiscal and monetary policies from which all six GCC countries could benefit is suspended.
An important step forward was taken when the GCC common market was launched in 2008, giving economic equality to firms and citizens across the region’s borders. This also removed obstacles between the movements of goods, capital and labour.17 However, the level of intra-GCC trade is low at less than 10 %, compared with intra-EU trade of 57 %. This can be explained by the fact that all GCC countries export oil and gas products outside their own region. Another constraint shared by member states is a weak private sector. The private sector in these countries does not have the boosting power towards innovation and the creation of competitive trends of the private sector in other countries.
16.– Khalid Shams Abdulqader ( 2015 ). GCC’s Economic Cooperation and Integration : Achievements and Hurdles. Aljazeera Centre for Studies, 31 March.17.– Hakimian, Hassan and Abdulaal, Abdulla ( 2015 )., GCC Economic Integration : Fiction or Reality? Policy Paper, March. Khamsoon.
According to the World Bank, the GCC is the most ad-vanced example of subregional integration in the MENA re-gion. However, it is more integrated with the rest of the world than within MENA itself. The MENA region covers a large and diverse territory but despite the same language and reli-gion, this region has diverse economic, human and financial characteristics. Compared with the GCC, which has a num-ber of decision-making institutions including the Supreme Council, Ministerial Council and Secretariat General that meet regularly, the MENA region has no institutional foun-dation to boost regional integration or trade liberalization between states, nor political collaboration.
Collaboration within the region may increase economic welfare and bring more political weight to the global arena from this region but successful economic integration re-quires policy changes, including structural reform and a specific institutional framework in each country of the region.
In the light of current GCC crisis, SMEs face a unique set of challenges. Therefore, SMEs should develop and adopt strategy, which will play an important role in the internationalization process. However, specific promotion and assistance will need to be provided to SMEs to encour-age intraregional trade. The STDR will aim to facilitate these exchanges.
47
[ A MULTITUDE OF NATIONAL AMBITIONS DEVELOPMENT AND TRADE POLICIES ]
INVESTMENT CLIMATE
Foreign investment represents an opportunity for Qatar to stimulate diversification and knowledge transfer. It could provide local companies with the role models they need to forge their business ideas and company cultures. The Government of Qatar understands this opportunity but re-mains careful in accepting foreign investment, with the view of protecting the still nascent and fragile local private sector. Favourable conditions are being set for some specific sec-tors but bottlenecks still exist that limit foreign investment.
A key factor influencing foreign investors’ decision to settle in Qatar is ownership conditions. Qatari companies must be 51 % Qatari-owned. An exception is that non-Qatari investors may own up to 100 % of shares in priority sectors, if it is permitted by the Ministry of Economy and Commerce ( MoEC ) or the Qatari Cabinet. These sectors include educa-tion, health, tourism, energy and mining, natural resource development, consultancy services, information technol-ogy, technical work services, cultural services, sport and entertainment services. Nevertheless, companies can only be 100 % foreign-owned if they are installed in the Qatar Financial Centre ( QFC ) or in a ‘free zone’.
QFC is a single onshore system that offers some free zone benefits and allows 100 % foreign ownership. It is focused on financial services and professional services that facilitate entry into the national market for industries including investment and private banking, asset manage-ment, reinsurance, consultancy, law and financial services recruitment.
Companies that operate within the QFC benefit from : � Being fully onshore and dealing in any currency � One hundred per cent foreign ownership permitted � Ten per cent corporation tax based on profits � No limits on repatriation of profits � Double taxation agreements with more than 35 coun-
tries.18
There are four Special Economic Zone ( SEZs ) projects in Qatar, managed by Manateq, which also can provide sev-eral ( tax-free ) benefits : Ras Laffan Industrial City, Mesaieed Industrial City, Dukhan Petroleum City, and Doha Industrial Area. All of them are focused on the manufacturing sector, mainly in oil and gas, and iron and steel industries. Three additional free zones are under construction – Zones One, Two and Three – but each of them will be also focused on manufacturing and related technologies development.
The only free zone established so far is the QSTP, created by the Qatar Foundation for Education, Science and Community Development in an attempt to promote
18.– Qatar Financial Centre ( 2015 ). Website. Available from http ://www.qfc.qa/.
investment in technologies and innovations, and to ease the market entry of technology research. This tax-free zone pro-vides facilities and services for private and public research and development. It focuses on companies and start-ups working on energy, the environment, health science, and information and communications technology.
Companies that operate within the QSTP qualify for follow-ing benefits :
� Operate as a local company, or operate as a branch of a foreign company
� One hundred per cent foreign ownership � Can hire expatriate employees � No taxes � Duty-free import of goods, services, equipment and tools
into the free zone � Unrestricted repatriation of capital and profits � Access to cheaper gas and electricity � More reliable modern facilities � Consultative services provided for start-ups and com-
panies.19
The Qatar Investment Authority ( QIA ) is a sovereign state wealth fund that specializes in public equity, start-ups, fixed income, private equity, real estate and alternative assets. It is focused on domestic equity and regional investments but is also mandated to invest internationally. In the domestic economy QIA plays an important role through its subsidi-aries and holdings in Qatar, contributes to human capital development, and improves the coordination of domestic non-natural-resource-related assets.
As a Member of the WTO, Qatar fully participates in interna-tional free trade. To attract foreign investors the State offers advantageous conditions :
� Tax exemptions on corporate tax � Customs duties up to 5 % � Low rates for gas, electricity and water � Nominal lease rates � No import duty on machinery and equipment for indus-
trial projects � Unlimited quantities of imported materials � No restrictions on money exchange and transfer of profits
abroad � Tax-free and Customs duty-free inside of free zones and
others.20
19.– Qatar Science and Technology Park ( 2014 ). Free Zone. Available from http ://www.qstp.org.qa/home/free-zone.20.– Qatar Ministry of Foreign Affairs ( 2013 ). Website. Available from http ://www.mofa.gov.qa/.
48
[ STRATEGIC TRADE DEVELOPMENT ROADMAP FOR SME COMPETITIVENESS IN QATAR 2018-2022 ]
A number of changes need to be made in order to improve the business environment in Qatar. Since 2012, a number of business reforms have been put in place, including :21
� Qatar made starting a business easier by combining commercial registration and registration with the Qatar Chamber of Commerce and Industry ( QCCI ) in a one-stop shop ( 2012 ).
� Qatar improved its credit information system by starting to distribute historical data and eliminating the minimum threshold for loans included in the database ( 2012 ).
� Qatar reduced the time to export and import by introduc-ing a new online portal allowing electronic submission of Customs declarations for clearance at the Doha seaport ( 2013 ).
� Qatar made paying taxes easier for companies by elimi-nating certain requirements associated with the corporate income tax return ( 2014 ).
� Qatar reduced the time for border compliance for import-ing by reducing the number of days of free storage at the port and thus the time required for port handling ( 2016 ).
More changes need to be made, particularly in the areas where Qatar ranks low in the World Bank Doing Business rankings : for instance, facilitating getting electricity, protect-ing minority shareholder investors and enforcing contracts, among others.
However, beyond creating a favourable business environ-ment, the Government of Qatar must broadcast the ad-vantages of doing business in Qatar to those companies considering international expansion. Some companies will invest without any Government information or assistance; some will not invest under any circumstances; and some are in between those two extremes, where they might be per-suaded to choose Qatar over other locations in the region if the right information and assistance is provided to them at the right time.
21.– World Bank Group ( 2016 ). Ease of Doing Business in Qatar. Available from http ://www.doingbusiness.org /data/exploreeconomies/qatar/.
Identifying investors in this last group, securing meetings with them, and persuasively making the case for one’s coun-try in the region over others is known as investor targeting, and it is arguably the most difficult function for the typical investment promoter to perform. One of the main reasons for this is the difficulty in identifying investors with high po-tential. Before each investor is approached, the investment promoter should take the time to ‘qualify’ the investor. This means researching the company to see that its products and markets correspond to Qatar’s strengths and that it is at a strategic and financial point where international expan-sion is likely. In this regard, the STDR will not only focus on improvement of the business environment but also re-inforcement of the capacity of investment promoters within institutions.
Implication for the STDR :
• Lead public institutions develop internal policies in isolation – the STDR should focus on developing consulted and open policies that foster inter-institutional and public-private coordination.
• Large number of preferential agreements in place – the STDR to focus on sensitization of non-exporting and exporting SMEs on preferential market access possibilities.
• Intra-regional GCC trade remains limited – the STDR to prioritize regional trade in sectors that represent high potential.
• FDI entry policies are not fully transparent and vary between dif-ferent economic sectors preventing diversification and knowledge inflow – the STDR to propose specific adjustment to investment policies and to increase promotion of Qatar as a destination for FDI in the GCC region.
49
[ THE TRADE SUPPORT NETWORK FAILS TO CATCH UP WITH A RAPIDLY GROWING ECONOMY ]
THE TRADE SUPPORT NETWORK FAILS TO CATCH UP WITH
A RAPIDLY GROWING ECONOMY
THE TRADE AND INVESTMENT SUPPORT INSTITUTION STRUCTURE
TISIs play a crucial role in building trade competitiveness. They support the implementation of development plans and strategies. A strong, comprehensive institutional framework is important to achieve strategic goals and to develop a vi-sion of trade development roadmaps. The institutional sup-port provided by TISIs constitutes the trade support network in the country. There are three types of TISIs in Qatar.
The policy support network represents ministries and authorities that are responsible for policy development and implementation in the country.
MoEC provides policy guidance and services related to business and trade development, monitors commercial and business activity, supports and develops exports, secures competitiveness, and works to facilitate the trade environ-ment and protect the consumer. In addition to its role and ef-forts to encourage domestic investment and attract Foreign Direct Investments (FDIs).
The Ministry of Foreign Affairs intensifies international coop-eration and development efforts in diverse fields, and assists with the planning and implementation of foreign policy.
The Supreme Council for Economic Affairs and Investment determines and approves policies that en-hance private sector development and increase its con-tribution to the national economy; encourages national investment and FDI; surveys global financial adjustment and assesses the potential impact on the national econ-omy; and supports trade and economic cooperation lo-cally and internationally.
MoDPS is responsible for the preparation of national de-velopment strategies and policies, and their implementa-tion and follow-up. It is also in charge of leading statistical research and publishing statistical data.
The Ministry of Finance ( MoF ) is responsible for the prepara-tion and implementation of the State budget, collection of public revenues ( taxes and fees ), and enhancing coopera-tion and coordination with other authorities in the prepara-tion of plans for economic and social development.
The General Authority of Customs provides Customs services by developing a control system on the border, implementing laws and regulations, issuing permits and licences, fighting smuggling, etc.
The Ministry of Municipality and Environment ( MoME ) is tasked with implementation of initiatives related to environ-mental and municipal affairs.
The Ministry of Energy and Industry ( MoEI ) is responsible for planning and controlling the realization of strategies in oil, gas and relevant industries.
The Qatar Tourism Authority ( QTA ) is in charge of all as-pects of the tourism industry related to product develop-ment, destination marketing and promotion of different types of tourism abroad and in Qatar. It develops, regulates and promotes tourism internally and externally; supervises all as-pects of tourism activities; and works to reveal the features of civilization, culture, heritage and tourism characteristics of the State.
The Ministry of Transport and Communications, created by fusing the Ministry of Information and Communications Technology with the Ministry of Transport, is responsible for developing transport services and communication; inno-vative technologies; and information and communication technology plans, policies and initiatives in Qatar.

50
[ STRATEGIC TRADE DEVELOPMENT ROADMAP FOR SME COMPETITIVENESS IN QATAR 2018-2022 ]
The Ministry of Administrative Development, Labour and Social Affairs ( MoADLSA ) is tasked with managing the la-bour market; developing policies; planning the employment of manpower; providing social welfare, security and assis-tance services; and developing and implementing social development programmes.
The Ministry of Culture and Sport administers sport devel-opment and related initiatives as well as development pro-grammes for youth.
The trade support network provides a wide range of trade-related services to the public and private sectors.
QCCI facilitates economic development and stimulates commercial, industrial and agricultural interests to support the development of a modern international trade system and ease international investment.
QDB, a Government-owned financial entity, serves to invest and develop local industries by supporting SMEs; by as-sisting with access to new markets through export promo-tion, development and financing; and by providing financing solutions and value added services through direct/indirect financing and advisory services. Within QDB, Tasdeer is a subdivision tasked with export development and promotion ( organizing training workshops, market studies, export/import links and developing exporters’ directories, exhibitions, etc. )
The QIA is an investment institution ( sovereign wealth fund ) specializing in domestic and foreign investment. It supports the development of economic diversification.
The Qatari Businessmen Association supports the devel-opment of the business environment through a number of activities such as business consulting, organization of business development meetings, creation of regional and international alliances to boost the Association’s activities, and providing technological services ( designing, expanding and enhancing the electronic website for the Association ).
The Qatari Business Women Association is a platform that aims to empower Qatari businesswomen; strengthen co-operation, trading and economic interrelations; develop training programmes; and encourage Qatari women to ef-fectively contribute to the establishment of small-scale busi-ness and artisan activities.
The Qatar Business Incubation Centre ( QBIC ) encourages entrepreneurs to develop their companies through business incubation programmes and services, providing coaching and consultative services.
The Qatar Central Bank ( QCB ) is a regulatory financial insti-tution whose purpose is to develop and support the national
economy in cooperation and coordination with the relevant ministries and Government authorities.
The Credit Bureau provides reliable and accurate credit in-formation to enable relevant authorities to make the right credit decisions.
The business services network comprises representa-tives of commercial services providers assisting with trade transactions.
The Qatar Financial Centre Regulatory Authority ( QFCRA ) is the independent regulator of the QFC, with an assignment to regulate companies and individuals running financial services in or from the QFC. Its objectives are to maintain financial stability and avoid systemic risk through efficiency, transparency and integrity in the QFC.
Future Gate Business Services provides services to new or existing companies, including commercial registration, legal consultation, document attesting, embassy and immigration services.
TMF Group Qatar is a global business operator that pro-vides all kinds of business services from management ac-counting and corporate governance to tax compliance and value added tax services.
The QSTP – part of the Qatar Foundation Research and Development – is a technology development incubator that supports innovation and entrepreneurship and accelerates research commercialization. It covers a range of services from provision of capital for start-up technology companies and comfortable facilities to coaching and mentoring for new firms and others.
Nama is a non-profit, social and development or-ganization under the Qatar Foundation for Education, Science and Community Development that offers ex-tensive services including career training programmes.
Silatech is an international social initiative that con-nects young people and expands their oppor-tun i t ies fo r employment, ente rpr ise and c i v ic engagement by engaging in knowledge transfer and en-hancing networks, investment and technology in the region.
Roudha Centre for Entrepreneurship and Innovation is an entrepreneurship initiative that provides innovative pro-grammes and advocacy efforts targeting youth and Qatari women.
Qatar Leadership Centre is a national platform to support leadership excellence in support of the development goals of the State of Qatar by creating knowledge for the QNV four pillars development goals.

51
[ THE TRADE SUPPORT NETWORK FAILS TO CATCH UP WITH A RAPIDLY GROWING ECONOMY ]
Qatar Skills Academy offers a range of internationally recog-nized programmes and courses to develop career pathways leading to university degrees.
INJAZ Qatar is a member of the international organization Junior Achievement Worldwide that aims to educate stu-dents about entrepreneurship, financial literacy and work-force readiness through programmes for students from Grade 7 to university level.
ANALYSIS OF TRADE SUPPORT NETWORK EFFECTIVENESS
A number of key institutions listed above play a critical role in the development of the private sector. Some of them provide a wide range of services for SMEs including information, training and coaching, advisory, funding, technical skills and capability development. In some cases services provided by entities are similar and there is no single management framework that provides direction for the coherent devel-opment of the services that are needed for private sector development.
Lack of collaboration and interaction between ministries and Government entities
Institutions provide a diversity of services to enterprises, but every ministry has its own mandate and often they have conflicting priorities. New projects are launched in a hurry without looking for input from other entities who work on related matters and could make a significant contribution to increasing the quality of a project and its outcome. However, several ministries are linked with others for specific pro-jects : for example, the General Authority of Customs works in collaboration with MoME and the Supreme Council for Health in order to get their approval for certain products; and MoME cooperates with the Supreme Council of Health and Supreme Education Council.
Weak relationship between industry and education
It is clear that some critical linkages are missing. There is not a single curriculum on entrepreneurship developed in Qatar and there is a gap between education and required work skills. For instance, there is a high demand for quali-fied highly skilled technicians, managers and profession-als, but there is a limited number of study programmes to fulfil these needs. University programmes are not directly aligned to market demand and cannot provide knowledge and develop skills for these professions. Meanwhile there is no vocational training and young professionals are miss-ing technical skills, training and experience when they start work. QDB is currently working in partnership with universi-ties to develop entrepreneurship curricula and will subsidize the cost of them but is the only entity doing so.
Lack of coordination for services and their duplication
A higher level of trust between stakeholders can provide sustainable and faster development of the private sector. Collaboration, networking and interaction between different entities have not been developed and each institution tries to diversify the services provided for enterprises by itself. Organizations do not share information between themselves and often their services are similar. Survey results indicated that, in terms of governmental entities, the only example of successful stakeholder collaboration is the Qatari e-Govern-ment initiative that delivers electronic and integrated public services through an interlinked Government agencies portal, which facilitates interactions between citizens, business and Government.

52
[ STRATEGIC TRADE DEVELOPMENT ROADMAP FOR SME COMPETITIVENESS IN QATAR 2018-2022 ]
Information flow between entities and towards the private sector is not consistent
There is no single, unified communication and information-sharing portal about services provided by different entities for SMEs, which would gather all the latest relevant infor-mation about services and opportunities for private sector
development. For instance, QDB offers the most services for SME development. It has a site that gives information about each of its services and some links to other sites, but for other services information has to be found on various individual sites.
Implication for the STDR :
• Large variety of TISIs and services provided to SMEs, in disconnect with private sector – the STDR to support the SME Development
Partners’ Network initiative and to incorporate public-private dia-logue mechanisms to ensure constant channelling of information.
53
[ THE TRADE SUPPORT NETWORK FAILS TO CATCH UP WITH A RAPIDLY GROWING ECONOMY ]


55
[ THE WAY FORWARD ]
THE WAY FORWARD
Qatar has experienced outstanding economic growth over the past two decades, relying on the exploration and pro-duction of hydrocarbons as the main source of exports and fiscal revenues. Recent steep falls in oil prices have con-tributed to the realization that the economy is vulnerable to volatility in the global hydrocarbons market and the even stronger need for diversification. Qatar has taken steps to anticipate the transition to a knowledge-based economy but at present export diversification remains limited.
Stimulating the growth of the SME sector will be vital to spearhead the long-awaited diversification but constraints need to be addressed on multiple fronts. SMEs represent the seeds for diversification as they correspond to the entire-ty of the non-oil-and-gas economic sectors today. However, it will be important to prioritize support to the areas which have the most potential for success. It will also be important to resolve the current bottlenecks that prevent their develop-ment. A lot of these bottlenecks are related to the nascent nature of the SME sector in Qatar, such as the lack of entre-preneurial spirit, the misalignment of the business environ-ment with the needs of SMEs and the lack of incentive to
export. Others are rather structural, such as the coexistence of comfortable public sector employment with still relatively precarious entrepreneurship.
Considering the pressing need to unlock the potential of SMEs and to operationalize the economic transition, this STDR aims to provide practical orientations around a dual objective. First it gives a set of concrete, realistic and measurable initiatives to improve the SME ecosystem and facilitate firms’ operations at the national level, answering the current constraints. Second, it prioritizes specific sec-tors of the economy which represent particular potential and that have been selected through a set of commonly agreed criteria. These criteria encompass quantitative factors such as export potential and existing demand, and key qualitative aspects such as the possibility for the sector to substitute imports and integrate local value chains, as well as societal and environmental benefits. Priority sectors represent inher-ent success potential for SMEs willing to engage in them, as they offer a unique proposition of Qatar vis-à-vis its peers and they foster innovation and a highly skilled economy.
The orientations of the STDR can be summarized as follows:
56
[ STRATEGIC TRADE DEVELOPMENT ROADMAP FOR SME COMPETITIVENESS IN QATAR 2018-2022 ]
THE VISION AND STRATEGIC OBJECTIVES
The following is a delineation of the proposed vision and strategic approach in this direction, agreed with all national trade stakeholders in Qatar.
«Enabling environment for diversified value added products and services to the world»
The vision set up for the STDR is delineated in four strate-gic objectives built around the key areas where action is re-quired over the following five years.
Strategic objective 1 : Stimulate entrepreneurial mindset and skills in QatarThe recent nature of private sector activity and entrepre-neurship in Qatar has not allowed the country to have a well-established entrepreneurial spirit, nor to develop bu-siness management skills. To ensure that the private sector is sufficiently dynamic to serve as an engine for diversifica-tion, it is therefore necessary to stimulate entrepreneurship through targeted efforts. Thus the first strategic objective is focused on this area and is delineated through the following operational objectives.
1.1. Develop a nationwide SME competition programme.1.2. Establish a ‘public to private’ transition scheme.1.3. Build capacities of SMEs in entrepreneurship skills
and soft skills.1.4. Increase HR management capacities of firms and
in-house capacity-building.1.5. Improve the capacities of firms to select appropriate
technologies.1.6. Reinforce and reorient incubators and excellency
centres in upcoming SEZs.
Strategic objective 2 : Improve operating conditions for enterprisesUnblocking the business environment for firms’ operations will be another key area of focus as it is currently one of the major bottlenecks for SME development. Putting in place stronger institutional coordination will be the first require-ment, through the current initiative of the SME Development Partners Network ( SDPN ). In addition, financial services, regulations and quality management infrastructure will need to be adjusted to the actual needs of SMEs. Sector-specific policies will further need to be developed to target support in priority sectors. This translates to the following opera-tional objectives.
2.1. Develop a well-coordinated private sector institu-tional support framework.
2.2. Facilitate access to supporting services for SMEs.2.3. Widespread SME-specific assistance provided by
financial institutions.2.4. Facilitate workforce regulations and management
systems.2.5. Pursue the modernization of regulations to respond
to the needs of the private sector.2.6. Develop a clear and accessible quality manage-
ment system.2.7. Multiply sector-specific policies and analyses.
Strategic objective 3 : Open the country to foreign investment to inspire diversificationFDI is much needed in Qatar as a vehicle of innovation and diversification. It also has an inspirational value for local en-terprises. Entrepreneurship being a fairly new endeavour, SMEs are in search of models to relate to. Foreign firms are also a stimulating factor as they push firms to improve their performance through higher competition in the country. In order to attract this much-needed FDI in new areas of the economy, the conditions for FDI must be further facilitated. Foreign investors also need to be better integrated into local structures and connected with local firms. In order to achieve this, the following operational objectives are outlined.
3.1. Adjust investment attraction policies to focus on priority areas.
3.2. Build capacities of institutions to attract key inves-tors to the country.
3.3. Develop cooperation frameworks between local SMEs and foreign investors.
Strategic objective 4 : Encourage firms to expor t through acquired market intelligenceCurrently, very few SMEs have the courage to engage in exports. Exporting requires a very specific set of skills which are currently lacking. It also leads to a confrontation with unknown environments. Currently Tasdeer is tasked with improving these specific skills within exporting companies. This strategic objective is therefore oriented to reinforcing the capacity of Tasdeer to deliver its services and to im-prove the capacity of QTA to develop a national branding that could be used for Qatari products. The following op-erational objectives will lead to this outcome.
4.1. Enhance institutional capacity to support enterprises to export.
4.2. Develop a nationwide branding initiative.
57
[ PRIORITY SECTORS FOR THE ECONOMY ]
PRIORITY SECTORS FOR THE ECONOMY
An STDR aims to address these constraints and opportuni-ties to achieve maximum export impact in the country. Given that resources for export development are limited, an STDR cannot target all the economic sectors of the country, thus requiring the setting of priorities. Defining priority sectors
permits the relevant and realistic allocation of resources for export development; the STDR will be targeted rather than being a wish list. Moreover, priorities contribute to creating focus and achieving tangible results.
DEFINING A SECTOR FROM THE STDR PERSPECTIVE
Based on the value chain approach, a sector may be con-sidered as a product, cluster or family of products that share common production, supply, marketing and consumption patterns. The broad nature of this definition is intentional and necessary, reflecting the specific context prevailing in any given country, i.e. whether a sector denotes a product,
a subset of a family of products or a cluster of products depends on a variety of factors both endogenous ( includ-ing maturity, linkages with other sectors, etc. ) and exog-enous ( world demand, trends and forecasts, etc. ). These have been elaborated in detail below and reflect the criteria based on which STDR priority sectors have been selected.
SELECTION CRITERIA
In answering the question ‘What are important criteria to consider when selecting priority sectors?’, a number of pa-rameters – both quantitative and qualitative – were discussed and agreed upon at the first stakeholders’ consultation held in Doha on 20 and 21 April 2016. These criteria were then weighted according to their level of relevance, ( from one to three, where three indicates high relevance ). These param-eters are detailed below.
Export performance
This parameter reflects the current export performance of the sector considered, looking primarily at export growth trends. Trade Map intelligence provides a range of informa-tion in this regard, including latest export figures, growth trends per sector, trade balance, global market share, dis-tance from target markets, level of competition in target market, etc.
Demand
This criterion identifies those products with the highest ex-port potential for a partner market/region, as well as the
overall world market. This parameter is of utmost importance as the approach for priority sector selection is market-led.
Potential for locally integrated value chain
Prevailing cost structures – including unit labour, produc-tion, technology and equipment costs, as well as costs in-volved in procuring support infrastructure such as electricity and water – affect the overall competitiveness of a sector. Upstream and downstream linkages with other sectors are also important. In addition one of the key goals for the coun-try is to alleviate the negative non-hydrocarbon trade bal-ance which is why favouring sectors that enable localization will be key.
Societal benefit
As per the Organisation for Economic Co-operation and Development definition, ‘social benefits are current transfers received by households intended to provide for the needs that arise from certain events or circumstances, for example, sickness, unemployment, retirement, housing, education or family circumstances.’

58
[ STRATEGIC TRADE DEVELOPMENT ROADMAP FOR SME COMPETITIVENESS IN QATAR 2018-2022 ]
Environmental friendliness
This parameter measures the impact on the environment of a particular sector, taking into consideration factors such as air and water pollution, level of greenhouse gas emis-sions, energy consumption, use of renewable and/or green technologies, environmental sustainability of the sector’s activities, etc.
Self-sustainability
This criterion measures the degree to which the sector can sustain itself without external support and, most importantly, its capacity to achieve long-lasting successful economic performance.
High tech / high skill
This measures the degree of sophistication of the goods or services produced by a sector and the level of knowl-edge, skills and competencies required. This criterion is of particular importance given the Government’s objective of
developing a knowledge-based economy with a progressive rotation of employment from low-productivity sectors into higher-productivity ones.
Innovation potential
There is a need to generate innovations that can be applied to expand the range of products and services produced. In this regard, the parameter assesses the potential of a sector to move up the value chain and its capacity to achieve the production of innovative, higher value added products, no-tably through R&D activities. This is particularly relevant for those sectors that could be plugged into global value chains.
SME development potential
Since SMEs are among the key beneficiaries of the STDR, it is of utmost importance to take into consideration the likeli-hood of Qatari MSMEs to engage in a given sector. This parameter notably measures the ability of MSMEs to benefit from opportunities for participation in local and, in the longer term, global value chains.
LIST OF PRIORITY SECTORS
The following sectors have been identified as STDR priority sectors :
• Renewable energies• Insurance services• Agro-industry ( vegetables and fruits, fresh and processed )• Petrochemicals• Leisure and entertainment tourism• Business tourism ( MICE )
Renewable energies
Renewable energy is generally defined as energy that is col-lected from resources which are naturally replenished on a human timescale, such as sunlight, wind, rain, tides, waves and geothermal heat. Accordingly, the main technologies include wind power, hydropower, solar energy, geothermal energy and biofuels.
The development of renewable energies in Qatar is very much in line with the Government’s efforts to progres-sively move from ‘an economy based on non-renewable resource inputs to one in which productivity growth and
eventually innovation underpin prosperity’.22 Indeed, with the Government recognizing in its QNV that ‘the rights of future generations would be threatened if the depletion of non-renewable resources were not compensated by the crea-tion of new sources of renewable wealth’, seeking alternative sources of energy appears to be a priority to enhance the future energy mix of the country while ensuring the long-term sustainability of economic growth. Renewable energies also present opportunities for Qatar to reduce carbon emissions, the country being by far the largest polluter in the world in terms of CO2 emissions per capita with an estimated 44.0 tons per capita.
22.– Qatar General Secretariat for Development Planning ( 2011 ). Qatar National Development Strategy 2011–2016, pp.11–12.

59
[ PRIORITY SECTORS FOR THE ECONOMY ]
As highlighted in the Qatar NDS, the greatest potential for renewable energies lies in solar energy, even if ‘other technologies may play a part depending on still-evolving technological and economic parameters’.23 Supported by significant investments, developing state of the art renew-able energy technologies could also give Qatari industries a significant economic advantage given the booming inter-national demand for these technologies. However, as the sector is in an infant stage of development, concerted effort in the form of institutional support, sector development and market intelligence will be required to be able to reach a relatively high degree of maturity and sophistication.
The sector currently faces the following key constraints : � Renewable energy is very much in its infancy in Qatar
and has not been considered a priority so far given the country’s healthy feedstocks;
� There is no renewable energy legislation in place in Qatar and no renewable energy target or vision for the sector;
� Absence of a high-profile champion of renewable energy that could help boost the sector;
� Currently there is a lack of storage capacity for electricity coming from the renewable energy sector.
23.– Ibid., p. 85.
Tourism : leisure and entertainment tourism, and business tourism
As indicated in a recent document published by the World Tourism Organization, the prospects for international tourism in the Middle East are promising, as international tourist ar-rivals in the region are estimated to have grown by 3 million in 2014 to reach 51 million, showing signs of recovery after three difficult years. In relative terms, the Middle East was the fastest-growing region with a 6 % increase in receipts that year, capturing 5 % of worldwide arrivals and 4 % in receipts.
In Qatar significant developments have recently been observed in the tourism sector as a whole as international tourist arrivals dramatically increased from 2009 onwards to reach 2.8 million in 2014. Such growth was confirmed by the trend in spending as international tourism receipts have grown at an impressive CAGR of 67.5 % over the pe-riod 2010–2014, from US $ 583.5 million in 2010 to US $ 4.6 billion in 2014 ( see figure 44 ). That year, the share of travel activities – i.e. all the diverse services consumed by tour-ists visiting the country excluding international carriage expenses – in Qatar’s total commercial services exports represented 35.9 % in 2014, second only to the transporta-tion industry ( 50.3 % ).
The future orientation for the sector is to be geared to-wards diversification of tourism offerings as confirmed by the Qatar National Tourism Sector Strategy 2030 launched in 2014 by the QTA. Of the several prospects that have been explored during the first stakeholders’ consultation, two sub-sectors have been identified as priorities, namely leisure and entertainment tourism, and business tourism.
Figure 44 : Travel exports from Qatar, 2005–2014 ( US $ millions )
760 874
28 145 179 584
1.170
2.857
3.456
4.591
0
1.000
2.000
3.000
4.000
5.000
2005 2006 2007 2008 2009 2010 2011 2012 2013 2014
US$
mill
ions
Sources : ITC, UNCTAD, WTO joint dataset.
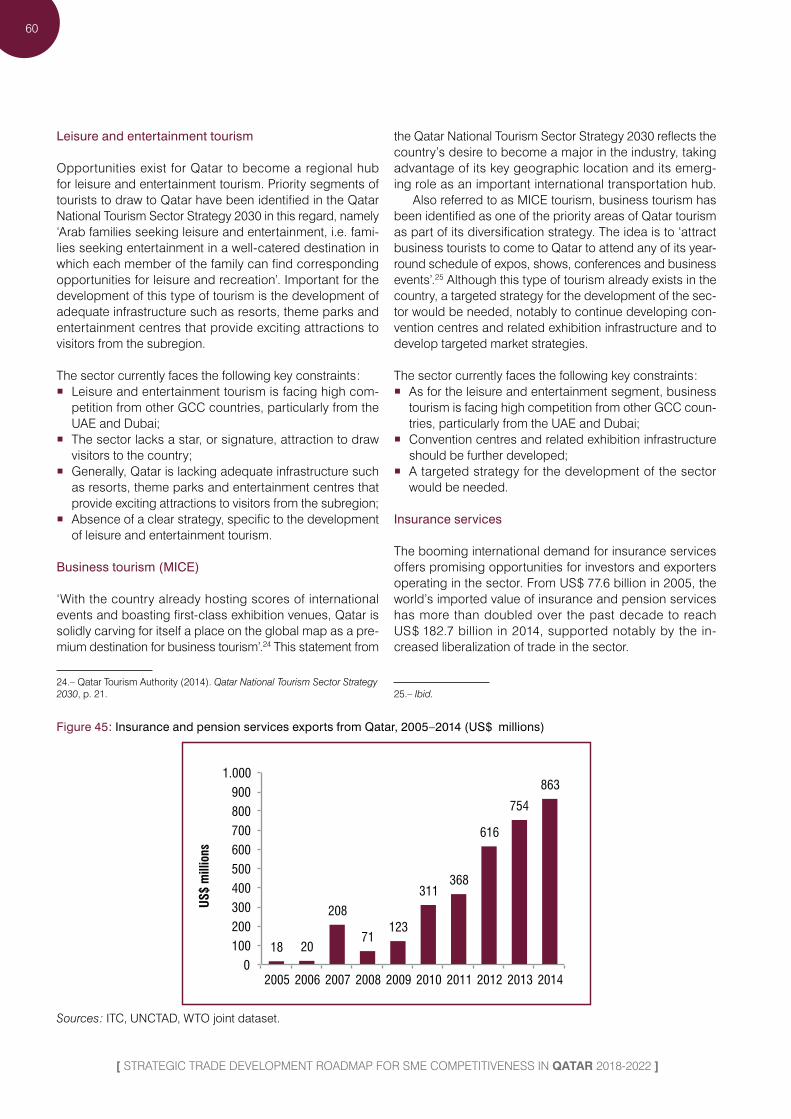
60
[ STRATEGIC TRADE DEVELOPMENT ROADMAP FOR SME COMPETITIVENESS IN QATAR 2018-2022 ]
Leisure and entertainment tourism
Opportunities exist for Qatar to become a regional hub for leisure and entertainment tourism. Priority segments of tourists to draw to Qatar have been identified in the Qatar National Tourism Sector Strategy 2030 in this regard, namely ‘Arab families seeking leisure and entertainment, i.e. fami-lies seeking entertainment in a well-catered destination in which each member of the family can find corresponding opportunities for leisure and recreation’. Important for the development of this type of tourism is the development of adequate infrastructure such as resorts, theme parks and entertainment centres that provide exciting attractions to visitors from the subregion.
The sector currently faces the following key constraints : � Leisure and entertainment tourism is facing high com-
petition from other GCC countries, particularly from the UAE and Dubai;
� The sector lacks a star, or signature, attraction to draw visitors to the country;
� Generally, Qatar is lacking adequate infrastructure such as resorts, theme parks and entertainment centres that provide exciting attractions to visitors from the subregion;
� Absence of a clear strategy, specific to the development of leisure and entertainment tourism.
Business tourism ( MICE )
‘With the country already hosting scores of international events and boasting first-class exhibition venues, Qatar is solidly carving for itself a place on the global map as a pre-mium destination for business tourism’.24 This statement from
24.– Qatar Tourism Authority ( 2014 ). Qatar National Tourism Sector Strategy 2030, p. 21.
the Qatar National Tourism Sector Strategy 2030 reflects the country’s desire to become a major in the industry, taking advantage of its key geographic location and its emerg-ing role as an important international transportation hub.
Also referred to as MICE tourism, business tourism has been identified as one of the priority areas of Qatar tourism as part of its diversification strategy. The idea is to ‘attract business tourists to come to Qatar to attend any of its year-round schedule of expos, shows, conferences and business events’.25 Although this type of tourism already exists in the country, a targeted strategy for the development of the sec-tor would be needed, notably to continue developing con-vention centres and related exhibition infrastructure and to develop targeted market strategies.
The sector currently faces the following key constraints : � As for the leisure and entertainment segment, business
tourism is facing high competition from other GCC coun-tries, particularly from the UAE and Dubai;
� Convention centres and related exhibition infrastructure should be further developed;
� A targeted strategy for the development of the sector would be needed.
Insurance services
The booming international demand for insurance services offers promising opportunities for investors and exporters operating in the sector. From US $ 77.6 billion in 2005, the world’s imported value of insurance and pension services has more than doubled over the past decade to reach US $ 182.7 billion in 2014, supported notably by the in-creased liberalization of trade in the sector.
25.– Ibid.
Figure 45 : Insurance and pension services exports from Qatar, 2005–2014 ( US $ millions )
18 20
208
71 123
311 368
616
754
863
0
100
200
300
400
500
600
700
800
900
1.000
2005 2006 2007 2008 2009 2010 2011 2012 2013 2014
US$
mill
ions
Sources : ITC, UNCTAD, WTO joint dataset.

61
[ PRIORITY SECTORS FOR THE ECONOMY ]
Though from a very low base, exports of these services from Qatar have steadily increased since 2008, expanding at a strong CAGR of more than 50 % over the period 2008–2014, from US $ 71 million worth of insurance services exported in 2009 to US $ 863 million in 2014 ( see figure 45 ). Although the sector is still in its infant stage, it has emerged as the third commercial services industry in Qatar, accounting for rough-ly 7 % of the country’s total commercial services exports.
While prospects are promising, significant efforts will have to be made to allow insurance services to capitalize on opportunities and integrate higher up in global value chains.
The sector currently faces the following key constraints : � Engineering and energy are the main lines that have
experienced rapid growth and also carry the highest underwriting risk, particularly in terms of loss severity ( Moody’s );26
� Insurance services being relatively new, a specific regula-tory framework would be needed to regulate the activities of the sector.
Agro-industry ( vegetables and fruits, fresh and processed )
According to the Qatar NDS, agriculture accounts for a mere 4 % of available land in Qatar and it is estimated that only 15 % of the country’s food is supplied domestically. Very small quantities of fruits and vegetables are being traded, consisting primarily of fresh plantains, pineapples, dates and mushrooms.
The major challenge faced by the agricultural sector in Qatar is water overconsumption, mainly due to excessive cultivation of water-intensive crops and inadequate irrigation methods, notably flooding fields. Changing water consump-tion patterns in agriculture is vital, requiring a fundamental and prolonged reorientation of farming practices.27 In line with the Government commitment to finding solutions within a ‘wider programme of agricultural reform and the develop-ment of an agro-food industry’, it is believed that significant opportunities exist to modernize the agricultural sector in Qatar, namely by developing modern and innovative agri-cultural solutions such as organic cultivation; automatic drip irrigation systems; and hydroponic ( a method of growing plants using mineral nutrient solutions, in water, without soil ) and aeroponic ( a process of growing plants in an air or mist environment without the use of soil or an aggregate me-dium ) techniques. More widespread use of greenhouses should also be promoted.
Developing an agricultural sector that is well adapted to the specific conditions in Qatar will allow the country to improve
26.– Moody’s Investors Service ( 2015 ). Moody’s : Qatar is the fastest growing GCC insurance market and is likely to continue its rapid growth, 4 March. Available from https ://www.moodys.com/research/Moodys-Qatar-is-the-fastest-growing-GCC-insurance-market-and--PR_319679.27.– Qatar General Secretariat for Development Planning ( 2011 ). Qatar National Development Strategy 2011–2016, p.10.
the productivity of its agriculture, reduce its dependency to food product imports and emerge as a trade partner for vegetables and fruits, fresh and processed, notably in the region. This strategy will be part of the wider Qatar NDS that aims at formulating, over the longer term, solutions to agricultural water issues ‘in a wider framework of the com-mercialization of sustainable farming methods and domestic agro-food products’.
The sector currently faces the following key constraints : � Low agricultural yields, partly because of farming meth-
ods that are outdated or badly matched to local con-ditions. The low use of fertilizers and modern farm machinery notably reduces the sector’s efficiency.
� The sector’s output is extremely limited as it is estimated that only 15 % of the country’s food is supplied domesti-cally.
� Unsustainable farming methods causing enormous irriga-tion losses : aquifer water is largely wasted through open field irrigation methods for crops of low value. Treated water supplies are also completely unused.
� Inappropriate pricing mechanism : currently a fixed maxi-mum price is applied to local produce in order to protect consumers, which does not allow producers to have a sufficient profit margin.
� Inadequate mix of crops : excessive cultivation of water-intensive crops that are not adapted to local conditions.
� Agriculture makes heavy demands on water, dispropor-tionate to the value created by the sector.
� Land scarcity ( agriculture accounts for 4 % of available land ).
Petrochemicals
Petrochemicals, also called petroleum distillates, are chemical products derived from petroleum or natural gas. Petrochemicals are used to produce a wide variety of materials, such as plastics, explosives, fertilizers and synthetic fibres. In Qatar, key petrochemical products include polymers of ethylene in primary forms, used in plastics; and inorganic chemicals, including hydrogen and rare gases and ammonia, used to make the fertilizer urea. Significant quantities of chemical fertilizers are also produced in Qatar. Supported notably by the supply of cheap hydrocarbon feedstock and energy, the downstream petrochemical industry has reported rapid expansion in recent years, boosting the growth of the broader manufacturing sector. In terms of international trade, these products, i.e. plastics and articles thereof, fertilizers and inorganic chemicals, represent a significant share of Qatar’s non-hydrocarbon exports, accounting for 3.7 %, 2.2 % and 1.3 % of the country’s total exports in 2015, respectively ( see figure 46 ).

62
[ STRATEGIC TRADE DEVELOPMENT ROADMAP FOR SME COMPETITIVENESS IN QATAR 2018-2022 ]
Figure 46 : Exports of petrochemicals, Qatar, 2006–2015 ( US $ billions )
0
2
4
6
2006
20
07
2008
20
09
2010
20
11
2012
20
13
2014
20
15
US$
billi
ons
Plastics and articles thereof Fertilizers
Inorganic chemicals
Source : ITC calculations based on MoDPS and United Nations Comtrade statistics.
Exploiting Qatar’s rich hydrocarbon endowment and build-ing on the technical know-how in the area, efforts should be made to further develop and strengthen the petrochemical industry. This should be done by developing new, innova-tive products such as biodegradable plastics, with a view to giving Qatar a competitive advantage while being fully cognizant of the fact that other GCC countries in the region are pursuing diversification in petrochemicals.
The sector currently faces the following key constraints : � The fact that many GCC countries, notably Saudi Arabia,
are focusing on diversification in petrochemicals repre-sents a risk.
� Similarly, there is a risk of channelling resources into the same sectors, with each country falling short of achieving an efficient scale of production ( Qatar NDS ).
� The petrochemicals industry is an energy-intensive in-dustry, generating two immediate environmental impacts : increased greenhouse gas emissions and greater local pollutants and associated risks. The Qatar NDS indicates that petrochemicals are responsible for 18 % of the CO2 emissions related to fuel combusted during energy pro-duction.
� Petrochemical industry activities generate a significant quantity of waste.
� The sector is currently represented by disparate SMEs buying raw material from large oil and gas companies. It is very difficult for them to place orders due to limited quantities of the raw materials they require. No bulk pur-chase mechanism exists.

63
[ PRIORITY SECTORS FOR THE ECONOMY ]
CROSS-SECTORS TO BE CONSIDERED
Based on the preliminary diagnostics presented and on the private sector’s key competitiveness constraints identi-fied during the first stakeholders’ consultation, the following cross-sector functions have been preselected as priorities for Qatar’s STDR :
• Skills development• Logistics and trade facilitation• Trade information
Skills development
Developing skills will be an absolute prerequisite to transi-tioning to a high-skilled and knowledge-based economy. Specific requirements also include the development of a TVET system and university courses that are aligned with the envisioned directions for sectors’ development.
Logistics and trade facilitation
Logistics, trade infrastructure, procedures and processes have been identified as an additional key bottleneck affect-ing SMEs in the country. As a first step to favour develop-ment of exports in the GCC region, it will be essential to streamline road and railway infrastructure to ensure easy transit of exports.
Trade information
Trade information and intelligence will be vital for develop-ing exports. Currently trade data is provided by Tasdeer, the trade promotion organization within QDB. However, the reach of Tasdeer needs to be increased and its presence in key markets reinforced. In addition, for specific economic sectors to emerge, sector-specific information will also be needed. Competitive intelligence in these specific sectors will be a vital tool for Qatari SMEs to maximize their chances when engaging in exports.


PROPOSED INITIATIVES

66
[ STRATEGIC TRADE DEVELOPMENT ROADMAP FOR SME COMPETITIVENESS IN QATAR 2018-2022 ]
NATIONAL PROPOSED INITIATIVESStrategic objective 1 : Stimulate entrepreneurial mindset and skills in Qatar
Operational objective Activities
1.1 Develop a nationwide SME competition programme.
1.1.1 Develop a competition sub-programme affiliated to ‘Alfikra’ to focus specifically on new SMEs. The programme would have two focus areas :
• Potential SMEs ( business idea stage ) • Recently established SMEsThe programme would offer a reward through subsidizing office space or industrial premises provision, as well as offering consultancy ser-vices and promotion.The selection would be made by a committee of representatives led by QDB and involving Nama, Silatech, QBIC, QTA, Qatar National Re-search Fund, QCCI, QSTP, Manateq and Bedaya.In both of these broad categories an award would be given by subcategory : ‘young entrepreneur’, ‘innovation’, ‘public to private reconver-sion’, and others as defined by the committee.1.1.2 On the “Potential SMEs” competition, the researched success factors would be the following :
• Feasibility and practicality of the business idea and workplan• Financial sustainability and inclusion of key costs such as machinery maintenance, R&D, etc.• Market analysis strength and relevance• Export focus• Self-investment foreseen ( employee training, etc. ).Soft skills would be assessed by a QDB selection committee, and motivation level of the candidate will be assessed. 1.1.3 On the “Recently established SMEs” competition, the researched success factors would be the following :
• Success of the business idea and accountability figures• Success in target markets and status of demand• Investment in employees’ skills / HR management• Export readiness / performance.Soft skills would be assessed by a QDB selection committee, and motivation level of the candidate will be assessed.1.1.4 Reinforce the promotion of the competition programme through Nama, QDB, Silatech, QBIC, QSTP, Manateq websites, and through quick TV/radio adds.
1.2 Establish a ‘public to private’ transition scheme.
1.2.1 Develop an incentive scheme for full transition from the public to the private sector. The scheme would allow for the continuation of the payment of the salary of the previous public employee for a maximum period of three years.The scheme would be open to people already engaged in a private sector initiative as a sideline in addition to public sector employment, as well as those willing to start a business.However, once the scheme starts, the person would be released from his / her public sector duties during the time of the scheme’s validity.1.2.2 Establish conditionality of renewal of the scheme after the end of the first year based on the performance and achievements of the en-deavour.If by the end of the first year the process is going as per the development plan, a second year of subsidy would be allowed.This assessment would be then repeated one last time at the end of the second year for a potential third renewal.1.2.3 In the case of failure, the employee would be allowed to reintegrate into the public sector but would not be entitled to benefit from the scheme again.1.2.4 Make the transition scheme available to employees leaving into retirement and advertise it among employees. 1.2.5 Develop a gradual reduction plan for the public sector subsidy over five years.1.2.6 Extend social security protection to the citizens of Qatar working in the private sector.
1.3 Build capacities of SMEs in entrepreneur-ship skills and soft skills.
1.3.1 For all coaching and capacity-building programmes on business management practices aimed at middle / high-level managers and owners instore a requirement of assessment of the level of implication and involvement of the Qatari owner of the enterprise and pursue fur-ther training only in the case the level of implication is judged sufficient. The regular presence of the owner at the training sessions is to be established as conditionality for participation of the enterprise to the train-ing. 1.3.2 Develop a targeted training for Qatari citizens involved in the private sector, focused on performance monitoring.1.3.3 For the trainings above, select and invite successful small entrepreneurs from the GCC region to give seminars about their path to suc-cess, their mistakes and ideas, and how they handled them.

67
[ PROPOSED INITIATIVES ]
Strategic objective 1 : Stimulate entrepreneurial mindset and skills in Qatar
Operational objective Activities1.4 Increase HR management capacities of firms and in-house capacity-building.
1.4.1 Develop cloud-based software for HR guidelines and regulations to be implemented by SMEs. Store all relevant local laws, interna-tional compliance standards and global best practices on the website, as well as manuals and guidelines. 1.4.2 Support companies in developing HR policies and practices – after comprehensive review of applicable local laws, international com-pliance standards and global best practices.Promote the integration of professional development within firms’ HR sections and enable exchanges with fast-developing international / re-gional companies that provide such services to their staff. 1.4.3 Support firms to create a proper working environment, incentivizing workers to gain skills and develop in companies.
• Train recruiting staff to identify proper soft skills sets during interviews ( for all types of roles – from operators to managers )• Train recruiting staff on HR practices ( job description development, planning and incentivizing, etc. )• Establish collaboration with leading international institutes to transfer ideas on company corporate subculture management• Increase career growth opportunities for operators ( and incentivize through merit-based salary growth )• Recognize well-performing workers and provide them with a trainer’s role• Ensure transparency of the company’s functioning and meritocracy culture• Establish a regular interaction mechanism between management and workers• Require greater dedication to training newcomers and interns.1.4.4 Promote skill development contracts between employers and workers whereby employees receive advanced training from firms in ex-change for commitments to stay with those firms for an agreed period, thereby incentivizing employer investment in labour.1.4.5 Introduce and capacitate R&D departments responsible for increasing existing product sophistication and developing new products based on market prospection work, through provision of HR and advisory services.
1.5 Improve the capacities of firms to select appropriate technologies.
1.5.1 Put in place a technology unit hosted within QCCI that would collaborate with international institutes for machinery and act as an ad-viser to the private sector for technology selection. Specialize the unit in the three product priority sectors ( agriculture, renewable energies and petrochemicals ).1.5.2 Conduct training, involving machinery suppliers’ representatives, at firm level for middle-level and high-level managers on :
• Knowledge of existing equipment and their advantages, in order to ensure proper identification and purchase of equipment within companies;
• Understanding the potential of newly purchased equipment and the training requirements for operators to ensure its full-capacity functioning.
Further detail on specific areas of support would be identified in the sector-specific value chain studies.1.5.3 Provide systematic on-site training to companies’ operators on the use of newly purchased machinery and best practices in its han-dling ( e.g. best practices in process control and machine maintenance ).
1.6 Reinforce and reorient incubators and excellency centres in upcoming SEZs.
1.6.1 Within all existing industrial zones ( QBIC, QSTP, Manateq ) and upcoming SEZs ( Ras Bufontas, Umm Al Houl and Al Karaana ), prioritize projects in the priority sectors of the STDR.Build capacity of institutions for sectors which are currently not supported, such as renewable energies, fruits and vegetables ( raw and pro-cessed ) and the insurance sector.1.6.2 Develop, in the upcoming Ras Bufontas, Umm Al Houl and Al Karaana SEZs, training centres that will include the trainings mentioned in activities 1.3.1, 1.4.1, 1.4.3 and 1.5.1.1.6.3 Advocate for the upscaling of the QBIC scheme by including additional capacity and increasing training batches. Add regional offices, especially near agricultural areas. Include service sectors under the QBIC scheme.1.6.4 Develop a bulk import proposition in SME incubator facilities, allowing enterprises to reduce the prices of their inputs.

68
[ STRATEGIC TRADE DEVELOPMENT ROADMAP FOR SME COMPETITIVENESS IN QATAR 2018-2022 ]
Strategic objective 2 : Improve operating conditions for enterprises
Operational objective Activities
2.1 Develop a well-coordinated private sector institutional support framework.
2.1.1 Reach consensus on the structure and composition of the SDPN, and set it up in order to increase coordination among SME supporting institu-tions. 2.1.2 Position the SDPN as the public–private coordinating body to manage the implementation of the present Roadmap.The platform will be responsible to effectively mobilize and engage implementing institutions to align all development policies to the Roadmap’s objec-tives; to identify activities that fall under their leadership; and plan for required human and financial resources for the upcoming five years.2.1.3 Provide the SDPN with a secretariat which would undertake the daily monitoring and coordination work to follow-up on the implementation of the present Roadmap. Equip the secretariat with an online Roadmap monitoring platform helping to register all initiatives related to the Roadmap and monitor their completion levels ( budget, targets, etc. ). 2.1.4 Use the SDPN as a public–private forum by inviting relevant SMEs to attend the meetings, depending on the agenda’s key areas of focus. 2.1.5 Priority areas of attention of the SDPN in the next two years will include :
• Development of an SME assistance online platform• Development of a new intellectual property regulation to implement the existing law• Advocate for and contribute to the development of a new land management framework• Development of a new competition law• Streamline connections between foreign investors and SMEs.
2.2 Facilitate access to supporting services for SMEs.
2.2.1 Based on the ‘Business Pulse’ website, further develop an online platform for SME assistance that would clearly schematize all available support services, the institutions providing them, and the stages of development of the SME at which these services are required.The services areas on the website will particularly need to include :
• Technical / managerial skills support• Financial services / facilitation• Market identification ( national / international )• Regulatory environment / land / industrial premises or offices• The SME competition programmes.The online platform would connect the visitor with the relevant websites and coordinates for each service listed.Include private sector consulting firms providing services to SMEs.Embed the link to the website on each SME supporting institution’s website. 2.2.2 Proceed with yearly updates of the website to include provision of new services as they are created.
2.3 Widespread SME-specific assistance provided by financial institutions.
2.3.1 Sensitize staff in financial institutions to SME profiles, entailed risks and potential financial tools to be developed for them, based on best practice in other countries.Build capacity in banks on the assessment of business ideas and financial plans, and practicality of the ideas ( existing markets, innovation, etc. ).2.3.2 Upscale the Qatar Finance and Business Academy to create a steady supply of qualified workers for financial services.Advertise the following courses to commercial bank officers :
• Consumer & Small Business Lending• SME Finance.Develop new courses aimed at assessment and financing of innovative projects.2.3.3 Develop and propose a new insolvency regulation for the State legal system that will be derived from the current provisions under the QFC ( put in place in 2013 ).
2.4 Facilitate workforce regulations and management systems.
2.4.1 Lobby for the removal / decrease of the subsidy for low-skilled labour to dissuade low-skill-based business generation.2.4.2 Review and streamline the workforce import system, leaving to the company the final choice of candidates from among a pool of candidates pre-selected by MoADLSA.
2.5 Pursue the modernization of regulations to respond to the needs of the private sector.
2.5.1 Develop practical regulations for the implementation of intellectual property laws, specifically on copyrights and patents, through a nationally established institutional mechanism. 2.5.2 Facilitate land attribution and reduce waiting times. Review and adopt a new regulation and management mechanism on land attribution and plan-ning.Assign a focal point institution to handle land attribution and planning in Qatar.
2.6 Develop a clear and accessible quality management system.
2.6.1 Facilitate the mechanisms for certification of exports, testing, accreditation of certification bodies and metrology in Qatar. Develop a new public sector framework for quality assurance and create or appoint one public institution responsible for certification.

69
[ PROPOSED INITIATIVES ]
Strategic objective 2 : Improve operating conditions for enterprises
Operational objective Activities2.7 Multiply sector-specific poli-cies and analyses.
2.7.1 Within priority sectors of the STDR, develop value chain analyses and strategies that would give clear direction for action in the next five years. The sectors to be covered specifically are :
• Renewable energies• Insurance services• Agro-industry ( vegetables and fruits, fresh and processed )• Petrochemicals.2.7.2 In connection with the Qatar National Tourism Sector Strategy 2030, develop specific analyses and five-year plans for the following tourism areas :
• Leisure and entertainment tourism• Business tourism ( MICE ).
2.7.3 Liberalize conditions to develop sector studies in Qatar, to ensure any entity can undertake sector-specific studies and to multiply resources and available knowledge.
Strategic objective 3 : Open the country to foreign investment to inspire diversification
Operational objective Activities
3.1 Adjust investment attraction policies to focus on priority areas.
3.1.1 Pursue the current programme of foreign investment liberalization and amend regulations on investment by :
• Authorizing foreign / full ownership in the insurance sector• Authorizing full foreign ownership in the renewable energies sector• Facilitating land ownership for full foreign ownership companies.3.1.2 Review the MoEC authorization process for 100 % foreign ownership by facilitating the criteria for approval :
• The authorization will be dependent on the sector ( not development plans of the State )• New technologies criterion to be amended to ‘technologies not present in Qatar’• Local raw materials use criterion to be removed ( should be encouraged )• Export promotion and notoriety of the company criteria to be removed• Hiring of Qatari nationals should be encouraged but not a criterion.
3.2 Build capacities of institutions to attract key investors to the country.
3.2.1 Build capacity of investment promotion officers at MoEC ( Investment Promotion Department ) to effectively facilitate and target investment, and improve their investment analysis and targeting capacity / techniques to narrow down investors based on investment requirements and specifications ( this implies investment in data access and management services such Dun and Bradstreet, Financial Times, fDi Markets ).3.2.2 Strengthen the ability of QIA, QFCRA, QSTP and Manateq to respond effectively to direct inquiries from investors through a systematic joint ap-proach, relying on shared investor data and materials.3.2.3 Restore the FDI forum in Qatar under the initiative / lead of Prime Minister.3.2.4 Support the development of ( existing and new ) customized FDI promotional material :
• Develop well-crafted value propositions for potential investors, comprising feasibility studies on renewable energies, insurance services, agro-industry ( vegetables and fruits, fresh and processed ) and petrochemicals;
• Develop comprehensive and up-to-date sector profiles;• Develop a centralized database of the critical information and intelligence required by investors.3.2.5 Carry out investment promotion activities in target countries – roadshows, facilitating direct interactions between Qatari firms ( privilege award winners in the national SME competition ) and targeted investors, helping foreign representatives to promote key sectors.Use side events to showcase investment profiles developed. Invite potential investors to strategic locations to showcase the infrastructure and business climate.
3.3 Develop cooperation frame-works between local SMEs and foreign investors.
3.3.1 Help establish linkages between new international investors and local suppliers more systematically, taking into account the SMEs’ perspective. For example, ensure that foreign-owned firms begin to provide more systematic and organized in-house training, opened to local firms.3.3.2 Through the training centres developed in the existing incubators, the QFC, QBIC and the upcoming SEZs ( activity 1.6.2 ), invite foreign investors to present on specific topics and technologies that they apply. 3.3.3 Strengthen the capacity of MoEC, QIA, QFC, QSTP and Manateq to develop investor aftercare efforts in order to increase communication and rela-tionships with current foreign investors.

70
[ STRATEGIC TRADE DEVELOPMENT ROADMAP FOR SME COMPETITIVENESS IN QATAR 2018-2022 ]
Strategic objective 4 : Encourage firms to export through acquired market intelligence
Operational objective Activities
4.1 Enhance institutional capacity to support enterprises to export.
4.1.1 QDB / Tasdeer to consider opening offices in target markets to support Qatari companies.Based on the Market Study conducted by QDB in Morocco, Tunisia and Saudi Arabia, there is a good opportunity to increase exports to these markets through QDB presence in these markets to enable follow-up with the contacts established through the detailed market studies. Such international trade support offices are established by all trade promotion offices. This needs to be done with the support of MoEC.4.1.2 Develop an E-commerce initiative regrouping Qatari exporting SMEs targeted at the GCC and key international markets ( for instance Morocco and Tunisia ). The E-commerce platform should be in line with the national branding initiative in the operational objective 4.2.4.1.3 Reinforce promotion of Tasdeer at a nationwide level to non-exporting companies.
4.2 Develop a nationwide branding initiative.
4.2.1 Develop a national brand for Qatar, with a consistent appearance, visuals and messages, and diversify it around the key export- and investment-oriented sectors ( renewable energies, agro-industry, petrochemicals, leisure and entertainment tourism, business tourism, insurance services ).Particularly leverage the ambition of the country to turn to environmental sustainability and to move away from low-skilled labour.Use the branding recently developed by QTA.4.2.2 Leverage the communication surrounding World Cup 2022 as a means to disseminate and promote the newly created image. 4.2.3 Capacitate a key point institution to be the holder of the national brand and to spread it at the international level for export and investment devel-opment.
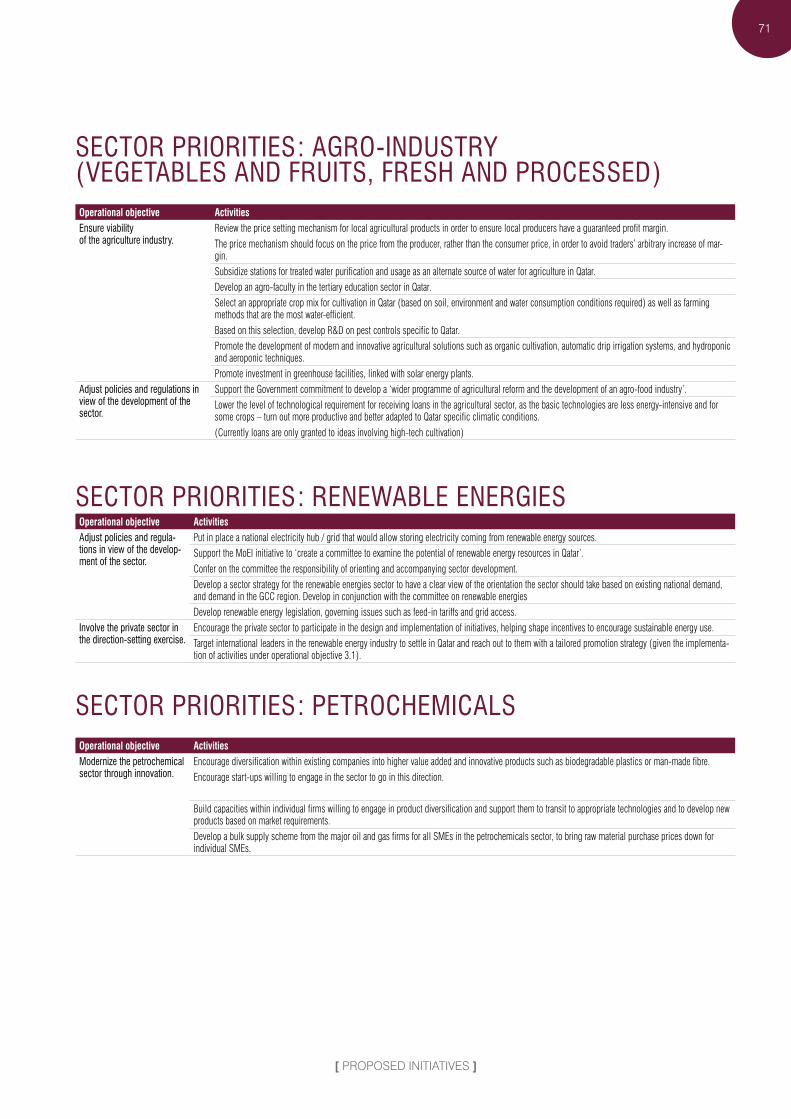
71
[ PROPOSED INITIATIVES ]
SECTOR PRIORITIES : AGRO-INDUSTRY ( VEGETABLES AND FRUITS, FRESH AND PROCESSED )Operational objective ActivitiesEnsure viability of the agriculture industry.
Review the price setting mechanism for local agricultural products in order to ensure local producers have a guaranteed profit margin.The price mechanism should focus on the price from the producer, rather than the consumer price, in order to avoid traders’ arbitrary increase of mar-gin. Subsidize stations for treated water purification and usage as an alternate source of water for agriculture in Qatar.Develop an agro-faculty in the tertiary education sector in Qatar. Select an appropriate crop mix for cultivation in Qatar ( based on soil, environment and water consumption conditions required ) as well as farming methods that are the most water-efficient.Based on this selection, develop R&D on pest controls specific to Qatar. Promote the development of modern and innovative agricultural solutions such as organic cultivation, automatic drip irrigation systems, and hydroponic and aeroponic techniques.Promote investment in greenhouse facilities, linked with solar energy plants.
Adjust policies and regulations in view of the development of the sector.
Support the Government commitment to develop a ‘wider programme of agricultural reform and the development of an agro-food industry’.Lower the level of technological requirement for receiving loans in the agricultural sector, as the basic technologies are less energy-intensive and for some crops – turn out more productive and better adapted to Qatar specific climatic conditions. ( Currently loans are only granted to ideas involving high-tech cultivation )
SECTOR PRIORITIES : RENEWABLE ENERGIESOperational objective ActivitiesAdjust policies and regula-tions in view of the develop-ment of the sector.
Put in place a national electricity hub / grid that would allow storing electricity coming from renewable energy sources. Support the MoEI initiative to ‘create a committee to examine the potential of renewable energy resources in Qatar’.Confer on the committee the responsibility of orienting and accompanying sector development.Develop a sector strategy for the renewable energies sector to have a clear view of the orientation the sector should take based on existing national demand, and demand in the GCC region. Develop in conjunction with the committee on renewable energiesDevelop renewable energy legislation, governing issues such as feed-in tariffs and grid access.
Involve the private sector in the direction-setting exercise.
Encourage the private sector to participate in the design and implementation of initiatives, helping shape incentives to encourage sustainable energy use.Target international leaders in the renewable energy industry to settle in Qatar and reach out to them with a tailored promotion strategy ( given the implementa-tion of activities under operational objective 3.1 ).
SECTOR PRIORITIES : PETROCHEMICALSOperational objective ActivitiesModernize the petrochemical sector through innovation.
Encourage diversification within existing companies into higher value added and innovative products such as biodegradable plastics or man-made fibre.Encourage start-ups willing to engage in the sector to go in this direction.
Build capacities within individual firms willing to engage in product diversification and support them to transit to appropriate technologies and to develop new products based on market requirements.Develop a bulk supply scheme from the major oil and gas firms for all SMEs in the petrochemicals sector, to bring raw material purchase prices down for individual SMEs.

72
[ STRATEGIC TRADE DEVELOPMENT ROADMAP FOR SME COMPETITIVENESS IN QATAR 2018-2022 ]
SECTOR PRIORITIES : LEISURE AND ENTERTAINMENT TOURISMOperational objective ActivitiesMultiply attraction points for cultural and leisure tourism.
Increase the visibility of the Doha Film Institute and its activities in the country and abroad, and look into the feasibility of creating an Arab film festival as a regional event to reinforce the offer for cultural tourism in Qatar and contribute to promoting the image of the country.Reinforce the offer for national and regional arts and cultural activities :
• Arabic music concerts and festivals ( encouraging people to come and to stay longer )• Multiply temporary expositions at the Museum of Islamic Art and Islamic Cultural Centre• Develop cultural activities outside of Doha – theme parks and entertainment centres• Rethink the dates of the Qatar Summer Festival.Improve promotion of cultural tourism through Qatar Airways following the model of Turkish Airlines.
Adjust policies and regula-tions in view of the develop-ment of the sector.
Facilitate visa procedures for tourists coming to Doha – develop a one-month tourism entry with no visa requirement.
SECTOR PRIORITIES : BUSINESS TOURISM ( MICE )Operational objective ActivitiesAdjust policies and regulations in view of the development of the sector.
Put in place an events and conferences coordination and monitoring agency that would ensure a consistent programme ( avoid overlapping and inactive peri-ods ) over the year.The agency would also be responsible for organizing back to back conferences / forums / events ensuring provision of high-quality services and suited to clients’ needs.
Improve the offer for MICE tourism in Qatar.
Encourage development of new exhibition facilities and related services :
• Catering• Event organization facilitation enterprises• Web design and printing.Align with key target markets’ requirements as identified in the MICE strategy.The events and conference coordination agency to promote local service providers for each planned event.
SECTOR PRIORITIES : INSURANCE SERVICESOperational objective ActivitiesAdjust policies and regulations in view of the development of the sector.
Develop insurance sector legislation that would regulate activities of the sector.The legislation would need to cover SMEs specifically.Develop a sector strategy for the insurance sector to have a clear view of the orientation the sector should take based on existing national demand, and de-mand in the GCC region.
Align the insurance offer to anticipated needs.
Promote to insurance enterprises or banks in the priority sectors of the economy the diversification of the insurance offer and develop SME-specific insur-ance tools.

73
[ PROPOSED INITIATIVES ]
CROSS-SECTOR PRIORITIES : SKILLS DEVELOPMENTOperational objective ActivitiesDevelop linkages between the industry and academia.
Put in place a national skills development coordination platform, led by MoEHE, which would group all sectors of the economy which will inform the skills development programmes of universities, TVET and private sector training providers.
Develop an open TVET system.
Set up a vocational training institution with public sector funding, available to both the Qatari and non-Qatari workforce.
Ensure key areas for upcom-ing skills requirements are covered.
Develop courses and sensitization on entrepreneurship from primary school up to tertiary level, aligned with each level. Promote role model entrepreneurs in schools and invite thought leaders to high schools and tertiary institutions.Sensitize children on social and environmental concerns from an early age in schools ( stimulate empathy and mutual aid ).Develop courses on landscaping for sports, agriculture and other infrastructure-related projects.
CROSS-SECTOR PRIORITIES : TRADE FACILITATIONOperational objective ActivitiesPursue Customs modernization at border points.
Reach an agreement in the GCC region to remove road Customs control for transiting produce.Develop road Customs infrastructures at key border points in order to minimize waiting times. Construct warehouses and refrigerated facilities to stock perishable produce that is queueing for clearance.
CROSS-SECTOR PRIORITIES : MARKET INFORMATIONOperational objective ActivitiesEnsure opening of trade offices in target markets.
Open commercial attachés’ offices in target markets to support Qatari companies. Use diplomatic representations to host these offices.

74

75
[ IMPLEMENTATION MANAGEMENT ]
IMPLEMENTATION MANAGEMENT
The STDR of Qatar endeavours to generate the conditions for a favourable expansion of the country’s SME and export sectors and their contribution to the economic diversification of the country. However, having finalized this STDR is not enough to create sustainable export development. There is a definite need to elaborate and coordinate the various actions required to achieve the targets of the STDR. The execution and impact of these proposed initiatives on export develop-ment is significantly based on the ability of stakeholders to plan these initiatives so as to generate a multiplying effect in the country. In other words, apparently separate initiatives need to be synchronized to reinforce each other and create sustainable positive effects for export development and in-crease the effectiveness of the STDR.
Indeed, the STDR is not the Roadmap of any specific institution; rather it is the Roadmap of Qatar, and to ensure its success it is necessary to create the right environment and framework to enable its implementation. The follow-ing section presents some of the key success conditions considered fundamental for the STDR to be effectively im-plemented and achieve self-sustainability and long-lasting benefits for Qatar.
Establish and operationalize a public and private coordinating platform and its subsidiary organ
A key success criterion for the STDR is stakeholders’ abil-ity to coordinate activities, monitor progress and mobilize resources for the implementation of the STDR. It is recom-mended that the country establishes a platform for public–private deliberations that acts in an advisory capacity to the Government and the private sector over issues related to or affecting the STDR.
The formal dialogue platform will require a high level of involvement by members of TISIs ( public and private ), as their role is crucial and will impact the effectiveness with which the STDR is implemented. Likewise, the ability of the private sector to provide inputs to the STDR implementation process will significantly influence the success of the STDR.
The stakeholders group consulted during the design process is composed of a panel of representatives of key institutions, involving Government ministries and institutional
members. It also includes private sector representatives from all segments of the industry. As such, once its man-date is appropriately adjusted, this group of stakeholders is best positioned to serve as the public–private platform responsible for the coordination of STDR implementation. It should also be aligned with the current initiative to establish an SDPN. It will also be required that a nominated secretariat coordinates, monitors and mobilizes resources for imple-menting the STDR.
The main functions of the public–private platform should be the following :i. Act as a consultative group pertaining to the trade and
SME development areas, enabling the private sector and Government representatives to identify priority issues;
ii. Coordinate and monitor the implementation of the STDR by the Government, private sector, institutions or interna-tional organizations so as to ensure STDR implementa-tion is on track;
iii. Identify and recommend allocation of resources neces-sary for the implementation of the STDR;
iv. Elaborate and recommend revisions and enhancements to the STDR so that it continues to best respond to the needs and long-term interests of the country;
v. Propose key policy changes to be undertaken, based on STDR priorities, and promote these policy changes among national decision makers;
vi. Guide the secretariat in its monitoring, coordination, re-source mobilization, and policy advocacy and communi-cation functions so as to enable effective implementation of the STDR.
As discussed above, the public–private platform should be supported by a secretariat to complete the daily operational work related to implementation management of the STDR. The core responsibilities of the secretariat should be to :A. Support and organize the regular meetings of the pub-
lic–private platformB. Moni to r the p rogress and impact of STDR
implementationC. Coordinate STDR implementation partnersD. Mobilize resources to implement the STDR.
76
[ STRATEGIC TRADE DEVELOPMENT ROADMAP FOR SME COMPETITIVENESS IN QATAR 2018-2022 ]
Specific tasks falling under these broad areas of activities include :
� Formulate project proposals, including budgets for imple-mentation of activities of the STDR;
� Develop annual and biannual workplans for approval by the public–private platform;
� Collect information from project implementation and pre-pare regular monitoring reports to be submitted to the public–private platform;
� Advocate in favour of the STDR to public and private part-ners;
� Execute any other tasks as required by the public–private platform.
Private sector support and par ticipation
The private sector should benefit from STDR implementation through improved productive capacities, reduced costs of doing business, facilitated administrative procedures, en-hanced access to finance, etc. However, the private sector clearly expressed during the STDR design process its will-ingness to contribute, directly or in partnership with public institutions, to the implementation of the STDR. Their imple-mentation efforts can range from providing business intelli-gence to institutions to contributing to development projects, establishing processing and transformation units, advocacy, etc. In brief, the private sector’s practical knowledge of busi-ness operations is essential to ensuring that the activities of the STDR are effectively implemented and targeted.
Sensitization of implementing institutions to build ownershipThe key implementing institutions detailed in the Proposed Initiatives need to be informed of the content of the STDR and the implications for their 2017–2022 programming. This sensitization is essential to building further ownership and it provides institutions with the opportunity to review the Proposed Initiatives in order to confirm the activities they can implement immediately, in both the medium and long terms. Such a programming approach will permit better resource allocation within the responsible agencies. This allocation
can be formalized by integrating the activities of the STDR into the programme planning of the institution. While the fi-nancial dimension is often required, the human resource element is no less important.
Financial resource mobilization for implementationWhile resource mobilization is only part of the solution, it plays a crucial and indispensable role in supporting STDR implementation. An integrated resource mobilization plan should be elaborated as soon as the document is adopted. Resource mobilization involves planning the sequencing of communications with institutions, project design, project proposals/applications, and resource collection and man-agement. This should facilitate, leverage and strengthen the impact of diverse sources of finance to support sustainable and inclusive implementation, including national resources and private investment.
� National resources through direct budget and support programmes : The Government will need to validate de-fined minimum budget support towards the implemen-tation of the different components of the STDR. This support for the STDR’s activities will demonstrate the Government’s commitment to the initiatives.
� National and foreign investment : The STDR design stakeholders’ group is composed of representatives of national institutions, the trade support network and the private sector. If this group becomes the public–private platform, the STDR should benefit from a solid channel of communication, capable of conveying reliable infor-mation to companies about export-related opportuni-ties, and in turn of communicating to the Government the needs that investors have identified as necessary to operate successfully. Investment flow in Qatar could serve as a valuable driver for certain specific areas iden-tified in the STDR and requiring support. Even so, it must be targeted at specific prospects in order to benefit the industry’s development as detailed in the way forward section of the present STDR.

77
[ REFERENCES ]
REFERENCES
Colliers International ( 2014 ). Doha Qatar Real Estate Market Overview.
Fernandez, Raj and Ali, Shaukat ( 2015 ). SME contribu-tions for diversification and stability in emerging econo-mies – An empirical study of the SME segment in the Qatar economy. Journal of Contemporary Issues in Business and Government, Vol. 21, No. 1. Available from http ://journals.sfu.ca/cibg/index.php/cibg/article/view/14/21.
Hasni, Abidi ( 2012 ). Qatar : a singular way. Géoéconomie 3/2012 ( No. 62 ), pp. 15–30. Available from http ://www.cairn.info/revue-geoeconomie-2012-3-page-15.htm.
Hakimian, Hassan and Abdulaal, Abdulla ( 2015 )., GCC Economic Integration : Fiction or Reality? Policy Paper, March. Khamsoon.
Ibrahim, Ibrahim and Harrigan, Frank. ( 2012 ). Qatar’s econ-omy : Past, present and future. QScience Connect : Vol., 9. Available from http ://www.qscience.com/doi/abs/10.5339/connect.2012.9.
Index Mundi ( 2016 ). Website. Available from http ://www.indexmundi.com/.
International Monetary Fund ( 2016 ). World Economic Outlook Database. Available from https ://www.imf.org/ex-ternal/pubs/ft/weo/2016/01/weodata/index.aspx. Accessed 5 May 2016.
International Monetary Fund ( 2015 ). Country Report No. 15/86.
International Monetary Fund ( 2015 ). Country Report No. 15/87, Qatar : Selected Issues.
International Trade Centre ( 2016 ). Investment Map. Available from http ://www.investmentmap.org/. Accessed 15 May 2016.
Khalid Shams Abdulqader ( 2015 ). GCC’s Economic Cooperation and Integration : Achievements and Hurdles. Aljazeera Centre for Studies, 31 March.
Moody’s Investors Service ( 2015 ). Moody’s : Qatar is the fastest growing GCC insurance market and is likely to continue its rapid growth, 4 March. Available from https ://www.moodys.com/research/Moodys-Qatar-is- the-fastest-growing-GCC-insurance-market-and--PR_319679.
Qatar Development Bank ( 2015 ). Reviewing the Strategy for 2015–2019.
Qatar Development Bank ( 2014 ). QDB 2015–2019 Strategy.
Qatar Financial Centre ( 2015 ). Website. Available from http ://www.qfc.qa/.
Qatar General Secretariat for Development Planning ( 2011 ). Qatar National Development Strategy 2011–2016.
Qatar Ministry of Development Planning and Statistics ( 2015 ). Qatar Economic Outlook 2015–2017.
Qatar Ministry of Economy and Economy (2017), Investment in the State of Qatar
Qatar Ministry of Economy and Economy (2017), Trade Sector FAQ
Qatar Ministry of Development Planning and Statistics ( 2014 ). Annual Bulletin of Labour Force Survey 2014.
Qatar Ministry of Development Planning and Statistics ( 2014 ) ( b ).Foreign Investment Survey, 2013. Doha.
Qatar Ministry of Foreign Affairs ( 2013 ). Website. Available from http ://www.mofa.gov.qa/.
Qatar Science and Technology Park ( 2014 ). Free Zone. Available from http ://www.qstp.org.qa/home/free-zone.
Qatar Tourism Authority ( 2014 ). Qatar National Tourism Sector Strategy 2030.

78
[ STRATEGIC TRADE DEVELOPMENT ROADMAP FOR SME COMPETITIVENESS IN QATAR 2018-2022 ]
The Conference Board ( 2015 ). Total Economy Database. Available from https ://www.conference-board.org/data/economydatabase/index.cfm?id=27762. Accessed 20 May.
United Nations Development Programme ( 2016 ). Human Development Index. Available from http ://hdr.undp.org/en/con-tent/human-development-index-hdi. Accessed 2 May 2016.
World Bank ( 2016 ). World Development Indicators. Available from http ://data.worldbank.org/data-catalog/world-develop-ment-indicators. Accessed 8 May 2016.
World Bank ( 2016 ) ( b ). Global Economic Monitor ( GEM ) Commodities. Available from http ://databank.worldbank.org/data/reports.aspx?source=Global-Economic-Moni-tor-( GEM )-Commodities. Accessed 10 May 2016.
World Bank ( 2016 ) ( c ). World Integrated Trade Solution ( WITS ). Available from http ://wits.worldbank.org/. Accessed 14 May 2016.
World Bank Group ( 2016 ). Ease of Doing Business in Qatar. Available from http ://www.doingbusiness.org /data/exploreeconomies/qatar/.
World Economic Forum ( 2015 ). The Global Competitiveness Report 2015–2016. Geneva.
World Trade Organization ( 2014 ). Trade Policy Review : Qatar.


![DIGITAL TRADE ROADMAP...• Industry experts from all trade sectors [All stakeholders* are messengers] • Promote the roadmap to align efforts • Update laws • Create interoperable](https://static.fdocuments.in/doc/165x107/5f0dc2f17e708231d43bf4ed/digital-trade-roadmap-a-industry-experts-from-all-trade-sectors-all-stakeholders.jpg)