Strategic Road Review - City of Lismore
100
Strategic Road Review 2013 lismo city council
Transcript of Strategic Road Review - City of Lismore
Strategic Road Review 2013
lismo city council

Lismore Strategic Road Review
Prepared for Lismore Council
Ref : 34494Rep2
3rd May 2013
ttmGROUP
Lismore Strategic Road Review 3rd May 2013
________________________________________________________________________________________________
________________________________________________________________________________________________ TTM Consulting (GC) Pty Ltd Page No. 1 Traffic . Parking . Acoustics TTM Ref : 34494Rep2
1. Background TTM Consulting (GC) Pty Ltd was engaged by Lismore Council to undertake a review and investigations of future road requirements for the Lismore urban and rural areas. The purpose of the review was to assist Council in respect to the preparation of an Urban and Rural Road Infrastructure Contribution Plans commonly termed a “Section 94 Plans”. Consequently, the methodology applied by TTM was specifically designed to satisfy Section 94 Contribution Plan principles. The overall objectives of the TTM investigations were ;
To recommend the basis for a Lismore Urban Road Infrastructure Contributions Plan.
To recommend a framework for a Rural Road Infrastructure Contributions Plan. The review was primarily focused on investigating future road requirements for the Lismore urban area about which TTM was required to undertake investigations and report the following.
Section 94 Plan principles Key technical assumptions Existing traffic volumes Review relevant past studies and associated recommendations Anticipated future development for 2018, 2023, 2028 and 2033 Future road network options Future development traffic generation and road network traffic volumes The effectiveness of future road network options Future road network option costs and benefit cost ratios A desirable long term road network and associated road network stages The extent to which future developments contribute to each future road network element
This report is structured in two parts.
A. Section 94 Plan Principles and Key Assumptions
B. Lismore Urban Roads - Future Requirements, Costs and Contributing Factors
C. Lismore Rural Roads – Apportioning Future Costs

Lismore Strategic Road Review 3rd May 2013
________________________________________________________________________________________________
________________________________________________________________________________________________ TTM Consulting (GC) Pty Ltd Page No. 2 Traffic . Parking . Acoustics TTM Ref : 34494Rep2
PART A
Section 94 Plan Principles, Key Assumptions and Investigation Methodology
Lismore Strategic Road Review 3rd May 2013
________________________________________________________________________________________________
________________________________________________________________________________________________ TTM Consulting (GC) Pty Ltd Page No. 3 Traffic . Parking . Acoustics TTM Ref : 34494Rep2
1. Section 94 Plan Principles The ability of Councils in New South Wales to require developers to make contributions towards future road construction is provided via Part 4, Division 6 of the ENVIRONMENTAL PLANNING AND ASSESSMENT ACT 1979. The NSW state government document Local Development Contributions Practice Note, Nov 2010 describes the following key principles and guidelines (shown in italics) in respect to the preparation of Section 94 plans.
2.1.1 General Requirements If councils wish to seek a contribution under section 94 they are required under section 94B of the EP&A Act to prepare contributions plan. The aim of that plan is to establish the relationship between the expected types of development in the area to which the plan applies and the demand for public amenities and services to meet that development. Section 94 contributions are imposed by way of condition of consent (or complying development). The requirement for a contribution can be satisfied either by paying a monetary contribution or dedicating land free of cost. The requirement for a contribution can also be satisfied by the provision of a material public benefit (works-in-kind). Councils as consent authorities may impose conditions under section 94 and section 94A of the EP&A Act only if it is of a kind allowed by, and that is determined in accordance with, a contributions plan. The contribution must be towards “public amenities or services” (s 94 of the EP& A Act). What are public amenities and public services is not defined. Public amenities and public services are however expressly defined to not include water supply or sewerage services (s 93C of the EP&A Act). Generally, contributions can only be sought for:
Capital costs, including land acquisition costs
Public facilities that a council reasonably has to provide
Public facilities that are needed as a consequence or to facilitate new development
The condition must only be imposed for the provision, extension or augmentation of public amenities and public services (s 94(2) of the EP&A Act). That is, generally, contributions cannot be sought for recurrent funding such as maintenance. A contributions plan can require the payment of a monetary contribution towards recoupment of the cost of providing the public amenities or public services (being the cost as indexed in accordance with the regulations) (s 94(3) of the EP&A Act).
Lismore Strategic Road Review 3rd May 2013
________________________________________________________________________________________________
________________________________________________________________________________________________ TTM Consulting (GC) Pty Ltd Page No. 4 Traffic . Parking . Acoustics TTM Ref : 34494Rep2
2.1.2 Reasonableness and Accountability Section 94 contributions are based on the key concepts of reasonableness and accountability. Reasonableness relates to nexus and apportionment.
Nexus refers to the connection between the development and the demand created. The requirement to satisfy nexus is based on ensuring that there is a link between the development and increased demand for facilities. In addition, the infrastructure needs to be provided within a timeframe that meets the demand. Apportionment refers to the share borne by the future development. The concept of apportionment is based on ensuring that developers are only paying for the portion of demand that results from their development.
Accountability relates to both public and financial accountability.
Accountability is a basic requirement of section 94. Public accountability may be sought through open decision making, maintenance of appropriate financial records and community involvement, while financial accountability may be sought through the works schedule to the contributions plan, annual reports and a contributions register. A key issue with accountability in relation to reasonableness relates to the completion of the works program within the contributions plan and that the infrastructure is provided within a timeframe that meets the need of the development.
2.2 Ministerial direction under section 94E of the EP&A Act A Direction has been issued by the Minister for Planning under section 94E of the EP&A Act that limits local development contributions. The Direction applies to councils as consent authorities when they impose conditions of development consent requiring a monetary contribution under section 94 of the EP&A Act. Specifically, the Direction provides:
a cap of $30,000 per residential lot or dwelling for greenfield areas,
an exemption to areas where development applications have been lodged (including determined applications) and remain valid, as of 31 August 2010, for more than 25% of the expected yield from the development area or contributions plan, and
a cap of $20,000 per residential lot or dwelling for all other areas.
This Direction will be updated periodically, as it is intended to allow councils to apply for areas to be considered for inclusion in Schedule 3 to the Direction when an area is rezoned or a contributions plan is made, if councils can demonstrate that the area is a greenfield release area. The most recent Direction issued under section 94E and relevant Planning Circular is available at www.planning.nsw.gov.au. It is important to note that the section 94E Direction applies to conditions imposed on development consents. A contributions plan may still be in place that contains contribution rates that exceed the relevant cap, but the cap will limit the contribution amount that can be levied.

Lismore Strategic Road Review 3rd May 2013
________________________________________________________________________________________________
________________________________________________________________________________________________ TTM Consulting (GC) Pty Ltd Page No. 5 Traffic . Parking . Acoustics TTM Ref : 34494Rep2
The Practice Note describes the following examples of criteria which will be applied by state government into the assessment and approval of Section 94 Plans. 1. The public amenities and public services in the plan are on the “Essential Works List” as identified within this practice note (section 3.3.2) 2. There is nexus between the development in the area to which the plan applies and the kinds of public amenities and public services identified in the plan. 3. The proposed development contribution is based on a reasonable estimate of the cost of the proposed public amenities and public services.
How were the plan and cost estimates prepared?
Are the costs up to date?
Do the cost estimates include all of the costs required to bring the public amenities and public services into operation (eg, land, capital, fit out, borrowing, design and project management costs)?
Have relevant professionals (eg, quantity surveyors, chartered surveyors, land valuers) been
engaged to provide an independent assessment of the costs of providing the public amenities and public services?
How has the council taken CPI into account? Are the assumptions and calculations robust?
Has an NPV methodology been utilised? If so, has an appropriate discount rate been used?
4. The proposed public amenities and public services can be provided within a reasonable timeframe.
Is the timeframe (year or threshold) for provision relevant for the specific kinds of public amenities and public services?
Will the public amenities and public services be provided at a time that those demanding the
infrastructure require it?
Does the plan seek to recoup funds?
Does the plan provide for pooling of funds? 5. The proposed development contribution is based on a reasonable apportionment between existing demand and new demand for the public amenities and public services.
What are the kinds of public amenities and public services for which the proposed development will create demand?
Are the public amenities and public services located in appropriate locations for the expected
types of development in the area to which the plan applies?
Are the estimates of population change arising from the expected types of development realistic?

Lismore Strategic Road Review 3rd May 2013
________________________________________________________________________________________________
________________________________________________________________________________________________ TTM Consulting (GC) Pty Ltd Page No. 6 Traffic . Parking . Acoustics TTM Ref : 34494Rep2
Has the council assessed the implications of the expected types of development catered for by the contributions plan on the demographic structure?
On what basis have the estimates of demand for kinds of public amenities and public services
been established?
Have infrastructure demand or needs assessments been prepared to support the conclusions about demand for the kinds of public amenities and public services identified in the plan?
Is the information on demand both reliable and up to date?
Are the public amenities and public services only required to meet the need of the new
development or will it also serve the existing community?
Can the new demand be accommodated, in whole or in part, within existing public amenities and public services?
How is the existing community accounted for in the apportionment of costs?
If the expected development did not occur, would the public amenities and public services still
be required?
On what basis have the estimates of demand for public infrastructure been established?
Is the information on demand both reliable and up to date? 6. Where the plan is an existing plan, the council has conducted appropriate community liaison and publicity in preparing the contributions plan. 7. The plan complies with other matters IPART considers relevant.
When did the contributions plan come into effect? When was the plan last reviewed? When was the plan last amended without the need to review the plan?
What is the relationship with local environmental plans (LEP) and development control plans
(DCP), and is there any programmed review of these instruments which may affect the underlying assumptions within the plan?
Does the plan comply with any other matter IPART considers relevant?

Lismore Strategic Road Review 3rd May 2013
________________________________________________________________________________________________
________________________________________________________________________________________________ TTM Consulting (GC) Pty Ltd Page No. 7 Traffic . Parking . Acoustics TTM Ref : 34494Rep2
Three key principles arise from a reading of the Act and the Practice Note. These are :
Council can seek contributions towards road infrastructure from developments in respect to past or planned future road infrastructure improvements provided that a development can reasonably be shown to benefit from the improvement/s.
The Council is able to accept a contribution towards the cost of road infrastructure in the form of
land, monetary contribution, works in kind or via combination of all these options.
Contributions can generally not be levied for the cost of maintenance.
There is a limit to the amount of contribution which Council can seek from residential developments.
The investigations and conclusions reported in this document have been conducted with proper regard to the NSW government guidelines and assessment criteria for preparing Section 94 Contribution Plans. 2. Other Principles Applied to Lismore Investigations In the case of Lismore urban area the following factors have been significant in affecting the nature and extent of investigations.
The urban area of Lismore is of such limited extent that it is unlikely that trip generation and distribution within Lismore is significantly affected by the distances between origins and destinations or other factors such as traffic congestion and travel time etc.
Public transport and other non-car transport modes are limited in terms of services provided and the
extent to which transport demands are capable of being satisfied by these modes in the short and medium term.
In order to equitably ‘spread’ the burden of Section 94 Plan contributions, all categories of development and associated trip making were included. For example, for a trip between a dwelling and a shop the estimated contribution associated with one trip end is effectively allocated to the dwelling and the other to the shop.
The above factors give support to funding road infrastructure requirements generated by new development from the following three sources.
a. A Section 94 Plan which distributes the cost of ‘Urban Network’ infrastructure as a generalised cost or cost rate across all developments in the urban area for that infrastructure which forms an integral part of the entire future urban infrastructure network, in combination with
b. Voluntary Planning Agreements which distribute the cost of ‘Specific Network’ infrastructure only to
those developments which clearly generate the need for the infrastructure and without which development should not or could not reasonably occur, and
c. Development Consent Conditions which relate to ‘Direct Works’, which do not contribute to ‘Network’
connectivity and the need for which is clearly generated by a development. These works are typically located at or in close proximity to a development.
The allocation of cost to future development can then be estimated based on the proportion to which future development contributes to overall urban trip making at the long term planning horizon.

Lismore Strategic Road Review 3rd May 2013
________________________________________________________________________________________________
________________________________________________________________________________________________ TTM Consulting (GC) Pty Ltd Page No. 8 Traffic . Parking . Acoustics TTM Ref : 34494Rep2
This approach to developing a Section 94 Plan for the ‘Urban Network’ effectively treats the entire Lismore urban area as a single transport ‘catchment’ and is conceptually similar to a Section 94A Plan in which road infrastructure costs would be levied as a single rate across the entire urban area based on a prescribed percentage of the value of each future development. However, Section 94A Plans can potentially be criticised for not satisfying the “Reasonableness” principle because the value of development does not necessarily reflect the transport demand character of a development. In the recommended approach the apportioning of contributions contribution based on the trip generating character of development is more consistent with the “Reasonableness” principle. 3. Road Network Elements Subject to the Section 94 Plan It was assumed that future road requirements and associated capital expenditures associated with roads which are managed by the state via the Department for Roads and Marine Services will not be the subject of a Section 94 Plan. Whilst the network function of RMS roads has been included in all road network analysis and associated estimates of future road traffic volumes, only funding requirements for roads which are the responsibility of Council will potentially attract contributions described in a Section 94 Plan.
Lismore Strategic Road Review 3rd May 2013
________________________________________________________________________________________________
________________________________________________________________________________________________ TTM Consulting (GC) Pty Ltd Page No. 9 Traffic . Parking . Acoustics TTM Ref : 34494Rep2
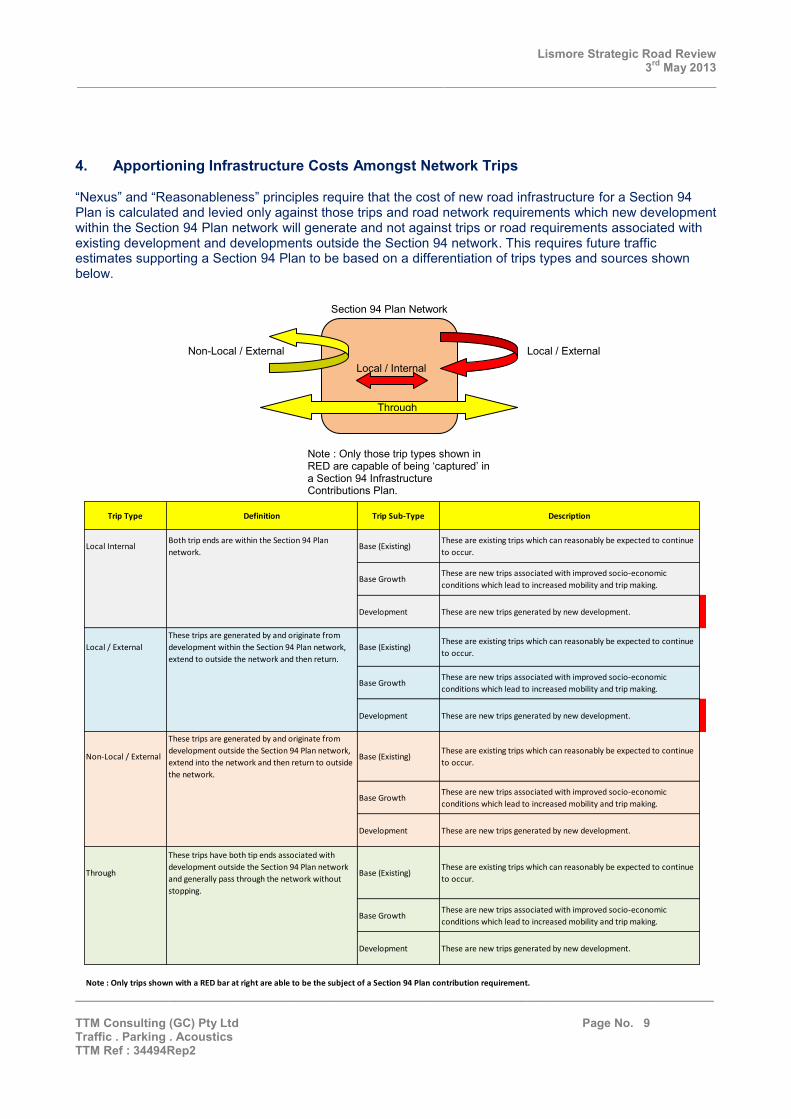
Trip Type Definition Trip Sub-Type Description
Local InternalBoth trip ends are within the Section 94 Plan
network.Base (Existing)
These are existing trips which can reasonably be expected to continue
to occur.
Base GrowthThese are new trips associated with improved socio-economic
conditions which lead to increased mobility and trip making.
Development These are new trips generated by new development.
Local / External
These trips are generated by and originate from
development within the Section 94 Plan network,
extend to outside the network and then return.
Base (Existing)These are existing trips which can reasonably be expected to continue
to occur.
Base GrowthThese are new trips associated with improved socio-economic
conditions which lead to increased mobility and trip making.
Development These are new trips generated by new development.
Non-Local / External
These trips are generated by and originate from
development outside the Section 94 Plan network,
extend into the network and then return to outside
the network.
Base (Existing)These are existing trips which can reasonably be expected to continue
to occur.
Base GrowthThese are new trips associated with improved socio-economic
conditions which lead to increased mobility and trip making.
Development These are new trips generated by new development.
Through
These trips have both tip ends associated with
development outside the Section 94 Plan network
and generally pass through the network without
stopping.
Base (Existing)These are existing trips which can reasonably be expected to continue
to occur.
Base GrowthThese are new trips associated with improved socio-economic
conditions which lead to increased mobility and trip making.
Development These are new trips generated by new development.
Note : Only trips shown with a RED bar at right are able to be the subject of a Section 94 Plan contribution requirement.
4. Apportioning Infrastructure Costs Amongst Network Trips “Nexus” and “Reasonableness” principles require that the cost of new road infrastructure for a Section 94 Plan is calculated and levied only against those trips and road network requirements which new development within the Section 94 Plan network will generate and not against trips or road requirements associated with existing development and developments outside the Section 94 network. This requires future traffic estimates supporting a Section 94 Plan to be based on a differentiation of trips types and sources shown below.
Through
Local / Internal Non-Local / External Local / External
Section 94 Plan Network
Note : Only those trip types shown in RED are capable of being ‘captured’ in a Section 94 Infrastructure Contributions Plan.
I
I

Lismore Strategic Road Review 3rd May 2013
________________________________________________________________________________________________
________________________________________________________________________________________________ TTM Consulting (GC) Pty Ltd Page No. 10 Traffic . Parking . Acoustics TTM Ref : 34494Rep2
1 2 3 4 5 6 7 8 9 10 11 12 13 14 15 16 17 18 19 20 21 22 23 24 25 26 27 28 29 30 31 32 33 34 35
1
2
3
4
5
6
7
8
9
10
11
12
13
14
15
16
17
18
19
20
21
22
23
24
25
26
27
28
29
30
31
32
33
34
35
These various trip types are represented in the following way in trip matrices which were developed in the study for the existing and future planning horizons. The following assumptions were applied to the estimates of future trip matrices.
There will be little or no growth in Local Internal, Local-External and Non-Local External Trips associated with existing development solely due to socio-economic changes and improvements.
Trip generation rates (eg. vpd/100sq.m. gfa) associated with various types of development will
remain unchanged throughout the periods leading up to each of the planning horizons.
Local Internal, Local-External and Non-Local External Trips will grow at rates which reflect the rate of growth of trips generated by development within the Lismore urban area at each planning horizon.
Through trips will grow at an average annual rate of 2% over the period leading up to each planning
horizon.
Local Internal
Through
Non-Local / External
Local - External
Internal Urban Zones/Centroids Urban Perimeter Nodes
Trip Matrix Format

Lismore Strategic Road Review 3rd May 2013
________________________________________________________________________________________________
________________________________________________________________________________________________ TTM Consulting (GC) Pty Ltd Page No. 11 Traffic . Parking . Acoustics TTM Ref : 34494Rep2
5. Investigation Methodology – Lismore Urban Area The following methodology was applied into the investigations for the urban area road network. The following planning horizons were adopted.
2013 – Existing (based on the S94 Plan coming into effect in the 2012/2013 financial year) 2018 – Short Term Horizon 2023 – Medium Term Horizon 2028 – Long Term Section 94 Plan Horizon 2033 – Ultimate Development Horizon
The above planning horizons were based on the following expectation.
The ability to reasonably anticipate the form of future development and associated road network requirements is limited to a period of approximately 20 years or through to approximately 2033. This represents the “Utlimate” planning horizon.
Funds collected from the Section 94 Plan will be applied into constructing road network requirements
in the period to 2028. This represents the period of time over which Council is able to reasonably anticipate, plan, design and implement road network improvements.
The Section 94 Plan will be reviewed at 5 yearly intervals, resulting in the term of the Plan at any
time varying between 10 and 15 years. The methodology was then as follows.
Council provided TTM with estimates of future development across the entire Lismore urban area at each of the above planning horizons.
Daily trip generation estimates for each planning horizon were then made for Lismore development
in each planning horizon. Weekday daily vehicle trip distribution matrices were then prepared for each planning horizon based in part on a calibrated matrix for existing development generated in an AIMSUN traffic assignment model ‘seeded’ with existing daily traffic volumes.
A desirable ‘Ultimate’ road network plan was prepared in consultation with Council having regard to
expected future development in the period to 2033. An estimate was made of the probable costs of each element of the desirable long term road network plan.
The AIMSUN model was applied into making estimates of the cost effectiveness of each road
network link within the ‘Ultimate’ road network plan having regard to the expected development in 2018, 2023 and 2028.
The ‘Ultimate’ road network plan was then revised having regard to the estimated cost effectiveness
of each element of the plan based on AIMSUN model traffic and network performance estimates.
The cost of desirable additional future road elements was then distributed across all development in the Lismore urban area. The distribution of cost to future development was then estimated based on the proportion which future development which will contribute to total urban trip generation.
Lismore Strategic Road Review 3rd May 2013
________________________________________________________________________________________________
________________________________________________________________________________________________ TTM Consulting (GC) Pty Ltd Page No. 12 Traffic . Parking . Acoustics TTM Ref : 34494Rep2
6. Investigation Methodology – Rural Area The following methodology was applied into the investigations for the rural area road network. The following planning horizons were adopted.
2013 – Existing 2028 – Long Term Section 94 Plan Horizon
Traffic estimates for the 2028 planning horizon were based on an expectation that trip making within the rural road network would increase at an average annual rate of 2% per annum through to 2028. This is understood to be consistent with average rural and urban area traffic growth over the past decade. These increases will arise from the combination of population growth in rural centres and outlying areas and miscellaneous non-residential development. Non-Local / External trips and Through Trips as defined in Section 4 of this report were not included in the estimates based on an assumption that these trips primarily occur on state highways and other roads under the control and management of RMS. The apportionment of future road costs to trips associated with future development was estimated from a ‘gravity model’ estimate of rural trip making derived from the relative population of each rural centre.

PART B
Lismore Urban Roads
Future Requirements, Costs and Contributing Factors
ttmGROUP
Lismore Strategic Road Review 3rd May 2013
________________________________________________________________________________________________
________________________________________________________________________________________________ TTM Consulting (GC) Pty Ltd Page No. 1 Traffic . Parking . Acoustics TTM Ref : 34494Rep2
1. Existing Road Network and Traffic Volumes 1.1 The Classification of Roads The Short and Long Term classifications of urban roads as currently adopted by Council are shown in Attachments 1 and 2. The scope of the investigations undertaken by TTM was primarily limited to roads which are currently classified as “Arterial”, “Sub-Arterial” and “Collector” roads and to future roads which will attract these classifications. 1.2 Existing Traffic Volumes Existing urban daily traffic volumes were available from Council records are shown in Attachment 3.

Lismore Strategic Road Review 3rd May 2013
________________________________________________________________________________________________
________________________________________________________________________________________________ TTM Consulting (GC) Pty Ltd Page No. 2 Traffic . Parking . Acoustics TTM Ref : 34494Rep2
Development Area ZoneCapacity
(Dwellings)5 Year Total
Percent Complete
5 Year Total
Percent Complete
5 Year Total
Percent Complete
5 Year Total
Percent Complete
Chilcotts Grass 1 163 20 12% 60 49% 40 74% 43 100%Holland Street 2 43 43 100% 100% 100% 100%Lagoons Grass 3 185 60 32% 90 81% 35 100%North Lismore Plateau 4 1500 250 17% 150 27% 150 37% 150 47%Pineapple 5 332 40 12% 40 24% 60 42% 40 54%Invercauld 6 263 80 30% 90 65% 60 87% 33 100%Trinity Drive 7 438 40 9% 60 23% 40 32% 60 46%Waterford 8 66 40 61% 26 100% 100% 100%Crawford 9 269 60 22% 40 37% 120 82% 49 100%Fischer Street 24 130 130 100% 100% 100% 100%De Re 25 58 58 100% 100% 100% 100%Lismore Lifestyle 26 76 76 100% 100% 100% 100%Ballina Road 27 45 45 100% 100% 100% 100%Sanctuary Hill 28 71 71 100% 100% 100% 100%Ubrihein Estate 29 74 35 47% 39 100% 100% 100%Just StreetTotal 3713 988 27% 565 42% 560 57% 410 68%
2013 - 2018 2019 - 2023 2024 - 2028 2029 - 2033
Anticipated Residential Development
2. Anticipated Future Development The location and nature of anticipated future residential development within the Lismore urban area as advised by Council is shown in Figs 2.1.
Fig 2.1 Assumed Major Residential Development Capacity and Development Rate

Lismore Strategic Road Review 3rd May 2013
________________________________________________________________________________________________
________________________________________________________________________________________________ TTM Consulting (GC) Pty Ltd Page No. 3 Traffic . Parking . Acoustics TTM Ref : 34494Rep2
Zone
Primary
Development
Type
NameDevelopable Area
(ha)
GFA (sq.m.)
Office
GFA (sq.m.) Other
Commercial
GFA (sq.m.)
IndustrialGFA (sq.m.) Retail Residential Lots
Detached
Dwellings
Attached
Dwellings
(Medium
Density)
Apartments (High
Density)
1 Residential Chilcotts Grass (Tucki Creek) 22 116 68 95
2 Residential Holland Street 4 26 15 28
3 Residential Lagoons Grass 90 79 106
4 Residential North Lismore 110 1500 900 600
5 Residential Pineapple Road 150 332 199 266
6 Residential Invercauld Road 60 265 157 301
7 Residential Trinity Drive 89 - 178 260
8 Residential Waterford - - 24 42
9 Residential Crawford Land 74 213 128 170
9 Commercial Crawford Land - 2000
9 Recreation Crawford Land 12
10 Residential Monaltrie 140
11 Commercial South Lismore Airport Industrial Estate 14 56000
12 Commercial CBD - 15699 28301 16
13 Industrial Gonnellabah 6 25840
14 Industrial East Lismore 6 1592 -1
15 Industrial North Lismore 0 2800
16 Industrial North Lismore Industrial Area 5 18040 -24
17 Industrial Rezoned Land 5 18800
18 Industrial Caniaba Street 13 52000
19 Industrial South Lismore Industrial (Wyrain Estate) 11 44000
20 Industrial Rezoned Land 5 21600
21 Industrial South Lismore Industrial North Hollingsworth Ck 8 32120 -86
22 Industrial South Lismore Industrial South Hollingsworth Ck 13 51576 -3
23 Industrial Wyrallah Road 12 49600
24 Residential Fishcer Street - - 130
25 Residential De Re - - 58
26 Residential Lismore Lifestyle - - 76
27 Residential Ballina Road - - 45
28 Residential Sanctuary Hills - 93 93
29 Residential Urbihein Estate - - 74
15699 317968 28301 2545 2110 1868 16
Development Potential
Total
Fig 2.2 shows a summary of the assumed location and capacity of residential, commercial, industrial and retail development for each of the adopted development zones through to 2033 based on advice from Council.
Fig 2.2 Assumed Capacity for Major Residential, Industrial and Commercial Development
- l .:!!. -
'
'
'
' _j
'
Lismore Strategic Road Review 3rd May 2013
________________________________________________________________________________________________
________________________________________________________________________________________________ TTM Consulting (GC) Pty Ltd Page No. 4 Traffic . Parking . Acoustics TTM Ref : 34494Rep2
Zone
Primary
Development
Type
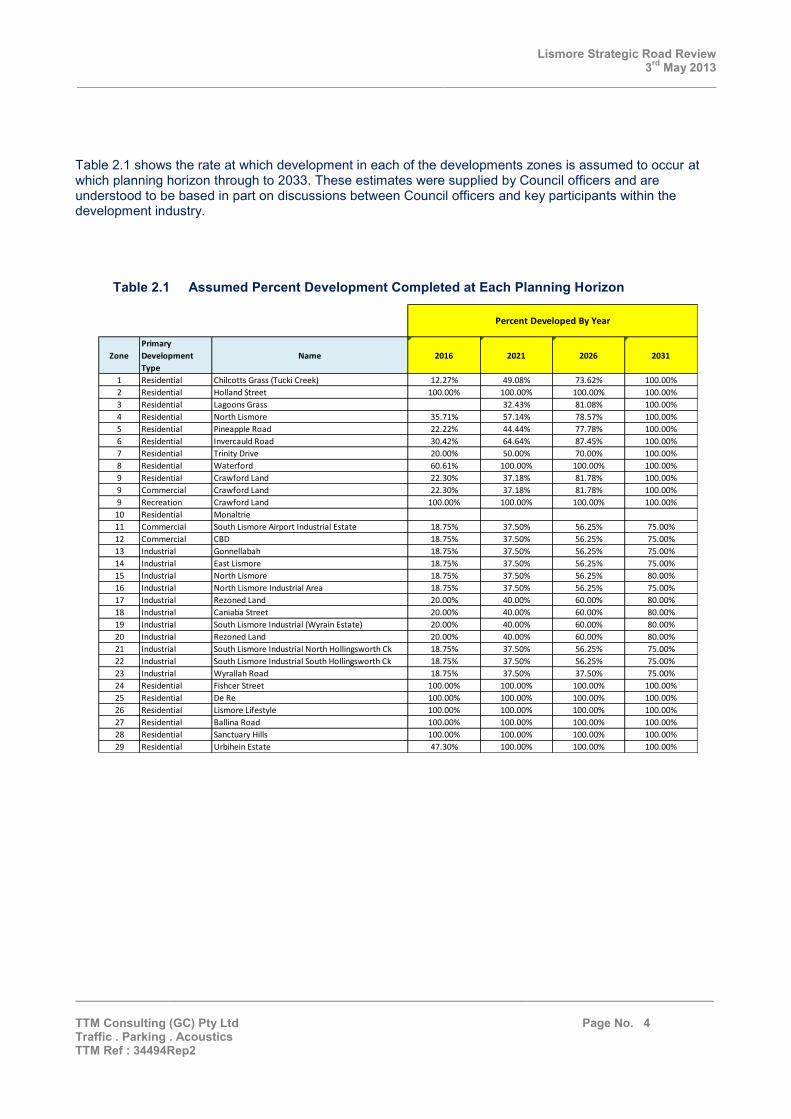
Name 2016 2021 2026 2031
1 Residential Chilcotts Grass (Tucki Creek) 12.27% 49.08% 73.62% 100.00%
2 Residential Holland Street 100.00% 100.00% 100.00% 100.00%
3 Residential Lagoons Grass 32.43% 81.08% 100.00%
4 Residential North Lismore 35.71% 57.14% 78.57% 100.00%
5 Residential Pineapple Road 22.22% 44.44% 77.78% 100.00%
6 Residential Invercauld Road 30.42% 64.64% 87.45% 100.00%
7 Residential Trinity Drive 20.00% 50.00% 70.00% 100.00%
8 Residential Waterford 60.61% 100.00% 100.00% 100.00%
9 Residential Crawford Land 22.30% 37.18% 81.78% 100.00%
9 Commercial Crawford Land 22.30% 37.18% 81.78% 100.00%
9 Recreation Crawford Land 100.00% 100.00% 100.00% 100.00%
10 Residential Monaltrie
11 Commercial South Lismore Airport Industrial Estate 18.75% 37.50% 56.25% 75.00%
12 Commercial CBD 18.75% 37.50% 56.25% 75.00%
13 Industrial Gonnellabah 18.75% 37.50% 56.25% 75.00%
14 Industrial East Lismore 18.75% 37.50% 56.25% 75.00%
15 Industrial North Lismore 18.75% 37.50% 56.25% 80.00%
16 Industrial North Lismore Industrial Area 18.75% 37.50% 56.25% 75.00%
17 Industrial Rezoned Land 20.00% 40.00% 60.00% 80.00%
18 Industrial Caniaba Street 20.00% 40.00% 60.00% 80.00%
19 Industrial South Lismore Industrial (Wyrain Estate) 20.00% 40.00% 60.00% 80.00%
20 Industrial Rezoned Land 20.00% 40.00% 60.00% 80.00%
21 Industrial South Lismore Industrial North Hollingsworth Ck 18.75% 37.50% 56.25% 75.00%
22 Industrial South Lismore Industrial South Hollingsworth Ck 18.75% 37.50% 56.25% 75.00%
23 Industrial Wyrallah Road 18.75% 37.50% 37.50% 75.00%
24 Residential Fishcer Street 100.00% 100.00% 100.00% 100.00%
25 Residential De Re 100.00% 100.00% 100.00% 100.00%
26 Residential Lismore Lifestyle 100.00% 100.00% 100.00% 100.00%
27 Residential Ballina Road 100.00% 100.00% 100.00% 100.00%
28 Residential Sanctuary Hills 100.00% 100.00% 100.00% 100.00%
29 Residential Urbihein Estate 47.30% 100.00% 100.00% 100.00%
Percent Developed By Year
Table 2.1 shows the rate at which development in each of the developments zones is assumed to occur at which planning horizon through to 2033. These estimates were supplied by Council officers and are understood to be based in part on discussions between Council officers and key participants within the development industry.
Table 2.1 Assumed Percent Development Completed at Each Planning Horizon

Lismore Strategic Road Review 3rd May 2013
________________________________________________________________________________________________
________________________________________________________________________________________________ TTM Consulting (GC) Pty Ltd Page No. 5 Traffic . Parking . Acoustics TTM Ref : 34494Rep2
Development Type Unit Vehs / Day / Unit
Dethatched Dwelling Dwelling 6.50
Attached Dwelling (Medium
Density)Dwelling 4.00
Apartments (High Density) Dwelling 2.00
Office 100 sq.m. Gfa 16.00
Retail 100 sq.m. Gfa 40.00
Retail/Commercial Mix 100 sq.m. Gfa 30.00
Industrial 100 sq.m. Gfa 5.00
Zone
Primary
Development
Type
Name
Percentage
Developed by
2018
Daily Trips
Percentage
Developed by
2023
Daily Trips
Percentage
Developed by
2028
Daily Trips
Percentage
Developed by
2033
Daily Trips
1 Residential Chilcotts Grass (Tucki Creek) 12.27% 101 49.08% 403 73.62% 605 100.00% 822
2 Residential Holland Street 100.00% 210 100.00% 210 100.00% 210 100.00% 210
3 Residential Lagoons Grass 32.43% 304 81.08% 760 100.00% 938
4 Residential North Lismore 35.71% 2946 57.14% 4714 78.57% 6482 100.00% 8250
5 Residential Pineapple Road 22.22% 524 44.44% 1048 77.78% 1833 100.00% 2357
6 Residential Invercauld Road 30.42% 677 64.64% 1438 87.45% 1945 100.00% 2225
7 Residential Trinity Drive 20.00% 439 50.00% 1099 70.00% 1538 100.00% 2197
8 Residential Waterford 60.61% 196 100.00% 324 100.00% 324 100.00% 324
9 Residential Crawford Land 22.30% 337 37.18% 562 81.78% 1237 100.00% 1512
9 Commercial Crawford Land 22.30% 134 37.18% 223 81.78% 491 100.00% 600
9 Recreation Crawford Land 100.00% 490 100.00% 490 100.00% 490 100.00% 490
10 Residential Monaltrie
11 Commercial South Lismore Airport Industrial Estate 18.75% 3150 37.50% 6300 56.25% 9450 75.00% 12600
12 Commercial CBD 18.75% 2594 37.50% 5187 56.25% 7781 75.00% 10374
13 Industrial Gonnellabah 18.75% 242 37.50% 485 56.25% 727 75.00% 969
14 Industrial East Lismore 18.75% 14 37.50% 27 56.25% 41 75.00% 55
15 Industrial North Lismore 18.75% 26 37.50% 53 56.25% 79 80.00% 112
16 Industrial North Lismore Industrial Area 18.75% 140 37.50% 280 56.25% 420 75.00% 560
17 Industrial Rezoned Land 20.00% 188 40.00% 376 60.00% 564 80.00% 752
18 Industrial Caniaba Street 20.00% 520 40.00% 1040 60.00% 1560 80.00% 2080
19 Industrial South Lismore Industrial (Wyrain Estate) 20.00% 440 40.00% 880 60.00% 1320 80.00% 1760
20 Industrial Rezoned Land 20.00% 216 40.00% 432 60.00% 648 80.00% 864
21 Industrial South Lismore Industrial North Hollingsworth Ck 18.75% 196 37.50% 393 56.25% 589 75.00% 785
22 Industrial South Lismore Industrial South Hollingsworth Ck 18.75% 480 37.50% 960 56.25% 1440 75.00% 1919
23 Industrial Wyrallah Road 18.75% 465 37.50% 930 37.50% 930 75.00% 1860
24 Residential Fishcer Street 100.00% 845 100.00% 845 100.00% 845 100.00% 845
25 Residential De Re 100.00% 377 100.00% 377 100.00% 377 100.00% 377
26 Residential Lismore Lifestyle 100.00% 494 100.00% 494 100.00% 494 100.00% 494
27 Residential Ballina Road 100.00% 293 100.00% 293 100.00% 293 100.00% 293
28 Residential Sanctuary Hills 100.00% 605 100.00% 605 100.00% 605 100.00% 605
29 Residential Urbihein Estate 47.30% 227 100.00% 481 100.00% 481 100.00% 481
17566 31250 44557 57708Total
2018 2023 2028 2033
3. Estimated Daily Traffic Generation 3.1 Traffic Generation Rates Table 3.1 shows traffic generation rates were assumed in all traffic generation estimates. It should be noted that these traffic generation rates refer only to trips made across or having one trips end in close proximity to the boundary of each of the zones numbered A through to AK in Fig 2.2. For example it was nominally assumed that approximately 10% of trips generated by residential development remained within or in close proximity to each development zone. The adopted rates taken from the Gold Coast City Council Transport Infrastructure Contributions Scheme and have been found by TTM to be reasonably representative of average trip generation for each category of urban development.
Table 3.1 Assumed Traffic Generation Rates 3.2 Estimated Current and Future Traffic Generation Tables 3.2 and 3.3 show estimated 2013 and planning horizon traffic generation based on the above traffic generation rates, existing development estimates based partly on aerial photography, known traffic volumes and estimates made in the AIMSUN model during model calibration. Table 3.2 Estimated Future Development Traffic Generation Increases (Veh Trips / Day)
111111 111111 111111 111111

Lismore Strategic Road Review 3rd May 2013
________________________________________________________________________________________________
________________________________________________________________________________________________ TTM Consulting (GC) Pty Ltd Page No. 6 Traffic . Parking . Acoustics TTM Ref : 34494Rep2
Source 2013 2018 2023 2028 2033
Lismore Development 89709 107275 120959 134266 147417
% p.a Growth Relative
to 20133.64% 3.03% 2.72% 2.51%
Through 17147 18932 20902 23078 25480
Total 106856 126206 141861 157343 172897
Summary of Estimated Traffic Generation
Table 3.3 Estimated Vehicle Trips Per Day (Weekday) Lismore Urban Area Note : Through traffic is based on average growth at 2% p.a.
The estimates indicate that traffic over the next 15 years will grow at an average annual rate of approximately 3% based on the expected development over the period. Over the next 20 years the increase in traffic generation due to development within Lismore is likely to be in the order of 65%. The above estimates formed the basis of traffic assignments and road network assessments performed within the AIMSUN model for each of planning horizons.

Lismore Strategic Road Review 3rd May 2013
________________________________________________________________________________________________
________________________________________________________________________________________________ TTM Consulting (GC) Pty Ltd Page No. 7 Traffic . Parking . Acoustics TTM Ref : 34494Rep2
4. Past Studies 4.1 Lismore CBD Traffic Study (2004) This study was conducted by TTM Consulting Pty Ltd for Lismore Council. The objective of the study was primarily to identify future road, traffic and parking management actions which would make a positive contribution towards CBD amenity. The primary finding of the study in respect to future CBD and wider road network requirements was that traffic demands would approach the combined capacity of the Wilson River bridges at Ballina Road, Woodlark Street and Winterton Road (Simes Bge) shortly after 2013. This conclusion is represented in Fig 4.1 which is an extract from the study.
Fig 4.1 Estimated Future Traffic Demands and Bridge Capacities Wilson River Bridge Crossings Traffic Demands and Capacities
A summary of the primary recommendations from the study are shown in Fig 4.2.
Fig 4.2 Lismore CBD Traffic Study Summary of Recommendations
~.., ...... . -h- llffll(fllnoll • .-.... ...
u,,.,._,IIMio fi .,..._.._•uh--. , ..
w,~ ... ,...,, ~ ----~ D,111ki,I 1..,....1il'lit
~ftl'IA'IOCti•CIO
Btldgt Capaictrlt• and Ttafflo Oem&nds
#-JI ttf:ftt

Lismore Strategic Road Review 3rd May 2013
________________________________________________________________________________________________
________________________________________________________________________________________________ TTM Consulting (GC) Pty Ltd Page No. 8 Traffic . Parking . Acoustics TTM Ref : 34494Rep2
The study particularly considered the potential benefits of constructing new bridges over the River to the immediate north of the CBD and to the south of Ballina Road, generally in locations shown in Fig 4.3.
Fig 4.3 The Potential Benefits of New River Crossings on CBD Amenity
The study also concluded that the potential benefit to the CBD of a new river crossing to the north of the CBD reduces considerably for more northerly bridge locations than shown in Fig 4.3. Recent traffic counts and road network experience and observations suggest that the 2004 study findings remain relevant insofar as they support the need to continue to plan and provide for future river crossings, generally as described in the 2004 study. This relevance particularly applies to the need to plan and provide for a new river crossing to the immediate north of the CBD.
Lismore Strategic Road Review 3rd May 2013
________________________________________________________________________________________________
________________________________________________________________________________________________ TTM Consulting (GC) Pty Ltd Page No. 9 Traffic . Parking . Acoustics TTM Ref : 34494Rep2
4.2 Bruxner Highway Corridor Study (2009) This study was conducted by TTM Consulting Pty Ltd for Lismore Council. The objective of the study was primarily to identify future road and traffic managememt requirements necessary to maintain the long term function of the Lismore road network within the Bruxner Highway corridor. The study included the preparation of an AIMSUN traffic assignment road network model based on peak hour traffic demands. This differs from the current study which was based on assessing road network requirements based on daily traffic demands. The advantages of a model based on hourly traffic demands is that it facilitates assessments of intersection performance whereas a model based on daily flows only facilitates overall road network link assessments. The 2009 study described the following conclusions regarding network deficiencies.
Assessment of the model for the existing network identified a number of deficiencies, most significantly:
high percentage of local traffic utilising Bruxner Highway
limited alternative routes within and throughout Lismore
ongoing development and background traffic growth will further exacerbate existing congestion along Bruxner Highway
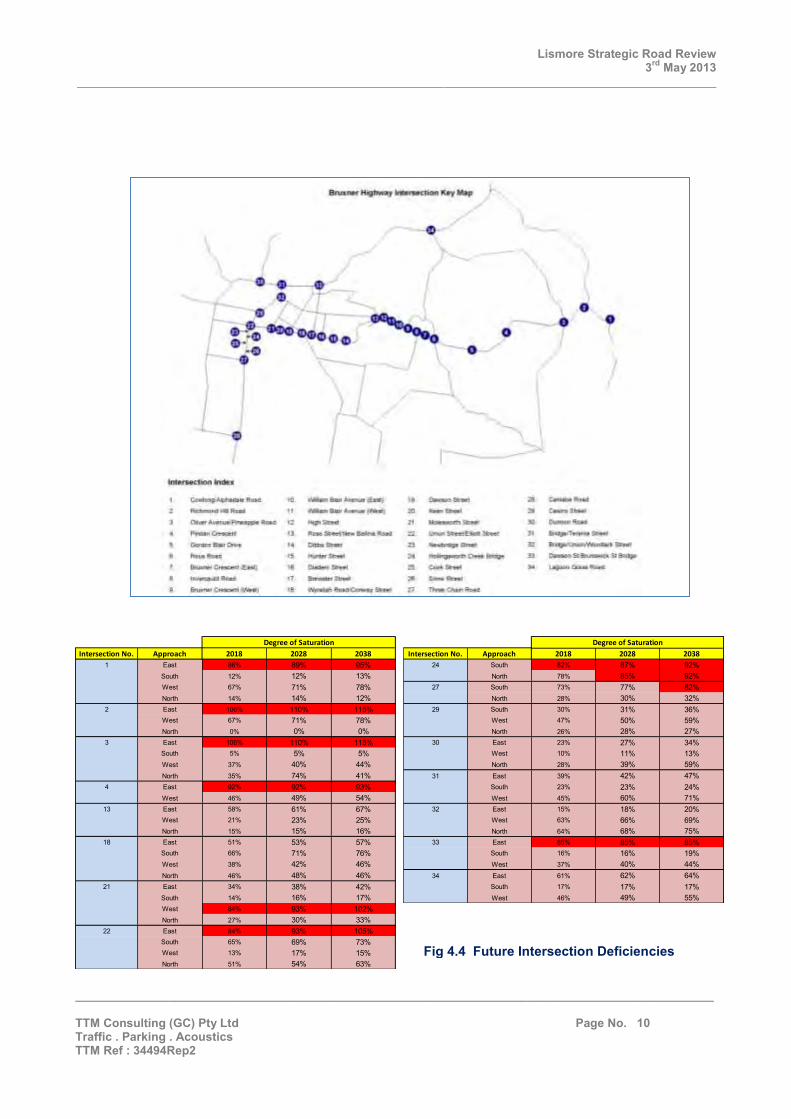
An assessment of the future operation of intersections along Bruxner Highway and other selected locations was also made in order to establish the need for intersection upgrades. This assessment is shown in Fig 4.4. The study ultimately identified future road network requirements required to accommodate background and development traffic growth at the end of 30-year period. These are shown in Fig 4.5.
Lismore Strategic Road Review 3rd May 2013
________________________________________________________________________________________________
________________________________________________________________________________________________ TTM Consulting (GC) Pty Ltd Page No. 10 Traffic . Parking . Acoustics TTM Ref : 34494Rep2
Intersection No. Approach 2018 2028 2038
1 East 86% 89% 95%South 12% 12% 13%West 67% 71% 78%North 14% 14% 12%
2 East 106% 110% 115%West 67% 71% 78%North 0% 0% 0%
3 East 106% 110% 115%South 5% 5% 5%West 37% 40% 44%North 35% 74% 41%
4 East 92% 92% 93%West 46% 49% 54%
13 East 58% 61% 67%West 21% 23% 25%North 15% 15% 16%
18 East 51% 53% 57%South 66% 71% 76%West 38% 42% 46%North 46% 48% 46%
21 East 34% 38% 42%South 14% 16% 17%West 84% 93% 102%North 27% 30% 33%
22 East 84% 93% 105%South 65% 69% 73%West 13% 17% 15%North 51% 54% 63%
Degree of Saturation
Intersection No. Approach 2018 2028 2038
24 South 82% 87% 92%North 78% 85% 92%
27 South 73% 77% 82%North 28% 30% 32%
29 South 30% 31% 36%West 47% 50% 59%North 26% 28% 27%
30 East 23% 27% 34%West 10% 11% 13%North 28% 39% 59%
31 East 39% 42% 47%South 23% 23% 24%West 45% 60% 71%
32 East 15% 18% 20%West 63% 66% 69%North 64% 68% 75%
33 East 85% 85% 85%South 16% 16% 19%West 37% 40% 44%
34 East 61% 62% 64% South 17% 17% 17% West 46% 49% 55%
Degree of Saturation
Fig 4.4 Future Intersection Deficiencies
• • 0
I

Lismore Strategic Road Review 3rd May 2013
________________________________________________________________________________________________
________________________________________________________________________________________________ TTM Consulting (GC) Pty Ltd Page No. 11 Traffic . Parking . Acoustics TTM Ref : 34494Rep2
Fig 4.4 Future Road Network Requirements (2037)
'-l I V
""·- ... - ·L
• . .. ·-·-
2 4
kilometres - Existing Roads - Proposed New Roads
Lismore Strategic Road Review 3rd May 2013
________________________________________________________________________________________________
________________________________________________________________________________________________ TTM Consulting (GC) Pty Ltd Page No. 12 Traffic . Parking . Acoustics TTM Ref : 34494Rep2
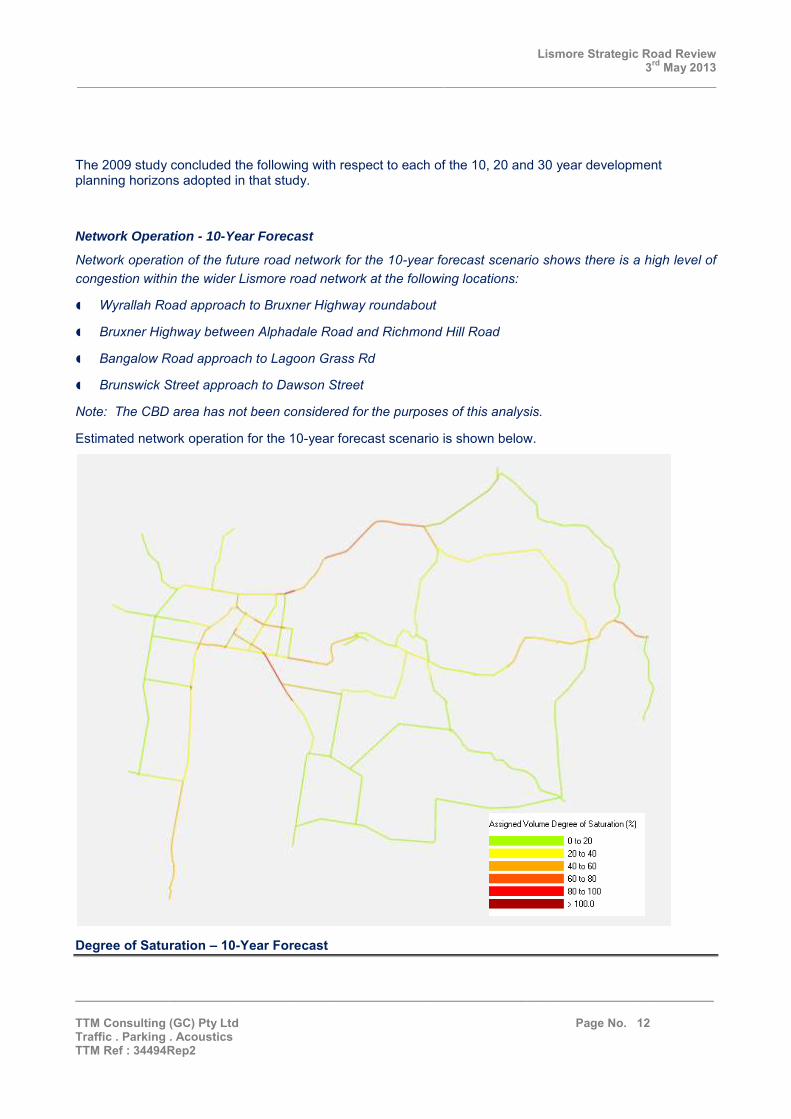
The 2009 study concluded the following with respect to each of the 10, 20 and 30 year development planning horizons adopted in that study.
Network Operation - 10-Year Forecast
Network operation of the future road network for the 10-year forecast scenario shows there is a high level of congestion within the wider Lismore road network at the following locations:
Wyrallah Road approach to Bruxner Highway roundabout
Bruxner Highway between Alphadale Road and Richmond Hill Road
Bangalow Road approach to Lagoon Grass Rd
Brunswick Street approach to Dawson Street
Note: The CBD area has not been considered for the purposes of this analysis.
Estimated network operation for the 10-year forecast scenario is shown below.
Degree of Saturation – 10-Year Forecast
Assigned Volume Degree of Saturation[%)
0 to 20
20 to 40 40 to 60 60 to 80 80 to 100
> 100.0
Lismore Strategic Road Review 3rd May 2013
________________________________________________________________________________________________
________________________________________________________________________________________________ TTM Consulting (GC) Pty Ltd Page No. 13 Traffic . Parking . Acoustics TTM Ref : 34494Rep2
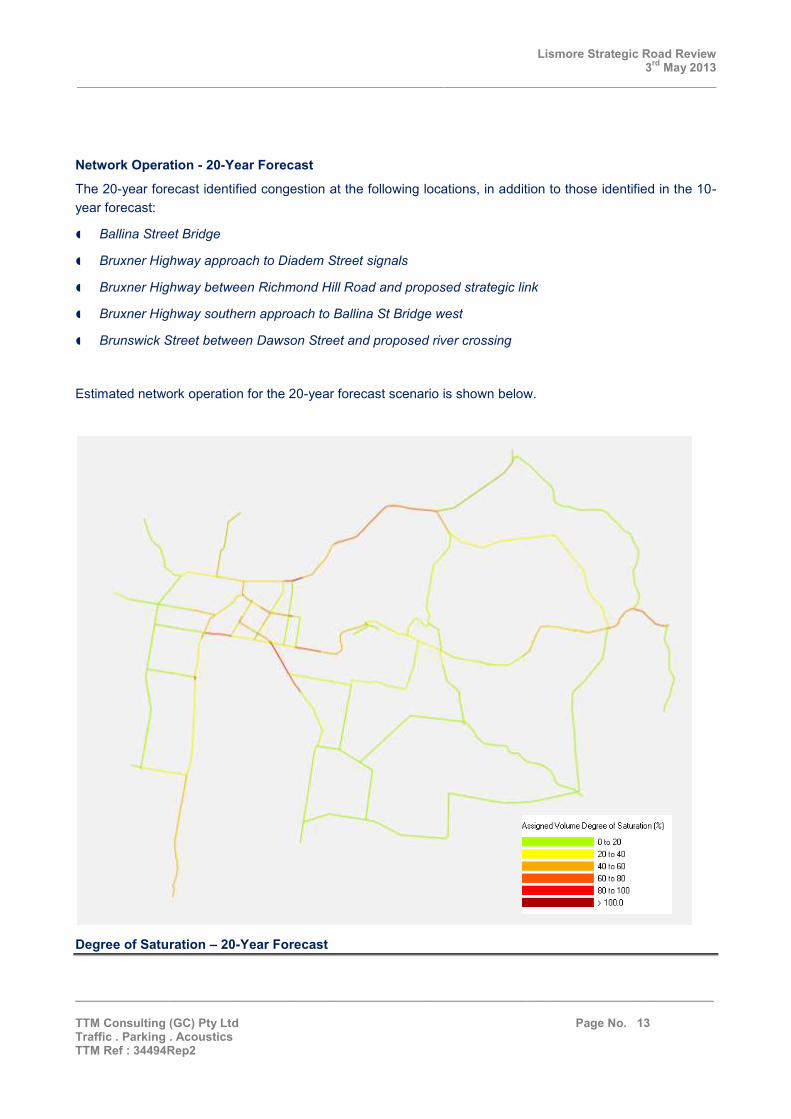
Network Operation - 20-Year Forecast
The 20-year forecast identified congestion at the following locations, in addition to those identified in the 10-year forecast:
Ballina Street Bridge
Bruxner Highway approach to Diadem Street signals
Bruxner Highway between Richmond Hill Road and proposed strategic link
Bruxner Highway southern approach to Ballina St Bridge west
Brunswick Street between Dawson Street and proposed river crossing
Estimated network operation for the 20-year forecast scenario is shown below.
Degree of Saturation – 20-Year Forecast
Assigned Volume Degree of Saturation IZ)
0 lo 20 20 to 40 40 to 60 60 to 80 80 to 100 > 100.0
Lismore Strategic Road Review 3rd May 2013
________________________________________________________________________________________________
________________________________________________________________________________________________ TTM Consulting (GC) Pty Ltd Page No. 14 Traffic . Parking . Acoustics TTM Ref : 34494Rep2
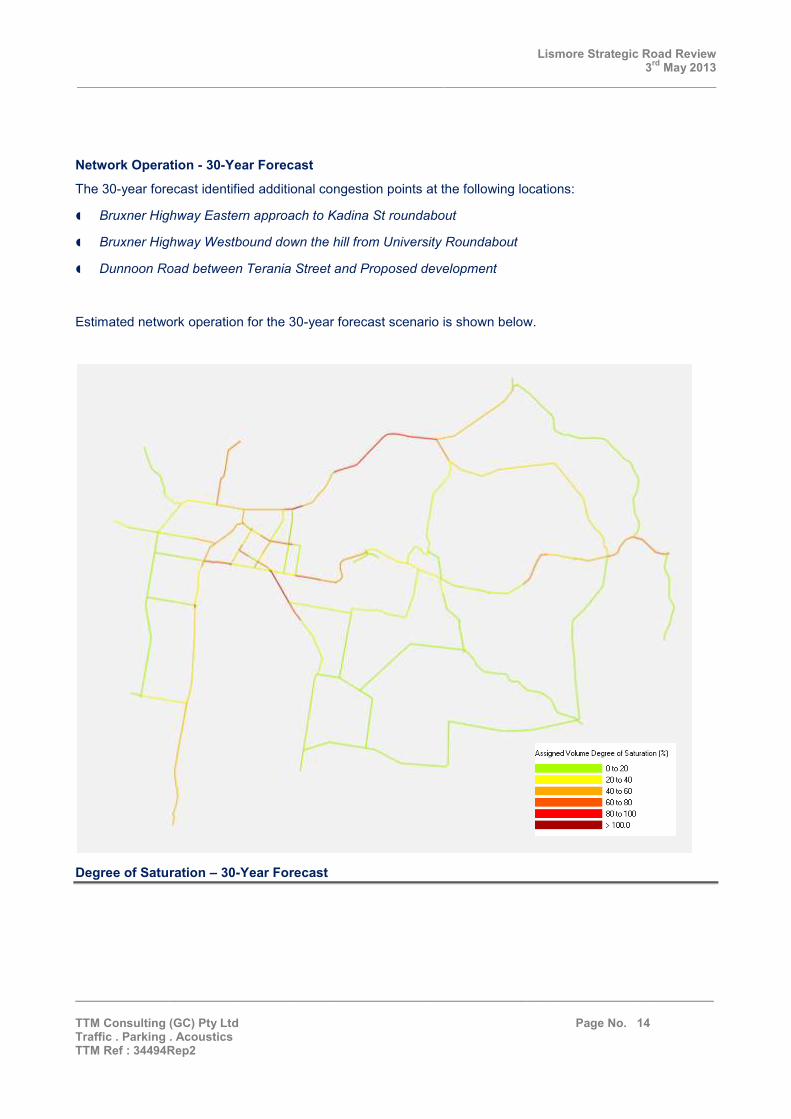
Network Operation - 30-Year Forecast
The 30-year forecast identified additional congestion points at the following locations:
Bruxner Highway Eastern approach to Kadina St roundabout
Bruxner Highway Westbound down the hill from University Roundabout
Dunnoon Road between Terania Street and Proposed development
Estimated network operation for the 30-year forecast scenario is shown below.
Degree of Saturation – 30-Year Forecast
r
Assigned Volume Degree of Saturation [%)
0 to 20 20 to 40 40 lo 60 60 lo 80 80 lo 100 > 100.0

Lismore Strategic Road Review 3rd May 2013
________________________________________________________________________________________________
________________________________________________________________________________________________ TTM Consulting (GC) Pty Ltd Page No. 15 Traffic . Parking . Acoustics TTM Ref : 34494Rep2
The 2009 study recommended the following works within the 30 year planning horizon adopted for the study.
Recommended Upgrade Works
Timeframe for works Location Recommended Upgrade
10 years Intersection 2. Richmond Hill Rd Intersection upgrade required,
requires detailed analysis
10 years Intersection 3. Oliver Avenue/Pineapple Rd Intersection upgrade required,
requires detailed analysis
20 years Intersection 4. Pindari Crescent Intersection upgrade required,
requires detailed analysis
20 years Intersection 21. Molesworth St Upgrade to signals as per CBD
Study WP4
20 years Intersection 22. Union/Elliott St Intersection upgrade required,
requires detailed analysis
30 years Intersection 1. Cowlong/Alphadale Rd Intersection upgrade required,
requires detailed analysis
30 years Section 24. Hollingsworth Ck Bridge Lane duplication to be maintained at
creek crossing
30 years Intersection 27. Three Chain Rd Intersection upgrade required,
requires detailed analysis
30 years Intersection 33. Dawson St/Brunswick St
bridge
Upgrade to signals as per CBD
Study WP4
The 2009 report referred to a previous TTM study in 2007 involving the assessment of future operation of the intersection of Ballina Road (Bruxner Hwy) and Rous Road. This assessment was prompted by the requirement for a future road link to the north to facilitate proposed residential subdivisions. The analysis of the intersection showed that under projected traffic growth the existing roundabout would reach full operating capacity in 2012.
The inclusion of a northern approach to the intersection and subsequent traffic generated by the proposed 275 residential allotments up to 2017 resulted in the capacity of a roundabout being exceeded. A recommendation was made to signalise the intersection.
Lismore Strategic Road Review 3rd May 2013
________________________________________________________________________________________________
________________________________________________________________________________________________ TTM Consulting (GC) Pty Ltd Page No. 16 Traffic . Parking . Acoustics TTM Ref : 34494Rep2
Key recommendations of the 2009 study were :
Existing non-compliant median treatments in vicinity of Dibbs Street and east of High Street should be replaced with concrete median as per Section 3.5 of the RTA Road Design Guide.
A concrete median should be installed to limit property access to left in left out from Wyrallah Road to Kadina Street.
Analysis of crash data indicates curve alignment in the vicinity of Sunrise Crescent may be a contributing factor. TTM recommended installation of chevron alignment markers (D4-68) and curve warning signs (W1-3B) to highlight curve.
The following intersections with Ballina Road (Bruxner Highway) require modification in the short term:
A. William Blair Avenue – West: Prohibit right turn from William Blair Avenue. Right turn from Ballina Road maintained due to additional travel distance exceeding 2000m.
B. William Blair Avenue – East: New median to limit access to left in left out.
The following intersections require further investigation, inclusive of microsimulation, road reserve limitations, budgetry constraints, etc, to confirm upgrade requirements:
A. Union Street (Bruxner Highway) / Newbridge Street / Foley Road
Requires upgrade to include right turn lanes as part of future project to widen the bridge over Hollingsworth Creek.
B. Ballina Road (Bruxner Highway) / High Street: does not meet design standards.
TTM recommended widening and lengthening of right turn lane and increasing width of median to improve protection for right turn movements from High Street.
C. Ballina Road (Bruxner Highway) / Invercauld Road
TTM recommended that further investigation be undertaken to determine the requirement for signalisation of this intersection with reference made to RTA Warrants for Signalised Intersections.
D. Ballina Road (Bruxner Highway) / Rous Road
Based on a previous assessment of this intersection in 2007, TTM recommended an upgrade to signals in the event that a northern approach be required to facilitate access to future residential development.
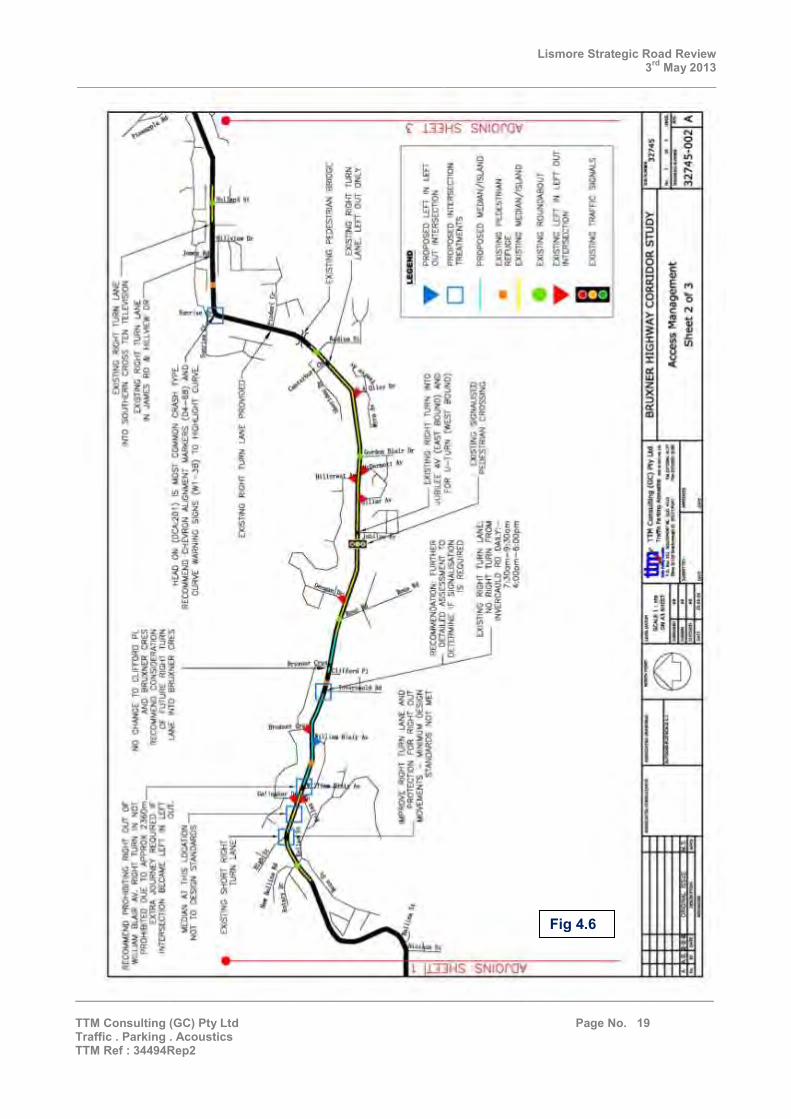
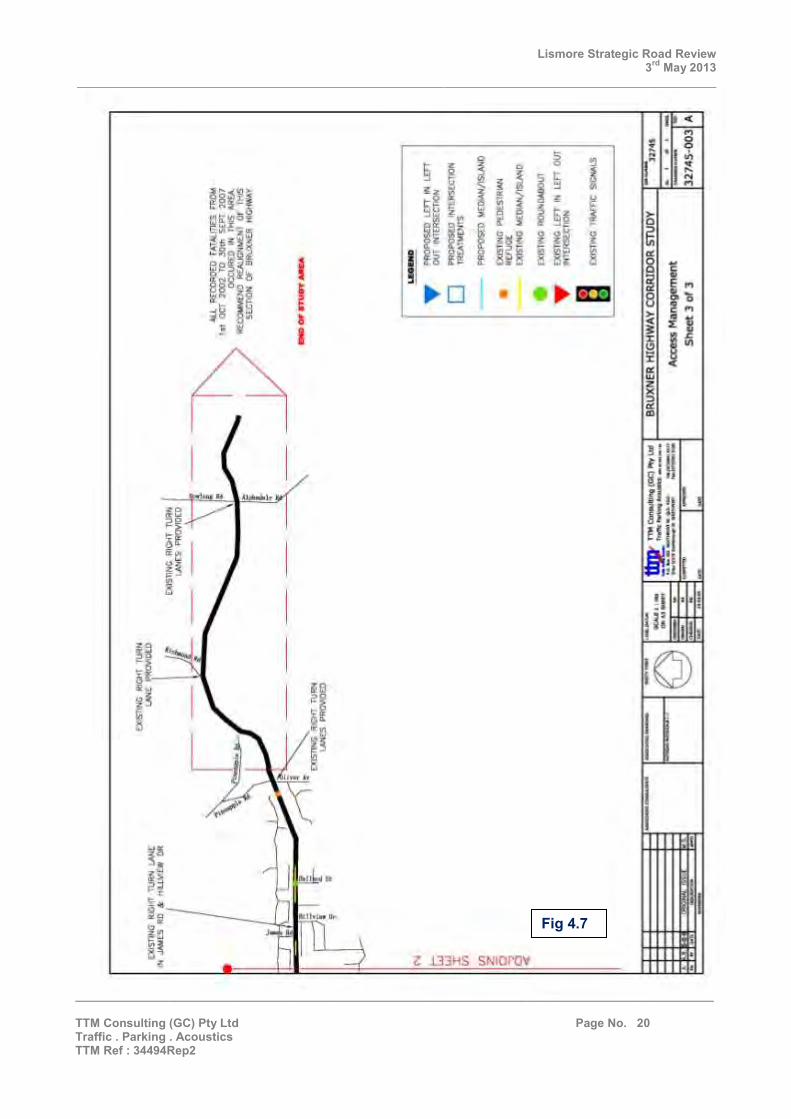
TTM also recommended Bruxner Highway access management plans shown in Figs 4.5, 4.6 and 4.7.

Lismore Strategic Road Review 3rd May 2013
________________________________________________________________________________________________
________________________________________________________________________________________________ TTM Consulting (GC) Pty Ltd Page No. 17 Traffic . Parking . Acoustics TTM Ref : 34494Rep2
4.3 Comment The translation of the findings of past studies into matters addressed in this report should have regard to the fact that development in and about Lismore (and the region in general) and associated traffic growth has not occurred at rates assumed in these past studies. Also, it is important to appreciate that these past studies were based on peak hour traffic estimates, whereas estimates made in this study refer to daily traffic movements. These two approaches to making future traffic demand estimates can potentially yield considerably different conclusions regarding the capacity of the road network to accommodate future traffic demands. For example, peak hour traffic demands generally represent approximately 10% of total daily traffic movement and approximately 12.5% of traffic occurring in the weekday period between 7am and 7pm. Consequently, a road or intersection which has considerable capacity to satisfy daily traffic demands may be inadequate to satisfy peak hour traffic demands. Daily traffic demand estimates are typically suited to developing macro-level or strategic road network plans of the type generated from this study whereas peak hour traffic estimates are suited to making decisions regarding micro-network planning related to intersection management localised points of traffic congestion.

Lismore Strategic Road Review 3rd May 2013
________________________________________________________________________________________________
________________________________________________________________________________________________ TTM Consulting (GC) Pty Ltd Page No. 18 Traffic . Parking . Acoustics TTM Ref : 34494Rep2
Fig 4.5
D
Lismore Strategic Road Review 3rd May 2013
________________________________________________________________________________________________
________________________________________________________________________________________________ TTM Consulting (GC) Pty Ltd Page No. 19 Traffic . Parking . Acoustics TTM Ref : 34494Rep2
Fig 4.6
t
t I
Lismore Strategic Road Review 3rd May 2013
________________________________________________________________________________________________
________________________________________________________________________________________________ TTM Consulting (GC) Pty Ltd Page No. 20 Traffic . Parking . Acoustics TTM Ref : 34494Rep2
Fig 4.7
►
I
d
Lismore Strategic Road Review 3rd May 2013
________________________________________________________________________________________________
________________________________________________________________________________________________ TTM Consulting (GC) Pty Ltd Page No. 21 Traffic . Parking . Acoustics TTM Ref : 34494Rep2
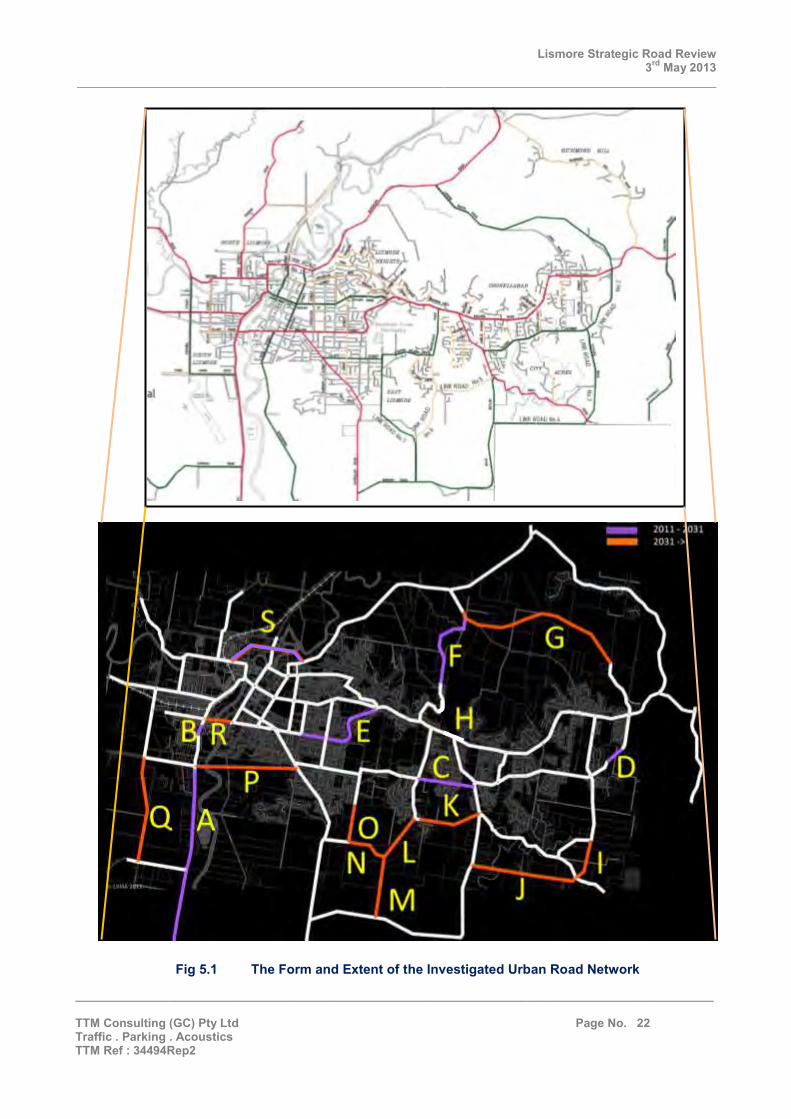
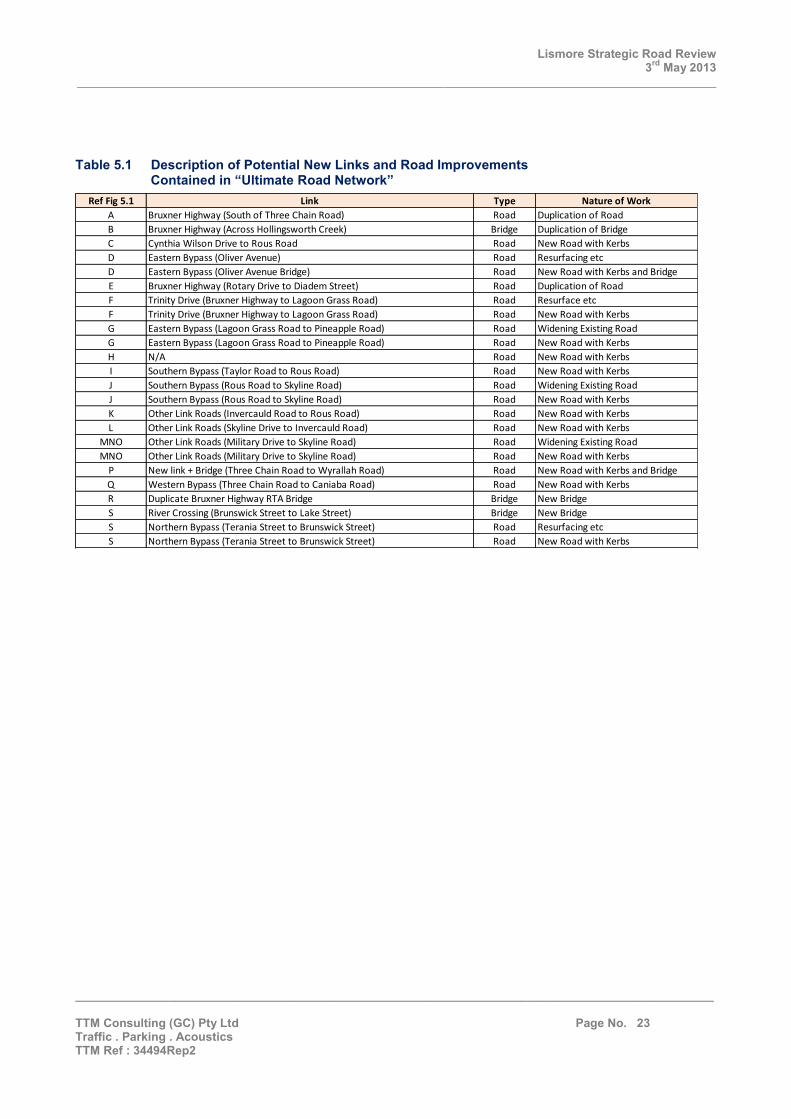
5. The Investigated Urban Road Network Extent This study commenced with identifying all potential future road links and improvements which had been the subject of past proposals and/or investigations or which in the view of the consultant and Council officers may become desirable depending on the rate and distribution of future development and construction costs. All identified potential future links and improvements were then inserted into what was termed the “Ultimate Road Network”, defined as that network which would be desirable without regard to cost. This network provided the basis for undertaking a study into likely construction costs, feasibilities and justifications for each future road link and improvement over each of the planning horizons. The form and extent of the “Ultimate Road Network” is shown in Fig 5.1. Table 5.1 provides a brief description of the nature of each potential future road link and improvement contained within the “Ultimate Road Network”.
Lismore Strategic Road Review 3rd May 2013
________________________________________________________________________________________________
________________________________________________________________________________________________ TTM Consulting (GC) Pty Ltd Page No. 22 Traffic . Parking . Acoustics TTM Ref : 34494Rep2
Fig 5.1 The Form and Extent of the Investigated Urban Road Network
Lismore Strategic Road Review 3rd May 2013
________________________________________________________________________________________________
________________________________________________________________________________________________ TTM Consulting (GC) Pty Ltd Page No. 23 Traffic . Parking . Acoustics TTM Ref : 34494Rep2
Ref Fig 5.1 Link Type Nature of Work
A Bruxner Highway (South of Three Chain Road) Road Duplication of Road
B Bruxner Highway (Across Hollingsworth Creek) Bridge Duplication of Bridge
C Cynthia Wilson Drive to Rous Road Road New Road with Kerbs
D Eastern Bypass (Oliver Avenue) Road Resurfacing etc
D Eastern Bypass (Oliver Avenue Bridge) Road New Road with Kerbs and Bridge
E Bruxner Highway (Rotary Drive to Diadem Street) Road Duplication of Road
F Trinity Drive (Bruxner Highway to Lagoon Grass Road) Road Resurface etc
F Trinity Drive (Bruxner Highway to Lagoon Grass Road) Road New Road with Kerbs
G Eastern Bypass (Lagoon Grass Road to Pineapple Road) Road Widening Existing Road
G Eastern Bypass (Lagoon Grass Road to Pineapple Road) Road New Road with Kerbs
H N/A Road New Road with Kerbs
I Southern Bypass (Taylor Road to Rous Road) Road New Road with Kerbs
J Southern Bypass (Rous Road to Skyline Road) Road Widening Existing Road
J Southern Bypass (Rous Road to Skyline Road) Road New Road with Kerbs
K Other Link Roads (Invercauld Road to Rous Road) Road New Road with Kerbs
L Other Link Roads (Skyline Drive to Invercauld Road) Road New Road with Kerbs
MNO Other Link Roads (Military Drive to Skyline Road) Road Widening Existing Road
MNO Other Link Roads (Military Drive to Skyline Road) Road New Road with Kerbs
P New link + Bridge (Three Chain Road to Wyrallah Road) Road New Road with Kerbs and Bridge
Q Western Bypass (Three Chain Road to Caniaba Road) Road New Road with Kerbs
R Duplicate Bruxner Highway RTA Bridge Bridge New Bridge
S River Crossing (Brunswick Street to Lake Street) Bridge New Bridge
S Northern Bypass (Terania Street to Brunswick Street) Road Resurfacing etc
S Northern Bypass (Terania Street to Brunswick Street) Road New Road with Kerbs
Table 5.1 Description of Potential New Links and Road Improvements Contained in “Ultimate Road Network”

Lismore Strategic Road Review 3rd May 2013
________________________________________________________________________________________________
________________________________________________________________________________________________ TTM Consulting (GC) Pty Ltd Page No. 24 Traffic . Parking . Acoustics TTM Ref : 34494Rep2
6. Estimated Construction Costs Table 6.1 shows the estimated cost of new roads and other works represented in the Ultimate Road Network shown in Fig 5.1.

Lismore Strategic Road Review 3rd May 2013
________________________________________________________________________________________________
________________________________________________________________________________________________ TTM Consulting (GC) Pty Ltd Page No. 25 Traffic . Parking . Acoustics TTM Ref : 34494Rep2
Ref
(Fig
5.1
)It
em
Upg
rade
Le
ngth
(m)
Wid
th (m
)A
rea
m2
m2
rate
LC
C Es
tim
ated
Co
stA
Bru
xner
Hig
hway
- (S
out
h o
f Th
ree
Cha
in R
oad
)D
uplic
atio
n o
f R
oad
20
0013
2600
016
0$4
,160
,000
BB
ruxn
er H
ighw
ay -
(Acr
oss
Ho
llins
wo
rth
Cre
ek)
Dup
licat
ion
of
Bri
dge
$6,0
00,0
00
CC
ynth
ia W
ilso
n D
rive
to
Ro
us R
oad
New
Ro
ad w
ith
Kerb
s12
0013
1560
018
0$6
,600
,000
DEa
ster
n B
yPas
s (O
liver
Ave
nue)
Res
urfa
cing
500
1365
0016
0$1
,040
,000
DEa
ster
n B
yPas
s (O
liver
Ave
nue
- B
ridg
e)N
ew R
oad
wit
h Ke
rbs
600
1378
0018
0$6
,005
,000
EB
ruxn
er H
ighw
ay (R
ota
ry D
rive
to
Dia
dem
Str
eet)
Dup
licat
ion
of
Ro
ad
2200
1226
400
180
$4,7
52,0
00
FTr
init
y D
rive
(Bru
xner
Hig
hway
to
Lag
oo
ns G
rass
Ro
ad)
Res
urfa
cing
1300
1114
300
160
$2,2
88,0
00
FTr
init
y D
rive
(Bru
xner
Hig
hway
to
Lag
oo
ns G
rass
Ro
ad)
New
Ro
ad w
ith
Kerb
s17
0013
2210
018
0$3
,978
,000
GEa
ster
n B
ypas
s (L
ago
ons
Gra
ss R
oad
to
Pin
eapp
le R
oad
)W
iden
ing
Exis
ting
Ro
ad21
0013
2730
016
0$4
,368
,000
GEa
ster
n B
ypas
s (L
ago
ons
Gra
ss R
oad
to
Pin
eapp
le R
oad
)N
ew R
oad
wit
h Ke
rbs
3700
1348
100
180
$8,6
58,0
00
ISo
uthe
rn B
ypas
s (T
aylo
r R
oad
to
Ro
us R
ous
)N
ew R
oad
wit
h Ke
rbs
900
1311
700
180
$2,1
06,0
00
JSo
uthe
rn B
ypas
s (R
ous
Ro
ad t
o S
kylin
e R
oad
)W
iden
ing
Exis
ting
Ro
ad10
0013
1300
016
0$2
,080
,000
JSo
uthe
rn B
ypas
s (R
ous
Ro
ad t
o S
kylin
e R
oad
)N
ew R
oad
wit
h Ke
rbs
1200
1315
600
180
$2,8
08,0
00
KO
ther
Lin
k R
oad
s (I
nver
caul
d R
oad
to
Ro
us R
oad
)N
ew R
oad
wit
h Ke
rbs
1300
1316
900
180
$3,0
42,0
00
LO
ther
Lin
k R
oad
s (S
kylin
e R
oad
to
Inve
rcau
ld R
oad
)N
ew R
oad
wit
h Ke
rbs
1300
1316
900
180
$3,0
42,0
00
MN
OO
ther
Lin
k R
oad
s (M
ilita
ry D
rive
to
Sky
line
Ro
ad )
Wid
enin
g Ex
isti
ng R
oad
600
1166
0016
0$1
,056
,000
MN
OO
ther
Lin
k R
oad
s (M
ilita
ry D
rive
to
Sky
line
Ro
ad )
New
Ro
ad w
ith
Kerb
s24
0011
2640
018
0$4
,752
,000
PN
ew L
ink
+ B
ridg
e (T
hree
Cha
in R
oad
to
Wyr
alla
h)N
ew R
oad
wit
h Ke
rbs
1500
1319
500
180
$30,
000,
000
QW
este
rn B
ypas
s (T
hree
Cha
in R
oad
to
Can
iaba
Ro
ad)
New
Ro
ad w
ith
Kerb
s22
0013
2860
018
0$5
,148
,000
RD
uplic
ate
Bru
xner
Hig
hway
RTA
Bri
dge
New
Bri
dge
0$4
2,00
0,00
0
SR
iver
Cro
ssin
g (B
runs
wic
k St
reet
to
Lak
e St
reet
)N
ew B
ridg
e0
$11,
000,
000
SN
ort
hern
Byp
ass
(Ter
ania
Str
eet
to B
runs
wic
k St
reet
)R
esur
faci
ng15
0013
1950
016
0$3
,120
,000
SN
ort
hern
Byp
ass
(Ter
ania
Str
eet
to B
runs
wic
k St
reet
)N
ew R
oad
wit
h Ke
rbs
500
1365
0018
0$1
,170
,000
Sub
-To
tal
$159
,173
,000
Upg
rade
LC
C Es
tim
ate
$1
Ric
hmo
nd H
ill/B
ruxn
er H
ighw
ayU
pgra
de
$750
,000
2In
verc
auld
Ro
ad/B
ruxn
er H
ighw
ayR
oun
dabo
ut$3
,200
,000
3O
liver
Ave
nue/
Pine
appl
e R
oad
Upg
rade
$1
,000
,000
4Pi
ndar
i Cre
scan
t/B
ruxn
er H
ighw
ayU
pgra
de
$750
,000
5M
ole
swo
rth
Stre
et/B
ruxn
er H
ighw
ayTr
affi
c Si
gnal
s$1
,500
,000
6U
nio
n St
reet
/ E
llio
tt S
tree
t Tr
affi
c Si
gnal
s$1
,500
,000
7R
ous
Ro
ad a
nd O
liver
Ave
nue
Inte
rsec
tio
nR
oun
dabo
ut
$800
,000
8C
ynth
ia W
ilso
n an
d In
verc
auld
Ro
ad In
ters
ecti
on
M
ini R
oun
dabo
ut
$200
,000
9El
izab
eth
Ave
and
Ro
us R
oad
Inte
rsec
tio
n
Min
i Ro
unda
bout
$2
00,0
00
10B
ruxn
er H
ighw
ay a
nd M
oun
tain
view
Dri
ve
Traf
fic
Sign
als
$1,5
00,0
00
11B
ruxn
er H
ighw
ay a
nd H
olla
nd S
tree
tR
oun
dabo
ut
$1,0
00,0
00
12H
olla
nd S
tree
t an
d O
liver
Ave
nue
Ro
unda
bout
$1
,000
,000
Sub
-To
tal
$13,
400,
000
TOTA
L$1
72,5
73,0
00
Inte
rsec
tio
ns
Esti
mat
ed R
oad
and
Inte
rsec
tion
Con
stru
ctio
n Co
sts
Table 6.1

Lismore Strategic Road Review 3rd May 2013
________________________________________________________________________________________________
________________________________________________________________________________________________ TTM Consulting (GC) Pty Ltd Page No. 26 Traffic . Parking . Acoustics TTM Ref : 34494Rep2
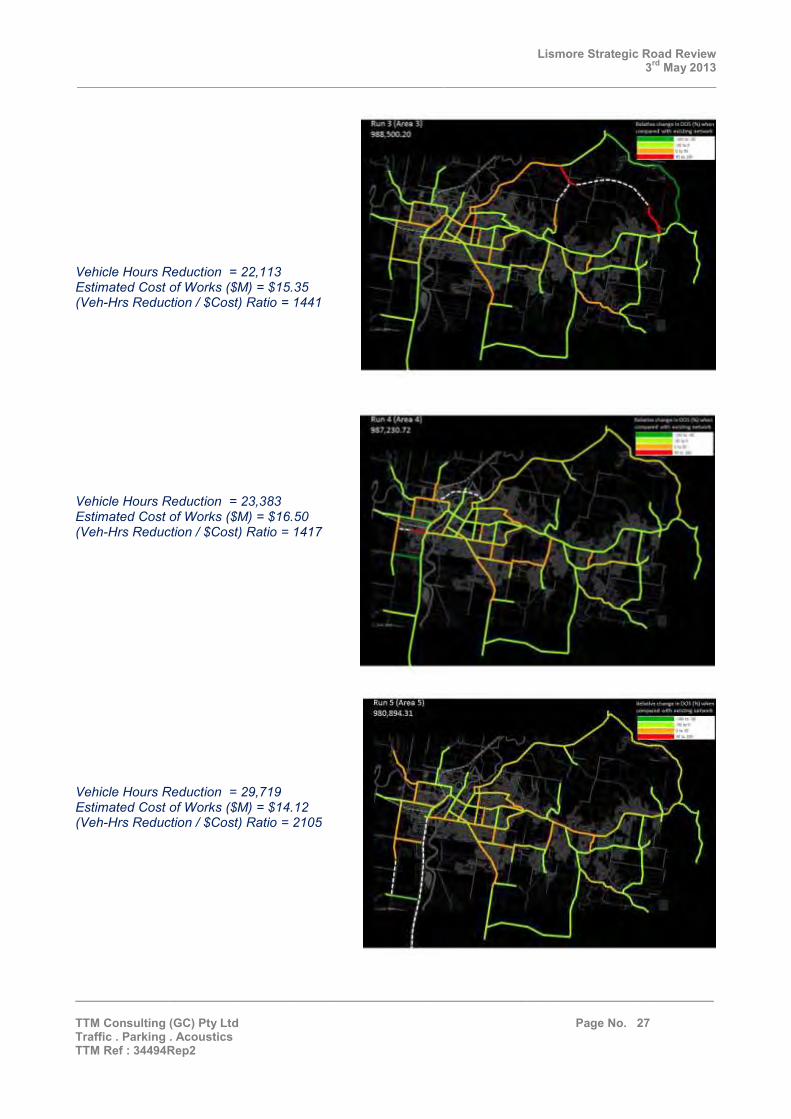
7. The Estimated Effectiveness of Desirable Future Road Links The effectiveness of road network link improvements was estimated from the AIMSUN model for trip making within the 2033 development planning horizon. The purpose of this testing was to enable a comparison of the cost effectiveness of new road links having regard to a logical combination of links within each urban sector. Vehicle-hours of travel in the existing road network were estimated at 621,080 for 2013 demand and 1,010,613 for 2033 demand. Testing provided the following 2033 estimates of the comparative effectiveness of road network improvements relative to conditions if road network improvements were not to occur. Vehicle Hours Reduction = 26,430 Estimated Cost of Works ($M) = $27.20 (Veh-Hrs Reduction / $Cost) Ratio = 972 Vehicle Hours Reduction = 11,593 Estimated Cost of Works ($M) = $15.18 (Veh-Hrs Reduction / $Cost) Ratio = 764
Lismore Strategic Road Review 3rd May 2013
________________________________________________________________________________________________
________________________________________________________________________________________________ TTM Consulting (GC) Pty Ltd Page No. 27 Traffic . Parking . Acoustics TTM Ref : 34494Rep2
Vehicle Hours Reduction = 22,113 Estimated Cost of Works ($M) = $15.35 (Veh-Hrs Reduction / $Cost) Ratio = 1441 Vehicle Hours Reduction = 23,383 Estimated Cost of Works ($M) = $16.50 (Veh-Hrs Reduction / $Cost) Ratio = 1417 Vehicle Hours Reduction = 29,719 Estimated Cost of Works ($M) = $14.12 (Veh-Hrs Reduction / $Cost) Ratio = 2105

Lismore Strategic Road Review 3rd May 2013
________________________________________________________________________________________________
________________________________________________________________________________________________ TTM Consulting (GC) Pty Ltd Page No. 28 Traffic . Parking . Acoustics TTM Ref : 34494Rep2
Vehicle Hours Reduction = 34,152 Estimated Cost of Works ($M) = $42.38 (Veh-Hrs Reduction / $Cost) Ratio = 806 Vehicle Hours Reduction = 48,371 Estimated Cost of Works ($M) = $57.73 (Veh-Hrs Reduction / $Cost) Ratio = 838 Vehicle Hours Reduction = 53,387 Estimated Cost of Works ($M) = $30.62 (Veh-Hrs Reduction / $Cost) Ratio = 1744
Lismore Strategic Road Review 3rd May 2013
________________________________________________________________________________________________
________________________________________________________________________________________________ TTM Consulting (GC) Pty Ltd Page No. 29 Traffic . Parking . Acoustics TTM Ref : 34494Rep2
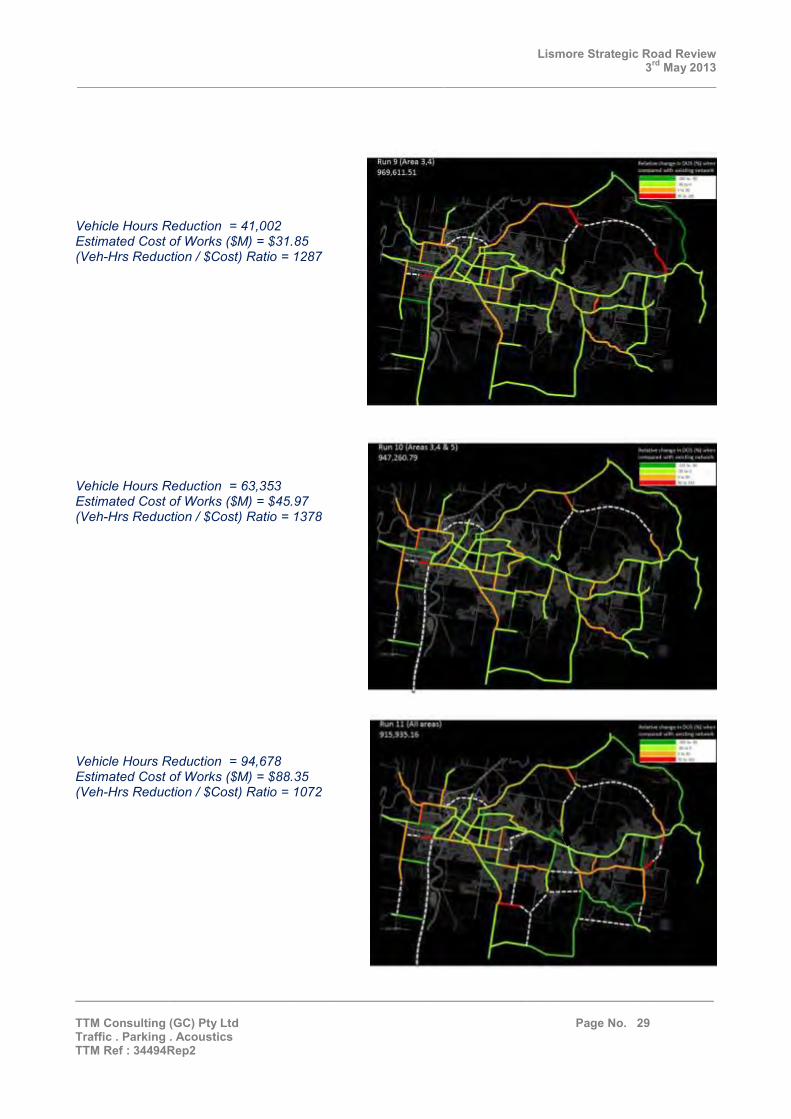
Vehicle Hours Reduction = 41,002 Estimated Cost of Works ($M) = $31.85 (Veh-Hrs Reduction / $Cost) Ratio = 1287 Vehicle Hours Reduction = 63,353 Estimated Cost of Works ($M) = $45.97 (Veh-Hrs Reduction / $Cost) Ratio = 1378 Vehicle Hours Reduction = 94,678 Estimated Cost of Works ($M) = $88.35 (Veh-Hrs Reduction / $Cost) Ratio = 1072
Lismore Strategic Road Review 3rd May 2013
________________________________________________________________________________________________
________________________________________________________________________________________________ TTM Consulting (GC) Pty Ltd Page No. 30 Traffic . Parking . Acoustics TTM Ref : 34494Rep2
Network
Run Veh-Hr
Veh-Hr
Reduction Cost Reduction/Cost
5 980894 29719 14.12 2105
8 957226 53387 30.62 1744
3 988500 22113 15.35 1441
4 987230 23383 16.5 1417
10 947260 63353 45.97 1378
9 969611 41002 31.85 1287
11 915935 94678 88.35 1072
1 984183 26430 27.2 972
7 962242 48371 57.73 838
6 976461 34152 42.38 806
2 999020 11593 15.18 764
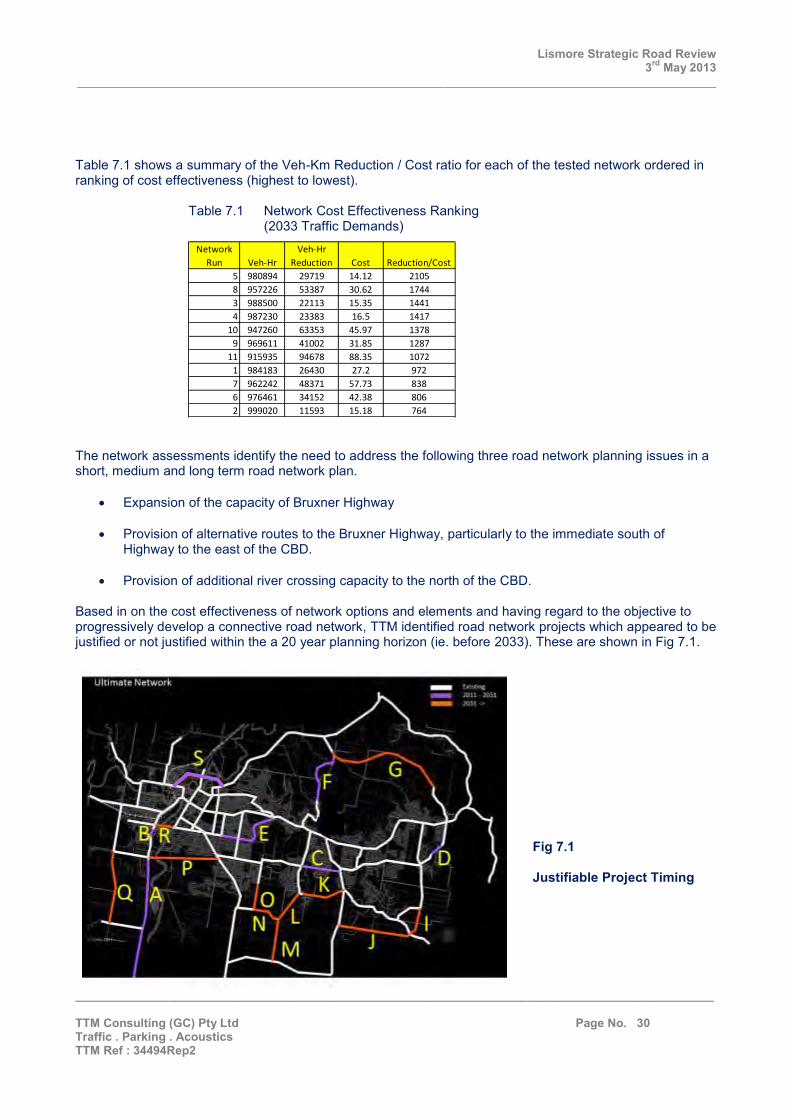
Table 7.1 shows a summary of the Veh-Km Reduction / Cost ratio for each of the tested network ordered in ranking of cost effectiveness (highest to lowest).
Table 7.1 Network Cost Effectiveness Ranking (2033 Traffic Demands) The network assessments identify the need to address the following three road network planning issues in a short, medium and long term road network plan.
Expansion of the capacity of Bruxner Highway
Provision of alternative routes to the Bruxner Highway, particularly to the immediate south of Highway to the east of the CBD.
Provision of additional river crossing capacity to the north of the CBD.
Based in on the cost effectiveness of network options and elements and having regard to the objective to progressively develop a connective road network, TTM identified road network projects which appeared to be justified or not justified within the a 20 year planning horizon (ie. before 2033). These are shown in Fig 7.1.
Fig 7.1 Justifiable Project Timing
Lismore Strategic Road Review 3rd May 2013
________________________________________________________________________________________________
________________________________________________________________________________________________ TTM Consulting (GC) Pty Ltd Page No. 31 Traffic . Parking . Acoustics TTM Ref : 34494Rep2
8. Recommended Road Network Staging Based on discussion with Council officers road network stages were derived from an objective to maintain operating conditions within major road network links at no worse than generally prevailed in 2013 in Bruxner Highway at approximately the location marked in Fig 8.1. The AIMSUN assignment model was used to ‘test’ road network improvements and generate staging plans based on the above objective. Estimated traffic volumes and link saturations for each derived road network stage coinciding with 5 year planning horizons are shown in Figs 8.1 to 8.5. The reader should be aware that the AIMSUN model defines daily link capacity in terms of 24 hour operation. Consequently, the saturation estimates and cost effectiveness ratios should only be used for comparing the relative cost effectiveness of network stages.
Current operating conditions within this section of Bruxner Highway were used as the benchmark for deriving the nature and timing of road network improvements.
Fig 8.1 Estimated Daily Traffic Volumes and Link Saturation Existing Demands and Network
2013 isting /
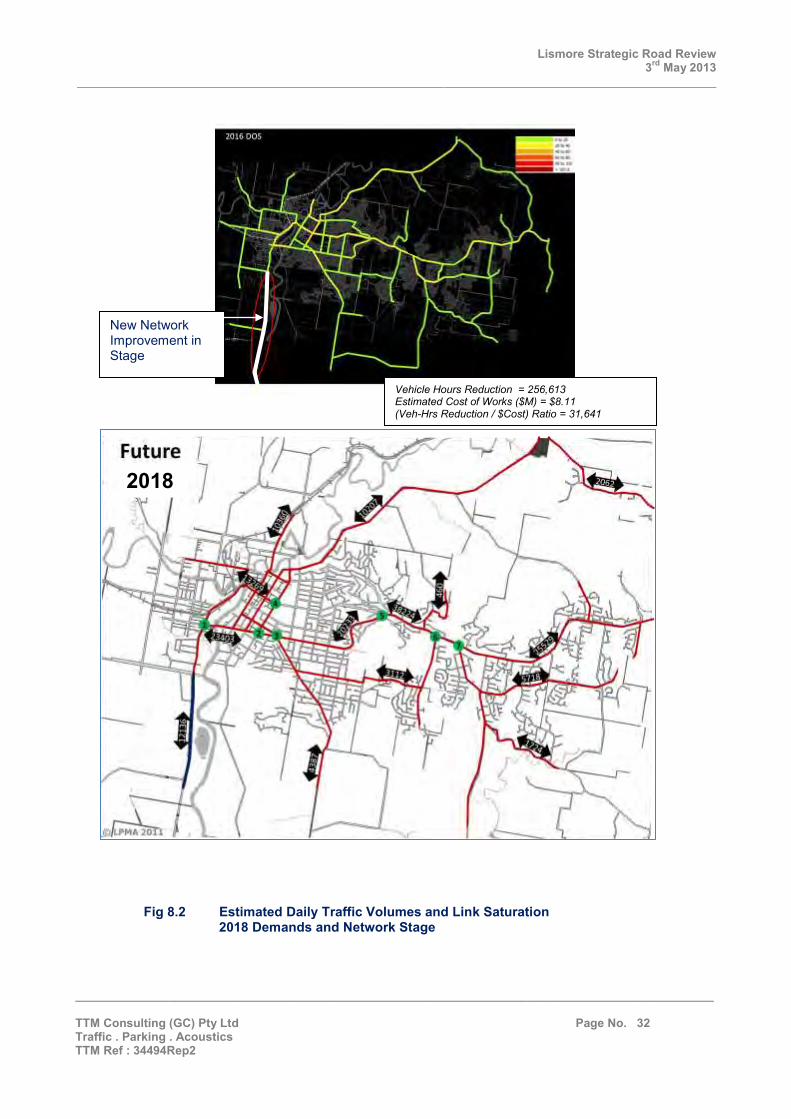
Lismore Strategic Road Review 3rd May 2013
________________________________________________________________________________________________
________________________________________________________________________________________________ TTM Consulting (GC) Pty Ltd Page No. 32 Traffic . Parking . Acoustics TTM Ref : 34494Rep2
Fig 8.2 Estimated Daily Traffic Volumes and Link Saturation 2018 Demands and Network Stage
New Network Improvement in Stage
Vehicle Hours Reduction = 256,613 Estimated Cost of Works ($M) = $8.11 (Veh-Hrs Reduction / $Cost) Ratio = 31,641
2018 Future /
l

Lismore Strategic Road Review 3rd May 2013
________________________________________________________________________________________________
________________________________________________________________________________________________ TTM Consulting (GC) Pty Ltd Page No. 33 Traffic . Parking . Acoustics TTM Ref : 34494Rep2
Fig 8.3 Estimated Daily Traffic Volumes and Link Saturation 2023 Demands and Network Stage
New Network Improvement in Stage
Vehicle Hours Reduction = 200,713 Estimated Cost of Works ($M) = $14.80 (Veh-Hrs Reduction / $Cost) Ratio = 13,562
2023
----
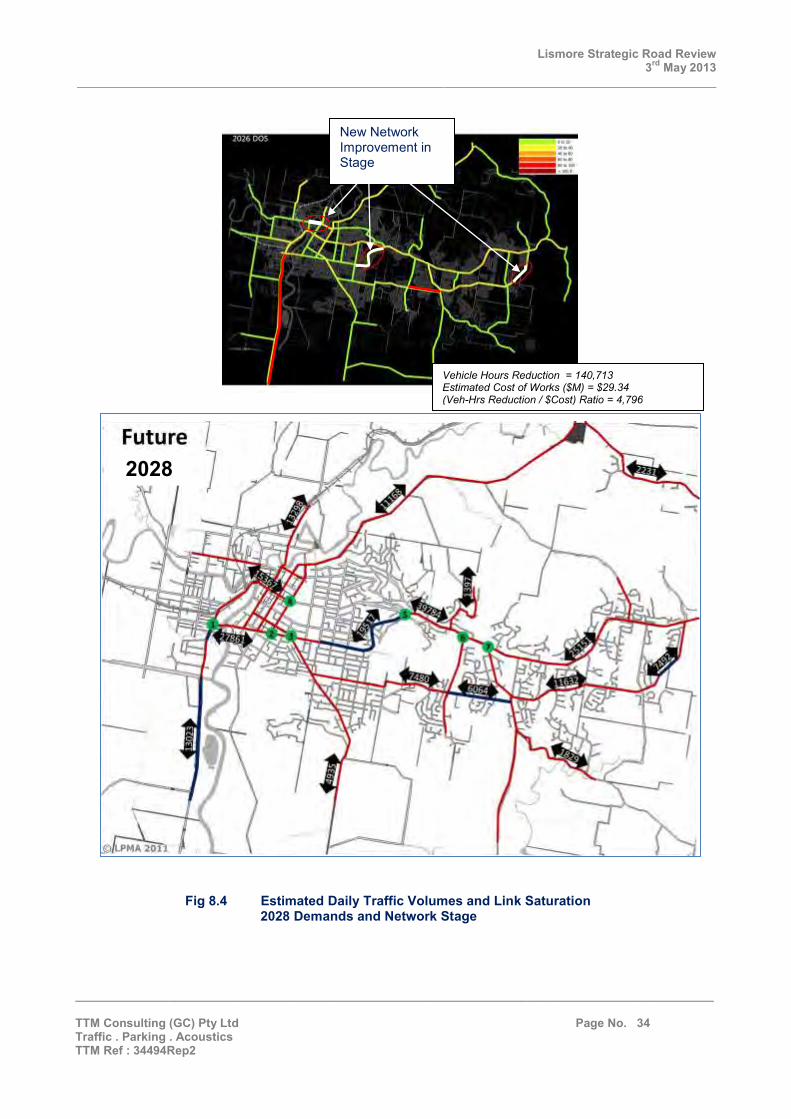
Lismore Strategic Road Review 3rd May 2013
________________________________________________________________________________________________
________________________________________________________________________________________________ TTM Consulting (GC) Pty Ltd Page No. 34 Traffic . Parking . Acoustics TTM Ref : 34494Rep2
Fig 8.4 Estimated Daily Traffic Volumes and Link Saturation 2028 Demands and Network Stage
New Network Improvement in Stage
Vehicle Hours Reduction = 140,713 Estimated Cost of Works ($M) = $29.34 (Veh-Hrs Reduction / $Cost) Ratio = 4,796
2028 Future l
l

Lismore Strategic Road Review 3rd May 2013
________________________________________________________________________________________________
________________________________________________________________________________________________ TTM Consulting (GC) Pty Ltd Page No. 35 Traffic . Parking . Acoustics TTM Ref : 34494Rep2
Fig 8.5 Estimated Daily Traffic Volumes and Link Saturation 2033 Demands and Network Stage
New Network Improvement in Stage
Vehicle Hours Reduction = 177,313 Estimated Cost of Works ($M) = $9.27 (Veh-Hrs Reduction / $Cost) Ratio = 19,128
2033 Future
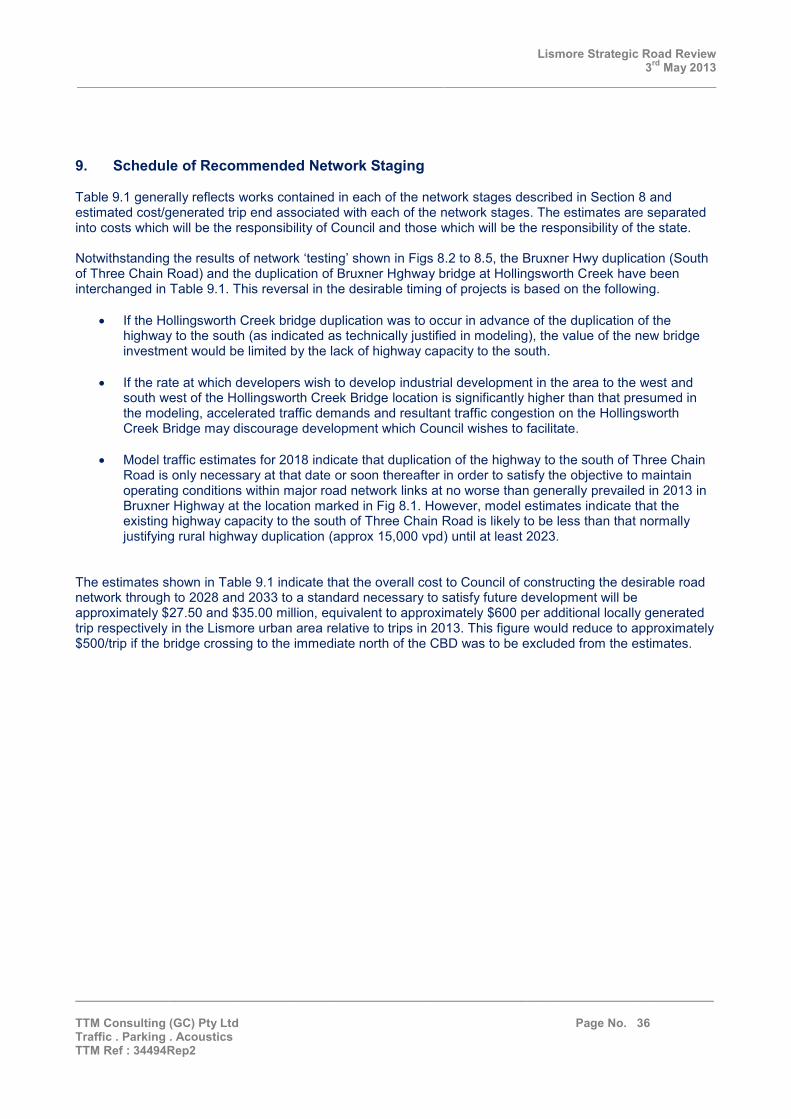
Lismore Strategic Road Review 3rd May 2013
________________________________________________________________________________________________
________________________________________________________________________________________________ TTM Consulting (GC) Pty Ltd Page No. 36 Traffic . Parking . Acoustics TTM Ref : 34494Rep2
9. Schedule of Recommended Network Staging Table 9.1 generally reflects works contained in each of the network stages described in Section 8 and estimated cost/generated trip end associated with each of the network stages. The estimates are separated into costs which will be the responsibility of Council and those which will be the responsibility of the state. Notwithstanding the results of network ‘testing’ shown in Figs 8.2 to 8.5, the Bruxner Hwy duplication (South of Three Chain Road) and the duplication of Bruxner Hghway bridge at Hollingsworth Creek have been interchanged in Table 9.1. This reversal in the desirable timing of projects is based on the following.
If the Hollingsworth Creek bridge duplication was to occur in advance of the duplication of the highway to the south (as indicated as technically justified in modeling), the value of the new bridge investment would be limited by the lack of highway capacity to the south.
If the rate at which developers wish to develop industrial development in the area to the west and
south west of the Hollingsworth Creek Bridge location is significantly higher than that presumed in the modeling, accelerated traffic demands and resultant traffic congestion on the Hollingsworth Creek Bridge may discourage development which Council wishes to facilitate.
Model traffic estimates for 2018 indicate that duplication of the highway to the south of Three Chain
Road is only necessary at that date or soon thereafter in order to satisfy the objective to maintain operating conditions within major road network links at no worse than generally prevailed in 2013 in Bruxner Highway at the location marked in Fig 8.1. However, model estimates indicate that the existing highway capacity to the south of Three Chain Road is likely to be less than that normally justifying rural highway duplication (approx 15,000 vpd) until at least 2023.
The estimates shown in Table 9.1 indicate that the overall cost to Council of constructing the desirable road network through to 2028 and 2033 to a standard necessary to satisfy future development will be approximately $27.50 and $35.00 million, equivalent to approximately $600 per additional locally generated trip respectively in the Lismore urban area relative to trips in 2013. This figure would reduce to approximately $500/trip if the bridge crossing to the immediate north of the CBD was to be excluded from the estimates.
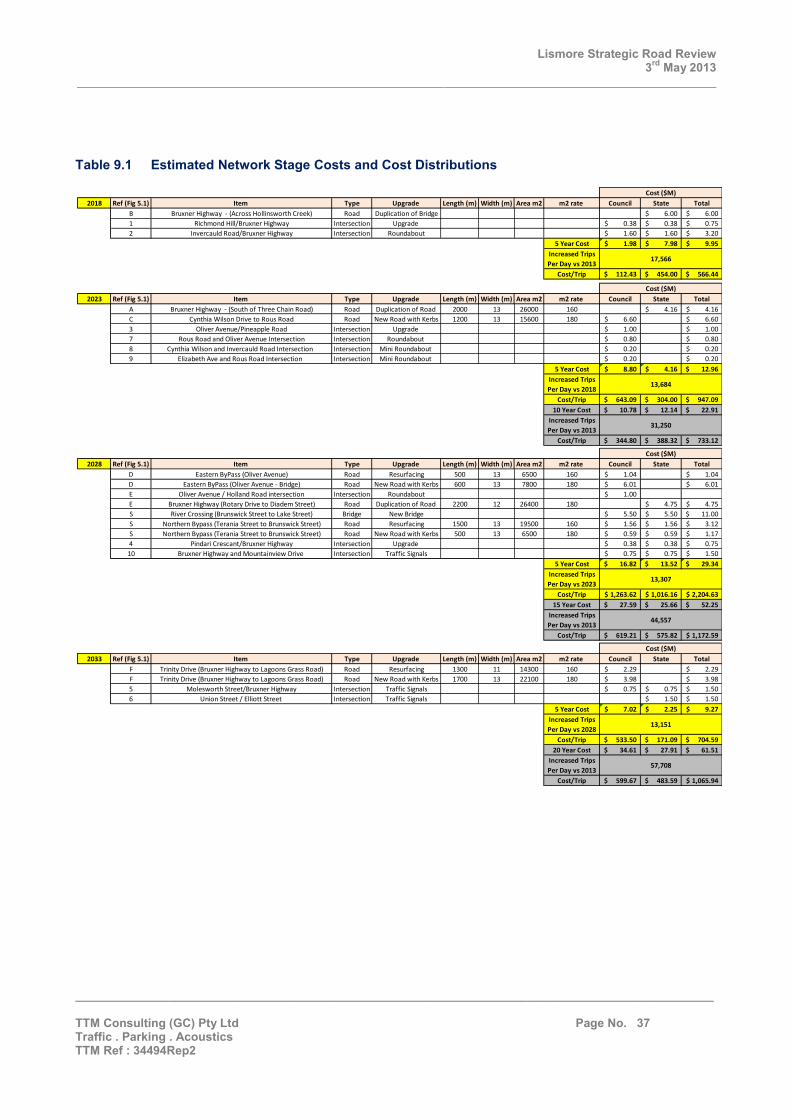
Lismore Strategic Road Review 3rd May 2013
________________________________________________________________________________________________
________________________________________________________________________________________________ TTM Consulting (GC) Pty Ltd Page No. 37 Traffic . Parking . Acoustics TTM Ref : 34494Rep2
2018 Ref (Fig 5.1) Item Type Upgrade Length (m) Width (m) Area m2 m2 rate Council State Total
B Bruxner Highway - (Across Hollinsworth Creek) Road Duplication of Bridge 6.00$ 6.00$
1 Richmond Hill/Bruxner Highway Intersection Upgrade 0.38$ 0.38$ 0.75$
2 Invercauld Road/Bruxner Highway Intersection Roundabout 1.60$ 1.60$ 3.20$
5 Year Cost 1.98$ 7.98$ 9.95$
Increased Trips
Per Day vs 2013
Cost/Trip 112.43$ 454.00$ 566.44$
2023 Ref (Fig 5.1) Item Type Upgrade Length (m) Width (m) Area m2 m2 rate Council State Total
A Bruxner Highway - (South of Three Chain Road) Road Duplication of Road 2000 13 26000 160 4.16$ 4.16$
C Cynthia Wilson Drive to Rous Road Road New Road with Kerbs 1200 13 15600 180 6.60$ 6.60$
3 Oliver Avenue/Pineapple Road Intersection Upgrade 1.00$ 1.00$
7 Rous Road and Oliver Avenue Intersection Intersection Roundabout 0.80$ 0.80$
8 Cynthia Wilson and Invercauld Road Intersection Intersection Mini Roundabout 0.20$ 0.20$
9 Elizabeth Ave and Rous Road Intersection Intersection Mini Roundabout 0.20$ 0.20$
5 Year Cost 8.80$ 4.16$ 12.96$
Increased Trips
Per Day vs 2018
Cost/Trip 643.09$ 304.00$ 947.09$
10 Year Cost 10.78$ 12.14$ 22.91$
Increased Trips
Per Day vs 2013
Cost/Trip 344.80$ 388.32$ 733.12$
2028 Ref (Fig 5.1) Item Type Upgrade Length (m) Width (m) Area m2 m2 rate Council State Total
D Eastern ByPass (Oliver Avenue) Road Resurfacing 500 13 6500 160 1.04$ 1.04$
D Eastern ByPass (Oliver Avenue - Bridge) Road New Road with Kerbs 600 13 7800 180 6.01$ 6.01$
E Oliver Avenue / Holland Road intersection Intersection Roundabout 1.00$
E Bruxner Highway (Rotary Drive to Diadem Street) Road Duplication of Road 2200 12 26400 180 4.75$ 4.75$
S River Crossing (Brunswick Street to Lake Street) Bridge New Bridge 5.50$ 5.50$ 11.00$
S Northern Bypass (Terania Street to Brunswick Street) Road Resurfacing 1500 13 19500 160 1.56$ 1.56$ 3.12$
S Northern Bypass (Terania Street to Brunswick Street) Road New Road with Kerbs 500 13 6500 180 0.59$ 0.59$ 1.17$
4 Pindari Crescant/Bruxner Highway Intersection Upgrade 0.38$ 0.38$ 0.75$
10 Bruxner Highway and Mountainview Drive Intersection Traffic Signals 0.75$ 0.75$ 1.50$
5 Year Cost 16.82$ 13.52$ 29.34$
Increased Trips
Per Day vs 2023
Cost/Trip 1,263.62$ 1,016.16$ 2,204.63$
15 Year Cost 27.59$ 25.66$ 52.25$
Increased Trips
Per Day vs 2013
Cost/Trip 619.21$ 575.82$ 1,172.59$
2033 Ref (Fig 5.1) Item Type Upgrade Length (m) Width (m) Area m2 m2 rate Council State Total
F Trinity Drive (Bruxner Highway to Lagoons Grass Road) Road Resurfacing 1300 11 14300 160 2.29$ 2.29$
F Trinity Drive (Bruxner Highway to Lagoons Grass Road) Road New Road with Kerbs 1700 13 22100 180 3.98$ 3.98$
5 Molesworth Street/Bruxner Highway Intersection Traffic Signals 0.75$ 0.75$ 1.50$
6 Union Street / Elliott Street Intersection Traffic Signals 1.50$ 1.50$
5 Year Cost 7.02$ 2.25$ 9.27$
Increased Trips
Per Day vs 2028
Cost/Trip 533.50$ 171.09$ 704.59$
20 Year Cost 34.61$ 27.91$ 61.51$
Increased Trips
Per Day vs 2013
Cost/Trip 599.67$ 483.59$ 1,065.94$
13,307
44,557
Cost ($M)
13,151
57,708
Cost ($M)
Cost ($M)
17,566
Cost ($M)
13,684
31,250
Table 9.1 Estimated Network Stage Costs and Cost Distributions I
I
I
I
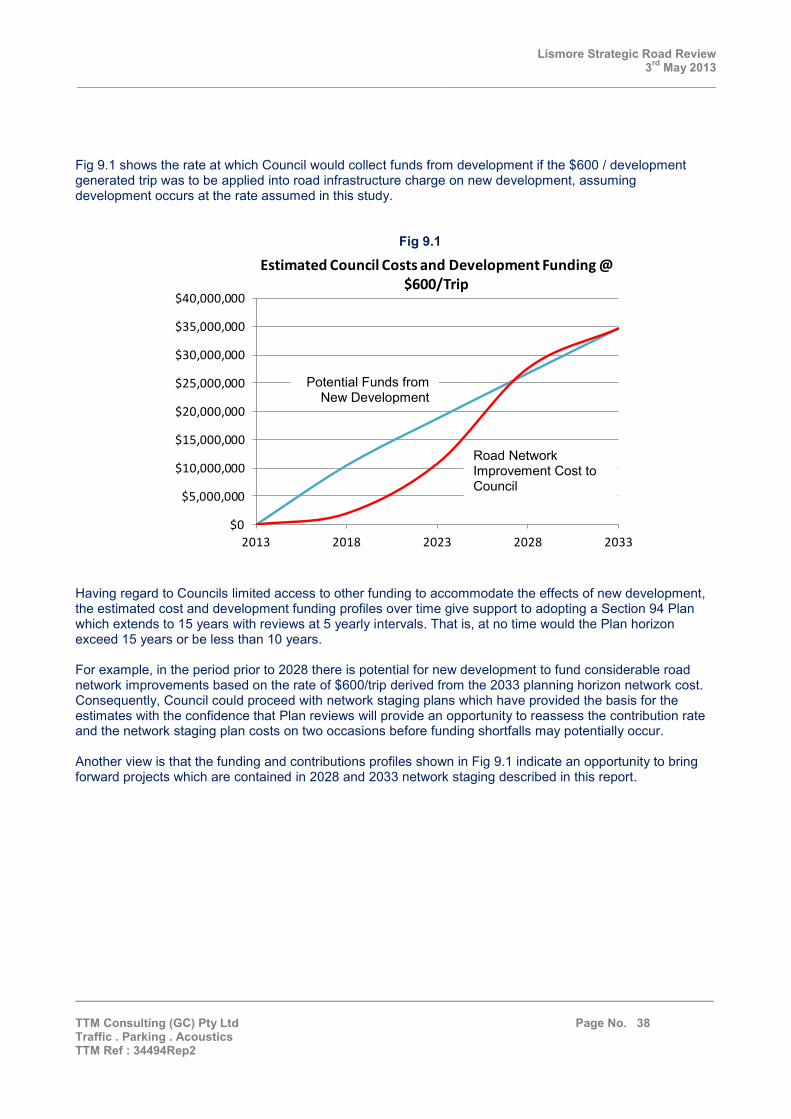
Lismore Strategic Road Review 3rd May 2013
________________________________________________________________________________________________
________________________________________________________________________________________________ TTM Consulting (GC) Pty Ltd Page No. 38 Traffic . Parking . Acoustics TTM Ref : 34494Rep2
$0
$5,000,000
$10,000,000
$15,000,000
$20,000,000
$25,000,000
$30,000,000
$35,000,000
$40,000,000
2013 2018 2023 2028 2033
Estimated Council Costs and Development Funding @ $600/Trip
Fig 9.1 shows the rate at which Council would collect funds from development if the $600 / development generated trip was to be applied into road infrastructure charge on new development, assuming development occurs at the rate assumed in this study.
Fig 9.1 Having regard to Councils limited access to other funding to accommodate the effects of new development, the estimated cost and development funding profiles over time give support to adopting a Section 94 Plan which extends to 15 years with reviews at 5 yearly intervals. That is, at no time would the Plan horizon exceed 15 years or be less than 10 years. For example, in the period prior to 2028 there is potential for new development to fund considerable road network improvements based on the rate of $600/trip derived from the 2033 planning horizon network cost. Consequently, Council could proceed with network staging plans which have provided the basis for the estimates with the confidence that Plan reviews will provide an opportunity to reassess the contribution rate and the network staging plan costs on two occasions before funding shortfalls may potentially occur. Another view is that the funding and contributions profiles shown in Fig 9.1 indicate an opportunity to bring forward projects which are contained in 2028 and 2033 network staging described in this report.
Road Network Improvement Cost to Council
Potential Funds from New Development

Lismore Strategic Road Review 3rd May 2013
________________________________________________________________________________________________
________________________________________________________________________________________________ TTM Consulting (GC) Pty Ltd Page No. 39 Traffic . Parking . Acoustics TTM Ref : 34494Rep2
10. Summary and Recommendations In the period to 2033 vehicle trip generation in the Lismore urban area will increase by nearly 60,000 trips per day representing approximately a 65% increase on 2013 trip generation and an average annual growth of approximately 2.5% per annum. Over the next 15 years the growth rate will be approximately 2.0% per annum. The network estimates and analyses performed in this study indicate that the following road network improvements will be fundamental to providing adequately for traffic increases in the period to 2028 and beyond.
Expansion of the corridor capacity of Bruxner Highway
Provision of alternative routes to the Bruxner Highway, particularly to the immediate south of Highway to the east of the CBD.
Provision of additional river crossing capacity to the north of the CBD.
Estimates and analyses indicate that it would be desirable to adopt road improvement staging plans as described in Table 9.1 of this report. These plans would generally have the effect to maintain levels of service in the road network consistent with being no worse than the level of service which is currently provided by Bruxner Highway to the immediate east of the CBD. The estimated cost of a desirable road network to accommodate urban development related traffic growth over the next 20 years is approximately 35 million dollars which if funded solely from contributions levied via a Section 94 Plan would amount to a rate of $600/daily trip ($2012) based on the cost of both the 2028 and 2033 desirable road networks and the estimated total trips in those networks. For the purposes of estimating development trips and associated contributions, it is recommended that the trip rates shown in Table 10.1 be adopted. These rates have been based on rates applying in the Gold Coast City Transport Infrastructure Contributions Plan and are considered to represent a reasonable estimate of the average rate at which various development types generate traffic movements. The effect of inaccuracies which inevitably exist in any choice of trip generation rates is minimised by adopting the same set of rates to estimate development contributions as developments occur. In that respect Council should resist submissions from developers which claim that a particular development rate or rates are not accurate. The expected cash and cost flows associated with new development and desirable network stages supports adopting a Section 94 Plan horizon of 15 years with the rate of development contribution being based on the cost of improvements over that time-frame. That is, at the rate of $600/trip. At the rate of $600/trip, contributions from new development will provide the opportunity to bring forward works which this study has assumed to occur in the period between 2018 and 2023. In that respect Council could justifiably vary the work stages from that assumed in this study.
Lismore Strategic Road Review 3rd May 2013
________________________________________________________________________________________________
________________________________________________________________________________________________ TTM Consulting (GC) Pty Ltd Page No. 40 Traffic . Parking . Acoustics TTM Ref : 34494Rep2
It should be noted that the contribution rate of $600/trip is significantly below the limit which the NSW state government specifies as a maximum contribution on new residential development. The application of a single contribution rate to all development within the Lismore urban area is desirable insofar as it provides simplicity and certainty to the development sector whilst satisfying the ‘nexus’ principle. In that respect the road improvements represented in the recommended road staging plans distribute benefits to all development across the Lismore urban area, either directly or through relieving other network components utilised by new development. The nexus principle is also satisfied through basing the contribution on development trip generation. The ‘apportionment’ principle is satisfied through the levying of a contribution rate which is based on all trips generated in the Lismore urban area with the underlying principle that existing development has effectively already paid a contribution in proportion to trips generated by existing development. ■
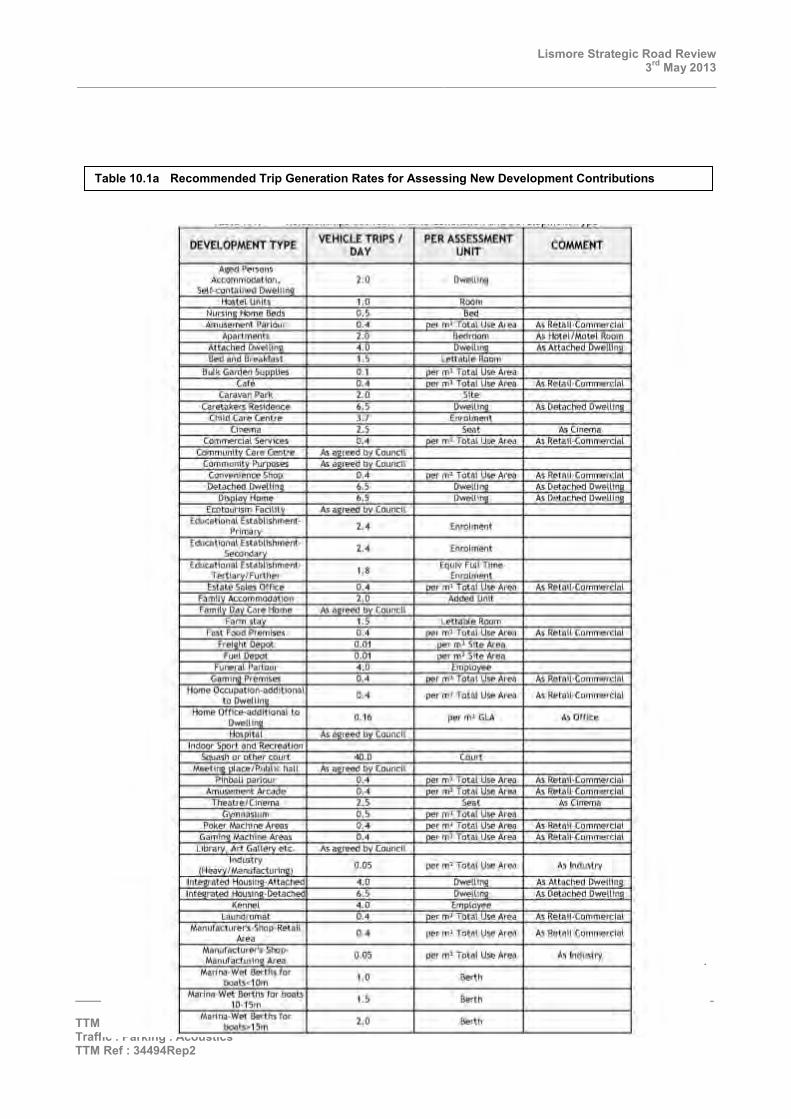
Lismore Strategic Road Review 3rd May 2013
________________________________________________________________________________________________
________________________________________________________________________________________________ TTM Consulting (GC) Pty Ltd Page No. 41 Traffic . Parking . Acoustics TTM Ref : 34494Rep2
Table 10.1a Recommended Trip Generation Rates for Assessing New Development Contributions
MM NT
.0 r,

Lismore Strategic Road Review 3rd May 2013
________________________________________________________________________________________________
________________________________________________________________________________________________ TTM Consulting (GC) Pty Ltd Page No. 42 Traffic . Parking . Acoustics TTM Ref : 34494Rep2
Table 10.1b Recommended Trip Generation Rates for Assessing New Development Contributions
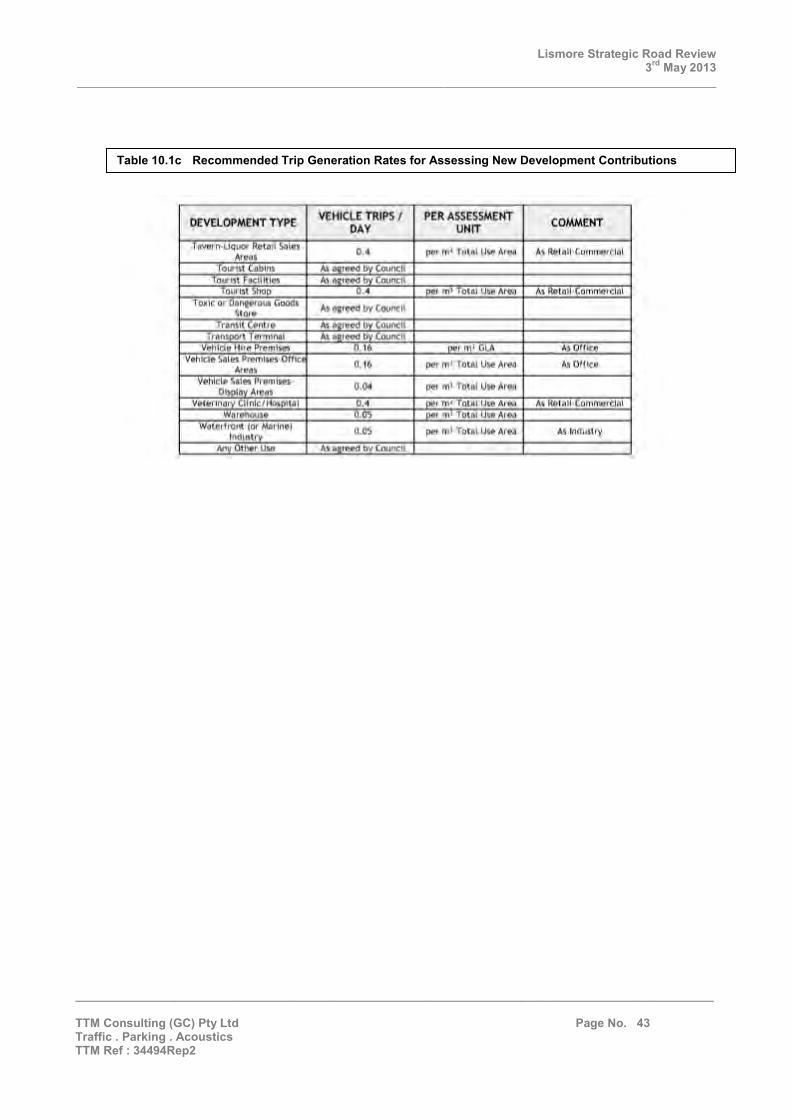
Lismore Strategic Road Review 3rd May 2013
________________________________________________________________________________________________
________________________________________________________________________________________________ TTM Consulting (GC) Pty Ltd Page No. 43 Traffic . Parking . Acoustics TTM Ref : 34494Rep2
Table 10.1c Recommended Trip Generation Rates for Assessing New Development Contributions
COMM NT

Lismore Strategic Road Review 3rd May 2013
________________________________________________________________________________________________
________________________________________________________________________________________________ TTM Consulting (GC) Pty Ltd Page No. 44 Traffic . Parking . Acoustics TTM Ref : 34494Rep2
Attachments
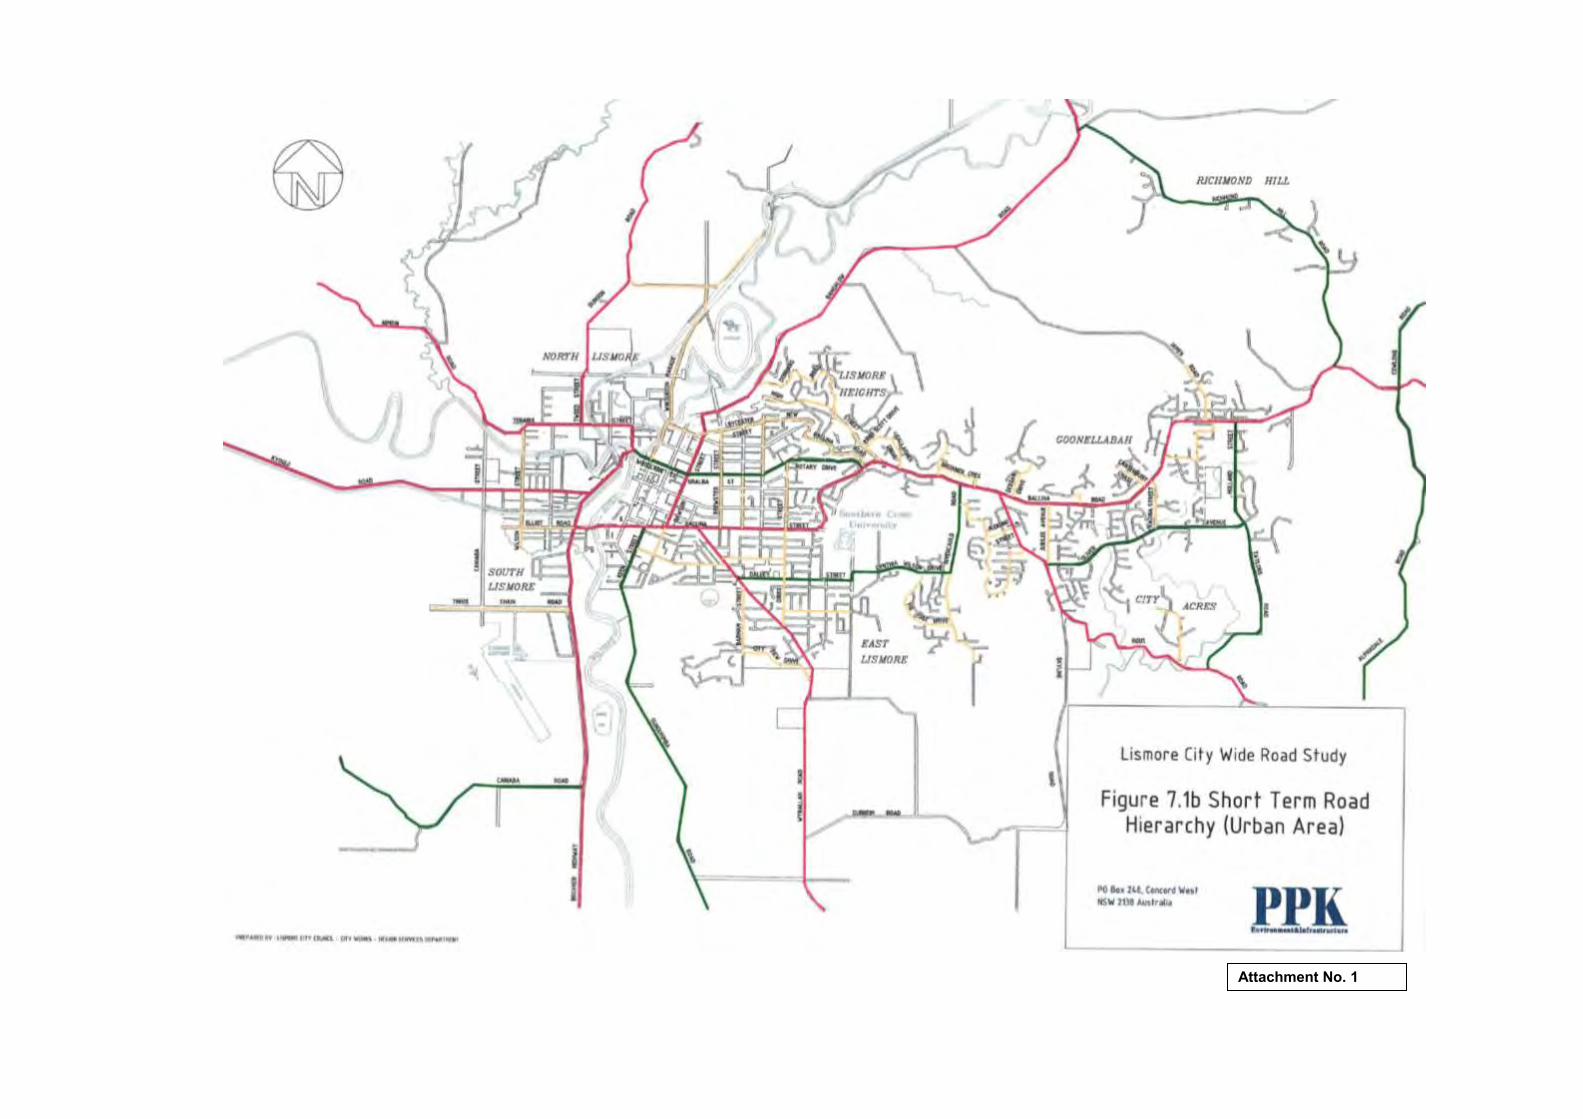
Attachment No. 1
II
lismor Ci W1 Roa S udy
Figu 7.1b Short erm Road Hierarchy (Urban Area)
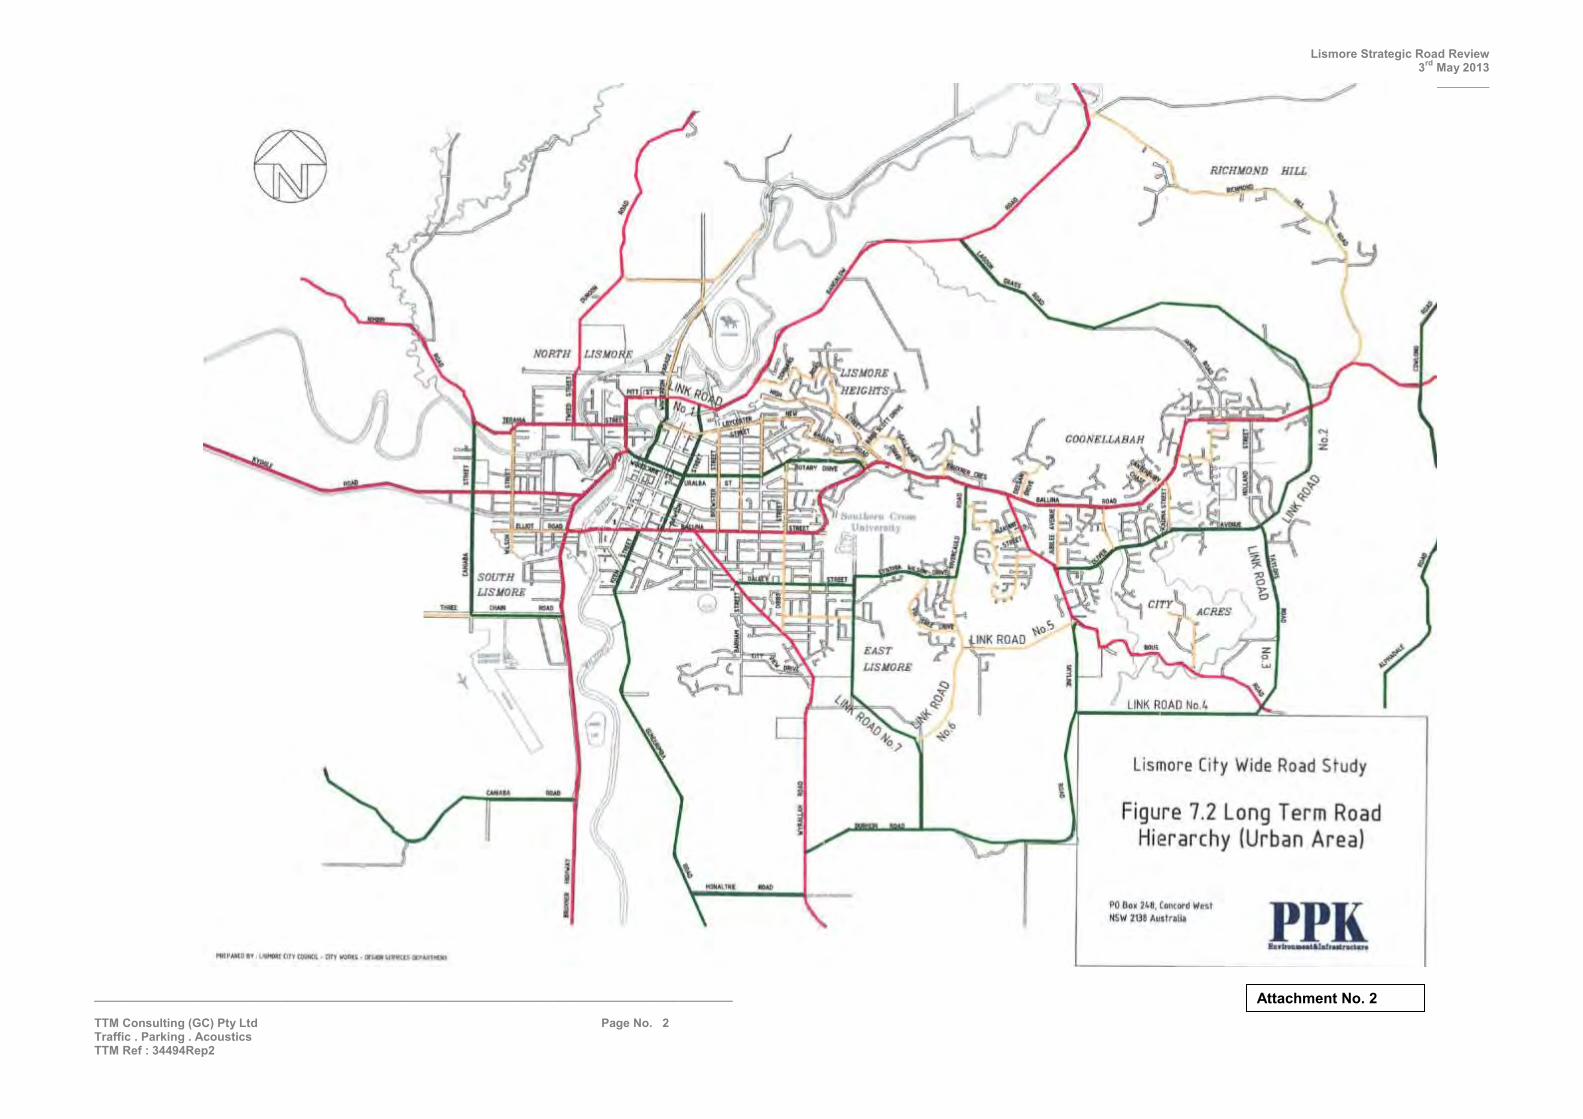
Lismore Strategic Road Review 3rd May 2013
________________________________________________________________________________________________
________________________________________________________________________________________________ TTM Consulting (GC) Pty Ltd Page No. 2 Traffic . Parking . Acoustics TTM Ref : 34494Rep2
Attachment No. 2
or, en
Lismore Ci y Wide Road S udy
igure 7.2 Long Term Road Hierarchy (Urban Area)
PPK ....... ,~Uatn,--
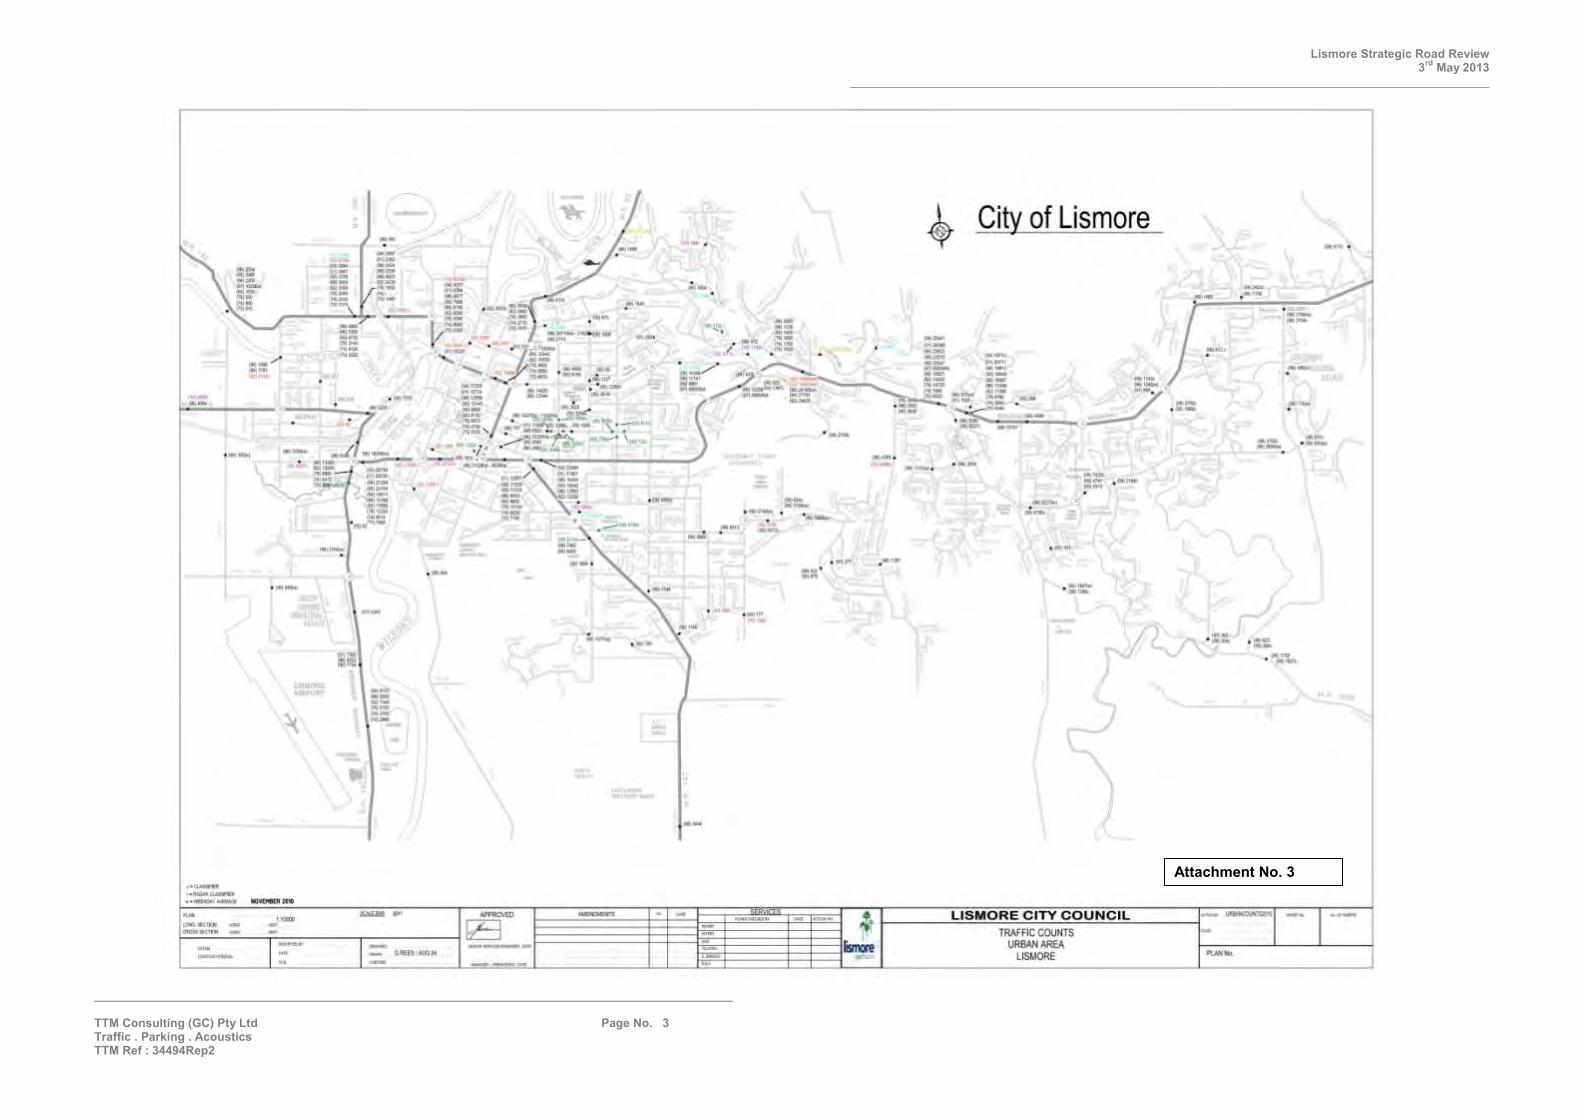
Lismore Strategic Road Review 3rd May 2013
________________________________________________________________________________________________
________________________________________________________________________________________________ TTM Consulting (GC) Pty Ltd Page No. 3 Traffic . Parking . Acoustics TTM Ref : 34494Rep2
Attachment No. 3
of Lismore ,, .
•• •• ,. ....
• t
-
LISMORE CITY COUNCIL TRAfFlC COU TS
U ARE LI MORE
PART C
Lismore Strategic Road Review Framework for Section 94 Trunk Road Infrastructure Contributions Plan
RURAL Areas
Prepared for Lismore Council
Ref : 34494Rural1
15th October 2012
ttmGROUP TRAFFIC • PARKING • ACOUSTICS

Lismore Strategic Road Review Framework for Section 94 Trunk Road Infrastructure Contributions Plan
RURAL Areas 15th October 2012
________________________________________________________________________________________________
________________________________________________________________________________________________ TTM Consulting (GC) Pty Ltd Page No. 1 Traffic . Parking . Acoustics TTM Ref : 34494Rural1
1. Existing Road Network and Traffic Volumes 1.1 The Classification of Roads State Highways and the Short and Long Term classification of other rural roads as currently adopted by Council are shown in Attachment 1 and 2. The scope of this “Framework for Section 94 Trunk Road Infrastructure Contributions Plan – Rural Areas” is related only to roads which are currently classified as “Arterial”, “Sub-Arterial” and “Collector” roads, not including roads such as state highways which are funded entirely by the state.. 1.2 Existing Traffic Volumes Existing urban daily traffic volumes available from Council records are shown in Attachments 3, 4 & 5. . 2. Rural Area Definition Fig 2.1 shows the area defined as the “Rural Area” for the purposes of this report and associated investigations.
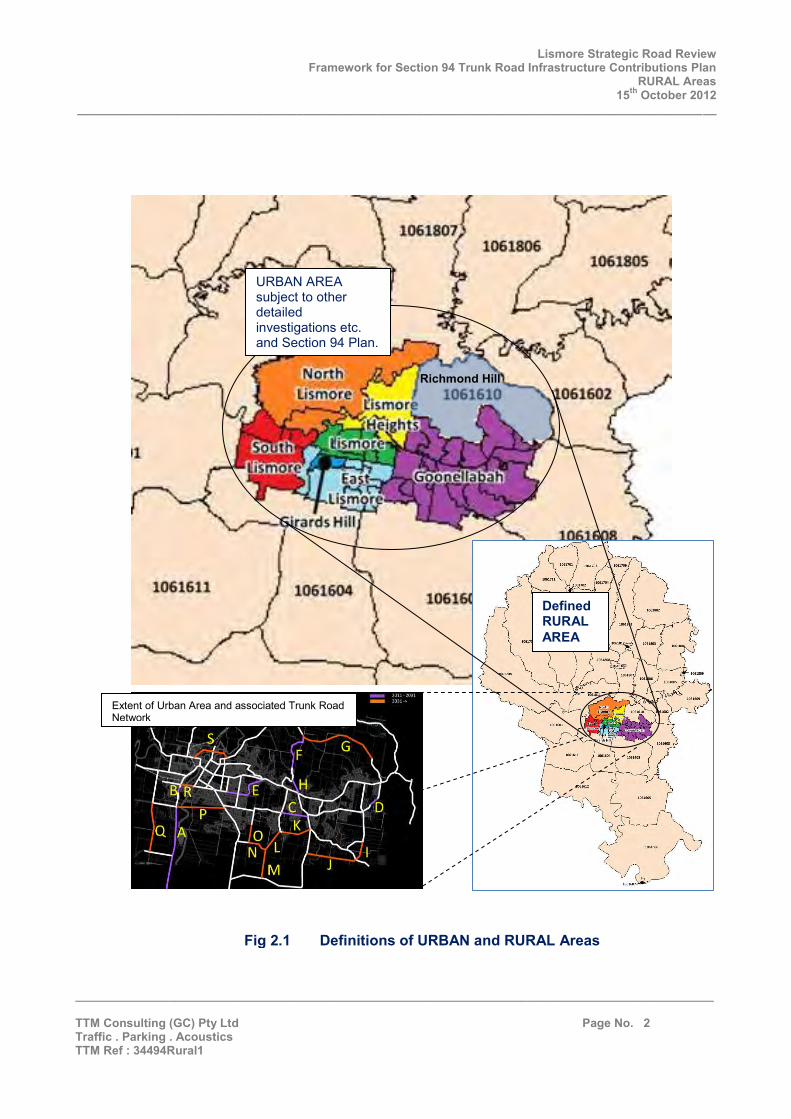
Lismore Strategic Road Review Framework for Section 94 Trunk Road Infrastructure Contributions Plan
RURAL Areas 15th October 2012
________________________________________________________________________________________________
________________________________________________________________________________________________ TTM Consulting (GC) Pty Ltd Page No. 2 Traffic . Parking . Acoustics TTM Ref : 34494Rural1
Richmond Hill
Defined RURAL AREA
URBAN AREA subject to other detailed investigations etc. and Section 94 Plan.
Extent of Urban Area and associated Trunk Road Network
Fig 2.1 Definitions of URBAN and RURAL Areas
1061611
, , , ,
, , , ,
1061805

Lismore Strategic Road Review Framework for Section 94 Trunk Road Infrastructure Contributions Plan
RURAL Areas 15th October 2012
________________________________________________________________________________________________
________________________________________________________________________________________________ TTM Consulting (GC) Pty Ltd Page No. 3 Traffic . Parking . Acoustics TTM Ref : 34494Rural1
3. Current and Anticipated Future Development The following description of past and anticipated population growth in the Lismore Urban and Rural areas has been extracted from the “Lismore Housing Analysis – Part B (October 2011)”, The above tabulated estimates represent average annual growth rates of approximately 0.25% and 0.65% for the urban and rural areas of Lismore respectively in the period between 2006 and 2031. However, in the period between 2006 and 2011 population growth for the Lismore urban area as defined in Fig 2.1 was approximately 2.5% per annum.
P o. ecied pOJJL-lation a 'ld average a '1nual growth rate es imates a-e pre<flcied to vary between the Lrsmore urbar area (Lismore Pa1 A Sta1is 'cal Divisions) aoo the Lsmore vi age/rural area (Lismore Part B Stalis ·ca1 Divisio'l). I is anti · ted that the majority of populati011 grm,1h till 2036 wi occur · the village/rural a ea Yith 2300 peqile (55% of expected po~latio g ~ ) compared to 1900 people ( 45% of expec ed pop la:ion growt in oo Lismore ban area see Table 2. .2 aoo 2.1.3).
Table 2.1.2. Projected population fo e · e Uiban area and ·11age.lrural area
Afea 20 1 2016 202 2026 2031 2ro6 Lismore urban area 0 32,700 33,200 33,500 33,600
14,000 14,500 15,000 15,400 lanning (2008)
T ~ 2. .3. Average annual gro '11h race over five periods) lo' 1 e ismore urban area aoo vil agrurural Alea
Area 2006-11 201 -16 20 6-21 202 -26 2026-31 2031-36 Lisw•e urban area' 0.25 % 0.25 % 0.25 % 0.30 % 0.18 % 0.18°'
Usmore village/rwal Area 0.62 o/c 0.75 % 0.58 % 0.70 % 0.68 % 0.53% ng 2008)
2.1.2 Migration
Between 2001 and 2006. Lismore LGA expeOOleed a posi ·ve e migration of 884 persons. The Lis Ofe n area expe ieoced a positive : migration o 965 persons, v. ile the villagelrural area experienced a nega · e nel migration of 81 pe s s leavi g oo area. Fo· e Lismore Urban Area, the larges s rce of in- ~ a!ion ,as from neighbo ing LGA's \'i h n e Far North Coas egion followed by he Lismore viUage/ ral area·lhen regional NSW and Sydney etro For tne Lismore Yi. age/rural area the larges s oes we•e neig bouring LGA's · in lhe Fa o1n Coas region, lowed by the Lismore urban area and lhen ln:erstate.

Lismore Strategic R
oad Review
Fram
ework for Section 94 Trunk R
oad Infrastructure Contributions Plan
RU
RA
L Areas
15th O
ctober 2012 ________________________________________________________________________________________________ ________________________________________________________________________________________________ TTM
Consulting (G
C) Pty Ltd
Page N
o. 4 Traffic . Parking . A
coustics TTM
Ref : 34494R
ural1 Estim
ates of future development described in this report (U
rban Areas) represent an average annual growth
rate in population for the entire Council area of approxim
ately 1.3% in the period to 2031.
Table 3.1 and Fig 3.1 show assum
ed future population estimates for the Lism
ore urban and rural areas through to 2031. The estim
ates are based on average annual growth rates of 1.0%
for the urban area and 2.0%
p er annum for the rural area.
Figs 3.2 and 3.3 show nam
es, locations and Census D
istrict Collector N
umbers for each of the D
istricts described in Table 3.1.
Fig 3.1
Lismore U
rban Area Lism
ore Rural Areas
Note : U
rban and Rural areas are defined in Fig 2.1.
06/ 07 07/ 08 08/ 09 09/10 10/ 11 11/ 12 12/ 13 13/ 14 14/ 15
15/ 16 16/ 17 17/ 18
~ 18/ 19 ~ 19/ 20
20/ 21 21/ 22
22/ 23 23/ 24 24/25 25/ 26 26/ 27 27/ 28 28/ 29 29/ 30
30/ 31 31/ 32
0
.... .... V, 0 V, 0 0 0 0 0 0 0 0 0
Population
"' "' w 0 V, 0 0 0 0 0 0 0 0 0 0
\
\
"" ... ... V, 0 V, 0 0 0 0 0 0 0 0 0
)> V'I V'I C:
3 et) c.. 'TI C: ... C: ""'I et) .,, 0
"O C: CJ ... o· ::J V'I
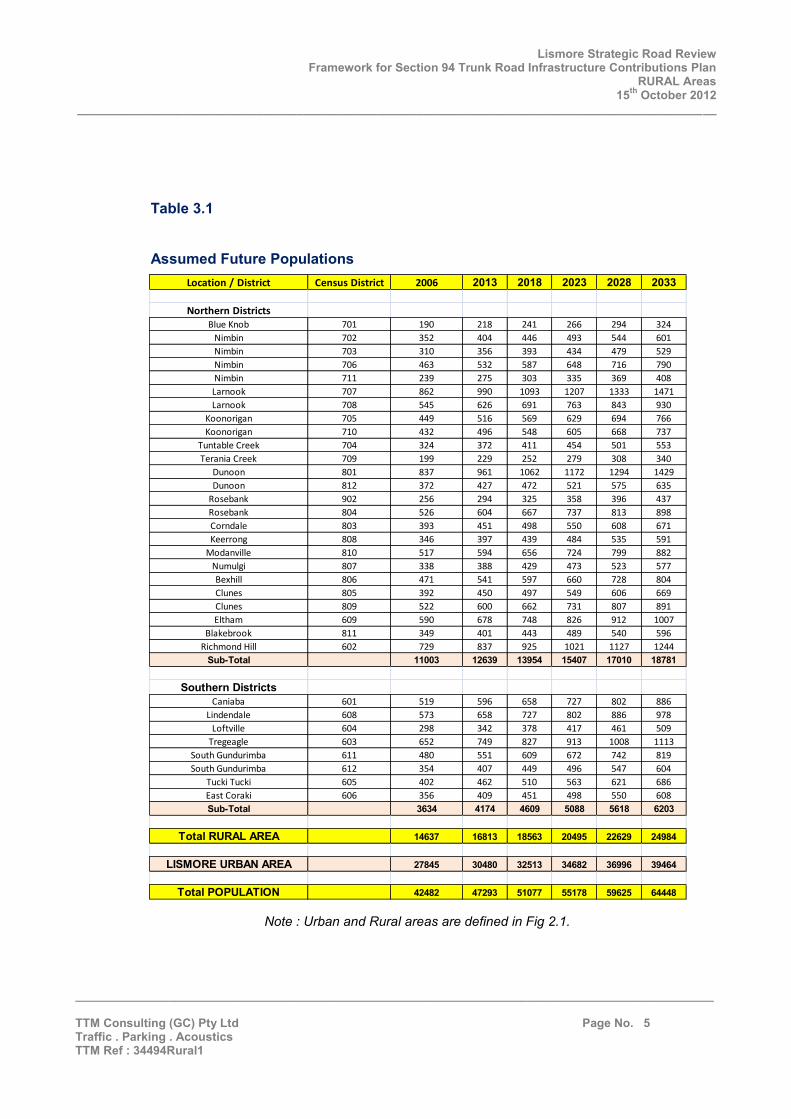
Lismore Strategic Road Review Framework for Section 94 Trunk Road Infrastructure Contributions Plan
RURAL Areas 15th October 2012
________________________________________________________________________________________________
________________________________________________________________________________________________ TTM Consulting (GC) Pty Ltd Page No. 5 Traffic . Parking . Acoustics TTM Ref : 34494Rural1
Location / District Census District 2006 2013 2018 2023 2028 2033
Northern DistrictsBlue Knob 701 190 218 241 266 294 324
Nimbin 702 352 404 446 493 544 601
Nimbin 703 310 356 393 434 479 529
Nimbin 706 463 532 587 648 716 790
Nimbin 711 239 275 303 335 369 408
Larnook 707 862 990 1093 1207 1333 1471
Larnook 708 545 626 691 763 843 930
Koonorigan 705 449 516 569 629 694 766
Koonorigan 710 432 496 548 605 668 737
Tuntable Creek 704 324 372 411 454 501 553
Terania Creek 709 199 229 252 279 308 340
Dunoon 801 837 961 1062 1172 1294 1429
Dunoon 812 372 427 472 521 575 635
Rosebank 902 256 294 325 358 396 437
Rosebank 804 526 604 667 737 813 898
Corndale 803 393 451 498 550 608 671
Keerrong 808 346 397 439 484 535 591
Modanville 810 517 594 656 724 799 882
Numulgi 807 338 388 429 473 523 577
Bexhill 806 471 541 597 660 728 804
Clunes 805 392 450 497 549 606 669
Clunes 809 522 600 662 731 807 891
Eltham 609 590 678 748 826 912 1007
Blakebrook 811 349 401 443 489 540 596
Richmond Hill 602 729 837 925 1021 1127 1244
Sub-Total 11003 12639 13954 15407 17010 18781
Southern DistrictsCaniaba 601 519 596 658 727 802 886
Lindendale 608 573 658 727 802 886 978
Loftville 604 298 342 378 417 461 509
Tregeagle 603 652 749 827 913 1008 1113
South Gundurimba 611 480 551 609 672 742 819
South Gundurimba 612 354 407 449 496 547 604
Tucki Tucki 605 402 462 510 563 621 686
East Coraki 606 356 409 451 498 550 608
Sub-Total 3634 4174 4609 5088 5618 6203
Total RURAL AREA 14637 16813 18563 20495 22629 24984
LISMORE URBAN AREA 27845 30480 32513 34682 36996 39464
Total POPULATION 42482 47293 51077 55178 59625 64448
Table 3.1 Assumed Future Populations
Note : Urban and Rural areas are defined in Fig 2.1.

Lismore Strategic Road Review Framework for Section 94 Trunk Road Infrastructure Contributions Plan
RURAL Areas 15th October 2012
________________________________________________________________________________________________
________________________________________________________________________________________________ TTM Consulting (GC) Pty Ltd Page No. 6 Traffic . Parking . Acoustics TTM Ref : 34494Rural1
Fig 3.2 District Names

Lismore Strategic Road Review Framework for Section 94 Trunk Road Infrastructure Contributions Plan
RURAL Areas 15th October 2012
________________________________________________________________________________________________
________________________________________________________________________________________________ TTM Consulting (GC) Pty Ltd Page No. 7 Traffic . Parking . Acoustics TTM Ref : 34494Rural1
Fig 3.3 Census District Numbers

Lismore Strategic Road Review Framework for Section 94 Trunk Road Infrastructure Contributions Plan
RURAL Areas 15th October 2012
________________________________________________________________________________________________
________________________________________________________________________________________________ TTM Consulting (GC) Pty Ltd Page No. 8 Traffic . Parking . Acoustics TTM Ref : 34494Rural1
2006 2013 2018 2023 2028 2033Population
Northern Districts 11003 12639 13954 15407 17010 18781Southern Districts 3634 4174 4609 5088 5618 6203
Total 14637 16813 18563 20495 22629 24984
Dwellings
Northern Districts 4001 4596 5074 5602 6186 6829
Southern Districts 1321 1518 1676 1850 2043 2256
Total 5323 6114 6750 7453 8229 9085
Daily Trips (All Trips)
Northern Districts 24622 28283 31227 34477 38065 42027
Southern Districts 8132 9341 10313 11387 12572 13880
Total 32754 37624 41540 45864 50637 55908
Daily Trips (Crossing Boundary of Generating District)
Northern Districts 6156 7071 7807 8619 9516 10507
Southern Districts 2033 2335 2578 2847 3143 3470
Total 8189 9406 10385 11466 12659 13977
4. Estimated Daily Traffic Generation 4.1 Estimated Current and Future Traffic Generation TTM did not have sufficient data to enable an accurate estimate to be made of traffic generation associated with current and future development in rural districts. Therefore the following trip generation estimates were made for the purpose of making investigations, recognising the relatively inaccurate nature of the estimates. The estimates have been made in respect to grouping districts to the north and south of Lismore Urban area as indicated in Fig 4.1. The purpose of this grouping was to reflect and investigate the differences in contribution which may arise from apparent differences in the special distribution of populations and the extent of road networks, The estimates of current and future traffic generation shown in Table 4.1 are based on the following assumptions.
Persons/ Dwelling 2.75 Trips/Dwelling/Day 4.00 Percent of Total Trips Generated by Dwellings 65% Percent Trips Extending outside Census District 25.00%
Table 4.1 Estimated Current and Future Traffic Generation – Rural Areas (Approximate Only)

Lismore Strategic Road Review Framework for Section 94 Trunk Road Infrastructure Contributions Plan
RURAL Areas 15th October 2012
________________________________________________________________________________________________
________________________________________________________________________________________________ TTM Consulting (GC) Pty Ltd Page No. 9 Traffic . Parking . Acoustics TTM Ref : 34494Rural1
Northern Districts
Southern Districts
Fig 4.1 Northern and Southern District Definition
Lismore Strategic Road Review Framework for Section 94 Trunk Road Infrastructure Contributions Plan
RURAL Areas 15th October 2012
________________________________________________________________________________________________
________________________________________________________________________________________________ TTM Consulting (GC) Pty Ltd Page No. 10 Traffic . Parking . Acoustics TTM Ref : 34494Rural1
5. Relative Traffic Generation Potential of Districts The lack of detailed data to allow current and future road traffic volumes required an alternative methodology to establish the relative degree to which future development in various rural districts would introduce the need for trunk road network improvements. A simplified “gravity model” technique was adopted for this purpose. 5.1 The Gravity Model The use of a ‘gravity model’ to establish the relative probability of vehicle trips between pairs of origin/destinations zones has been common in transport and traffic engineering for many years in instances where specific survey data is not available. The following explanation has been taken from the web site www.about.com.
For decades, social scientists have been using a modified version of Isaac Newton's Law of Gravitation to predict movement of people, information, and commodities between cities and even continents. The gravity model, as social scientists refer to the modified law of gravitation, takes into account the population size of two places and their distance. Since larger places attract people, ideas, and commodities more than smaller places and places closer together have a greater attraction, the gravity model incorporates these two features. The relative strength of a bond between two places is determined by multiplying the population of city A by the population of city B and then dividing the product by the distance between the two cities squared.
While the gravity model was created to anticipate migration between cities it can also be used to anticipate the traffic between two places, the number of telephone calls, the transportation of goods and mail, and other types of movement between places. The gravity model can also be used to compare the gravitational attraction between two continents, two countries, two states, two counties, or even two neighbourhoods within the same city.
Whilst the above explanation is a vastly simplified description of gravity models which are employed into transportation and road planning, it represents an appropriate simple form of gravity model for the purposes of making estimates of the relative probability of trip making throughout Lismore’s rural districts and the consequential relative impost which development in each rural district will potentially make in the rural road network.
population1 x population2
distance2
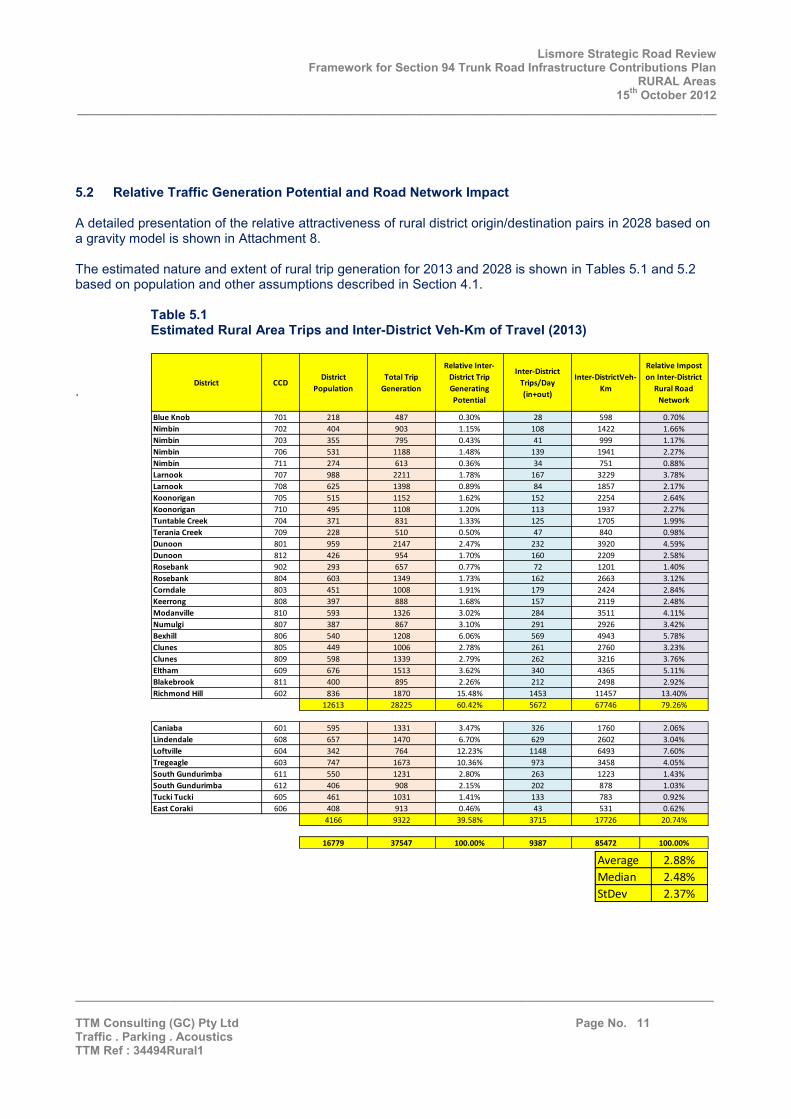
Lismore Strategic Road Review Framework for Section 94 Trunk Road Infrastructure Contributions Plan
RURAL Areas 15th October 2012
________________________________________________________________________________________________
________________________________________________________________________________________________ TTM Consulting (GC) Pty Ltd Page No. 11 Traffic . Parking . Acoustics TTM Ref : 34494Rural1
Average 2.88%
Median 2.48%
StDev 2.37%
District CCDDistrict
Population
Total Trip
Generation
Relative Inter-
District Trip
Generating
Potential
Inter-District
Trips/Day
(in+out)
Inter-DistrictVeh-
Km
Relative Impost
on Inter-District
Rural Road
Network
Blue Knob 701 218 487 0.30% 28 598 0.70%
Nimbin 702 404 903 1.15% 108 1422 1.66%
Nimbin 703 355 795 0.43% 41 999 1.17%
Nimbin 706 531 1188 1.48% 139 1941 2.27%
Nimbin 711 274 613 0.36% 34 751 0.88%
Larnook 707 988 2211 1.78% 167 3229 3.78%
Larnook 708 625 1398 0.89% 84 1857 2.17%
Koonorigan 705 515 1152 1.62% 152 2254 2.64%
Koonorigan 710 495 1108 1.20% 113 1937 2.27%
Tuntable Creek 704 371 831 1.33% 125 1705 1.99%
Terania Creek 709 228 510 0.50% 47 840 0.98%
Dunoon 801 959 2147 2.47% 232 3920 4.59%
Dunoon 812 426 954 1.70% 160 2209 2.58%
Rosebank 902 293 657 0.77% 72 1201 1.40%
Rosebank 804 603 1349 1.73% 162 2663 3.12%
Corndale 803 451 1008 1.91% 179 2424 2.84%
Keerrong 808 397 888 1.68% 157 2119 2.48%
Modanville 810 593 1326 3.02% 284 3511 4.11%
Numulgi 807 387 867 3.10% 291 2926 3.42%
Bexhill 806 540 1208 6.06% 569 4943 5.78%
Clunes 805 449 1006 2.78% 261 2760 3.23%
Clunes 809 598 1339 2.79% 262 3216 3.76%
Eltham 609 676 1513 3.62% 340 4365 5.11%
Blakebrook 811 400 895 2.26% 212 2498 2.92%
Richmond Hill 602 836 1870 15.48% 1453 11457 13.40%
12613 28225 60.42% 5672 67746 79.26%
Caniaba 601 595 1331 3.47% 326 1760 2.06%
Lindendale 608 657 1470 6.70% 629 2602 3.04%
Loftville 604 342 764 12.23% 1148 6493 7.60%
Tregeagle 603 747 1673 10.36% 973 3458 4.05%
South Gundurimba 611 550 1231 2.80% 263 1223 1.43%
South Gundurimba 612 406 908 2.15% 202 878 1.03%
Tucki Tucki 605 461 1031 1.41% 133 783 0.92%
East Coraki 606 408 913 0.46% 43 531 0.62%
4166 9322 39.58% 3715 17726 20.74%
16779 37547 100.00% 9387 85472 100.00%
5.2 Relative Traffic Generation Potential and Road Network Impact A detailed presentation of the relative attractiveness of rural district origin/destination pairs in 2028 based on a gravity model is shown in Attachment 8. The estimated nature and extent of rural trip generation for 2013 and 2028 is shown in Tables 5.1 and 5.2 based on population and other assumptions described in Section 4.1.
Table 5.1 Estimated Rural Area Trips and Inter-District Veh-Km of Travel (2013)
.

Lismore Strategic Road Review Framework for Section 94 Trunk Road Infrastructure Contributions Plan
RURAL Areas 15th October 2012
________________________________________________________________________________________________
________________________________________________________________________________________________ TTM Consulting (GC) Pty Ltd Page No. 12 Traffic . Parking . Acoustics TTM Ref : 34494Rural1
Average 2.88%
Median 2.48%
StDev 2.37%
District CCDDistrict
Population
Total Trip
Generation
Relative Inter-
District Trip
Generating
Potential
Inter-District
Trips/Day
(in+out)
Inter-DistrictVeh-
Km
Relative Impost
on Inter-District
Rural Road
Network
Blue Knob 701 294 657 0.30% 38 808 0.70%
Nimbin 702 544 1218 1.15% 146 1922 1.66%
Nimbin 703 479 1072 0.43% 55 1351 1.17%
Nimbin 706 716 1602 1.48% 187 2623 2.27%
Nimbin 711 369 827 0.36% 46 1015 0.88%
Larnook 707 1333 2982 1.78% 225 4364 3.78%
Larnook 708 843 1885 0.89% 113 2510 2.17%
Koonorigan 705 694 1553 1.62% 205 3046 2.64%
Koonorigan 710 668 1495 1.20% 152 2618 2.27%
Tuntable Creek 704 501 1121 1.33% 169 2304 1.99%
Terania Creek 709 308 688 0.50% 64 1136 0.98%
Dunoon 801 1294 2896 2.47% 313 5298 4.59%
Dunoon 812 575 1287 1.70% 215 2986 2.58%
Rosebank 902 396 886 0.77% 97 1623 1.40%
Rosebank 804 813 1820 1.73% 219 3599 3.12%
Corndale 803 608 1360 1.91% 242 3276 2.84%
Keerrong 808 535 1197 1.68% 212 2864 2.48%
Modanville 810 799 1789 3.02% 382 4746 4.11%
Numulgi 807 523 1169 3.10% 393 3955 3.42%
Bexhill 806 728 1629 6.06% 768 6680 5.78%
Clunes 805 606 1356 2.78% 351 3730 3.23%
Clunes 809 807 1806 2.79% 354 4347 3.76%
Eltham 609 912 2041 3.62% 458 5899 5.11%
Blakebrook 811 540 1207 2.26% 286 3376 2.92%
Richmond Hill 602 1127 2522 15.48% 1959 15484 13.40%
17010 38065 60.42% 7649 91557 79.26%
Caniaba 601 802 1795 3.47% 439 2378 2.06%
Lindendale 608 886 1982 6.70% 848 3516 3.04%
Loftville 604 461 1031 12.23% 1548 8775 7.60%
Tregeagle 603 1008 2256 10.36% 1312 4673 4.05%
South Gundurimba 611 742 1661 2.80% 354 1653 1.43%
South Gundurimba 612 547 1225 2.15% 272 1186 1.03%
Tucki Tucki 605 621 1391 1.41% 179 1059 0.92%
East Coraki 606 550 1232 0.46% 58 717 0.62%
5618 12572 39.58% 5010 23957 20.74%
22629 50637 100.00% 12659 115513 100.00%
Table 5.2 Estimated Rural Area Trips and Inter-District Veh-Km of Travel (2028)
.
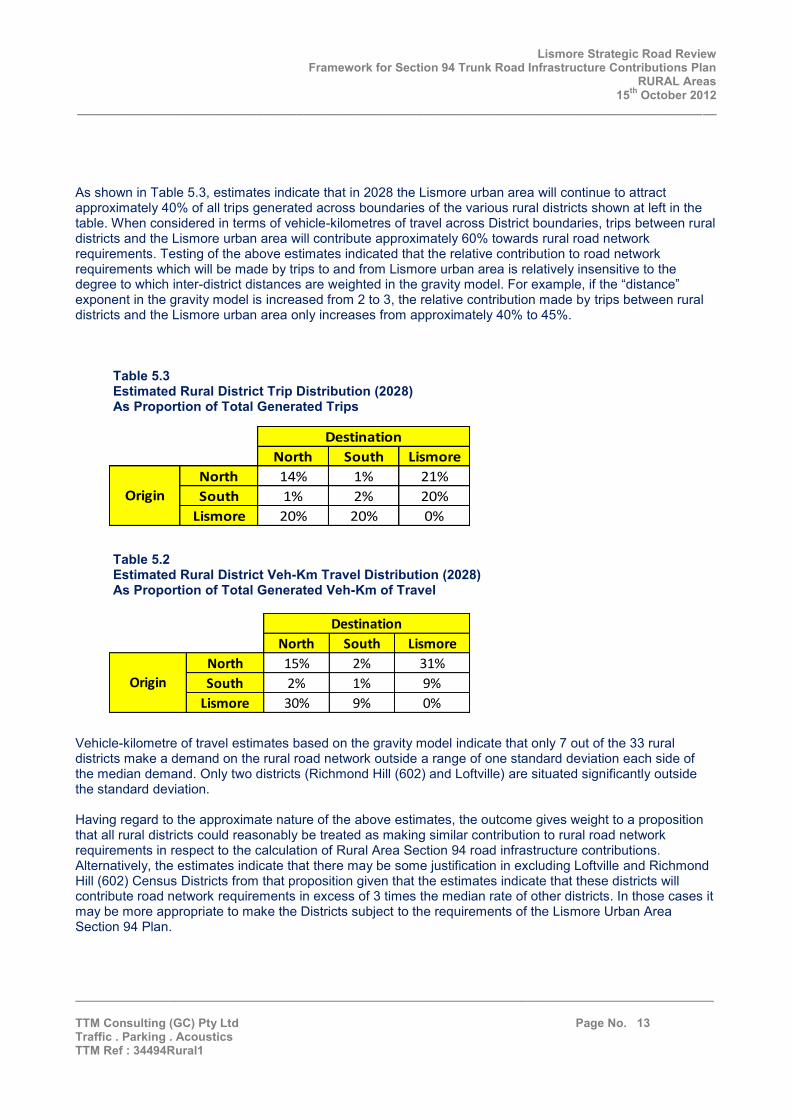
Lismore Strategic Road Review Framework for Section 94 Trunk Road Infrastructure Contributions Plan
RURAL Areas 15th October 2012
________________________________________________________________________________________________
________________________________________________________________________________________________ TTM Consulting (GC) Pty Ltd Page No. 13 Traffic . Parking . Acoustics TTM Ref : 34494Rural1
North South Lismore
North 14% 1% 21%
South 1% 2% 20%
Lismore 20% 20% 0%
Destination
Origin
North South Lismore
North 15% 2% 31%
South 2% 1% 9%
Lismore 30% 9% 0%
Destination
Origin
As shown in Table 5.3, estimates indicate that in 2028 the Lismore urban area will continue to attract approximately 40% of all trips generated across boundaries of the various rural districts shown at left in the table. When considered in terms of vehicle-kilometres of travel across District boundaries, trips between rural districts and the Lismore urban area will contribute approximately 60% towards rural road network requirements. Testing of the above estimates indicated that the relative contribution to road network requirements which will be made by trips to and from Lismore urban area is relatively insensitive to the degree to which inter-district distances are weighted in the gravity model. For example, if the “distance” exponent in the gravity model is increased from 2 to 3, the relative contribution made by trips between rural districts and the Lismore urban area only increases from approximately 40% to 45%.
Table 5.3 Estimated Rural District Trip Distribution (2028) As Proportion of Total Generated Trips Table 5.2 Estimated Rural District Veh-Km Travel Distribution (2028) As Proportion of Total Generated Veh-Km of Travel
Vehicle-kilometre of travel estimates based on the gravity model indicate that only 7 out of the 33 rural districts make a demand on the rural road network outside a range of one standard deviation each side of the median demand. Only two districts (Richmond Hill (602) and Loftville) are situated significantly outside the standard deviation. Having regard to the approximate nature of the above estimates, the outcome gives weight to a proposition that all rural districts could reasonably be treated as making similar contribution to rural road network requirements in respect to the calculation of Rural Area Section 94 road infrastructure contributions. Alternatively, the estimates indicate that there may be some justification in excluding Loftville and Richmond Hill (602) Census Districts from that proposition given that the estimates indicate that these districts will contribute road network requirements in excess of 3 times the median rate of other districts. In those cases it may be more appropriate to make the Districts subject to the requirements of the Lismore Urban Area Section 94 Plan.

Lismore Strategic Road Review Framework for Section 94 Trunk Road Infrastructure Contributions Plan
RURAL Areas 15th October 2012
________________________________________________________________________________________________
________________________________________________________________________________________________ TTM Consulting (GC) Pty Ltd Page No. 14 Traffic . Parking . Acoustics TTM Ref : 34494Rural1
6. Future Road Infrastructure Costs Council was not able to provide a schedule of future road infrastructure works for rural roads to the degree required to establish the basis for a Section 94 Contribution Plan. Current Council budgets provide one indication as to the potential magnitude of expenditures which may be associated with a Section 94 Plan. Table 6.1 shows expenditures which Council has budgeted for the urban and rural road networks in the 2011/2012 financial year.
Table 6.1 Budgeted Council Expenditures 2011/2012
Roads Funding 2011/12
Budget ($) Rural Roads Maintenance Rural Roads Sealed $1,828,500 Rural Roads Unsealed $1,070,800 Rural Roads Reseals $657,700 Total $3,557,000.00 Urban Roads Maintenance Urban Roads Sealed/Unsealed $1,146,200 Urban Roads Reseals $272,700 Total $1,418,900 Roads Capital Works Rural $2,676,100 Urban $2,884,400 Total $5,560,500
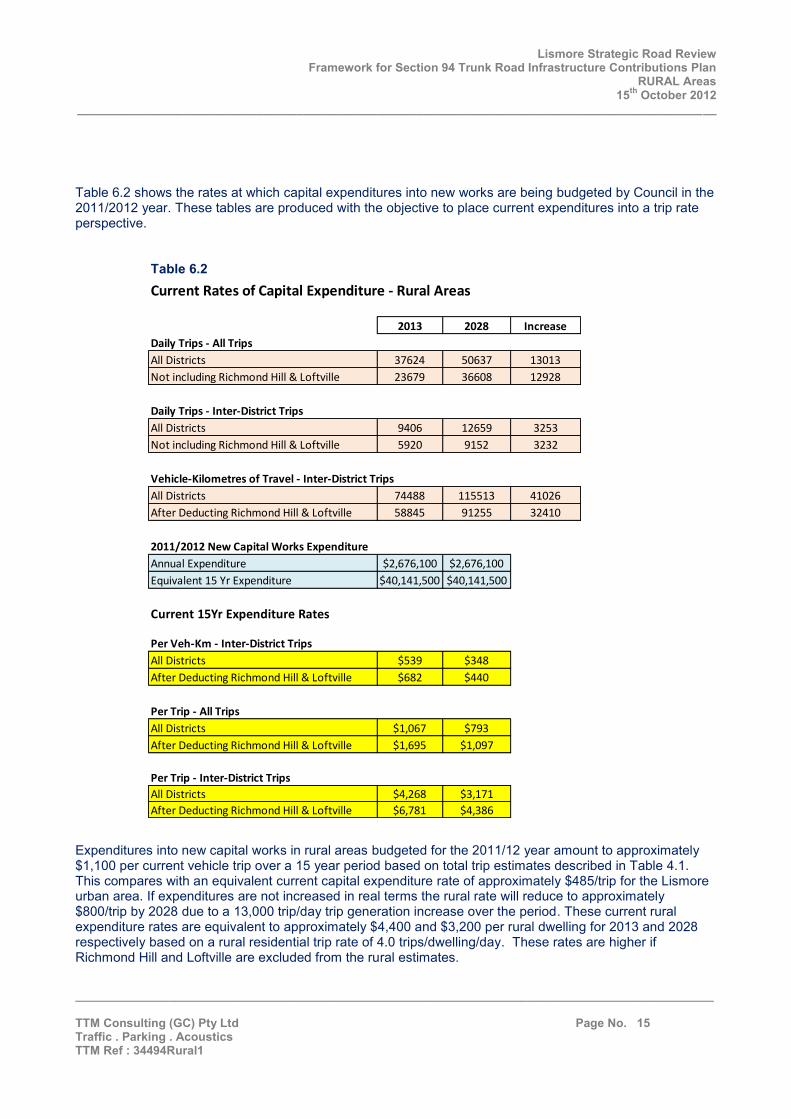
Lismore Strategic Road Review Framework for Section 94 Trunk Road Infrastructure Contributions Plan
RURAL Areas 15th October 2012
________________________________________________________________________________________________
________________________________________________________________________________________________ TTM Consulting (GC) Pty Ltd Page No. 15 Traffic . Parking . Acoustics TTM Ref : 34494Rural1
Current Rates of Capital Expenditure - Rural Areas
2013 2028 Increase
Daily Trips - All Trips
All Districts 37624 50637 13013
Not including Richmond Hill & Loftville 23679 36608 12928
Daily Trips - Inter-District Trips
All Districts 9406 12659 3253
Not including Richmond Hill & Loftville 5920 9152 3232
Vehicle-Kilometres of Travel - Inter-District Trips
All Districts 74488 115513 41026
After Deducting Richmond Hill & Loftville 58845 91255 32410
2011/2012 New Capital Works Expenditure
Annual Expenditure $2,676,100 $2,676,100
Equivalent 15 Yr Expenditure $40,141,500 $40,141,500
Current 15Yr Expenditure Rates
Per Veh-Km - Inter-District Trips
All Districts $539 $348
After Deducting Richmond Hill & Loftville $682 $440
Per Trip - All Trips
All Districts $1,067 $793
After Deducting Richmond Hill & Loftville $1,695 $1,097
Per Trip - Inter-District Trips
All Districts $4,268 $3,171
After Deducting Richmond Hill & Loftville $6,781 $4,386
Table 6.2 shows the rates at which capital expenditures into new works are being budgeted by Council in the 2011/2012 year. These tables are produced with the objective to place current expenditures into a trip rate perspective.
Table 6.2 Expenditures into new capital works in rural areas budgeted for the 2011/12 year amount to approximately $1,100 per current vehicle trip over a 15 year period based on total trip estimates described in Table 4.1. This compares with an equivalent current capital expenditure rate of approximately $485/trip for the Lismore urban area. If expenditures are not increased in real terms the rural rate will reduce to approximately $800/trip by 2028 due to a 13,000 trip/day trip generation increase over the period. These current rural expenditure rates are equivalent to approximately $4,400 and $3,200 per rural dwelling for 2013 and 2028 respectively based on a rural residential trip rate of 4.0 trips/dwelling/day. These rates are higher if Richmond Hill and Loftville are excluded from the rural estimates.
Lismore Strategic Road Review Framework for Section 94 Trunk Road Infrastructure Contributions Plan
RURAL Areas 15th October 2012
________________________________________________________________________________________________
________________________________________________________________________________________________ TTM Consulting (GC) Pty Ltd Page No. 16 Traffic . Parking . Acoustics TTM Ref : 34494Rural1
The estimates indicate if an additional $1.0M dollars per annum was to be expended into the road network over 15 years in direct response to new development, this would equate to a rate of approximately $1,150/trip or $4,600/dwelling if only levied against the 13,000 veh/day increase over the period. This rate approaches twice the contribution rate estimated for the Lismore urban area (ie. $600/trip). Lismore City Council estimates that the depreciated and replacement values of existing rural roads is approximately $315 and $375 million dollars respectively, representing a rate equivalent to approximately $560 and $665 per current trip generated in the rural area over a 15 year period at current population levels. Whilst this estimate does not directly translate into determining an appropriate infrastructure contribution rate for new development, it provides an additional traffic generation perspective for considering an appropriate contribution rate. Comments In the absence of a program of future works and associated costs relating to new road infrastructure requirements likely to be generated by rural development, the following estimates provide a basis for deciding an appropriate rate.
Even at modest rates of additional investment into rural road infrastructure, the technical rate at which new development should reasonably contribute to increased investment is in the order of that rate estimated for the Lismore urban area. That is, $600/trip. This logic is in part supported by the considerably greater lengths of rural road per head of population necessary to sustain rural development compared with urban development.
If the current replacement capital value of the rural road network was to be increased through new
capital expenditures in proportion to total rural trip generation, each additional trip would be associated with an increased capital value of approximately $665/trip over a 15 year time period to 2028.
Current rates of capital expenditure into the rural road network will equate to approximately
$1,100/trip over a 15 year time period to 2028 based on current trip generation. Taken in combination the above factors provide a sound case for adopting a trip contribution rate for rural areas identical to, if not greater than that rate estimated for the Lismore urban area. That is, a rate of at least $600/trip/day. Notwithstanding a case for applying a contribution rate to rural development which is at least that adopted for the Lismore urban area, the rate for the rural area should be applied to a trip generation schedule which represents characteristically lower rural trip generation rates in addition to representing generation rates used to derive the estimates in this report. That is, trip generation rates which are approximately 65% of that adopted for the Lismore urban area. With respect to contribution from residential development, this would yield a contribution of at least 6.5 x $600 x 0.65 = $2,535/dwelling for rural areas compared with $3,900/dwelling for the Lismore urban area.
Lismore Strategic Road Review Framework for Section 94 Trunk Road Infrastructure Contributions Plan
RURAL Areas 15th October 2012
________________________________________________________________________________________________
________________________________________________________________________________________________ TTM Consulting (GC) Pty Ltd Page No. 17 Traffic . Parking . Acoustics TTM Ref : 34494Rural1
7. Truck Generating Developments Urban Area traffic estimates implicitly assume that truck movements (vehicles exceeding 12 tonne gross weight) will represent no greater than approximately 2% of daily traffic movement on trunk roads throughout the Lismore Urban Area. However, this may not necessarily be an appropriate assumption to apply into traffic movements in rural areas where specific developments and business activities such as quarrying may result in significantly higher proportions of truck traffic. This is of considerable significance given the substantially higher impact which truck traffic has on the operating life of rural road pavements. All rural and urban development and associated contributions towards road infrastructure requirements need to be assessed in terms of ;
Direct Impacts and Associated Road Requirements That is, those road requirements which are directly generated by a development and without which the development could not or should reasonably occur. These requirements are normally based on traffic engineering assessments extending to a 10 year planning horizon. They are usually described in Conditions of Development and are funded directly by a development. An example might be the need to construct a right turn lane at a rural intersection or the need to reconstruct a road pavement to ensure that the pavement has adequate strength to accommodate truck movements which exceed that for which the road pavement was originally designed and constructed. Indirect Impacts and Associated Road Requirements That is, those road requirements which are generated by a development and which are not necessarily required immediately to accommodate a development. These requirements are normally based on traffic engineering and other assessments such as estimates of the effect which a development may have on bringing forward in time the need for road improvements or increased road maintenance costs. These requirements are often negotiated between a developer and a Council and documented in Voluntary Planning Agreements but can potentially be the subject of a S94 contribution.
In respect to the latter of the above development impacts, the NSW state government document Local Development Contributions Practice Note, Nov 2010 describes the following key principles and guidelines (shown in italics).
Generally, contributions can only be sought for:
Capital costs, including land acquisition costs Public facilities that a council reasonably has to provide Public facilities that are needed as a consequence or to facilitate new development
The condition must only be imposed for the provision, extension or augmentation of public amenities and public services (s 94(2) of the EP&A Act). That is, generally, contributions cannot be sought for recurrent funding such as maintenance. Can the new demand be accommodated, in whole or in part, within existing public amenities and public services? Are the public amenities and public services only required to meet the need of the new development or will it also serve the existing community?

Lismore Strategic Road Review Framework for Section 94 Trunk Road Infrastructure Contributions Plan
RURAL Areas 15th October 2012
________________________________________________________________________________________________
________________________________________________________________________________________________ TTM Consulting (GC) Pty Ltd Page No. 18 Traffic . Parking . Acoustics TTM Ref : 34494Rural1
If the expected development did not occur, would the public amenities and public services still be required? The proposed public amenities and public services must be provided within a reasonable timeframe. Will the public amenities and public services be provided at a time that those demanding the infrastructure require it? The proposed development contribution must be based on a reasonable apportionment between existing demand and new demand for the public amenities and public services.
In our view a development which generates unusually high truck movements or truck movements which have the effect to significantly reduce the life of the road construction and/or increase the cost of maintaining a road would reasonably be required to contribute an amount based on the cost to Council of bringing forward the need for works or based on the increased cost to Council of maintaining the road. However, this would only be reasonable if the works were not already represented in Council’s capital works or maintenance program and would not otherwise be required if the development was not to proceed. 7.1 The Ballina Shire Heavy Haulage Contribution Plan (2011) The following extract (in italics) from the Ballina Heavy Haulage Contributions Plan provides an explanation regarding the logic for requiring contributions from relatively high truck generating developments in rural areas and the potential mechanisms for administering a Contributions Plan.
Roads have a design life after which they need reconstruction. Heavy vehicles can significantly reduce the life of a road. The heavy vehicles have a disproportionally greater impact on the life of roads compared to other light vehicles, notwithstanding there greater numbers. Highways are generally designed and constructed to accommodate heavy vehicles and the damage associated with heavy trucks is recouped through registration and general taxation. Roads within the local road network conversely often have a lower design standard and are more susceptible to wear and tear associated with heavy vehicles resulting in the need for more frequent reconstruction work. The majority of heavy haulage vehicles that impact on the local road network are associated with the haulage of materials that are quarried and/or processed for road and building construction, such as sand, road base, crushed aggregate and asphalt. Some of these products are used for the production of concrete, which has a secondary trip component from concrete batching plants to development sites, albeit in smaller trucks. It is evident that not all quarried products are for use within Ballina Shire with some transported via local roads and then via Highways to external destinations beyond the Shire. This applies in particular to major highway upgrading that continues to be undertaken by the NSW Government in this region. The use of this road network by heavy haulage vehicles contributes to a decline in the serviceable life of roads, thereby bringing forward the cost for renewal.
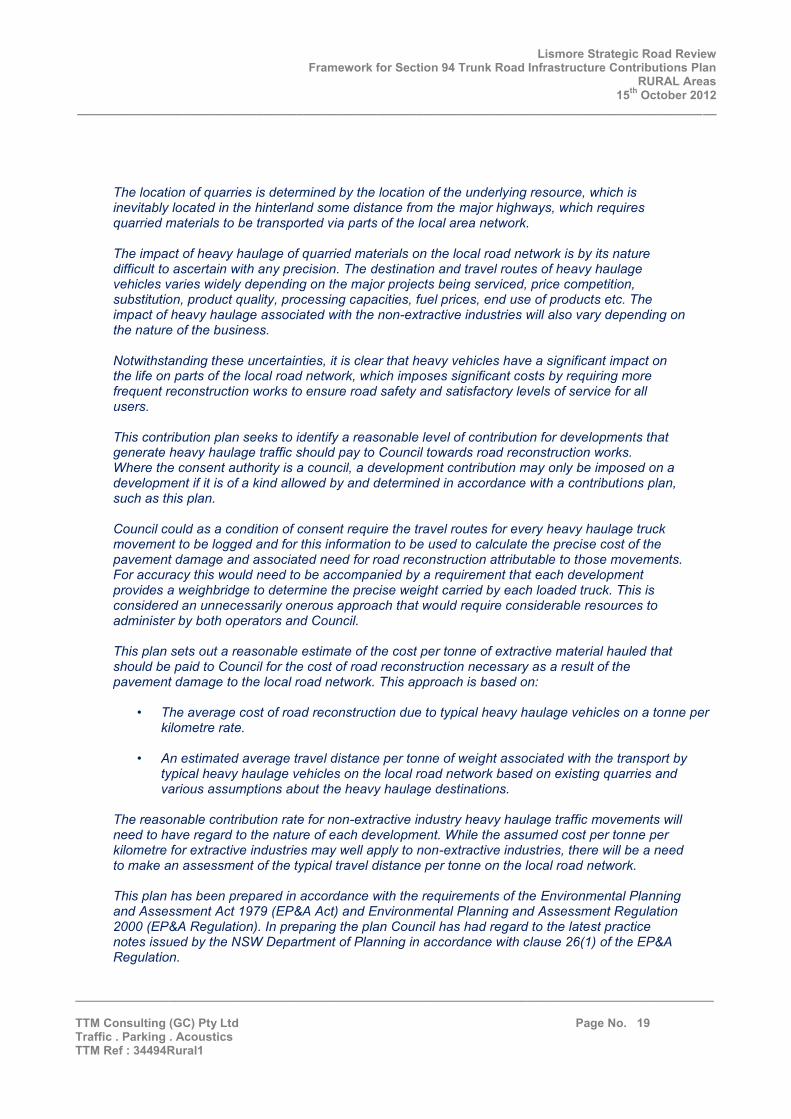
Lismore Strategic Road Review Framework for Section 94 Trunk Road Infrastructure Contributions Plan
RURAL Areas 15th October 2012
________________________________________________________________________________________________
________________________________________________________________________________________________ TTM Consulting (GC) Pty Ltd Page No. 19 Traffic . Parking . Acoustics TTM Ref : 34494Rural1
The location of quarries is determined by the location of the underlying resource, which is inevitably located in the hinterland some distance from the major highways, which requires quarried materials to be transported via parts of the local area network. The impact of heavy haulage of quarried materials on the local road network is by its nature difficult to ascertain with any precision. The destination and travel routes of heavy haulage vehicles varies widely depending on the major projects being serviced, price competition, substitution, product quality, processing capacities, fuel prices, end use of products etc. The impact of heavy haulage associated with the non-extractive industries will also vary depending on the nature of the business. Notwithstanding these uncertainties, it is clear that heavy vehicles have a significant impact on the life on parts of the local road network, which imposes significant costs by requiring more frequent reconstruction works to ensure road safety and satisfactory levels of service for all users. This contribution plan seeks to identify a reasonable level of contribution for developments that generate heavy haulage traffic should pay to Council towards road reconstruction works. Where the consent authority is a council, a development contribution may only be imposed on a development if it is of a kind allowed by and determined in accordance with a contributions plan, such as this plan. Council could as a condition of consent require the travel routes for every heavy haulage truck movement to be logged and for this information to be used to calculate the precise cost of the pavement damage and associated need for road reconstruction attributable to those movements. For accuracy this would need to be accompanied by a requirement that each development provides a weighbridge to determine the precise weight carried by each loaded truck. This is considered an unnecessarily onerous approach that would require considerable resources to administer by both operators and Council. This plan sets out a reasonable estimate of the cost per tonne of extractive material hauled that should be paid to Council for the cost of road reconstruction necessary as a result of the pavement damage to the local road network. This approach is based on:
• The average cost of road reconstruction due to typical heavy haulage vehicles on a tonne per kilometre rate.
• An estimated average travel distance per tonne of weight associated with the transport by
typical heavy haulage vehicles on the local road network based on existing quarries and various assumptions about the heavy haulage destinations.
The reasonable contribution rate for non-extractive industry heavy haulage traffic movements will need to have regard to the nature of each development. While the assumed cost per tonne per kilometre for extractive industries may well apply to non-extractive industries, there will be a need to make an assessment of the typical travel distance per tonne on the local road network. This plan has been prepared in accordance with the requirements of the Environmental Planning and Assessment Act 1979 (EP&A Act) and Environmental Planning and Assessment Regulation 2000 (EP&A Regulation). In preparing the plan Council has had regard to the latest practice notes issued by the NSW Department of Planning in accordance with clause 26(1) of the EP&A Regulation.

Lismore Strategic Road Review Framework for Section 94 Trunk Road Infrastructure Contributions Plan
RURAL Areas 15th October 2012
________________________________________________________________________________________________
________________________________________________________________________________________________ TTM Consulting (GC) Pty Ltd Page No. 20 Traffic . Parking . Acoustics TTM Ref : 34494Rural1
The Ballina Plan requires contributions for Extractive Industry to be paid at the rate of $0.6455 ($AUD 2009) per tonne of extracted material based on an assumed haulage distance of 12 kilometres. The rate for non-extractive industry is stated in the Plan “to be determined by a traffic assessment”. The Ballina Plan also goes on to state ;
Council will collect monetary contributions from heavy haulage developments and apply the contributions toward the replacement of the local road network. Potential roads that will be the subject of works partly or fully funded under this plan are the roads that the Council has responsibility for. The locations of these roads are shown in Figure 1. Development that is likely to occasion significant heavy vehicle movements may be approved in any location throughout the Shire. As a result it is not possible for Council to specify in this plan which sections of the roads shown in Figure 1 will be upgraded or maintained using contributions collected under this plan. It is intended that works programs and application of funds collected under this plan to those works will be determined as part of Council's annual Integrated Planning & Reporting process. A contribution shall be paid on a quarterly basis at the applicable indexed rate based on the tonnage hauled for that period. Payments shall be made with a "haulage return" that discloses information including information including applicable quarter, quantities of material, tonnage rate, contribution payment and the like and be certified by a company officer. Where there has been no heavy haulage a nil return is required to be submitted.
The Ballina Heavy Haulage Contribution Plan contains a comprehensive description of the background to the rate applied by Ballina Shire to Extractive Industry and the incremental cost of truck movements on the cost of maintaining roads. Contributions rates adopted in the Ballina Plan are also adopted in the equivalent Tweed Shire Plan. 7.2 Comments It was beyond the scope and resources of this study to comprehensively review the cost impacts of truck movements on rural road design life and maintenance. However, we are of the view that the Ballina Heavy Haulage Contribution Plan represents a researched and reasonable approach to determining an appropriate and fair contribution. However, we are of the view that it is not reasonable for funds collected under the Plan to be placed into a consolidated fund which would be expended at Council’s discretion. In our view this has the potential to offend the key primary principles of nexus and accountability described in the NSW state government document Local Development Contributions Practice Note, Nov 2010, extracts of which are provided below in italics.
Reasonableness relates to nexus and apportionment. Nexus refers to the connection between the development and the demand created. The requirement to satisfy nexus is based on ensuring that there is a link between the development and increased demand for facilities. In addition, the infrastructure needs to be provided within a timeframe that meets the demand.
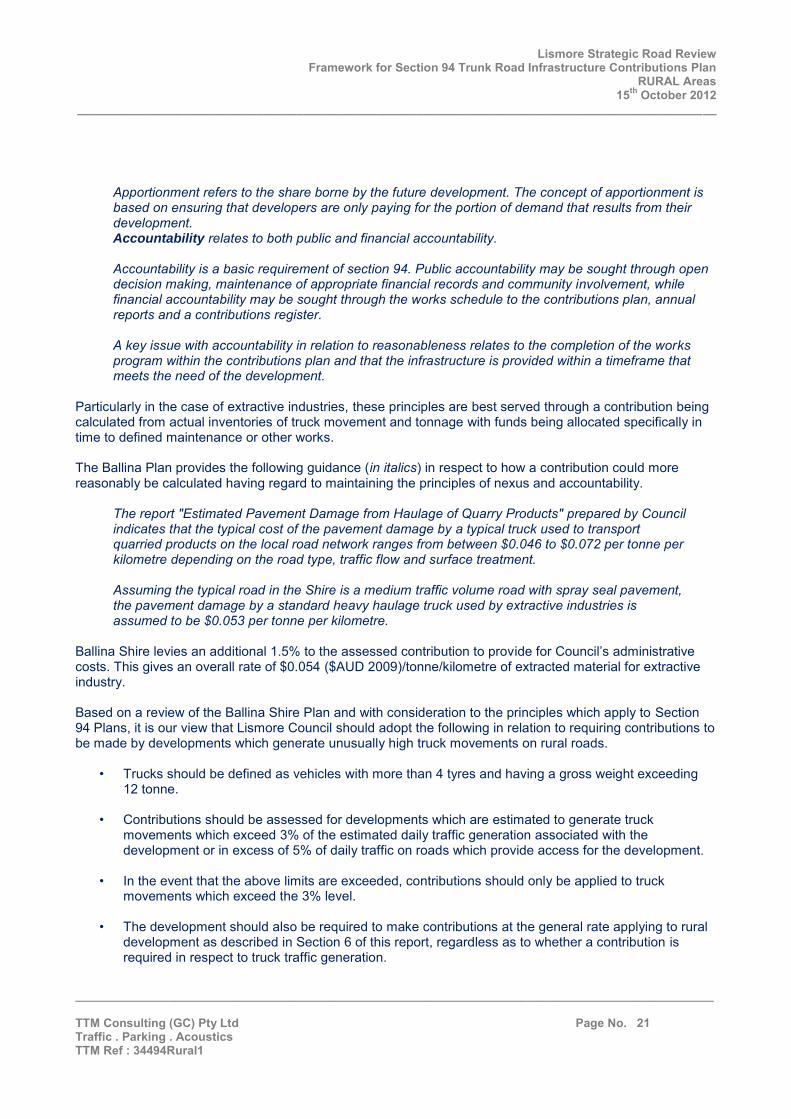
Lismore Strategic Road Review Framework for Section 94 Trunk Road Infrastructure Contributions Plan
RURAL Areas 15th October 2012
________________________________________________________________________________________________
________________________________________________________________________________________________ TTM Consulting (GC) Pty Ltd Page No. 21 Traffic . Parking . Acoustics TTM Ref : 34494Rural1
Apportionment refers to the share borne by the future development. The concept of apportionment is based on ensuring that developers are only paying for the portion of demand that results from their development. Accountability relates to both public and financial accountability. Accountability is a basic requirement of section 94. Public accountability may be sought through open decision making, maintenance of appropriate financial records and community involvement, while financial accountability may be sought through the works schedule to the contributions plan, annual reports and a contributions register. A key issue with accountability in relation to reasonableness relates to the completion of the works program within the contributions plan and that the infrastructure is provided within a timeframe that meets the need of the development.
Particularly in the case of extractive industries, these principles are best served through a contribution being calculated from actual inventories of truck movement and tonnage with funds being allocated specifically in time to defined maintenance or other works. The Ballina Plan provides the following guidance (in italics) in respect to how a contribution could more reasonably be calculated having regard to maintaining the principles of nexus and accountability.
The report "Estimated Pavement Damage from Haulage of Quarry Products" prepared by Council indicates that the typical cost of the pavement damage by a typical truck used to transport quarried products on the local road network ranges from between $0.046 to $0.072 per tonne per kilometre depending on the road type, traffic flow and surface treatment. Assuming the typical road in the Shire is a medium traffic volume road with spray seal pavement, the pavement damage by a standard heavy haulage truck used by extractive industries is assumed to be $0.053 per tonne per kilometre.
Ballina Shire levies an additional 1.5% to the assessed contribution to provide for Council’s administrative costs. This gives an overall rate of $0.054 ($AUD 2009)/tonne/kilometre of extracted material for extractive industry. Based on a review of the Ballina Shire Plan and with consideration to the principles which apply to Section 94 Plans, it is our view that Lismore Council should adopt the following in relation to requiring contributions to be made by developments which generate unusually high truck movements on rural roads.
• Trucks should be defined as vehicles with more than 4 tyres and having a gross weight exceeding 12 tonne.
• Contributions should be assessed for developments which are estimated to generate truck
movements which exceed 3% of the estimated daily traffic generation associated with the development or in excess of 5% of daily traffic on roads which provide access for the development.
• In the event that the above limits are exceeded, contributions should only be applied to truck movements which exceed the 3% level.
• The development should also be required to make contributions at the general rate applying to rural
development as described in Section 6 of this report, regardless as to whether a contribution is required in respect to truck traffic generation.

Lismore Strategic Road Review Framework for Section 94 Trunk Road Infrastructure Contributions Plan
RURAL Areas 15th October 2012
________________________________________________________________________________________________
________________________________________________________________________________________________ TTM Consulting (GC) Pty Ltd Page No. 22 Traffic . Parking . Acoustics TTM Ref : 34494Rural1
• A development should be subject to both the general rate applying to rural development and the rate specifically associated with truck movements.
• A contribution rate of $0.054 ($AUD 2009)/tonne/kilometre should be applied to extractive industry.
This rate should be indexed to reflect the time at which the contribution is calculated.
• Extractive industry should be required to pay quarterly contributions based on a quarterly log of material extracted.
• Non-extractive industry should be required to make contribution at the same rate as that applying to
extractive industry. However, contributions should generally be made as a single payment prior to commencement of the development based on estimates of tonnage over a 10 year planning horizon, discounted at the relevant discount rate adopted by state treasury for the purposes of financial analysis. For example, at a discount rate of 6% per annum this would equate to approximately $0.40 ($AUD 2009)/tonne/kilometre applied against the average tonnes/annum over 10 years.
• The kilometers of travel applying to the calculation of the contribution for extractive and non-
extractive industry should be based on an assessment of the actual distance over which haulage will occur on the Council funded network or an average haulage distance as adopted by Council, whichever the greater.
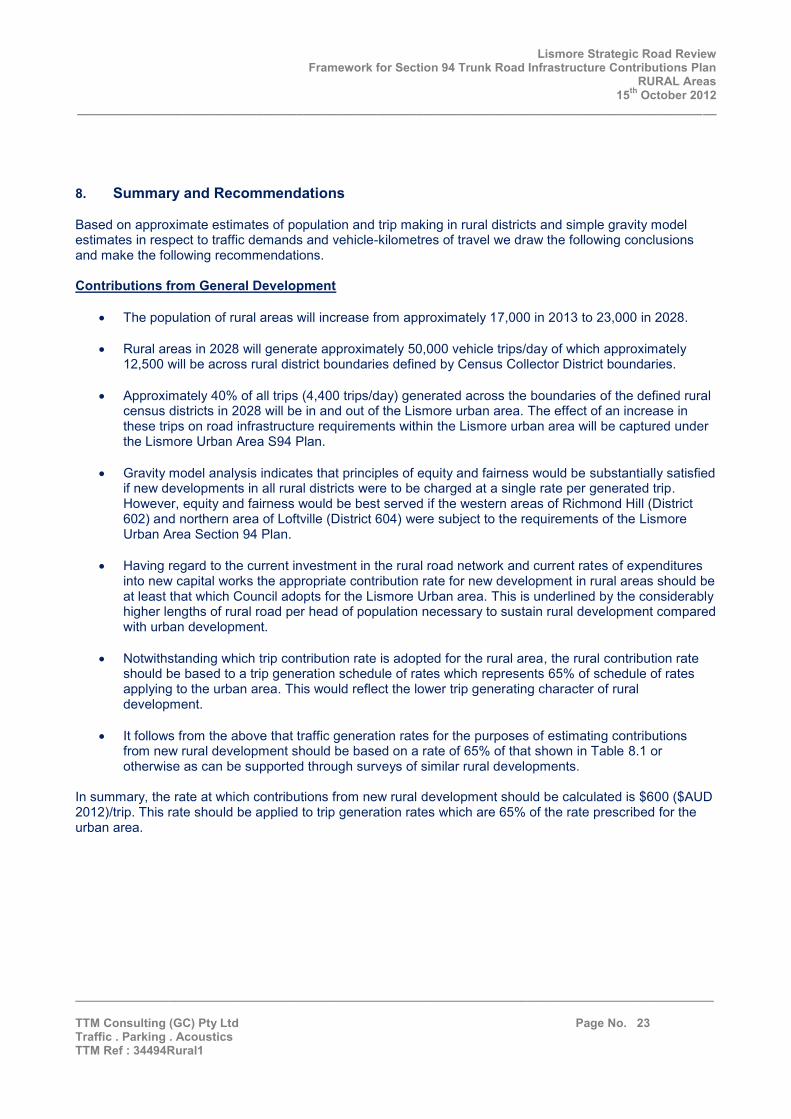
Lismore Strategic Road Review Framework for Section 94 Trunk Road Infrastructure Contributions Plan
RURAL Areas 15th October 2012
________________________________________________________________________________________________
________________________________________________________________________________________________ TTM Consulting (GC) Pty Ltd Page No. 23 Traffic . Parking . Acoustics TTM Ref : 34494Rural1
8. Summary and Recommendations Based on approximate estimates of population and trip making in rural districts and simple gravity model estimates in respect to traffic demands and vehicle-kilometres of travel we draw the following conclusions and make the following recommendations. Contributions from General Development
The population of rural areas will increase from approximately 17,000 in 2013 to 23,000 in 2028.
Rural areas in 2028 will generate approximately 50,000 vehicle trips/day of which approximately 12,500 will be across rural district boundaries defined by Census Collector District boundaries.
Approximately 40% of all trips (4,400 trips/day) generated across the boundaries of the defined rural
census districts in 2028 will be in and out of the Lismore urban area. The effect of an increase in these trips on road infrastructure requirements within the Lismore urban area will be captured under the Lismore Urban Area S94 Plan.
Gravity model analysis indicates that principles of equity and fairness would be substantially satisfied
if new developments in all rural districts were to be charged at a single rate per generated trip. However, equity and fairness would be best served if the western areas of Richmond Hill (District 602) and northern area of Loftville (District 604) were subject to the requirements of the Lismore Urban Area Section 94 Plan.
Having regard to the current investment in the rural road network and current rates of expenditures into new capital works the appropriate contribution rate for new development in rural areas should be at least that which Council adopts for the Lismore Urban area. This is underlined by the considerably higher lengths of rural road per head of population necessary to sustain rural development compared with urban development.
Notwithstanding which trip contribution rate is adopted for the rural area, the rural contribution rate should be based to a trip generation schedule of rates which represents 65% of schedule of rates applying to the urban area. This would reflect the lower trip generating character of rural development.
It follows from the above that traffic generation rates for the purposes of estimating contributions
from new rural development should be based on a rate of 65% of that shown in Table 8.1 or otherwise as can be supported through surveys of similar rural developments.
In summary, the rate at which contributions from new rural development should be calculated is $600 ($AUD 2012)/trip. This rate should be applied to trip generation rates which are 65% of the rate prescribed for the urban area.

Lismore Strategic Road Review Framework for Section 94 Trunk Road Infrastructure Contributions Plan
RURAL Areas 15th October 2012
________________________________________________________________________________________________
________________________________________________________________________________________________ TTM Consulting (GC) Pty Ltd Page No. 24 Traffic . Parking . Acoustics TTM Ref : 34494Rural1
Contributions From Truck Generating Development For developments which generate significant amounts of truck traffic we recommend that contributions towards new road infrastructure, reduced road life and increased maintenance should be based on the following approach.
• Trucks should be defined as vehicles with more than 4 tyres and having a gross weight exceeding 12 tonne.
• Contributions should be assessed for developments which are estimated to generate truck
movements which exceed 3% of the estimated daily traffic generation associated with the development or in excess of 3% of daily traffic on roads which provide access for the development.
• In the event that the above limits are exceeded, contributions should only be applied to truck movements which exceed the 3% level.
• The development should also be required to make contributions at the general rate applying to rural
development as described in Section 6 of this report, regardless as to whether a contribution is required in respect to truck traffic generation.
• A contribution rate of $0.054 ($AUD 2009)/tonne/kilometre should be applied to extractive industry.
This rate should be indexed to reflect the time at which the contribution is to be paid.
• Extractive industry should be required to pay quarterly contributions based on a quarterly log of material extracted.
• Non-extractive industry should be required to make contribution at the same rate as that applying to extractive industry. However, contributions should generally be made as a single payment prior to commencement of the development based on estimates of tonnage over a 10 year planning horizon, discounted at the relevant discount rate adopted by state treasury for the purposes of financial analysis. For example, at a discount rate of 6% per annum this would equate to approximately $0.40 ($AUD 2009)/tonne/kilometre applied against the average tonnes/annum over 10 years.
• The kilometers of travel applying to the calculation of the contribution for extractive and non-
extractive industry should be based on an assessment of the actual distance over which haulage will occur on the Council funded network or an average haulage distance as adopted by Council, whichever the greater.
These recommendations should be applied into formulating a Rural Areas Section 94 Road Infrastructure Contributions Plan in the period to 2028. All aspects of this Plan should be the subject of review at 5 year intervals.
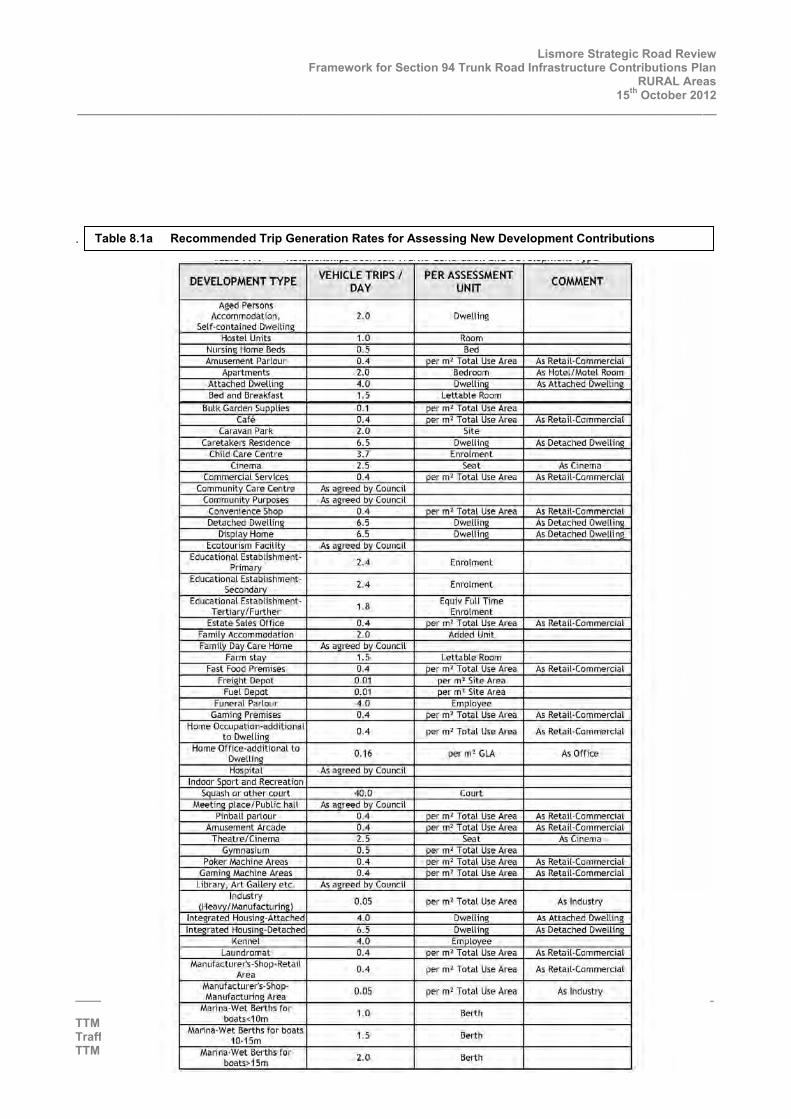
Lismore Strategic Road Review Framework for Section 94 Trunk Road Infrastructure Contributions Plan
RURAL Areas 15th October 2012
________________________________________________________________________________________________
________________________________________________________________________________________________ TTM Consulting (GC) Pty Ltd Page No. 25 Traffic . Parking . Acoustics TTM Ref : 34494Rural1
.
Table 8.1a Recommended Trip Generation Rates for Assessing New Development Contributions ·----- .. .. · ·- · --·-··- · ·· r-- ---·· - -.-• ,. · - · . .. - - - · · - ·--· -·· - ·-- - - · - ·-r• • ..--·•- · r-
DEVELOPMENT TYPE VEHICLE TRIPS / PER ASSESSMENT COMMENT DAY UNIT Aged Persor,s
Accommodation , 2.0 Dwelling Self-con tained Dwellinl?
Hostel Units 1.0 Room Nursinl? Home Beds 0.5 Bed Amusement Parlour 0.-4 oer m2 Total Use Area As Retail-Commercial
Apartments 2.0 Bedroom As Hotel/Motel Room Attached DWellinl! 4.0 Dwellinl! As Attached DwellinR Bed and Breakfast 1.5 Letlable Room
BUik.Garden Supplies 0.1 per m2 Total Use Area Cafe 0.4 per m2 Total Use Area As Retail -Commercial
Caravan Park 2.0 Site caretakers Residence 6.5 Dwellinl! As Detached Dwellfn11
Child Care Centre 3.7 Enl'olment Cinema 2.5 Seat As Cinema
Commercial Services 0.4 per m2 Total Use Area As Reta il-Commercial Community Care Centre As aRreed by Council
Community Purposes As aRreed by Council Convenience Shoo 0.4 per m 2 Total LJse Area As Retail-Commercial Detached DwellinR 6.5 Dwellil1R As Detached Owellin!l
Display Home 6.5 Dwelling As Detached Dwelling Ecotoulism facility As agreed by Counc11
Educational Establ1shment· 2.4 Enrolment Pr imarv Educational Establishment-
2.4 Enrolment Secondary Educational Estab(ishmenl- 1.8 Equiv Full Time
Tert iary/Further Enrolment Estate Sa les Office 0.4 Iler m• Total Use Area As Retail-Commercial
Family Accommodation 2.0 Added Unil Family Day Care Home As agreed by Council
Farm stay 1.5 lettable Room Fast food Premises 0.4 per m 1 Total Use Area As Retail -Commercial
Frei,iht Deoot o.o, perm' Si te Area Fuel Deoot 0.01 per mt Site Area
Funeral Parlour 4 .0 Emplovee Garnin~ Premises 0.4 oer m' Total Use Area As Retail-Commercial
Home Occupation-addi~ional 0.4 perm' Total Use Area As Retail -Commercial to Dwellin!!
Home Office-additional to 0.16 per m1 GLA As Office Dwellfnl! Hospita l As agreeel by Council
Indoor Sport and Recreat ion Squash or other court 40.0 Court
Meeting place/ Public hall As agreed by Council Pinball paI1our 0.4 per m' Total lJse Area As Retafl·Commerdal
Amusement Arcade O.◄ per m2 Total Use Area As Retail -Commercial Theatre/Cinema 2. 5 Seat As Cinema
Gymnasium 0.5 per m 2 Tota I Use Area Poker Machi ne Areas 0.4 per m1 Total Use Area As Retail-Commercial
Gaming Machine Areas 0.4 perm' Total Use Area As Retail-Commercial Librarv, Art Gallery etc. As al!reed by Council
Industry 0.05 per ml Total Use Area As Industry (Heavy/Manufacturing)
Integrated Housing-Attached 4.0 Dwelling As Attached Dwelling Integrated Housin_g-Detached 6.5 Dwell ing As Detached Dwelling
Kennel 4.0 Employee Laundromat 0.4 per m 2 Total lJse Area As Retai l -Commercial
Manufacturer's-Shop•Retall 0.4 per m2 Total lJse Area As Retail-Commercial Area
Manufacturer's-Shop- P,05 per m1 Total Use A~a As lndustIy Manufacturinl! Area Marina-Wet Berths ror 1.0 Berth
boals<10m Manna-wet Berths for bOats
1.5 Berth 10-1 sm Marina-Wet Berths for 2.0 Berth
boals>15m

Lismore Strategic Road Review Framework for Section 94 Trunk Road Infrastructure Contributions Plan
RURAL Areas 15th October 2012
________________________________________________________________________________________________
________________________________________________________________________________________________ TTM Consulting (GC) Pty Ltd Page No. 26 Traffic . Parking . Acoustics TTM Ref : 34494Rural1
Table 8.1b Recommended Trip Generation Rates for Assessing New Development Contributions
DEVELOPMENT TYPE VEHICLE TRIPS / PER ASSESSMENT COMMENT DAY UNIT
M,vina-Dry Berth o r Swing 0.5 Berth/ Moonng
Mccline Marina-Ancillary Activities 0.05 per m1 Total Use Area As Industry
Marina-Shop 0.4 per m1 Total Use Area As Retail-Commercial Market As agreed by Council
Medical Centre 0.4 oer m1 Total Use Area As Retail-Commercial Mini Warehouse or Selr As agreed by Council
Storage Facil ity Minor Tourist Facility As agreed by Council Motel-ManageI' s Unit 4.0 Dwelling As Attached Dwelling Motel -Motel Rooms- 2.0 Bedroom As Hotel/ Motel Room Motel-Restaurant 0.4 per m1 Total Use Area As Retail -Commercial
Night Club 0.4 per m1 Total Use Area As Retail-Commercial Ottke 0.16 per m1 GLA As Offfce
Outdoor Sport and Recreation
Tennis or other Court 40.0 Court b.awn Bowls 40.0 Green
Skating Rinks 0.1 per m2 Total Use Area Swlmm1ng Pools 0.1 per m2 Total Use Area
Golf Course 10.0 Hole Golf Course Clubhouse 0.4 per m1 Total Use Area As Retail-Commercial
Racecourse As al!reed bv Council Sporting Arena As agreed by Council
Clubhouse 0.4 oer m' Total Use Area As Re.tail -Commercial Place of Worship 0.04 perm• GLA Rereption Room 0.4 beI· m2 Total Use Area As Retail-Commercial
Relocatable Home Park 3.0 Site Residential Hotel-Bedroom 2.0 Bedroom As Hotel / Motel Room Residential Hotel -Ancillary 0.4 per m1 Total Use Area As Retail -Commercial
Uses Resort Hotel -Bedroom 2.0 Bedroom As Hotel /Motel Room
Resort Hotel-Ancillary Uses 0.4 per m 2 Total Use Area As Retail -Commercial Rest ricted Club 0.4 Der m2 Total Use Area As Retail-Commercial
Restaurant 0.4 per m2 Total Use Area As Retail-Commercial Retail-Commercial 0.4 per m2 Total Use Area As Retail-Commercial
Development Retail Plant Nurserv 0.1 per m1 Total Use Area
Rura l Industry 4.0 Employee hOUSed off-site
Salvage Yard 0.05 per m1 Total Use Area As Industry Serviced AParlment 2.5 Bedroom
Service lndustrv 0.2 Perm' Total Use Area As Service l~dustrv Service Station,Fllel Pumps 80.0 Pumo Service Slalion-Service Bavs 0.2 oer m2 Total Use Area As Service lndustrv
Service Station-Shop, As Retafl -Commercial ,
0.4 per m1 Total Use Area but with ext rn llnk.ed Restaurant, ·etc
t rips Shop 0.4 per m2 Total Use Area As Retail-Commercial
Shoppjng Centre 0.4 peI· m' Total Use Area As Retail -Commercial Development
Showroom 0.2 per m1 Total Use Area Special Accommodation 6.5 Dwelling As Detached Dwelli ng
Stall As aQreed bV Council Surgery-additional to 0.4 per m1 Total Use Area As Retail -Commercial
Dwelling Take Away Food Premises 0.4 per m1 Total Use Area As Retail-Commerclal Tavern-Lounge, Sor. Beer 0.4 pet mi Total Use Area As Retail-Commerdal
Garden, etc.
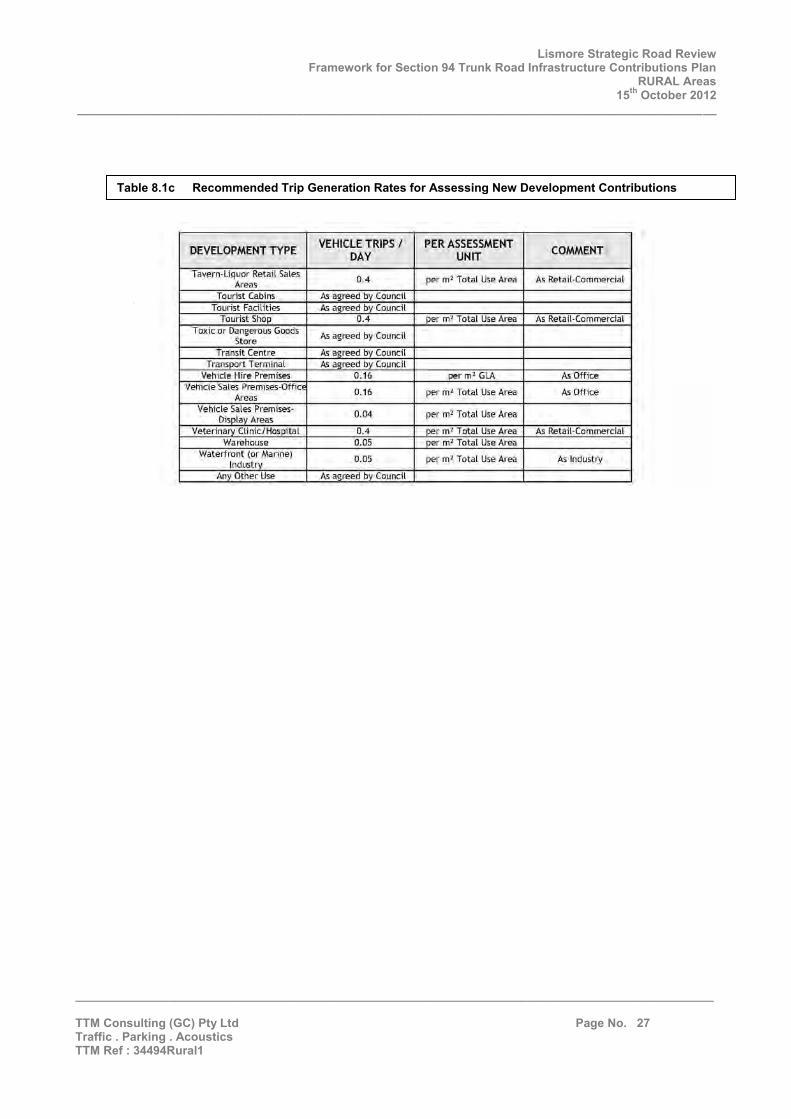
Lismore Strategic Road Review Framework for Section 94 Trunk Road Infrastructure Contributions Plan
RURAL Areas 15th October 2012
________________________________________________________________________________________________
________________________________________________________________________________________________ TTM Consulting (GC) Pty Ltd Page No. 27 Traffic . Parking . Acoustics TTM Ref : 34494Rural1
Table 8.1c Recommended Trip Generation Rates for Assessing New Development Contributions
DEVELOPMENT TYPE VEHICLE TRIPS / PER ASSESSMENT COMM.ENT DAY UNIT
Tavern-liquor Retail Sales 0.4 per m 1 Total Use Area As Retail-Commercial Areas Tourist Cabins As agreed by Council
Tourist Facilities As a2reed bv Council Tourist Shop 0.4 per m1 Tola) Use Area As R.etail -Commercial
Toxic or Dangerous Goads As agreed by Council
Store Transit Centre As agreed by Council
Transport Terminal As agreed by Council Vehicle Hire Premises 0.16 perm1 GLA As Office
Vehicle Sales Premise.s-Otfic1 0.16 per m> Total Use Area As Office Areas
Vehicle Sales Premises- 0.04 per m1 Total Use Area Display Areas Velerinarv Clinic./Hospilal 0.4 per m1 Total Use Area As Retail-Commercial
Warehouse 0.05 per m1 Total Use Area Waterfront (or Marine) 0.05 per m1 Total Use Area As Industry
Industry Any Other Use As al!reed bv Council
Lismore Strategic Road Review Framework for Section 94 Trunk Road Infrastructure Contributions Plan
RURAL Areas 15th October 2012
________________________________________________________________________________________________
________________________________________________________________________________________________ TTM Consulting (GC) Pty Ltd Page No. 28 Traffic . Parking . Acoustics TTM Ref : 34494Rural1
Attachments

Attachment No. 1
LISMORE
State Highways and Regional Roads
N
A
rrweed Heads
Legend
- State Roads
-- Regional Roads
0 2S SO 100 150 200 "~- State and Regional Roads

Lismore Strategic Road Review Framework for Section 94 Trunk Road Infrastructure Contributions Plan
RURAL Areas 15th October 2012
________________________________________________________________________________________________
________________________________________________________________________________________________ TTM Consulting (GC) Pty Ltd Page No. 2 Traffic . Parking . Acoustics TTM Ref : 34494Rural1
Attachment No. 2
Arterial Sub Arterial Collector
<none > Local
-
Lismore City Wide Road Study
Figure 7.1a Short Term Road Hierarchy (Rural Area)
PO Box 248, Concord West NSW 2138 Australia PPK
EnvlronmentAlnfraa~rudure
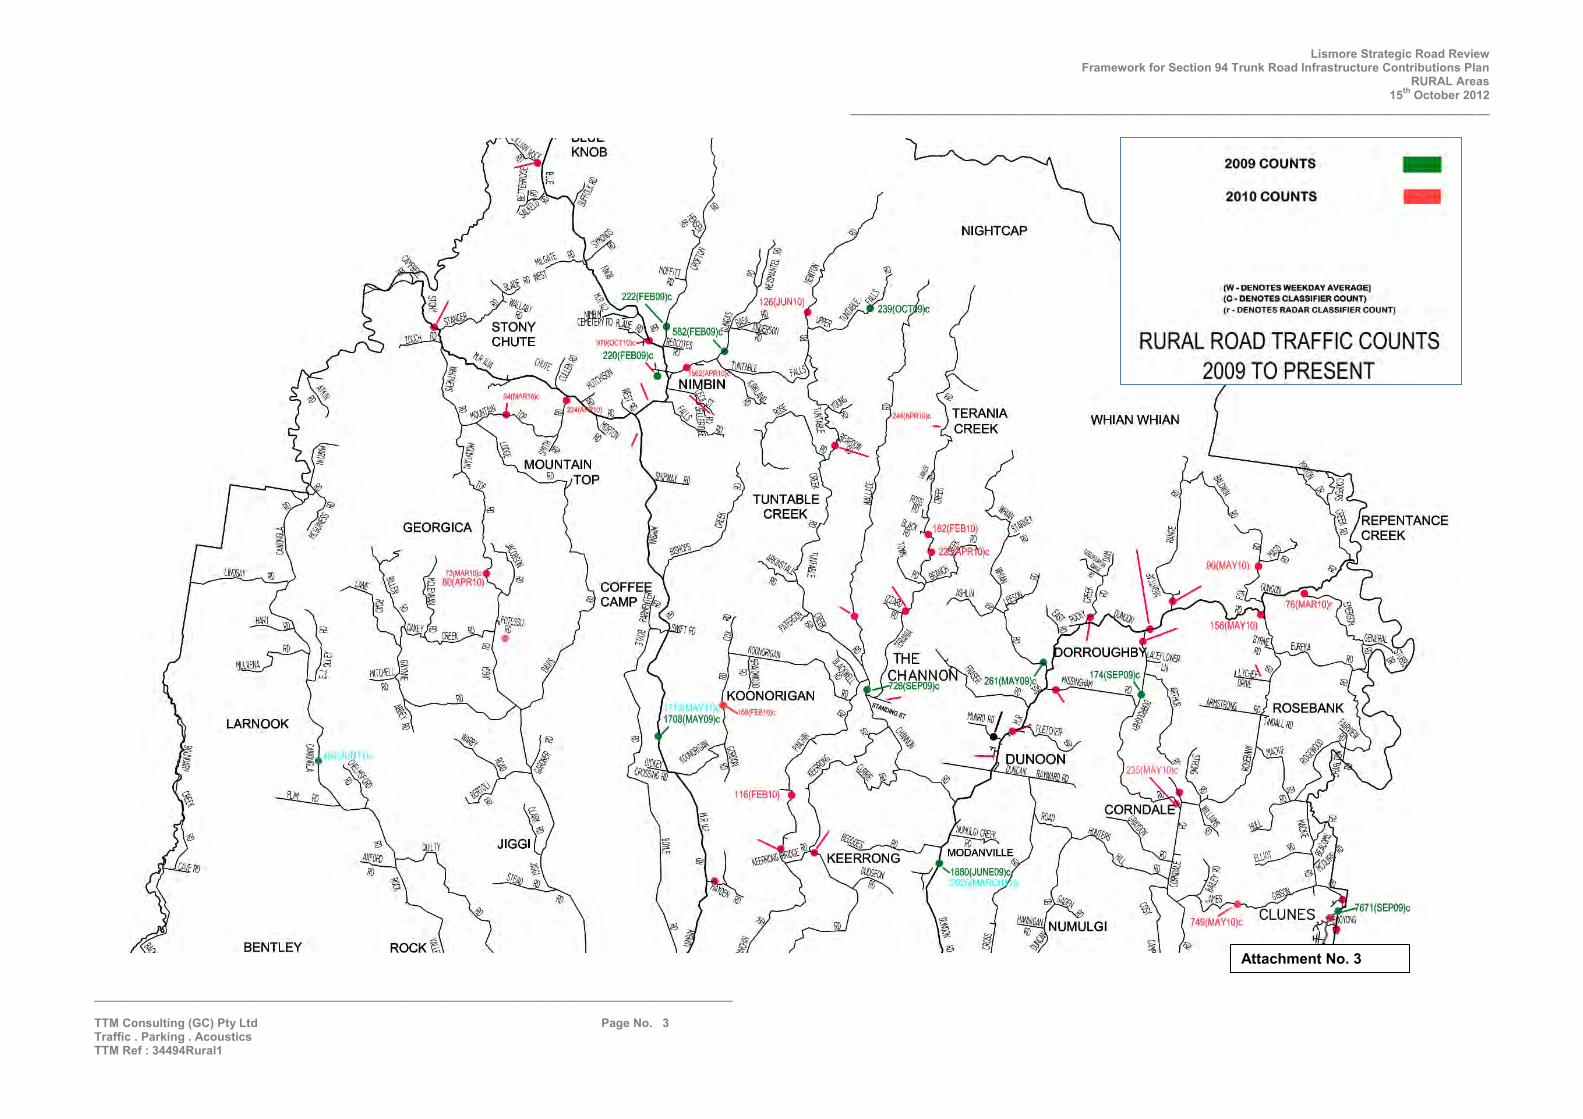
Lismore Strategic Road Review Framework for Section 94 Trunk Road Infrastructure Contributions Plan
RURAL Areas 15th October 2012
________________________________________________________________________________________________
________________________________________________________________________________________________ TTM Consulting (GC) Pty Ltd Page No. 3 Traffic . Parking . Acoustics TTM Ref : 34494Rural1
Attachment No. 3
NIGHTCAP
LARNOOK
BENTLEY
2009COUNTS
2010COUNTS
(W • DENOTES WEEKDAY AVERAGE) (0 - DENOTES CLASSIFIER COUNT►
(r - OENOTES RAOAR CLASSIFIER COUNT)
--RURAL ROAD TRAFFIC COUNTS
2009 TO PRESENT
WHIANWHIAN

Lismore Strategic Road Review Framework for Section 94 Trunk Road Infrastructure Contributions Plan
RURAL Areas 15th October 2012
________________________________________________________________________________________________
________________________________________________________________________________________________ TTM Consulting (GC) Pty Ltd Page No. 4 Traffic . Parking . Acoustics TTM Ref : 34494Rural1
Attachment No. 4
BENTLEY
BUNGABBEE
2009COUNTS
2010 COUNTS
(W • DENOTES WEEKDAY AVERAGE) (0 · DENOTES CLASSIFIER COUNT),
1 , " 11 FERNSIDE 2725(AUG 643(MAY09)c TUNCE
-( r • DENOTES RADAR CLASSIFIER COUNT)
RURAL ROAD TRAFFIC COUNTS 2009 TO PRESENT
189(MAR10)
SOUTH
NUMULGI
)c MCLEANS RIDGES
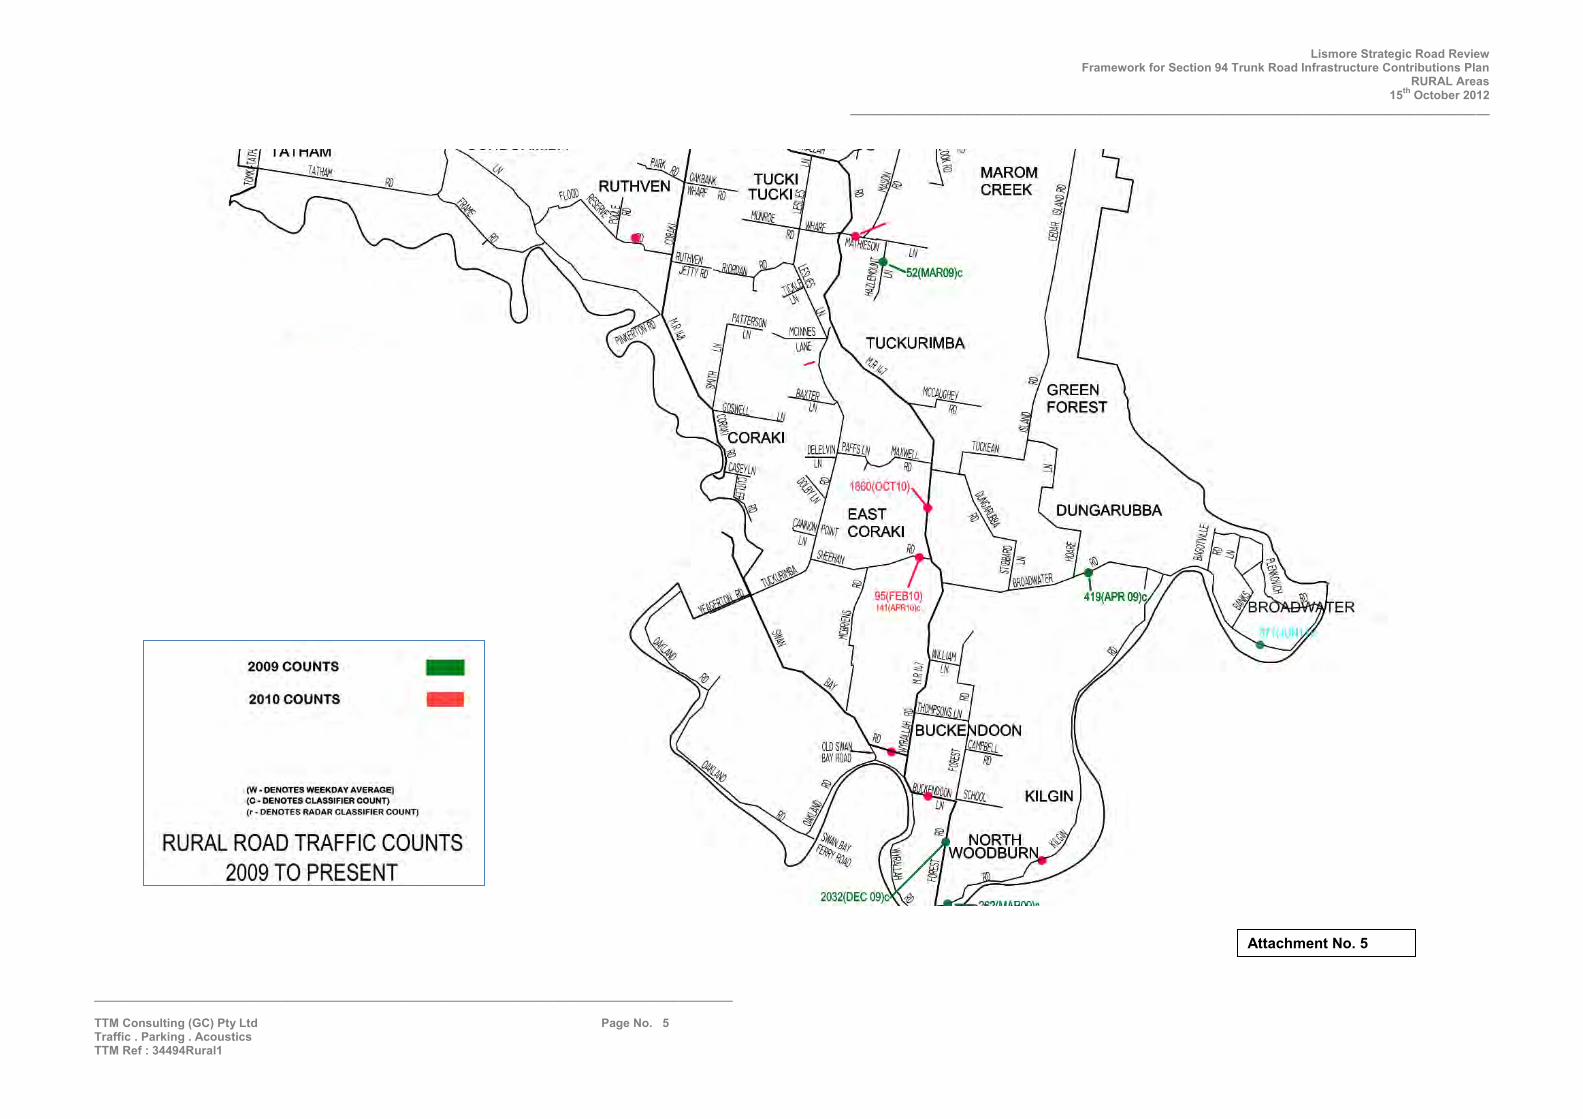
Lismore Strategic Road Review Framework for Section 94 Trunk Road Infrastructure Contributions Plan
RURAL Areas 15th October 2012
________________________________________________________________________________________________
________________________________________________________________________________________________ TTM Consulting (GC) Pty Ltd Page No. 5 Traffic . Parking . Acoustics TTM Ref : 34494Rural1
Attachment No. 5
2009 COUNTS
2010 COUNTS
(W • DENOTES WEEKOAY AVERAGE) (0 • DENOTES CLASSIFIER COUNT) (r - ClENOT&', RA0AR CLASSIFIER COIJNT)
--RURAL ROAD TRAFFIC COUNTS
2009 TO PRESENT
52{MAR09}c
MAROM CREEK
~ GREEN FOREST
KILGIN

Lismore Strategic R
oad Review
Fram
ework for Section 94 Trunk R
oad Infrastructure Contributions Plan
RU
RA
L Areas
15th O
ctober 2012 ________________________________________________________________________________________________
________________________________________________________________________________________________ TTM
Consulting (G
C) Pty Ltd
Page N
o. 6 Traffic . Parking . A
coustics TTM
Ref : 34494R
ural1
Su
bu
rb (C
en
sus C
olle
ction
District)
AB
S 2
00
6 P
op
ula
tion
Lon
gitu
de
Latitu
de
Blu
e K
no
b (1
06
17
01
)1
90
-28
.55
07
15
3.1
97
1
Nim
bin
(10
61
70
2)
35
2-2
8.5
95
83
61
53
.22
29
6
Nim
bin
(10
61
70
3)
31
0-2
8.5
53
81
53
.25
7
Nim
bin
(10
61
70
6)
46
3-2
8.6
13
51
53
.21
83
Nim
bin
(10
61
71
1)
23
9-2
8.5
65
81
53
.16
9
Larn
oo
k (10
61
70
7)
86
2-2
8.6
43
91
53
.15
78
Larn
oo
k (10
61
70
8)
54
5-2
8.6
66
18
11
53
.11
17
56
Ko
on
origa
n (1
06
17
05
)4
49
-28
.66
29
54
15
3.2
39
75
4
Ko
on
origa
n (1
06
17
10
)4
32
-28
.67
69
15
3.1
81
9
Tu
nta
ble
Cre
ek (1
06
70
4)
32
4-2
8.6
57
60
91
53
.26
65
68
Te
ran
ia C
ree
k (10
67
09
)1
99
-28
.60
68
43
15
3.3
00
24
Du
no
on
(10
61
80
1)
83
7-2
8.6
42
11
53
.31
39
Du
no
on
(10
61
81
2)
37
2-2
8.6
83
75
21
53
.31
60
09
Ro
seb
an
k (10
61
80
2)
25
6-2
8.6
41
31
53
.35
69
Ro
seb
an
k (10
61
80
4)
52
6-2
8.6
77
74
51
53
.38
76
61
Co
rnd
ale
(10
61
80
3)
39
3-2
8.7
00
88
31
53
.36
53
56
Ke
erro
ng (1
06
18
08
)3
46
-28
.70
48
76
15
3.2
64
69
3
Mo
da
nville
(10
61
81
0)
51
7-2
8.7
15
69
71
53
.29
79
23
Nu
mu
lgi (10
61
80
7)
33
8-2
8.7
44
23
41
53
.32
48
22
Be
xhill (1
06
18
06
)4
71
-28
.76
27
36
15
3.3
46
43
6
Clu
ne
s (10
61
80
5)
39
2-2
8.7
30
51
53
.38
73
Clu
ne
s (10
61
80
9)
52
2-2
8.7
27
48
41
53
.40
76
17
Elth
am
(10
61
60
9)
59
0-2
8.7
55
73
31
53
.39
47
26
Bla
keb
roo
k (10
61
81
1)
34
9-2
8.7
63
54
41
53
.23
11
06
Rich
mo
nd
Hill (1
06
16
02
)7
29
-28
.78
05
71
15
3.3
42
96
8
Rich
mo
nd
Hill (1
06
16
10
)4
69
-28
.78
94
15
3.3
36
7
Ca
nia
ba
(10
61
60
1)
51
9-2
8.8
13
21
53
.20
95
No
rth Lism
ore
85
2-2
8.8
01
77
81
53
.26
86
73
Lismo
re H
eigh
ts2
,49
4-2
8.8
03
77
61
53
.29
99
53
Go
on
ella
ba
h1
2,1
38
-28
.81
99
88
15
3.3
28
45
4
Lismo
re3
,56
8-2
8.8
09
11
53
.29
2
Gira
rds H
ill1
,20
3-2
8.8
17
30
41
53
.27
70
15
Ea
st Lismo
re5
,21
1-2
8.8
21
11
61
53
.28
98
57
Sou
th Lism
ore
1,9
10
-28
.81
61
99
15
3.2
61
38
Lind
en
da
le (1
06
16
08
)5
73
-28
.82
62
57
15
3.3
78
03
5
Loftville
(10
61
60
4)
29
8-2
8.8
29
64
61
53
.26
49
05
Tre
gea
gle (1
06
16
03
)6
52
-28
.84
79
37
15
3.3
56
28
5
Sou
th G
un
du
rimb
a (1
06
16
11
)4
80
-28
.84
80
54
15
3.2
10
15
3
Sou
th G
un
du
rimb
a (1
06
16
12
)3
54
-28
.88
82
16
15
3.2
59
50
8
Tu
cki Tu
cki (10
61
60
5)
40
2-2
8.9
29
44
21
53
.31
41
55
Ea
st Co
raki (1
06
16
06
)3
56
-29
.01
64
35
15
3.3
04
11
6
TO
TA
L 20
06
PO
PU
LAT
ION
42
48
2
Locatio
ns are
taken fro
m C
ensu
s Co
llectio
n D
istricts (smalle
st data u
nit) o
r State Su
bu
rbs fro
m th
e 2
00
6 C
ensu
s
Po
pu
lation
s sho
wn
are co
llecte
d from
a single
sou
rce to
ensu
re th
at each
locatio
n an
d p
op
ulatio
n are
com
ple
tely se
parate
All lo
ngtitu
de
and
latitud
es are
ob
taine
d from
search
ing th
e su
rbu
rb n
ame
in go
ogle
map
s un
less ye
llow
.
Yello
w co
-ord
inate
s have
be
en e
stimate
d base
d on
the
Ce
nsus C
olle
ction
District are
a
Attachment N
o. 6
1·061707
1061708
1061603
1061605
1061606
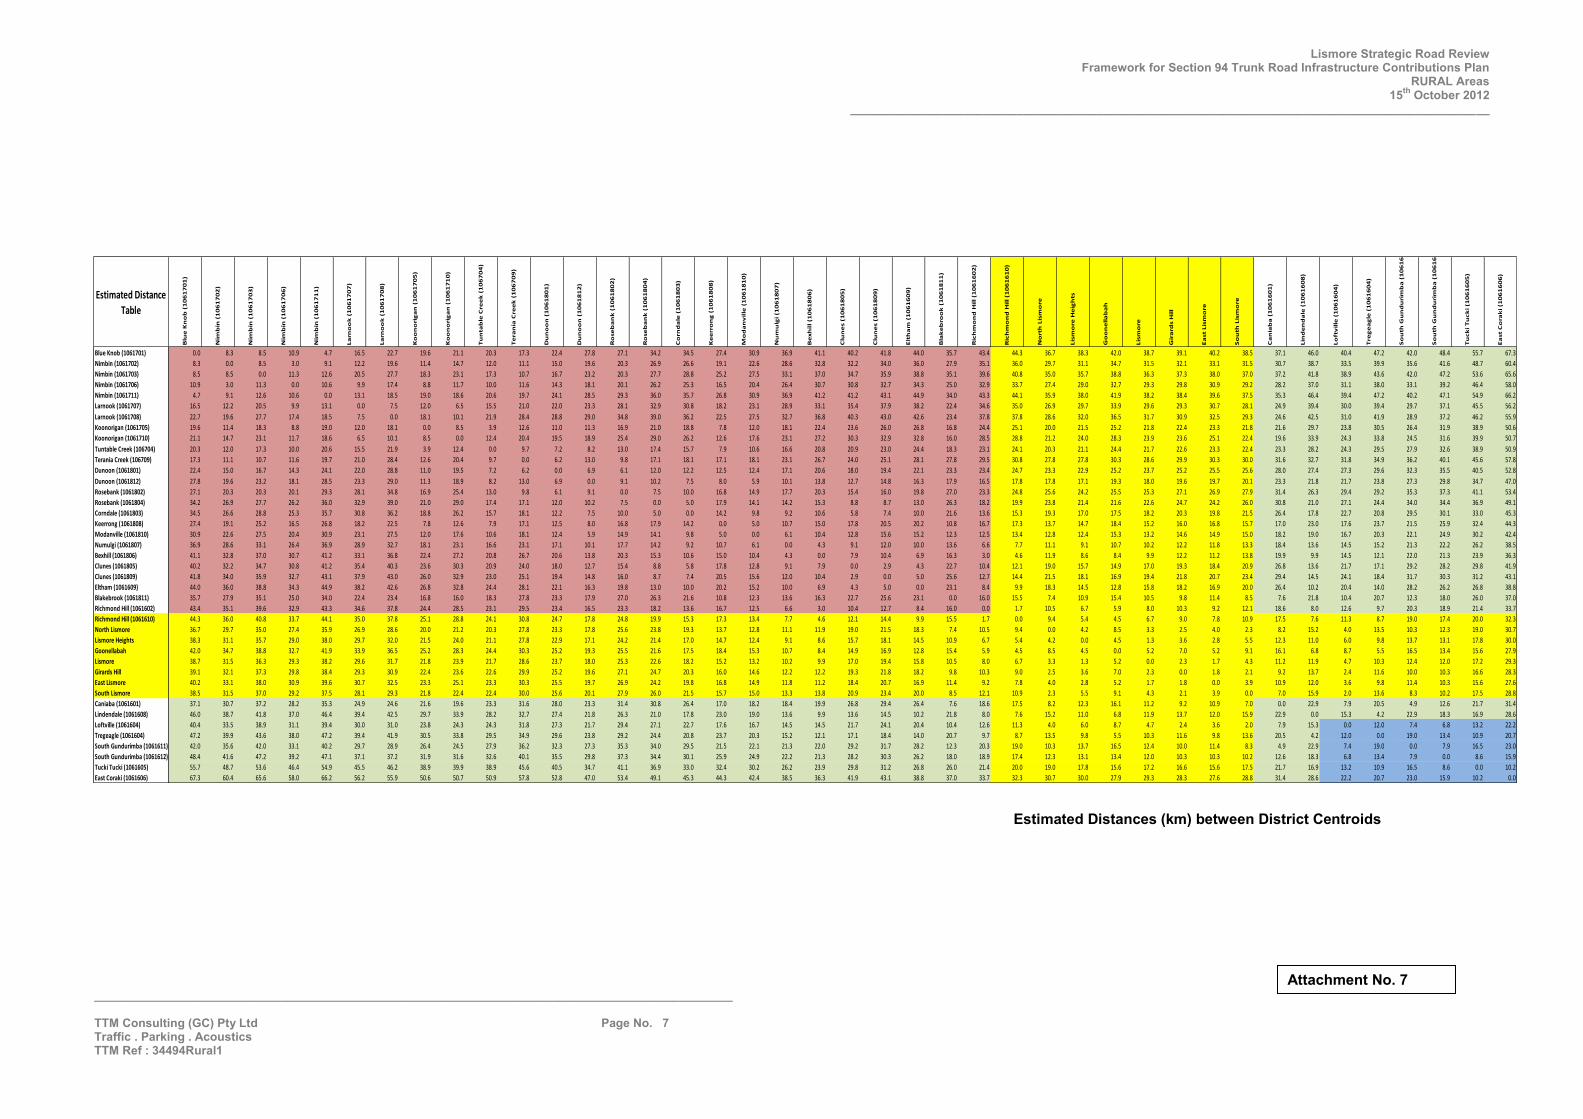
Lismore Strategic Road Review Framework for Section 94 Trunk Road Infrastructure Contributions Plan
RURAL Areas 15th October 2012
________________________________________________________________________________________________
________________________________________________________________________________________________ TTM Consulting (GC) Pty Ltd Page No. 7 Traffic . Parking . Acoustics TTM Ref : 34494Rural1
Estimated Distance
Table
Blu
e K
no
b (
10
61
70
1)
Nim
bin
(1
06
17
02
)
Nim
bin
(1
06
17
03
)
Nim
bin
(1
06
17
06
)
Nim
bin
(1
06
17
11
)
La
rno
ok
(1
06
17
07
)
La
rno
ok
(1
06
17
08
)
Ko
on
ori
ga
n (
10
61
70
5)
Ko
on
ori
ga
n (
10
61
71
0)
Tu
nta
ble
Cre
ek
(1
06
70
4)
Te
ran
ia C
ree
k (
10
67
09
)
Du
no
on
(1
06
18
01
)
Du
no
on
(1
06
18
12
)
Ro
se
ba
nk
(1
06
18
02
)
Ro
se
ba
nk
(1
06
18
04
)
Co
rnd
ale
(1
06
18
03
)
Ke
err
on
g (
10
61
80
8)
Mo
da
nv
ille
(1
06
18
10
)
Nu
mu
lgi (1
06
18
07
)
Be
xh
ill (1
06
18
06
)
Clu
ne
s (
10
61
80
5)
Clu
ne
s (
10
61
80
9)
Elt
ha
m (
10
61
60
9)
Bla
ke
bro
ok
(1
06
18
11
)
Ric
hm
on
d H
ill (1
06
16
02
)
Ric
hm
on
d H
ill (1
06
16
10
)
No
rth
Lis
mo
re
Lis
mo
re H
eig
hts
Go
on
ella
ba
h
Lis
mo
re
Gir
ard
s H
ill
Ea
st
Lis
mo
re
So
uth
Lis
mo
re
Ca
nia
ba
(1
06
16
01
)
Lin
de
nd
ale
(1
06
16
08
)
Lo
ftv
ille
(1
06
16
04
)
Tre
ge
ag
le (
10
61
60
4)
So
uth
Gu
nd
uri
mb
a (
10
61
61
1)
So
uth
Gu
nd
uri
mb
a (
10
61
61
2)
Tu
ck
i T
uck
i (1
06
16
05
)
Ea
st
Co
rak
i (1
06
16
06
)
Blue Knob (1061701) 0.0 8.3 8.5 10.9 4.7 16.5 22.7 19.6 21.1 20.3 17.3 22.4 27.8 27.1 34.2 34.5 27.4 30.9 36.9 41.1 40.2 41.8 44.0 35.7 43.4 44.3 36.7 38.3 42.0 38.7 39.1 40.2 38.5 37.1 46.0 40.4 47.2 42.0 48.4 55.7 67.3
Nimbin (1061702) 8.3 0.0 8.5 3.0 9.1 12.2 19.6 11.4 14.7 12.0 11.1 15.0 19.6 20.3 26.9 26.6 19.1 22.6 28.6 32.8 32.2 34.0 36.0 27.9 35.1 36.0 29.7 31.1 34.7 31.5 32.1 33.1 31.5 30.7 38.7 33.5 39.9 35.6 41.6 48.7 60.4
Nimbin (1061703) 8.5 8.5 0.0 11.3 12.6 20.5 27.7 18.3 23.1 17.3 10.7 16.7 23.2 20.3 27.7 28.8 25.2 27.5 33.1 37.0 34.7 35.9 38.8 35.1 39.6 40.8 35.0 35.7 38.8 36.3 37.3 38.0 37.0 37.2 41.8 38.9 43.6 42.0 47.2 53.6 65.6
Nimbin (1061706) 10.9 3.0 11.3 0.0 10.6 9.9 17.4 8.8 11.7 10.0 11.6 14.3 18.1 20.1 26.2 25.3 16.5 20.4 26.4 30.7 30.8 32.7 34.3 25.0 32.9 33.7 27.4 29.0 32.7 29.3 29.8 30.9 29.2 28.2 37.0 31.1 38.0 33.1 39.2 46.4 58.0
Nimbin (1061711) 4.7 9.1 12.6 10.6 0.0 13.1 18.5 19.0 18.6 20.6 19.7 24.1 28.5 29.3 36.0 35.7 26.8 30.9 36.9 41.2 41.2 43.1 44.9 34.0 43.3 44.1 35.9 38.0 41.9 38.2 38.4 39.6 37.5 35.3 46.4 39.4 47.2 40.2 47.1 54.9 66.2
Larnook (1061707) 16.5 12.2 20.5 9.9 13.1 0.0 7.5 12.0 6.5 15.5 21.0 22.0 23.3 28.1 32.9 30.8 18.2 23.1 28.9 33.1 35.4 37.9 38.2 22.4 34.6 35.0 26.9 29.7 33.9 29.6 29.3 30.7 28.1 24.9 39.4 30.0 39.4 29.7 37.1 45.5 56.2
Larnook (1061708) 22.7 19.6 27.7 17.4 18.5 7.5 0.0 18.1 10.1 21.9 28.4 28.8 29.0 34.8 39.0 36.2 22.5 27.5 32.7 36.8 40.3 43.0 42.6 23.4 37.8 37.8 28.6 32.0 36.5 31.7 30.9 32.5 29.3 24.6 42.5 31.0 41.9 28.9 37.2 46.2 55.9
Koonorigan (1061705) 19.6 11.4 18.3 8.8 19.0 12.0 18.1 0.0 8.5 3.9 12.6 11.0 11.3 16.9 21.0 18.8 7.8 12.0 18.1 22.4 23.6 26.0 26.8 16.8 24.4 25.1 20.0 21.5 25.2 21.8 22.4 23.3 21.8 21.6 29.7 23.8 30.5 26.4 31.9 38.9 50.6
Koonorigan (1061710) 21.1 14.7 23.1 11.7 18.6 6.5 10.1 8.5 0.0 12.4 20.4 19.5 18.9 25.4 29.0 26.2 12.6 17.6 23.1 27.2 30.3 32.9 32.8 16.0 28.5 28.8 21.2 24.0 28.3 23.9 23.6 25.1 22.4 19.6 33.9 24.3 33.8 24.5 31.6 39.9 50.7
Tuntable Creek (106704) 20.3 12.0 17.3 10.0 20.6 15.5 21.9 3.9 12.4 0.0 9.7 7.2 8.2 13.0 17.4 15.7 7.9 10.6 16.6 20.8 20.9 23.0 24.4 18.3 23.1 24.1 20.3 21.1 24.4 21.7 22.6 23.3 22.4 23.3 28.2 24.3 29.5 27.9 32.6 38.9 50.9
Terania Creek (106709) 17.3 11.1 10.7 11.6 19.7 21.0 28.4 12.6 20.4 9.7 0.0 6.2 13.0 9.8 17.1 18.1 17.1 18.1 23.1 26.7 24.0 25.1 28.1 27.8 29.5 30.8 27.8 27.8 30.3 28.6 29.9 30.3 30.0 31.6 32.7 31.8 34.9 36.2 40.1 45.6 57.8
Dunoon (1061801) 22.4 15.0 16.7 14.3 24.1 22.0 28.8 11.0 19.5 7.2 6.2 0.0 6.9 6.1 12.0 12.2 12.5 12.4 17.1 20.6 18.0 19.4 22.1 23.3 23.4 24.7 23.3 22.9 25.2 23.7 25.2 25.5 25.6 28.0 27.4 27.3 29.6 32.3 35.5 40.5 52.8
Dunoon (1061812) 27.8 19.6 23.2 18.1 28.5 23.3 29.0 11.3 18.9 8.2 13.0 6.9 0.0 9.1 10.2 7.5 8.0 5.9 10.1 13.8 12.7 14.8 16.3 17.9 16.5 17.8 17.8 17.1 19.3 18.0 19.6 19.7 20.1 23.3 21.8 21.7 23.8 27.3 29.8 34.7 47.0
Rosebank (1061802) 27.1 20.3 20.3 20.1 29.3 28.1 34.8 16.9 25.4 13.0 9.8 6.1 9.1 0.0 7.5 10.0 16.8 14.9 17.7 20.3 15.4 16.0 19.8 27.0 23.3 24.8 25.6 24.2 25.5 25.3 27.1 26.9 27.9 31.4 26.3 29.4 29.2 35.3 37.3 41.1 53.4
Rosebank (1061804) 34.2 26.9 27.7 26.2 36.0 32.9 39.0 21.0 29.0 17.4 17.1 12.0 10.2 7.5 0.0 5.0 17.9 14.1 14.2 15.3 8.8 8.7 13.0 26.3 18.2 19.9 23.8 21.4 21.6 22.6 24.7 24.2 26.0 30.8 21.0 27.1 24.4 34.0 34.4 36.9 49.1
Corndale (1061803) 34.5 26.6 28.8 25.3 35.7 30.8 36.2 18.8 26.2 15.7 18.1 12.2 7.5 10.0 5.0 0.0 14.2 9.8 9.2 10.6 5.8 7.4 10.0 21.6 13.6 15.3 19.3 17.0 17.5 18.2 20.3 19.8 21.5 26.4 17.8 22.7 20.8 29.5 30.1 33.0 45.3
Keerrong (1061808) 27.4 19.1 25.2 16.5 26.8 18.2 22.5 7.8 12.6 7.9 17.1 12.5 8.0 16.8 17.9 14.2 0.0 5.0 10.7 15.0 17.8 20.5 20.2 10.8 16.7 17.3 13.7 14.7 18.4 15.2 16.0 16.8 15.7 17.0 23.0 17.6 23.7 21.5 25.9 32.4 44.3
Modanville (1061810) 30.9 22.6 27.5 20.4 30.9 23.1 27.5 12.0 17.6 10.6 18.1 12.4 5.9 14.9 14.1 9.8 5.0 0.0 6.1 10.4 12.8 15.6 15.2 12.3 12.5 13.4 12.8 12.4 15.3 13.2 14.6 14.9 15.0 18.2 19.0 16.7 20.3 22.1 24.9 30.2 42.4
Numulgi (1061807) 36.9 28.6 33.1 26.4 36.9 28.9 32.7 18.1 23.1 16.6 23.1 17.1 10.1 17.7 14.2 9.2 10.7 6.1 0.0 4.3 9.1 12.0 10.0 13.6 6.6 7.7 11.1 9.1 10.7 10.2 12.2 11.8 13.3 18.4 13.6 14.5 15.2 21.3 22.2 26.2 38.5
Bexhill (1061806) 41.1 32.8 37.0 30.7 41.2 33.1 36.8 22.4 27.2 20.8 26.7 20.6 13.8 20.3 15.3 10.6 15.0 10.4 4.3 0.0 7.9 10.4 6.9 16.3 3.0 4.6 11.9 8.6 8.4 9.9 12.2 11.2 13.8 19.9 9.9 14.5 12.1 22.0 21.3 23.9 36.3
Clunes (1061805) 40.2 32.2 34.7 30.8 41.2 35.4 40.3 23.6 30.3 20.9 24.0 18.0 12.7 15.4 8.8 5.8 17.8 12.8 9.1 7.9 0.0 2.9 4.3 22.7 10.4 12.1 19.0 15.7 14.9 17.0 19.3 18.4 20.9 26.8 13.6 21.7 17.1 29.2 28.2 29.8 41.9
Clunes (1061809) 41.8 34.0 35.9 32.7 43.1 37.9 43.0 26.0 32.9 23.0 25.1 19.4 14.8 16.0 8.7 7.4 20.5 15.6 12.0 10.4 2.9 0.0 5.0 25.6 12.7 14.4 21.5 18.1 16.9 19.4 21.8 20.7 23.4 29.4 14.5 24.1 18.4 31.7 30.3 31.2 43.1
Eltham (1061609) 44.0 36.0 38.8 34.3 44.9 38.2 42.6 26.8 32.8 24.4 28.1 22.1 16.3 19.8 13.0 10.0 20.2 15.2 10.0 6.9 4.3 5.0 0.0 23.1 8.4 9.9 18.3 14.5 12.8 15.8 18.2 16.9 20.0 26.4 10.2 20.4 14.0 28.2 26.2 26.8 38.8
Blakebrook (1061811) 35.7 27.9 35.1 25.0 34.0 22.4 23.4 16.8 16.0 18.3 27.8 23.3 17.9 27.0 26.3 21.6 10.8 12.3 13.6 16.3 22.7 25.6 23.1 0.0 16.0 15.5 7.4 10.9 15.4 10.5 9.8 11.4 8.5 7.6 21.8 10.4 20.7 12.3 18.0 26.0 37.0
Richmond Hill (1061602) 43.4 35.1 39.6 32.9 43.3 34.6 37.8 24.4 28.5 23.1 29.5 23.4 16.5 23.3 18.2 13.6 16.7 12.5 6.6 3.0 10.4 12.7 8.4 16.0 0.0 1.7 10.5 6.7 5.9 8.0 10.3 9.2 12.1 18.6 8.0 12.6 9.7 20.3 18.9 21.4 33.7
Richmond Hill (1061610) 44.3 36.0 40.8 33.7 44.1 35.0 37.8 25.1 28.8 24.1 30.8 24.7 17.8 24.8 19.9 15.3 17.3 13.4 7.7 4.6 12.1 14.4 9.9 15.5 1.7 0.0 9.4 5.4 4.5 6.7 9.0 7.8 10.9 17.5 7.6 11.3 8.7 19.0 17.4 20.0 32.3
North Lismore 36.7 29.7 35.0 27.4 35.9 26.9 28.6 20.0 21.2 20.3 27.8 23.3 17.8 25.6 23.8 19.3 13.7 12.8 11.1 11.9 19.0 21.5 18.3 7.4 10.5 9.4 0.0 4.2 8.5 3.3 2.5 4.0 2.3 8.2 15.2 4.0 13.5 10.3 12.3 19.0 30.7
Lismore Heights 38.3 31.1 35.7 29.0 38.0 29.7 32.0 21.5 24.0 21.1 27.8 22.9 17.1 24.2 21.4 17.0 14.7 12.4 9.1 8.6 15.7 18.1 14.5 10.9 6.7 5.4 4.2 0.0 4.5 1.3 3.6 2.8 5.5 12.3 11.0 6.0 9.8 13.7 13.1 17.8 30.0
Goonellabah 42.0 34.7 38.8 32.7 41.9 33.9 36.5 25.2 28.3 24.4 30.3 25.2 19.3 25.5 21.6 17.5 18.4 15.3 10.7 8.4 14.9 16.9 12.8 15.4 5.9 4.5 8.5 4.5 0.0 5.2 7.0 5.2 9.1 16.1 6.8 8.7 5.5 16.5 13.4 15.6 27.9
Lismore 38.7 31.5 36.3 29.3 38.2 29.6 31.7 21.8 23.9 21.7 28.6 23.7 18.0 25.3 22.6 18.2 15.2 13.2 10.2 9.9 17.0 19.4 15.8 10.5 8.0 6.7 3.3 1.3 5.2 0.0 2.3 1.7 4.3 11.2 11.9 4.7 10.3 12.4 12.0 17.2 29.3
Girards Hill 39.1 32.1 37.3 29.8 38.4 29.3 30.9 22.4 23.6 22.6 29.9 25.2 19.6 27.1 24.7 20.3 16.0 14.6 12.2 12.2 19.3 21.8 18.2 9.8 10.3 9.0 2.5 3.6 7.0 2.3 0.0 1.8 2.1 9.2 13.7 2.4 11.6 10.0 10.3 16.6 28.3
East Lismore 40.2 33.1 38.0 30.9 39.6 30.7 32.5 23.3 25.1 23.3 30.3 25.5 19.7 26.9 24.2 19.8 16.8 14.9 11.8 11.2 18.4 20.7 16.9 11.4 9.2 7.8 4.0 2.8 5.2 1.7 1.8 0.0 3.9 10.9 12.0 3.6 9.8 11.4 10.3 15.6 27.6
South Lismore 38.5 31.5 37.0 29.2 37.5 28.1 29.3 21.8 22.4 22.4 30.0 25.6 20.1 27.9 26.0 21.5 15.7 15.0 13.3 13.8 20.9 23.4 20.0 8.5 12.1 10.9 2.3 5.5 9.1 4.3 2.1 3.9 0.0 7.0 15.9 2.0 13.6 8.3 10.2 17.5 28.8
Caniaba (1061601) 37.1 30.7 37.2 28.2 35.3 24.9 24.6 21.6 19.6 23.3 31.6 28.0 23.3 31.4 30.8 26.4 17.0 18.2 18.4 19.9 26.8 29.4 26.4 7.6 18.6 17.5 8.2 12.3 16.1 11.2 9.2 10.9 7.0 0.0 22.9 7.9 20.5 4.9 12.6 21.7 31.4
Lindendale (1061608) 46.0 38.7 41.8 37.0 46.4 39.4 42.5 29.7 33.9 28.2 32.7 27.4 21.8 26.3 21.0 17.8 23.0 19.0 13.6 9.9 13.6 14.5 10.2 21.8 8.0 7.6 15.2 11.0 6.8 11.9 13.7 12.0 15.9 22.9 0.0 15.3 4.2 22.9 18.3 16.9 28.6
Loftville (1061604) 40.4 33.5 38.9 31.1 39.4 30.0 31.0 23.8 24.3 24.3 31.8 27.3 21.7 29.4 27.1 22.7 17.6 16.7 14.5 14.5 21.7 24.1 20.4 10.4 12.6 11.3 4.0 6.0 8.7 4.7 2.4 3.6 2.0 7.9 15.3 0.0 12.0 7.4 6.8 13.2 22.2
Tregeagle (1061604) 47.2 39.9 43.6 38.0 47.2 39.4 41.9 30.5 33.8 29.5 34.9 29.6 23.8 29.2 24.4 20.8 23.7 20.3 15.2 12.1 17.1 18.4 14.0 20.7 9.7 8.7 13.5 9.8 5.5 10.3 11.6 9.8 13.6 20.5 4.2 12.0 0.0 19.0 13.4 10.9 20.7
South Gundurimba (1061611) 42.0 35.6 42.0 33.1 40.2 29.7 28.9 26.4 24.5 27.9 36.2 32.3 27.3 35.3 34.0 29.5 21.5 22.1 21.3 22.0 29.2 31.7 28.2 12.3 20.3 19.0 10.3 13.7 16.5 12.4 10.0 11.4 8.3 4.9 22.9 7.4 19.0 0.0 7.9 16.5 23.0
South Gundurimba (1061612) 48.4 41.6 47.2 39.2 47.1 37.1 37.2 31.9 31.6 32.6 40.1 35.5 29.8 37.3 34.4 30.1 25.9 24.9 22.2 21.3 28.2 30.3 26.2 18.0 18.9 17.4 12.3 13.1 13.4 12.0 10.3 10.3 10.2 12.6 18.3 6.8 13.4 7.9 0.0 8.6 15.9
Tucki Tucki (1061605) 55.7 48.7 53.6 46.4 54.9 45.5 46.2 38.9 39.9 38.9 45.6 40.5 34.7 41.1 36.9 33.0 32.4 30.2 26.2 23.9 29.8 31.2 26.8 26.0 21.4 20.0 19.0 17.8 15.6 17.2 16.6 15.6 17.5 21.7 16.9 13.2 10.9 16.5 8.6 0.0 10.2
East Coraki (1061606) 67.3 60.4 65.6 58.0 66.2 56.2 55.9 50.6 50.7 50.9 57.8 52.8 47.0 53.4 49.1 45.3 44.3 42.4 38.5 36.3 41.9 43.1 38.8 37.0 33.7 32.3 30.7 30.0 27.9 29.3 28.3 27.6 28.8 31.4 28.6 22.2 20.7 23.0 15.9 10.2 0.0
Attachment No. 7
Estimated Distances (km) between District Centroids

Lismore Strategic Road Review Framework for Section 94 Trunk Road Infrastructure Contributions Plan
RURAL Areas 15th October 2012
________________________________________________________________________________________________
________________________________________________________________________________________________ TTM Consulting (GC) Pty Ltd Page No. 8 Traffic . Parking . Acoustics TTM Ref : 34494Rural1
Blu
e K
no
b
Nim
bin
Nim
bin
Nim
bin
Nim
bin
La
rno
ok
La
rno
ok
Ko
on
ori
ga
n
Ko
on
ori
ga
n
Tu
nta
ble
Cre
ek
Te
ran
ia C
ree
k
Du
no
on
Du
no
on
Ro
seb
an
k
Ro
seb
an
k
Co
rnd
ale
Ke
err
on
g
Mo
da
nv
ille
Nu
mu
lgi
Be
xh
ill
Clu
ne
s
Clu
ne
s
Elt
ha
m
Bla
ke
bro
ok
Ric
hm
on
d H
ill
LIS
MO
RE
Ca
nia
ba
Lin
de
nd
ale
Lo
ftv
ille
Tre
ge
ag
le
So
uth
Gu
nd
uri
mb
a
So
uth
Gu
nd
uri
mb
a
Tu
ck
i T
uck
i
Ea
st C
ora
ki
CCD
70
1
70
2
70
3
70
6
71
1
70
7
70
8
70
5
71
0
70
4
70
9
80
1
81
2
90
2
80
4
80
3
80
8
81
0
80
7
80
6
80
5
80
9
60
9
81
1
60
2
60
1
60
8
60
4
60
3
61
1
61
2
60
5
60
6
Estimated Trips
2028CCD Pop
28
2
52
3
46
1
68
8
35
5
12
81
81
0
66
7
64
2
48
1
29
6
12
44
55
3
38
0
78
2
58
4
51
4
76
8
50
2
70
0
58
2
77
6
87
7
51
9
10
83
36
05
3
77
1
85
1
44
3
96
9
71
3
52
6
59
7
52
9
Blue Knob 701 294 0 2 2 2 5 1 0 0 0 0 0 1 0 0 0 0 0 0 0 0 0 0 0 0 0 6 0 0 0 0 0 0 0 0 23
Nimbin 702 544 2 0 3 39 2 4 1 3 2 2 1 3 1 0 1 0 1 1 0 0 0 0 0 0 0 17 0 0 0 0 0 0 0 0 87
Nimbin 703 479 2 3 0 2 1 1 0 1 1 1 1 2 0 0 0 0 0 0 0 0 0 0 0 0 0 12 0 0 0 0 0 0 0 0 33
Nimbin 706 716 2 39 2 0 2 9 2 6 3 3 1 4 1 1 1 1 1 1 0 1 0 0 1 1 1 26 1 0 0 0 0 0 0 0 112
Nimbin 711 369 5 2 1 2 0 3 1 1 1 0 0 1 0 0 0 0 0 0 0 0 0 0 0 0 0 8 0 0 0 0 0 0 0 0 27
Larnook 707 1333 1 4 1 9 3 0 18 6 19 3 1 3 1 1 1 1 2 2 1 1 1 1 1 1 1 46 2 1 1 1 1 0 0 0 134
Larnook 708 843 0 1 0 2 1 18 0 2 5 1 0 1 1 0 0 0 1 1 0 0 0 0 0 1 1 26 1 0 0 0 1 0 0 0 68
Koonorigan 705 694 0 3 1 6 1 6 2 0 6 21 1 7 3 1 1 1 6 4 1 1 1 1 1 1 1 43 1 1 1 1 1 0 0 0 122
Koonorigan 710 668 0 2 1 3 1 19 5 6 0 2 0 2 1 0 1 1 2 2 1 1 0 0 1 1 1 35 1 0 0 1 1 0 0 0 91
Tuntable Creek 704 501 0 2 1 3 0 3 1 21 2 0 1 12 4 1 1 1 4 3 1 1 1 1 1 1 1 32 1 1 0 1 0 0 0 0 101
Terania Creek 709 308 0 1 1 1 0 1 0 1 0 1 0 10 1 1 1 1 1 1 0 0 0 0 0 0 0 12 0 0 0 0 0 0 0 0 38
Dunoon 801 1294 1 3 2 4 1 3 1 7 2 12 10 0 14 13 7 5 4 6 2 2 2 3 2 1 2 72 1 1 1 1 1 1 0 0 187
Dunoon 812 575 0 1 0 1 0 1 1 3 1 4 1 14 0 2 4 6 4 12 3 2 2 2 2 1 2 55 1 1 1 1 1 0 0 0 129
Rosebank 902 396 0 0 0 1 0 1 0 1 0 1 1 13 2 0 5 2 1 1 1 1 1 1 1 0 1 20 0 0 0 0 0 0 0 0 58
Rosebank 804 813 0 1 0 1 0 1 0 1 1 1 1 7 4 5 0 18 1 3 2 2 6 8 4 1 3 55 1 1 0 1 0 0 0 0 131
Corndale 803 608 0 0 0 1 0 1 0 1 1 1 1 5 6 2 18 0 1 5 3 4 10 8 5 1 3 62 1 2 0 1 0 0 0 0 145
Keerrong 808 535 0 1 0 1 0 2 1 6 2 4 1 4 4 1 1 1 0 15 2 2 1 1 1 2 2 66 1 1 1 1 1 0 0 0 127
Modanville 810 799 0 1 0 1 0 2 1 4 2 3 1 6 12 1 3 5 15 0 10 5 3 2 3 3 5 131 2 2 1 2 1 1 0 0 228
Numulgi 807 523 0 0 0 0 0 1 0 1 1 1 0 2 3 1 2 3 2 10 0 18 3 3 4 1 12 155 1 2 1 2 1 1 0 0 235
Bexhill 806 728 0 0 0 1 0 1 0 1 1 1 0 2 2 1 2 4 2 5 18 0 6 5 13 1 83 294 1 6 1 5 1 1 1 0 459
Clunes 805 606 0 0 0 0 0 1 0 1 0 1 0 2 2 1 6 10 1 3 3 6 0 53 27 1 6 78 1 3 1 2 0 0 0 0 210
Clunes 809 807 0 0 0 0 0 1 0 1 0 1 0 3 2 1 8 8 1 2 3 5 53 0 26 1 5 81 1 3 1 2 1 0 0 0 211
Eltham 609 912 0 0 0 1 0 1 0 1 1 1 0 2 2 1 4 5 1 3 4 13 27 26 0 1 13 151 1 7 1 4 1 1 1 0 274
Blakebrook 811 540 0 0 0 1 0 1 1 1 1 1 0 1 1 0 1 1 2 3 1 1 1 1 1 0 2 134 7 1 2 1 2 1 0 0 171
Richmond Hill 602 1127 0 0 0 1 0 1 1 1 1 1 0 2 2 1 3 3 2 5 12 83 6 5 13 2 0 988 2 14 3 11 2 2 1 0 1171
LISMORE 36996 6 17 11 25 8 46 25 43 34 32 12 71 54 20 54 61 65 130 153 290 77 80 149 132 974 0 197 400 873 674 153 128 79 23 5096
Caniaba 601 802 0 0 0 1 0 2 1 1 1 1 0 1 1 0 1 1 1 2 1 1 1 1 1 7 2 199 0 1 5 2 22 3 1 0 262
Lindendale 608 886 0 0 0 0 0 1 0 1 0 1 0 1 1 0 1 2 1 2 2 6 3 3 7 1 14 405 1 0 2 45 1 1 2 1 507
Loftville 604 461 0 0 0 0 0 1 0 1 0 0 0 1 1 0 0 0 1 1 1 1 1 1 1 2 3 885 5 2 0 3 6 5 1 0 925
Tregeagle 603 1008 0 0 0 0 0 1 0 1 1 1 0 1 1 0 1 1 1 2 2 5 2 2 4 1 11 684 2 45 3 0 2 3 5 1 784
South Gundurimba 611 742 0 0 0 0 0 1 1 1 1 0 0 1 1 0 0 0 1 1 1 1 0 1 1 2 2 155 22 1 6 2 0 6 2 1 212
South Gundurimba 612 547 0 0 0 0 0 0 0 0 0 0 0 1 0 0 0 0 0 1 1 1 0 0 1 1 2 130 3 1 5 3 6 0 4 1 163
Tucki Tucki 605 621 0 0 0 0 0 0 0 0 0 0 0 0 0 0 0 0 0 0 0 1 0 0 1 0 1 80 1 2 1 5 2 4 0 3 107
East Coraki 606 550 0 0 0 0 0 0 0 0 0 0 0 0 0 0 0 0 0 0 0 0 0 0 0 0 0 23 0 1 0 1 1 1 3 0 35
12659
Total
Attachment No. 8
Estimated Inter-District Vehicle Movements/Day (2028)

Lismore Strategic Road Review Framework for Section 94 Trunk Road Infrastructure Contributions Plan
RURAL Areas 15th October 2012
________________________________________________________________________________________________
________________________________________________________________________________________________ TTM Consulting (GC) Pty Ltd Page No. 9 Traffic . Parking . Acoustics TTM Ref : 34494Rural1
Blu
e K
no
b
Nim
bin
Nim
bin
Nim
bin
Nim
bin
La
rno
ok
La
rno
ok
Ko
on
ori
ga
n
Ko
on
ori
ga
n
Tu
nta
ble
Cre
ek
Te
ran
ia C
ree
k
Du
no
on
Du
no
on
Ro
seb
an
k
Ro
seb
an
k
Co
rnd
ale
Ke
err
on
g
Mo
da
nv
ille
Nu
mu
lgi
Be
xh
ill
Clu
ne
s
Clu
ne
s
Elt
ha
m
Bla
ke
bro
ok
Ric
hm
on
d H
ill
LIS
MO
RE
Ca
nia
ba
Lin
de
nd
ale
Lo
ftv
ille
Tre
ge
ag
le
So
uth
Gu
nd
uri
mb
a
So
uth
Gu
nd
uri
mb
a
Tu
ck
i T
uck
i
Ea
st C
ora
ki
CCD7
01
70
2
70
3
70
6
71
1
70
7
70
8
70
5
71
0
70
4
70
9
80
1
81
2
90
2
80
4
80
3
80
8
81
0
80
7
80
6
80
5
80
9
60
9
81
1
60
2
60
1
60
8
60
4
60
3
61
1
61
2
60
5
60
6
CCD Pop
28
2
52
3
46
1
68
8
35
5
12
81
81
0
66
7
64
2
48
1
29
6
12
44
55
3
38
0
78
2
58
4
51
4
76
8
50
2
70
0
58
2
77
6
87
7
51
9
10
83
36
05
3
77
1
85
1
44
3
96
9
71
3
52
6
59
7
52
9
Blue Knob 701 294 0.0 17.5 15.2 17.6 21.1 21.7 10.0 9.5 8.5 6.6 4.8 15.5 5.5 3.9 6.4 4.7 5.2 6.9 3.8 4.7 4.0 5.2 5.5 4.0 6.9 245.8 5.7 4.3 3.2 4.7 4.4 2.5 2.1 1.2 489
Nimbin 702 544 17.5 0.0 28.0 117.9 20.1 54.3 21.4 30.2 22.6 20.7 13.8 42.9 14.5 9.6 15.0 11.3 13.9 17.6 9.1 11.0 9.3 11.8 12.6 9.6 15.9 551.6 12.5 9.1 7.1 9.9 9.3 5.2 4.1 2.3 1162
Nimbin 703 479 15.2 28.0 0.0 27.6 12.8 28.4 13.3 16.6 12.7 12.6 12.5 33.8 10.8 8.5 12.8 9.2 9.3 12.7 6.9 8.6 7.6 9.8 10.3 6.7 12.4 430.4 8.9 7.9 5.1 8.4 6.9 4.1 3.5 2.1 816
Nimbin 706 716 17.6 117.9 27.6 0.0 22.8 87.7 31.6 51.7 37.1 32.7 17.3 59.0 20.8 12.9 20.3 15.7 21.1 25.6 12.9 15.5 12.8 16.1 17.3 14.1 22.4 772.5 18.1 12.3 10.1 13.4 13.2 7.2 5.5 3.0 1585
Nimbin 711 369 21.1 20.1 12.8 22.8 0.0 34.3 15.3 12.3 12.1 8.2 5.3 18.1 6.8 4.5 7.6 5.7 6.7 8.7 4.8 5.9 5.0 6.3 6.8 5.3 8.8 311.3 7.8 5.3 4.2 5.8 5.9 3.3 2.6 1.5 613
Larnook 707 1333 21.7 54.3 28.4 87.7 34.3 0.0 136.9 70.4 125.6 39.2 17.8 71.4 30.0 17.1 30.0 24.0 35.8 42.0 22.0 26.7 20.8 25.9 29.0 29.2 39.5 1410.4 42.3 20.6 21.2 23.3 30.0 14.8 10.2 5.3 2638
Larnook 708 843 10.0 21.4 13.3 31.6 15.3 136.9 0.0 29.5 51.0 17.6 8.3 34.5 15.3 8.7 16.0 12.9 18.3 22.3 12.3 15.2 11.5 14.4 16.4 17.7 22.9 834.2 29.1 12.0 13.4 14.0 21.1 9.9 6.6 3.3 1517
Koonorigan 705 694 9.5 30.2 16.6 51.7 12.3 70.4 29.5 0.0 49.8 81.6 15.4 74.3 32.2 14.8 24.5 20.4 43.3 42.1 18.3 20.6 16.2 19.6 21.6 20.3 29.2 981.7 21.8 13.7 13.0 14.9 15.0 7.9 5.7 2.9 1841
Koonorigan 710 668 8.5 22.6 12.7 37.1 12.1 125.6 51.0 49.8 0.0 24.7 9.2 40.4 18.5 9.5 17.1 14.1 25.9 27.7 13.8 16.3 12.2 14.9 17.0 20.5 24.1 858.3 26.9 11.3 13.4 12.9 17.9 8.4 5.3 2.6 1582
Tuntable Creek 704 501 6.6 20.7 12.6 32.7 8.2 39.2 17.6 81.6 24.7 0.0 14.5 82.6 32.0 13.9 21.3 17.7 31.0 34.3 14.4 16.0 13.2 16.0 17.1 13.4 22.3 722.3 13.8 10.8 8.7 11.5 9.8 5.5 4.2 2.3 1392
Terania Creek 709 308 4.8 13.8 12.5 17.3 5.3 17.8 8.3 15.4 9.2 14.5 0.0 58.8 12.4 11.3 13.4 9.4 8.8 12.4 6.3 7.6 7.1 9.0 9.1 5.4 10.7 350.9 6.3 6.5 3.9 6.6 4.8 2.9 2.5 1.5 686
Dunoon 801 1294 15.5 42.9 33.8 59.0 18.1 71.4 34.5 74.3 40.4 82.6 58.8 0.0 97.8 77.0 80.1 58.8 50.3 75.7 36.1 41.7 39.7 49.1 48.7 27.3 56.8 1768.9 28.2 31.9 18.4 32.2 21.2 13.0 11.4 6.5 3202
Dunoon 812 575 5.5 14.5 10.8 20.8 6.8 30.0 15.3 32.2 18.5 32.0 12.4 97.8 0.0 22.8 42.0 42.4 34.9 71.1 27.0 27.6 25.0 28.5 29.3 15.8 35.7 1023.6 13.9 16.7 9.9 16.8 10.2 6.3 5.4 3.0 1804
Rosebank 902 396 3.9 9.6 8.5 12.9 4.5 17.1 8.7 14.8 9.5 13.9 11.3 77.0 22.8 0.0 39.3 22.0 11.5 19.3 10.6 13.0 14.2 18.2 16.6 7.2 17.5 526.9 7.5 11.2 4.9 10.8 5.8 3.8 3.7 2.2 981
Rosebank 804 813 6.4 15.0 12.8 20.3 7.6 30.0 16.0 24.5 17.1 21.3 13.4 80.1 42.0 39.3 0.0 90.6 22.1 41.9 27.3 35.3 51.2 68.4 52.0 15.2 45.8 1260.2 14.9 31.9 10.0 28.4 11.8 8.3 8.8 5.2 2175
Corndale 803 608 4.7 11.3 9.2 15.7 5.7 24.0 12.9 20.4 14.1 17.7 9.4 58.8 42.4 22.0 90.6 0.0 20.8 45.1 31.4 37.9 57.7 60.2 50.4 13.8 45.8 1159.8 12.3 26.4 8.7 23.5 9.6 6.6 6.8 3.9 1980
Keerrong 808 535 5.2 13.9 9.3 21.1 6.7 35.8 18.3 43.3 25.9 31.0 8.8 50.3 34.9 11.5 22.1 20.8 0.0 77.6 23.8 23.6 16.6 19.2 22.0 24.2 32.8 1048.8 18.5 12.0 13.3 13.3 12.5 6.7 4.5 2.3 1731
Modanville 810 799 6.9 17.6 12.7 25.6 8.7 42.0 22.3 42.1 27.7 34.3 12.4 75.7 71.1 19.3 41.9 45.1 77.6 0.0 62.6 51.0 34.4 37.7 43.7 31.9 65.6 1834.3 22.5 22.2 18.4 23.6 16.1 9.6 7.4 4.1 2868
Numulgi 807 523 3.8 9.1 6.9 12.9 4.8 22.0 12.3 18.3 13.8 14.4 6.3 36.1 27.0 10.6 27.3 31.4 23.8 62.6 0.0 80.1 31.7 32.0 43.3 18.9 81.8 1669.0 12.6 20.5 11.1 21.0 9.4 6.3 5.7 3.3 2390
Bexhill 806 728 4.7 11.0 8.6 15.5 5.9 26.7 15.2 20.6 16.3 16.0 7.6 41.7 27.6 13.0 35.3 37.9 23.6 51.0 80.1 0.0 51.1 51.3 87.6 22.0 248.7 2957.0 16.0 51.0 12.2 45.1 12.3 9.0 9.9 5.5 4037
Clunes 805 606 4.0 9.3 7.6 12.8 5.0 20.8 11.5 16.2 12.2 13.2 7.1 39.7 25.0 14.2 51.2 57.7 16.6 34.4 31.7 51.1 0.0 153.2 116.5 13.1 59.8 1347.2 11.7 41.7 8.1 32.4 9.3 7.0 8.1 4.6 2254
Clunes 809 807 5.2 11.8 9.8 16.1 6.3 25.9 14.4 19.6 14.9 16.0 9.0 49.1 28.5 18.2 68.4 60.2 19.2 37.7 32.0 51.3 153.2 0.0 133.2 15.5 65.3 1584.4 14.7 56.2 9.8 42.7 11.8 9.1 11.0 6.4 2627
Eltham 609 912 5.5 12.6 10.3 17.3 6.8 29.0 16.4 21.6 17.0 17.1 9.1 48.7 29.3 16.6 52.0 50.4 22.0 43.7 43.3 87.6 116.5 133.2 0.0 19.4 111.7 2380.8 17.5 102.6 11.7 67.5 14.1 11.3 14.3 8.0 3565
Blakebrook 811 540 4.0 9.6 6.7 14.1 5.3 29.2 17.7 20.3 20.5 13.4 5.4 27.3 15.8 7.2 15.2 13.8 24.2 31.9 18.9 22.0 13.1 15.5 19.4 0.0 34.6 1491.2 50.8 10.0 32.3 12.1 23.8 9.4 3.8 1.5 2040
Richmond Hill 602 1127 6.9 15.9 12.4 22.4 8.8 39.5 22.9 29.2 24.1 22.3 10.7 56.8 35.7 17.5 45.8 45.8 32.8 65.6 81.8 248.7 59.8 65.3 111.7 34.6 0.0 7956.1 24.9 94.9 17.5 88.4 19.0 14.4 17.0 9.3 9358
LISMORE 36996 242.4 544.1 424.5 761.9 307.0 1391.1 822.8 968.3 846.6 712.4 346.1 1744.7 1009.6 519.7 1243.0 1144.0 1034.4 1809.2 1646.2 2916.5 1328.7 1562.7 2348.3 1470.8 7847.3 0.0 838.5 1367.4 4792.0 2088.9 542.5 434.6 377.2 265.7 45699
Caniaba 601 802 5.7 12.5 8.9 18.1 7.8 42.3 29.1 21.8 26.9 13.8 6.3 28.2 13.9 7.5 14.9 12.3 18.5 22.5 12.6 16.0 11.7 14.7 17.5 50.8 24.9 850.1 0.0 5.2 46.4 5.8 55.3 10.0 2.2 3.3 1437
Lindendale 608 886 4.3 9.1 7.9 12.3 5.3 20.6 12.0 13.7 11.3 10.8 6.5 31.9 16.7 11.2 31.9 26.4 12.0 22.2 20.5 51.0 41.7 56.2 102.6 10.0 94.9 1386.4 5.2 0.0 7.1 59.3 4.2 3.7 9.6 6.7 2125
Loftville 604 461 3.2 7.1 5.1 10.1 4.2 21.2 13.4 13.0 13.4 8.7 3.9 18.4 9.9 4.9 10.0 8.7 13.3 18.4 11.1 12.2 8.1 9.8 11.7 32.3 17.5 4858.4 46.4 7.1 0.0 15.1 39.5 25.8 13.6 7.5 5303
Tregeagle 603 1008 4.7 9.9 8.4 13.4 5.8 23.3 14.0 14.9 12.9 11.5 6.6 32.2 16.8 10.8 28.4 23.5 13.3 23.6 21.0 45.1 32.4 42.7 67.5 12.1 88.4 2117.9 5.8 59.3 15.1 0.0 4.4 4.8 20.5 13.3 2824
South Gundurimba 611 742 4.4 9.3 6.9 13.2 5.9 30.0 21.1 15.0 17.9 9.8 4.8 21.2 10.2 5.8 11.8 9.6 12.5 16.1 9.4 12.3 9.3 11.8 14.1 23.8 19.0 550.0 55.3 4.2 39.5 4.4 0.0 10.8 3.3 6.4 999
South Gundurimba 612 547 2.5 5.2 4.1 7.2 3.3 14.8 9.9 7.9 8.4 5.5 2.9 13.0 6.3 3.8 8.3 6.6 6.7 9.6 6.3 9.0 7.0 9.1 11.3 9.4 14.4 440.6 10.0 3.7 25.8 4.8 10.8 0.0 16.6 11.8 717
Tucki Tucki 605 621 2.1 4.1 3.5 5.5 2.6 10.2 6.6 5.7 5.3 4.2 2.5 11.4 5.4 3.7 8.8 6.8 4.5 7.4 5.7 9.9 8.1 11.0 14.3 3.8 17.0 382.5 2.2 9.6 13.6 20.5 3.3 16.6 0.0 21.2 640
East Coraki 606 550 1.2 2.3 2.1 3.0 1.5 5.3 3.3 2.9 2.6 2.3 1.5 6.5 3.0 2.2 5.2 3.9 2.3 4.1 3.3 5.5 4.6 6.4 8.0 1.5 9.3 269.4 3.3 6.7 7.5 13.3 6.4 11.8 21.2 0.0 433
115513
Total
Estimated Veh-Km Travel 2028
Attachment No. 9
Estimated Inter-District Vehicle-Kilometres of Travel Demand/Day (2028)