Strategic Advisors in Global Energy - World...
26
Strategic Advisors in Global Energy Strategic Advisors in Global Energy Strategic Advisors in Global Energy The Financial Crisis and its Impact on the Oil & Gas Industry Prepared for World Bank Energy Week by Lew Watts March 2009
Transcript of Strategic Advisors in Global Energy - World...

Strategic Advisors in Global Energy Strategic Advisors in Global Energy Strategic Advisors in Global Energy
The Financial Crisis and its Impact on the Oil & Gas Industry
Prepared for World Bank Energy Week by Lew Watts
March 2009

World Bank Energy Week 2009 | Page 2
The “Oil Century” was said to be ending A new demand scenario?
Constrained Growth Higher prices promote reduced demand and
modest substitution
Demand Destruction High prices and pinched supply curtail
demand
Energy Transition Pinched supply and technological innovation lead to abandoning of the internal combustion
engine
Economic Shock reduces demand temporarily, slows development and defers solutions

World Bank Energy Week 2009 | Page 3
But the Oil and Gas industry has been hit with a triple whammy ...
§ A massive deleveraging by financial institutions contributed to a collapse in the price of oil.
§ A global economic slowdown is creating a real decline in the demand for oil which will persist for some years.
§ The drying up of new credit availability and more restrictive terms will hamper the normal business financing of some players.
… and perhaps a fourth whammy ... § Accelerating momentum towards carbon regulation.

World Bank Energy Week 2009 | Page 4
Oil Prices and Structural Trends
Oil became a financial / investment vehicle as well as a physical commodity
Oil became a financial / investment vehicle as well as a physical commodity
WTI Prompt Month Price
$0
$20
$40
$60
$80
$100
$120
$140
$160
Jan99
Jan
00 Jan
01 Jan
02 Jan
03 Jan
04 Jan
05 Jan
06 Jan
07 Jan
08
"Traditional" Price Structure
Oil as a Financial Asset
Demand Shock, Lack of Spare Capacity

World Bank Energy Week 2009 | Page 5
8%
6%
4%
2%
0%
2%
4%
6%
2002
2003
2004
2005
2006
2007
2008
YOY change in US monthly gasoline demand
Signs of significant demand destruction
Source: PFC Energy Downstream Monitoring Service
Oil price
Income effect/ recession

World Bank Energy Week 2009 | Page 6
Massive value destruction in value
BP
Chevron
Encana
BHP ExxonMobil
HAL Lukoil
Repsol
INPEX
RD Shell
Surgutneftegaz
Husky
Formosa
Transocean
Tokyo Gas Apache
Devon
COP
Centrica
PTT
Reliance
BG
TOTAL ENI
StatoilHydro
Occidental
XTO Petrobras
Hess
Gazprom
CNOOC
Ecopetrol
Schlumberger
ONGC
Rosneft
3‐Ye
ar Growth in
Marke
t Cap
italization
1‐Year Growth in Market Capitalization
EOG
IOCs
NOCs
E&P
R&M
Service Companies
Gas Companies
Other
Sinopec
Petrochina
CNQ
From PFC Energy 50

World Bank Energy Week 2009 | Page 7
Implications to Oil & Gas Companies
1. Some exploration programs and development projects will not be economic at the lower prices and will be deferred or cancelled.
2. Some companies – IOCs, NOCs, Independents and Service Companies – will not be able to find funding, resulting in delays, defaults and consolidation. Cash is King—but so is Paper…
3. Irrespective of demand destruction, a supply crunch still looms in the next decade.
4. Huge uncertainty on potential carbon legislative frameworks, timing and exposure.

World Bank Energy Week 2009 | Page 8
Cuts, Delays, Consolidation ... and Opportunities

World Bank Energy Week 2009 | Page 9
IOCs may have limited access—but control bulk of investment
NOC reserves (limited equity access)
Reserves held by Russian companies
Full IOC access
NOC reserves (equity access) Others
Top 10 IOCs
Top 10 NOCS
Source: PFC Energy NOC Strategy Service, Upstream Competition Service

World Bank Energy Week 2009 | Page 10
Oil & Gas sector investment cuts accelerating
§ The credit crisis caught independents off guard and the oil price fall weakened all players’ finances
§ Upstream cuts: Independents, and some IOCs (and NOCs) – Some IOCs postponing projects to negotiate lower EPC costs – Many other players unable to find financing
§ Most affected: new source developments in OECD
Source: PFC Energy Market Intelligence Service

World Bank Energy Week 2009 | Page 11
Downstream project delays in Middle East (by end 2008)
§ Middle East had enormous plans for petrochemical and other downstream projects by 2015
§ These plans increasingly in doubt as project sponsors retrench from significant investment activity during a period of uncertainty
§ Most Downstream projects in pipeline threatened with cancelation or delay
Source: PFC Energy Market Intelligence Service

World Bank Energy Week 2009 | Page 12
Fewer LNG trains will be added in the future…
0
2
4
6
8
10
12
1997 1999 2001 2003 2005 2007 2009 2011 2013 2015
# trains Liquefaction Trains Added
3year avg
Source: PFC Energy Global LNG Service

World Bank Energy Week 2009 | Page 13
Lessons from 1998 – more consolidation?
§ Of 74 larger E&P Independents that produced a combined 6.5 mmboe/d in 1995, only 32 still existed in 2007
§ Most mergers were between independents and occurred in 1999 to 2002, when oil price was ~$1125
41 Independents Acquired, by Type of Acquirer
0 1 2 3 4 5 6 7 8
1998 2000 2002 2004 2006 Independent Major Other
Source: PFC Energy Upstream Competition Service
World Bank Energy Week 2009 | Page 14
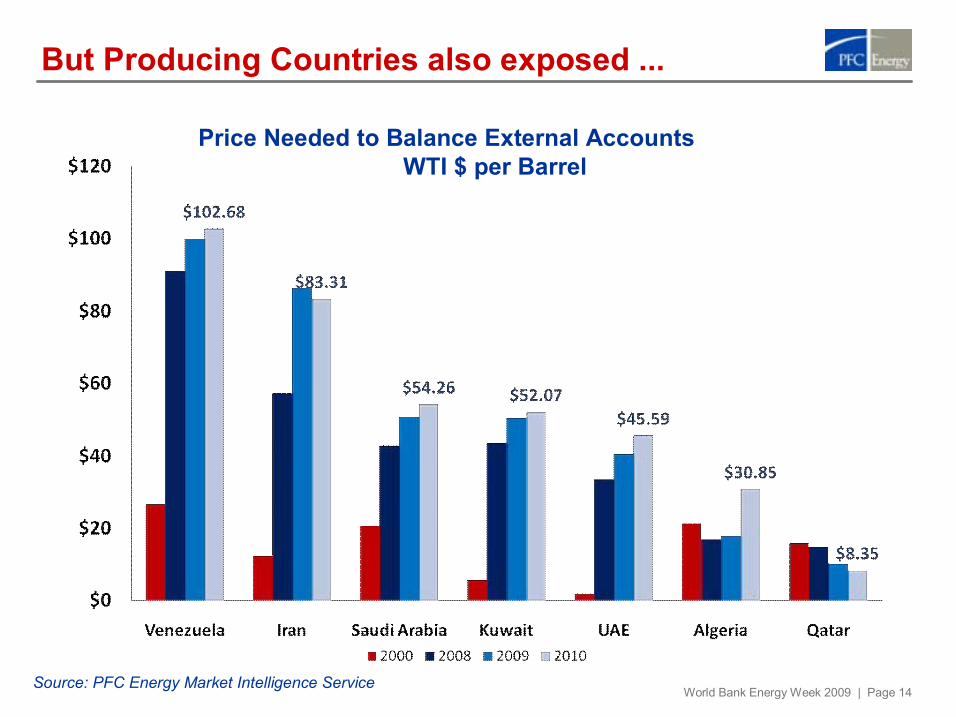
But Producing Countries also exposed ...
Price Needed to Balance External Accounts WTI $ per Barrel
Source: PFC Energy Market Intelligence Service

World Bank Energy Week 2009 | Page 15
Cracks in NOC landscape combined with financial stress also create opportunities
Cap
acity
Time 2002 2010
Low
High
Saudi Aramco, Petrobras, CNPC, CNOOC, StatoilHydro
Rosneft, Sinopec, Gazprom, Petronas, LNOC, Sonatrach, QP, NIOC, Pemex, Sonangol, ONGC, KMG
Capacity is a function of: • Government mandate & support • Ability to manage rising costs • Money • People • Technology • Project management
Pertamina, NNPC, KPC, PDVSA
Source: PFC Energy NOC Competition Service

World Bank Energy Week 2009 | Page 16
0
100
200
300
400
500
600
700
800
900
0 5 10 15 20 25 30 35 40
US 803 cars
S. Korea 230 cars
China 26 cars
UK 457 cars
PPP GDP 000/Capita
Cars/Capita (000)
India 9 cars
Meanwhile, oil demand will continue to increase ...
Japan 450 cars
Cars per 1000 People vs. GDP/capita Historical Data 1970 2007
Source: PFC Energy
Without major technological change—Pickens’ gasification and/or electrification of fleet—transportation drives oil demand growth

World Bank Energy Week 2009 | Page 17
Production crunch delayed, but still in our future
Source: PFC Energy Global Liquids Supply Forecast
2020 call on OPEC ~50–70 mmb/d, given 1.1% 2.4% growth
OPEC liquids
NonOPEC crude and NGLs

World Bank Energy Week 2009 | Page 18
1980 1985 1990 1995 2000 2005 4,500
5,000
5,500
6,000
6,500
7,000
7,500
8,000
8,500
9,000
0 1980 1985 1990 1995 2000 2005
million metric
tons
C
0
200
400
600
800
1000
1200
1400
1980
Num
ber o
f articles on
carbo
n em
ission
s And then there is climate change ...
Montreal Protocol
Earth Summit
Kyoto
CA AB 32
An Inconvenient Truth Oscar
IPCC/Gore Nobel Prize
Bali Conference
The Hague
New Delhi
Milan

World Bank Energy Week 2009 | Page 19
Value of emissions: 2007 2012

World Bank Energy Week 2009 | Page 20
The cost of Carbon – threat or opportunity?
base case 2012

World Bank Energy Week 2009 | Page 21
The cost of Carbon – threat or opportunity?
Oil Sands CCS

World Bank Energy Week 2009 | Page 22
The Cost of Carbon – threat or opportunity?
Oil Sands CCS
Additional 10% in energy efficiency

World Bank Energy Week 2009 | Page 23
The cost of Carbon – threat or opportunity?
Flaring
Additional 10% in energy efficiency
Oil Sands CCS

World Bank Energy Week 2009 | Page 24
In conclusion
§ At least 3 major issues threaten the oil and gas industry
§ Except for a few IOCs, major cuts and project deferrals
§ But short term, three sets of opportunities: – Potential increased access to NOC reserves – Reduced contractor prices – Acquisitions by stronger players among Independents and ServCos
§ Carbon regulation will force action
§ Longer term, a major oil supply crunch looms

World Bank Energy Week 2009 | Page 25
Thank You
PFC Energy consultants are present in the following locations:
} Bahrain
} Beijing
} Buenos Aires
} Calgary
} Houston
} Kuala Lumpur
} Lausanne
} London
} Mumbai
} New York
} Paris
} San Francisco
} Washington, D.C.
Strategic Advisors in Global Energy
Main regional offices:
Asia
PFC Energy, Kuala Lumpur Level 27, UBN Tower #21 10 Jalan P. Ramlee 50250 Kuala Lumpur, Malaysia Tel (60 3) 21723400 Fax (60 3) 20723599
Europe
PFC Energy, France 19 rue du Général Foy 75008 Paris, France Tel (33 1) 47702900 Fax (33 1) 47705905
__
PFC Energy International, Lausanne 19, Boulevard de la Forêt 1009 Pully, Switzerland See Map Tel (41 21) 7211440 Fax: (41 21) 7211444
Middle East
PFC Energy, Bahrain Flat 72, Building 2334, Road 2830, Al Seef 428, King Mohammed VI Avenue P.O. Box 11118 Manama, Kingdom of Bahrain Tel (973) 17580775 Fax (973) 17 581776
North America
PFC Energy, Washington D.C. 1300 Connecticut Avenue, N.W. Suite 800 Washington, D.C. 20036, USA Tel (1 202) 8721199 Fax (1 202) 8721219
__
PFC Energy, Houston 4545 Post Oak Place, Suite 312 Houston, Texas 770273110, USA Tel (1 713) 6224447 Fax (1 713) 6224448
www.pfcenergy.com | [email protected] Main regional offices are shown in blue.