STOKAB, A SOCIO-ECONOMIC ANALYSIS - FTTH · PDF fileSTOKAB, A SOCIO-ECONOMIC ANALYSIS Marco...
61
STOKAB, A SOCIO-ECONOMIC ANALYSIS Marco Forzati Crister Mattson Acreo Swedish ICT AB www.acreo.se
Transcript of STOKAB, A SOCIO-ECONOMIC ANALYSIS - FTTH · PDF fileSTOKAB, A SOCIO-ECONOMIC ANALYSIS Marco...
STOKAB, A SOCIO-ECONOMIC ANALYSIS
Marco ForzatiCrister Mattson
Acreo Swedish ICT AB
www.acreo.se

STOKAB A SOCIO-ECONOMIC STUDY
Acreo report: acr055698
Authors: Marco Forzati, [email protected]
Crister Mattsson, [email protected]
Stockholm, 17 December 2012 – 1 July 2013
Acreo Swedish ICT AB Electrum 236 16440 Stockholm
The report is referred to as:
M. Forzati, C. Mattsson, Stokab, a socio-economic study, Acreo report acr055698, Stockholm, July 2013.

2
3
Executive)summary
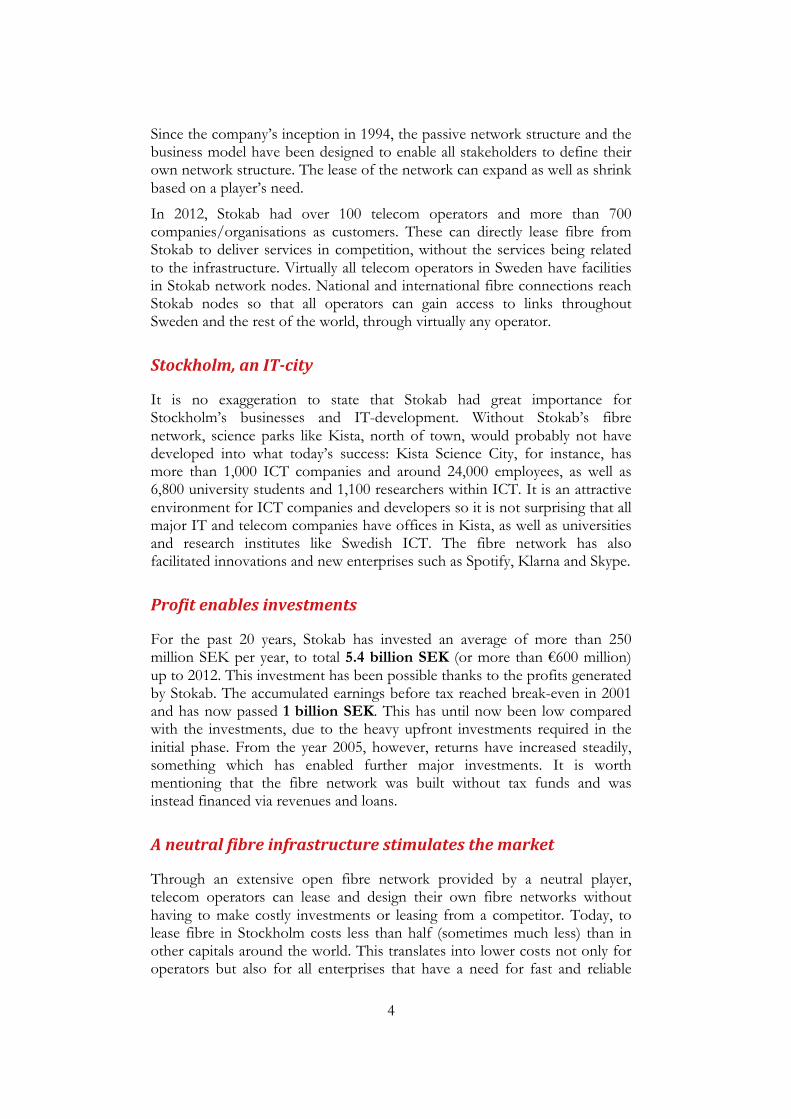
For almost 20 years, the City of Stockholm, via Stokab, has invested 5.4 billion SEK (over €600 million) in the development of an open, operator-neutral fibre network for everyone. Many articles and reports have been written on this, but primarily from a journalistic perspective. However, no research studies were until now available on the economic effects which Stokab generates for Stockholm. Acreo Swedish ICT has therefore carried out a study. In this report we describe Stokab’s model and present the outcome of the study in terms quantification of some of Stokab’s effects on the different stakeholders: Stokab’s own financial result, cost savings for the municipality and the county administration, as well as benefits for businesses and end users. These effects alone amount to 16 billion SEK (or €1.9 billion), which is nearly three times the investment. Moreover, Stockholm is compared to Copenhagen, which has conditions similar to Stockholm, but where the municipality has not taken an active role in the city’s fibre network.
The$Stokab$model$
Stokab owns and is responsible for the passive fibre network, while market players operate and deliver services over the network. Stockholm city’s basic idea is that IT infrastructure should be available to the whole society, public sector, telecom operators, and other businesses alike. Therefore Stokab’s network is designed to facilitate competition and the fibre network is open to everyone on equal terms.
The aim of the network deployment is to create an ICT infrastructure that allows competition by giving telecom operators and other companies and organisations access to the infrastructure. This vision differs from the prevailing opinion in the rest of Europe where fibre and broadband networks are often considered as a network for telecom operators. Stokab, however, has now inspired several municipal and regional fibre networks throughout Europe and the world, and the open network model is becoming increasingly appreciated. Stockholm is often cited as an IT world-class city.
Besides passive fibre lines, Stokab provides physical space in nodes equipped with power, cooling, etc. Stokab’s fibre network connects almost all multi-dwelling units and commercial properties in the Stockholm municipality: about 90% of households and almost 100% of enterprises have the possibility to sign up for a fibre-based connection.
An extensive backbone network connects industrial areas, all major healthcare facilities and urban centres in the region. The fibre network is available in all parts of the municipality and as an extensive interconnecting network in the region. With its 1.25 million kilometres of fibre, Stockholm is one of the world’s most fibre developed cities.
4
Since the company’s inception in 1994, the passive network structure and the business model have been designed to enable all stakeholders to define their own network structure. The lease of the network can expand as well as shrink based on a player’s need.
In 2012, Stokab had over 100 telecom operators and more than 700 companies/organisations as customers. These can directly lease fibre from Stokab to deliver services in competition, without the services being related to the infrastructure. Virtually all telecom operators in Sweden have facilities in Stokab network nodes. National and international fibre connections reach Stokab nodes so that all operators can gain access to links throughout Sweden and the rest of the world, through virtually any operator.
Stockholm,$an$IT2city$
It is no exaggeration to state that Stokab had great importance for Stockholm’s businesses and IT-development. Without Stokab’s fibre network, science parks like Kista, north of town, would probably not have developed into what today’s success: Kista Science City, for instance, has more than 1,000 ICT companies and around 24,000 employees, as well as 6,800 university students and 1,100 researchers within ICT. It is an attractive environment for ICT companies and developers so it is not surprising that all major IT and telecom companies have offices in Kista, as well as universities and research institutes like Swedish ICT. The fibre network has also facilitated innovations and new enterprises such as Spotify, Klarna and Skype.
Profit$enables$investments$
For the past 20 years, Stokab has invested an average of more than 250 million SEK per year, to total 5.4 billion SEK (or more than €600 million) up to 2012. This investment has been possible thanks to the profits generated by Stokab. The accumulated earnings before tax reached break-even in 2001 and has now passed 1 billion SEK. This has until now been low compared with the investments, due to the heavy upfront investments required in the initial phase. From the year 2005, however, returns have increased steadily, something which has enabled further major investments. It is worth mentioning that the fibre network was built without tax funds and was instead financed via revenues and loans.
A$neutral$fibre$infrastructure$stimulates$the$market$
Through an extensive open fibre network provided by a neutral player, telecom operators can lease and design their own fibre networks without having to make costly investments or leasing from a competitor. Today, to lease fibre in Stockholm costs less than half (sometimes much less) than in other capitals around the world. This translates into lower costs not only for operators but also for all enterprises that have a need for fast and reliable
5
communications. Lower prices also propagate down the value chain and stimulate new services and entrepreneurship.
The fibre network also delivers a wide range of indirect effects on society. It enables, for example, the use of cloud services, videoconferencing, healthcare, distance education, and other bandwidth-hungry services like HD-TV, video on demand and other streaming media. Moreover, innovation power is unleashed when both small businesses and households have the same access to broadband connectivity which previously was only available to large companies.
Lower$broadband$prices$to$enterprises$
Since telecom operators compete on equal terms, competition is fierce in Stockholm, which leads to lower prices for broadband, compared to cities where competition is weaker. Savings due to lower broadband costs for companies are estimated to approximately 75 million SEK per year if compared to Copenhagen. The difference becomes even more significant when other European cities are used as benchmark.
The$role$of$housing$companies$in$broadband$development$
Stockholm city’s housing companies have had a major role in the development of broadband. Early on they adopted a broadband policy to connect their properties to Stokab’s network and to install fibre all the way to each apartment. They are also installing home networks inside the apartments with outlets in every room. Through collaboration models, they have inspired other property owners of multi-dwelling units to join Stokab’s network. The housing companies’ accumulated investment now amounts to nearly 2 billion SEK.
Building a property network has also other merits beyond the mere delivery of broadband services to the tenants. Since the property owners connect all parts of the property, the communications network can even be used for managing, monitoring and measuring the facilities.
Increased$property$value$
By connecting multi-dwelling units with fibre, property owners have been able to more effectively use the control and automation services, electronic locks, surveillance etc, while at the same time being able to raise the rent as the fibre connection has given tenants an added value. Until now, fibre connectivity has led to a use value for the tenants and a higher property value for municipal housing companies in Stockholm (nearly 100,000 apartments) of 1.85 billion SEK, as well as increased rental revenues of over 30 million SEK per year. These effects cover the housing companies’ investments almost in full and are expected to grow in the coming years.

6
4G/LTE$deployment$
Generally, when building a 4G/LTE network, 70-80% of the total cost derives from deployment of fibre infrastructure. In principle, each base station needs to be fibre connected to sustain the high 4G/LTE capacity. Leasing the needed fibre connections instead of investing in an own backhaul network can significantly reduce the deployment cost for 4G/LTE. The world’s first 4G/LTE network was installed in Stockholm. Net4Mobility (jointly owned by operators Telenor and Tele2) states that 4G/LTE would have never been launched in Stockholm if the necessary fibre had not been available to lease form Stokab. Today, four extensive 4G/LTE-networks are present in Stockholm.
Savings$for$Stockholm’s$local$governments$$
Since Stockholm City and Stockholm County have been able to connect their premises with fibre, it has become possible to purchase data and telecommunications services on an open market. This has generated a cost saving for the municipality and for the county of about 2 billion SEK in the years 1996 – 2012.
Supplier$industry$activity$
Stokab procures the deployment, operation, materials, planning, etc. from the private market. The procurement process and the large investments made over the years have generated an economic activity that is estimated to over 5 billion SEK in the supplier industry.
Employment$
Several studies show that high-capacity broadband leads to growth and jobs creation (beyond the above-mentioned short-term economic activity generated in the supplier industry), e.g. through the development and use of advanced services and products, as well as higher ICT competence, which in turn leads to increased productivity and entrepreneurship. According to Acreo’s econometric model, the “job value” which the fibre network has created in Stockholm is estimated at about 7.7 billion SEK.
Returns$three$times$greater$than$investments$
Based on the effects discussed in the study, the benefits of Stokab sum up to 16 billion SEK (€1.9 billion at current exchange rate), nearly three times the investment. Since only a few factors have been calculated, the total return on the investment is likely to be considerably larger.
The figure on next page shows, in million SEK, the accumulated investments (red) and the socio-economic return (green) calculated as the sum of:
7
increased property value and revenues for the municipal housing companies, added value for their tenants, increased employment, Stokab’s return, saving for local governments’ ICT costs, as well as the increased economic activity in the supplier industry.
Stockholm$vs.$Copenhagen$
Stockholm and Copenhagen are relatively similar in terms of size, population and economy. It is particularly interesting to compare the broadband situation in the two cities, since diametrically opposite conclusions were reached in connection with the deregulation of the telecom market, as to who should own the ICT infrastructure and how this should be organised.
Stockholm chose, as already described, to view the ICT infrastructure as something that should be accessible to everyone and be delivered by a neutral player in order to create competition. Copenhagen opted, like most of Europe, to see the ICT infrastructure as the direct prerogative of the market and telecom operators. This has resulted in the incumbent player TDC being the one who owns and controls most of the ICT infrastructure in Copenhagen.
After about 20 years, it is interesting to see what differentiates the two cities. Regarding the development of the fibre network, barely 20% of multi-dwelling units in Copenhagen are connected, to be compared with more than 90% in Stockholm. This means that in Stockholm there are considerably more people that can get high speed broadband, and the cost for a broadband provider to reach customers is lower because the passive infrastructure (representing around 80% of total investment) is already there. Even the price of dark fibre, the basic ICT infrastructure, is significantly lower in Stockholm than in Copenhagen for both consumers and enterprises.
While in Stockholm all those who need fibre can design their network structure themselves, in Copenhagen the design possibility is heavily limited because the dominant player chose to build a the network frugally, and designed to meet their own service-delivery needs. The result is a fibre-poor network, which decreases flexibility and design possibility drastically for other operators. The low level of fibre deployment in Copenhagen also affects the possibility of symmetric high-speed broadband connection. Hence, while broadband at 100 Mb/s speed both downstream and upstream is common for the majority of residents in Stockholm, it is virtually impossible for households in Copenhagen. Moreover, the price of an asymmetric broadband connection (with low upstream speed) in Copenhagen is almost twice the price of a symmetric broadband connection (with high upstream) speed in Stockholm.
This has also a strong impact on the business climate, as the possibilities for data communication are crucial for the business creation. It is symptomatic for instance, that more and more international enterprises have chosen to locate their Scandinavian headquarters in Stockholm: in 2009, Stockholm had 69% more establishments than Copenhagen (compared to 10% in 2006).

8
!
9
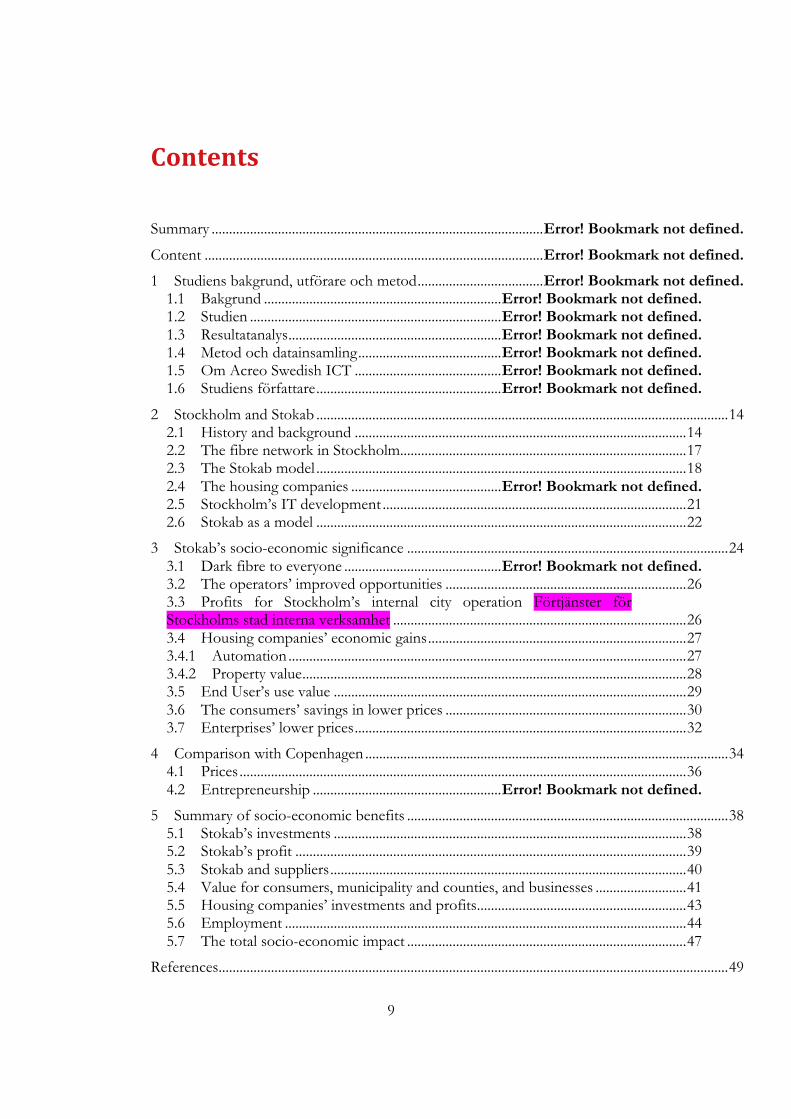
Contents)
Summary ............................................................................................... Error! Bookmark not defined.!
Content ................................................................................................. Error! Bookmark not defined.!
1! Studiens bakgrund, utförare och metod .................................... Error! Bookmark not defined.!1.1! Bakgrund .................................................................... Error! Bookmark not defined.!1.2! Studien ........................................................................ Error! Bookmark not defined.!1.3! Resultatanalys ............................................................. Error! Bookmark not defined.!1.4! Metod och datainsamling ......................................... Error! Bookmark not defined.!1.5! Om Acreo Swedish ICT .......................................... Error! Bookmark not defined.!1.6! Studiens författare ..................................................... Error! Bookmark not defined.!
2! Stockholm and Stokab ...................................................................................................................... 14!2.1! History and background ............................................................................................... 14!2.2! The fibre network in Stockholm .................................................................................. 17!2.3! The Stokab model .......................................................................................................... 18!2.4! The housing companies ........................................... Error! Bookmark not defined.!2.5! Stockholm’s IT development ....................................................................................... 21!2.6! Stokab as a model .......................................................................................................... 22!
3! Stokab’s socio-economic significance ............................................................................................ 24!3.1! Dark fibre to everyone ............................................. Error! Bookmark not defined.!3.2! The operators’ improved opportunities ..................................................................... 26!3.3! Profits for Stockholm’s internal city operation Förtjänster för Stockholms stad interna verksamhet .................................................................................... 26!3.4! Housing companies’ economic gains .......................................................................... 27!3.4.1! Automation .................................................................................................................. 27!3.4.2! Property value .............................................................................................................. 28!3.5! End User’s use value ..................................................................................................... 29!3.6! The consumers’ savings in lower prices ..................................................................... 30!3.7! Enterprises’ lower prices ............................................................................................... 32!
4! Comparison with Copenhagen ........................................................................................................ 34!4.1! Prices ................................................................................................................................ 36!4.2! Entrepreneurship ...................................................... Error! Bookmark not defined.!
5! Summary of socio-economic benefits ............................................................................................ 38!5.1! Stokab’s investments ..................................................................................................... 38!5.2! Stokab’s profit ................................................................................................................ 39!5.3! Stokab and suppliers ...................................................................................................... 40!5.4! Value for consumers, municipality and counties, and businesses .......................... 41!5.5! Housing companies’ investments and profits ............................................................ 43!5.6! Employment ................................................................................................................... 44!5.7! The total socio-economic impact ................................................................................ 47!
References .................................................................................................................................................. 49!
10
A.! Appendix ........................................................................................................................................... 53!A1.! The open access network business model ................................................................ 53!A2.! Fiberinvesteringens effekter: Uncaptured Values ........................................................ 55!5.7.1! Intressenter och fördelar ....................................... Error! Bookmark not defined.!
1 Study!background,%authors(and(methodology)
This report presents the results of a study that Acreo Swedish ICT conducted, on behalf of Stokab, with the aim to examine the socio-economic impact that Stokab and Stokab’s fibre network have brought. Of course, it is not a comprehensive analysis because it is almost impossible to evaluate all impacts and effects that the fibre network has meant. In the study, we have focused on a number of factors and attempted to calculate the economic outcome and the effects.
The study was conducted between October and December 2012. An update was made in February 2013.
1.1 Background)
Stokab and Stockholm have been talked about for many years for the city’s fibre initiative. Many articles and reports have been written on this, but primarily from a journalistic perspective. However, no research studies were until now available on the economic effects which Stokab generates for Stockholm. Moreover, there is a need to give a clearer picture of Stokabs way of working: Stokab’s model. Acreo Swedish ICT and Stokab have therefore agreed that a study should be carried out a study, to give a quantitative estimate of what Stokab’s broadband infrastructure has produced in terms of socio-economic return on the investment.
1.2 The)study)
The study provides a rough but quantitative estimation of the public revenues that Stokab’s fibre infrastructure generates. We used the models that we had previously developed to analyse the socio-economic impact of fibre networks at both municipal as well as national level.
The study was organised in four different phases:
• Definition of relevant indicators
• Collection of historical data on the fibre rollout and various relevant indicators
• Statistical processing of data
1.3 Methodology)and)data)collection)
Acreo runs socio-economic studies both in the context of major research projects, as well as projects on behalf of external organisations, notably the Swedish Government’s Broadband Forum, several municipalities in Sweden, as well as their national representative association. In this context
During 2011 Acreo has conducted, on behalf of the Swedish Government’s Broadband Forum, a study on the economic effects that investment in
12
broadband fibre generate for Sweden. The aim was to provide a quantitative estimation of how much a public euro invested in broadband infrastructure gives back to society in Sweden.
The study developed a general model of the chain of effects, and then applied standard econometric analysis to evaluate and quantify a few of these effects by measuring actual FTTH penetration rates and socio-economic indicators across Sweden. This method is applied to the Stockholm case in order to quantify the effects of Stokab’s investment.
Data was collected through available data bases from the regulator PTS, Statistic Sweden, Stokab, as well as through dedicated interviews with the relevant actors, as specified throughout the report.
1.4 About)Acreo)Swedish)ICT))
Acreo Swedish ICT is a research company that develops competence in electronics, optics and communication technology and has as a goal to turn research into commercially viable products and processes. Acreo is owned 60% by the Swedish government and 40% by the Swedish industry (hardware and software companies).
Acreo conducts several scientific socio-economic studies regarding fibre and broadband. One example is a study on the socio-economic impact of FTTH carried out on behalf of the Swedish government’s Broadband Forum (Bredbandsforum). The study focuses particularly on fibre deployment impact on employment, the value of fibre for the individuals as well as the cost-savings made possible thanks to fibre. Recently, the European Commission has commissioned from Acreo a review of the Commission’s Guide for Broadband Investment.
1.5 About)the)authors)
The study was carried out by Marco Forzati (project manager) and Crister Mattsson.
Crister Mattsson is Senior Advisor at Acreo Swedish ICT. Mr. Mattsson specialises in open networks and strategies for municipal networks, including policies and business models, with focus on EU and Scandinavia. Prior to Acreo, Mr. Mattsson was Senior Advisor at Ericsson. C.Mattsson has also been Advisor to Erisa, Europeans Regions Information Society Association in Brussels, and Director of the Industry organisation, Sweden Broadband Alliance, Mr. Mattsson has written a large number of articles and participated in several Swedish and European research projects on subjects like open networks, business-models and regulatory issues.
Marco Forzati holds a Laurea degree in Telecommunication Engineering from Politecnico di Milano, Italy, a M.Sc. and a Ph.D. degree in Electrical Engineering from Chalmers University of Technology, Gothenburg, Sweden,

13
and a B.Sc. degree in Economics from Stockholm University. Dr. Forzati has held various R&D positions at Saab Ericsson Space and Ericsson, as well as visiting scientist positions at TRLabs, and France Telecom R&D. He has authored or co-authored more than 80 papers, conference contributions and book chapters, and 3 patent applications. He has been managing a number of projects at Acreo, and he has been involved in several European research projects in areas as diverse as fibre transmission, optical access, techno-economics and business modelling.

2 Stockholm)and!Stokab)
Stockholm City has an area of around 216 km2 with about 840,000 inhabitants, in approximately 450,000 households. The majority (90%) of these households live in multi-dwelling units (MDU), and 19% of these MDUs are owned by municipal companies. Economically, Stockholm is dominated by the services sector and has the highest concentration of knowledge-intensive jobs in Europe (74% of the working population).
Already over a hundred years ago, telecommunication development commenced in Stockholm, when LM Ericsson started its business, close to where Stokab’s office is situated today. Thanks to LM Ericsson, in the end of the 1800s, Stockholm became the world’s telephone-densest city. Today, Stockholm is considered, not least because of Stokab, the world’s most fibre-developed city. This report analyses with what Stokab and the fibre in Stockholm have contributed to the city’s development. In this chapter we briefly present Stockholm, Stokab and the fibre network.
2.1 History)and)background)
Stokab was founded in 1994 with the intent to stimulate ICT development and thus promote the city’s economic growth. Several events occurred almost simultaneously:
• In January 1994, Stockholm City decided to sell the cable-TV company that was owned by the city’s three housing companies, and two strategic decisions were taken. The first decision was to keep the infrastructure, which was sold to Stokab as its starting asset, while the cable-TV company’s operational activity was sold to external buyers1. The second decision was to let Stokab lease out dark fibre because it would lead to competition, diversity and freedom of choice. The alternative, i.e. providing duct access, would instead lead to oligopoly and a less developed network.
• The city’s internal administration increased its IT-use and, with that, the need for communication between its various operations and facilities grew.
• In 1993, Sweden was one of the first countries in the world that liberalised the telecom market. Thus Sweden preceded the requirement of decommissioning telecommunications monopoly, as the EU membership entailed. Stockholm realised that many players could request to deploy their own networks, and examined the prerequisites to build a common infrastructure for everyone with the starting point not
1 This cable-TV company is currently owned by Comhem, while its infrastructure was sold to Stokab for 235 million SEK.
15
to compete with operators. The abolition of telecommunications monopoly and the distinction of infrastructure from the service portion were also something most political parties supported2.
The politicians in Stockholm City believed and still believe that the government is responsible for infrastructure (public utility) and therefore agreed, in broad political consensus, to found the Stokab company to provide passive IT infrastructure (dark fibre) to everyone on equal terms. They also considered it important to continue developing Stockholm as a leading ICT city. Therefore, the provisioning of dark fibre was viewed as essential in order to promote good IT environment. With the liberalisation of the telecommunications market, Stockholm wanted to procure telecom and data communications as services in full competition. By establishing Stokab, which provides dark fibre in virtually unlimited volumes, both the city and others operating in Stockholm could implement procurements among a large number of service providers.
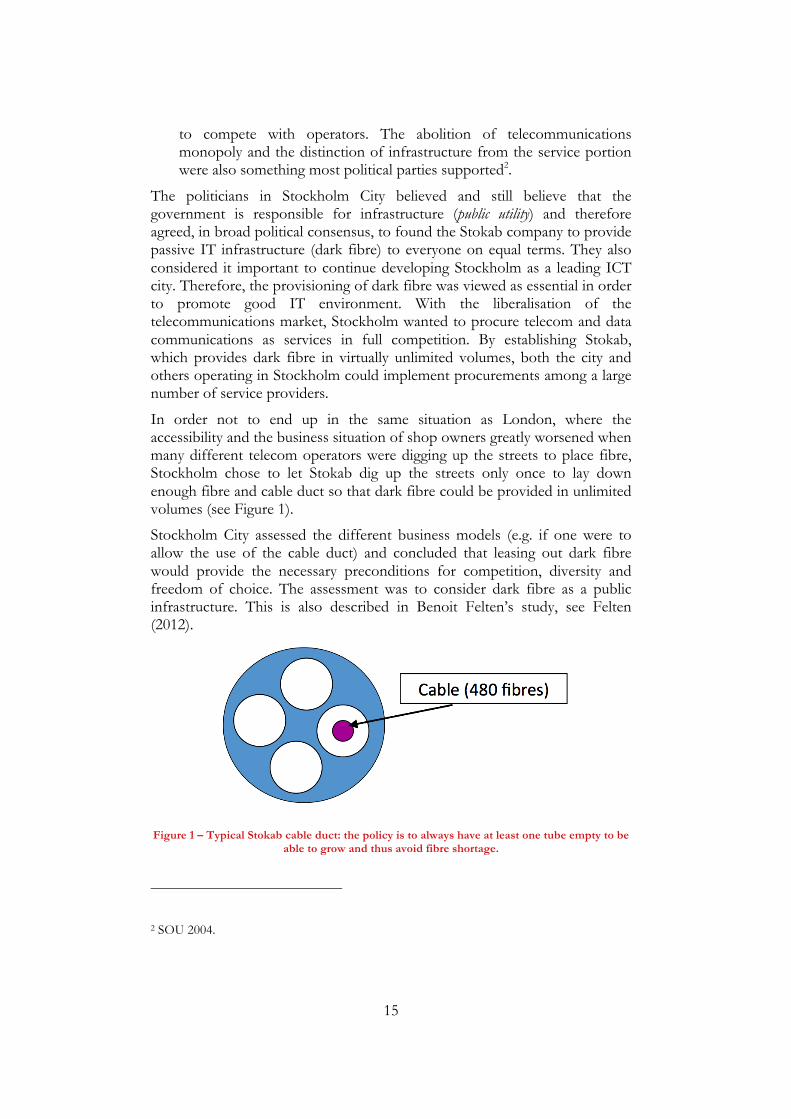
In order not to end up in the same situation as London, where the accessibility and the business situation of shop owners greatly worsened when many different telecom operators were digging up the streets to place fibre, Stockholm chose to let Stokab dig up the streets only once to lay down enough fibre and cable duct so that dark fibre could be provided in unlimited volumes (see Figure 1).
Stockholm City assessed the different business models (e.g. if one were to allow the use of the cable duct) and concluded that leasing out dark fibre would provide the necessary preconditions for competition, diversity and freedom of choice. The assessment was to consider dark fibre as a public infrastructure. This is also described in Benoit Felten’s study, see Felten (2012).
Figure 1 – Typical Stokab cable duct: the policy is to always have at least one tube empty to be able to grow and thus avoid fibre shortage.
2 SOU 2004.
16
At the end of ‘90s, several residential buildings were connected with fibre when competitors to SMP/TeliaSonera began selling broadband services to the household market. An example of such operators was Bredbandsbolaget. Around 2005, the city’s politicians realised, combined with the demand from the telecom operators, that also households would need fibre connection. Therefore a fibre-to-the-home (FTTH) model of Stokab was drafted, and between 2007-2009 the municipally-owned housing companies’ MDUs were fibre connected. Between 2009-2012, other MDUs were connected using the same model regardless of who owned the houses. The FTTH network, which is based on the already existing network (point-to-point connections), comprises 90% of households (approximately 400,000 households) and nearly 100% of companies.
The ambition with the network deployment was to create a comprehensive ICT infrastructure that enables competition by giving telecom operators, companies and organisations access to operator-neutral infrastructure. The demand for symmetric high capacity broadband provided by FTTH is something that has developed strongly only in recent years in line with an ever-increasing range of services also to households.
However, the real driving force of development was not originally FTTH but the ambition to create an ICT infrastructure. Stokab’s network has been developed in line with market needs. The network was first built in the business district of the city to quickly expand into industrial areas like Kista. As the hospitals in the region commissioned fibre connections between themselves and all major healthcare units, the network grew with at least one connection point in all municipalities in the county. Thus it became easy for operators to transmit traffic in and out of Stockholm. Over the years, the network was built increasingly dense, mainly in the Stockholm municipality and in those industrial areas where the market had a need to connect. Initially, the infrastructure was partly for the city’s own needs and partly to provide operator-neutral infrastructure for enterprises and operators.
When it comes to Stockholm’s internal use, Stokab has established a subsidiary, Sankt Erik Kommutication, which leases fibre from Stokab, and then connects the city’s operations. Therefore, the city can procure operators and service providers in competition in an open market.
In principle, all operators in Sweden are present in Stokab’s network and have equipment in Stokab’s connection points. Stokab owns and is responsible for the passive network, while the market players operate on the network. National and international fibre connections reach Stokab’s connection points, so that all players have easy access to connections with the rest of the country and the world, via basically any network operator.
Stokab’s operation has also inspired many other municipalities to make broadband ventures. Even outside Sweden, the Stokab model has been copied. Singapore and Australia are just two examples that have taken inspiration from Stokab. Not everyone has implemented the full Stokab model, and locally adapted varieties were often produced. Success has been mixed, perhaps because the model has not been implemented consistently.
17
2.2 The)fibre)network)in)Stockholm)
The FTTH network in Stockholm, whose development was described in the previous section, includes three types of players3: a physical infrastructure provider (PIP), i.e. Stokab; network providers (NP), such as traditional and alternative telecom operators; and service providers (SP). NPs create transmission capacity by activating the passive fibre leased from Stokab. SPs deliver services, such as Internet, TV, telephony and others, to the end users.
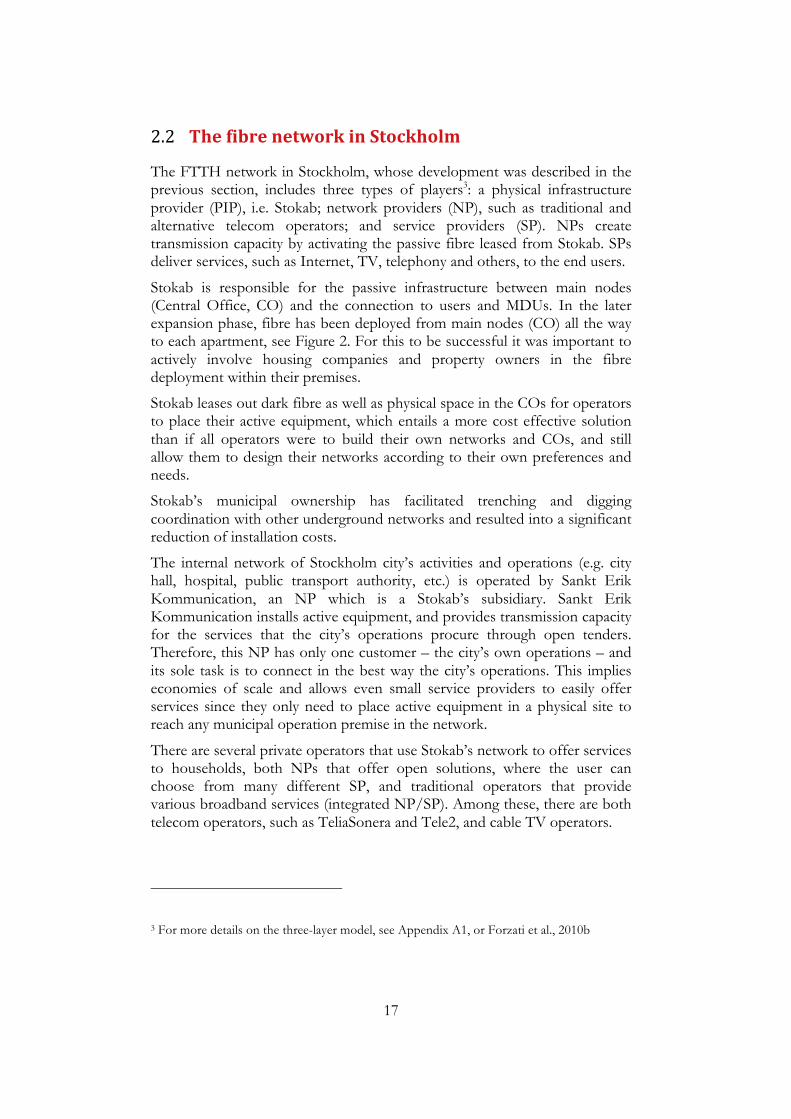
Stokab is responsible for the passive infrastructure between main nodes (Central Office, CO) and the connection to users and MDUs. In the later expansion phase, fibre has been deployed from main nodes (CO) all the way to each apartment, see Figure 2. For this to be successful it was important to actively involve housing companies and property owners in the fibre deployment within their premises.
Stokab leases out dark fibre as well as physical space in the COs for operators to place their active equipment, which entails a more cost effective solution than if all operators were to build their own networks and COs, and still allow them to design their networks according to their own preferences and needs.
Stokab’s municipal ownership has facilitated trenching and digging coordination with other underground networks and resulted into a significant reduction of installation costs.
The internal network of Stockholm city’s activities and operations (e.g. city hall, hospital, public transport authority, etc.) is operated by Sankt Erik Kommunication, an NP which is a Stokab’s subsidiary. Sankt Erik Kommunication installs active equipment, and provides transmission capacity for the services that the city’s operations procure through open tenders. Therefore, this NP has only one customer – the city’s own operations – and its sole task is to connect in the best way the city’s operations. This implies economies of scale and allows even small service providers to easily offer services since they only need to place active equipment in a physical site to reach any municipal operation premise in the network.
There are several private operators that use Stokab’s network to offer services to households, both NPs that offer open solutions, where the user can choose from many different SP, and traditional operators that provide various broadband services (integrated NP/SP). Among these, there are both telecom operators, such as TeliaSonera and Tele2, and cable TV operators.
3 For more details on the three-layer model, see Appendix A1, or Forzati et al., 2010b
18
Approximately 100 operators use Stokab’s network, as well as more than 700 non-telecom companies (such as banks, media, and security activities, etc.), which lease point-to-point connections directly from Stokab, and can use their own equipment (or through outsourcing) to create communication between their own facilities, sometimes with security and information-sensitive services. This also allows them to procure services in competition, without having the services connected to the infrastructure.
Initially, it was feared that Stokab would act as a competitor to the traditional players. However, over time, the telecom operators have switched to using Stokab’s network, and it has become clear that Stokab is not in competition with active network services, but rather provides a competitively neutral playing field for them.
Figure 2 – Stokab’s network model
2.3 The)Stokab)model)
The Stokab model is based on the persuasion that the fibre network constitutes an infrastructure for the entire community, the public sector, businesses and of course telecommunications. This vision differs from the prevailing opinion in the rest of Europe where fibre and broadband networks are often considered as a network for telecom operators. Stokab, however, has now inspired several municipal and regional fibre networks throughout Europe and the world, and the open network model is becoming increasingly appreciated.
As mentioned above, Stokab does not compete with the telecom sector, instead it remains at the lowest level in the value chain: the dark fibre level. This has led to virtually all operators in Stockholm and Sweden to use the Stokab network. It is cheaper to lease dark fibre than having to build an entire own network and with hundreds of operators and companies are using
19
the same infrastructure (in many cases in the same cable), this is a cost effective model. The biggest cost is represented by digging and installation; hence Stokab has established coordination with other utilities (such as sewage and electricity), the underground public transport authority, and other infrastructure players.
There are over 15,000 connection points throughout the city, which means that property owners and enterprises can connect to them, and then are able to choose services from all operators.
Originally, it was predominantly telecom companies that wished to lease connections from point to point. Nowadays, access connections to private users have become a significant activity and are used by operators and service providers to connect to multi-dwelling properties and deliver services to their customers.
Stokab’s network is very comprehensive and fibre is present in all parts of Stockholm, as well as extensive interconnecting networks in the region, which makes Stockholm one of the world’s most fibre developed cities. A key success factor in Stokab’s business is that it managed to connect everyone everywhere.
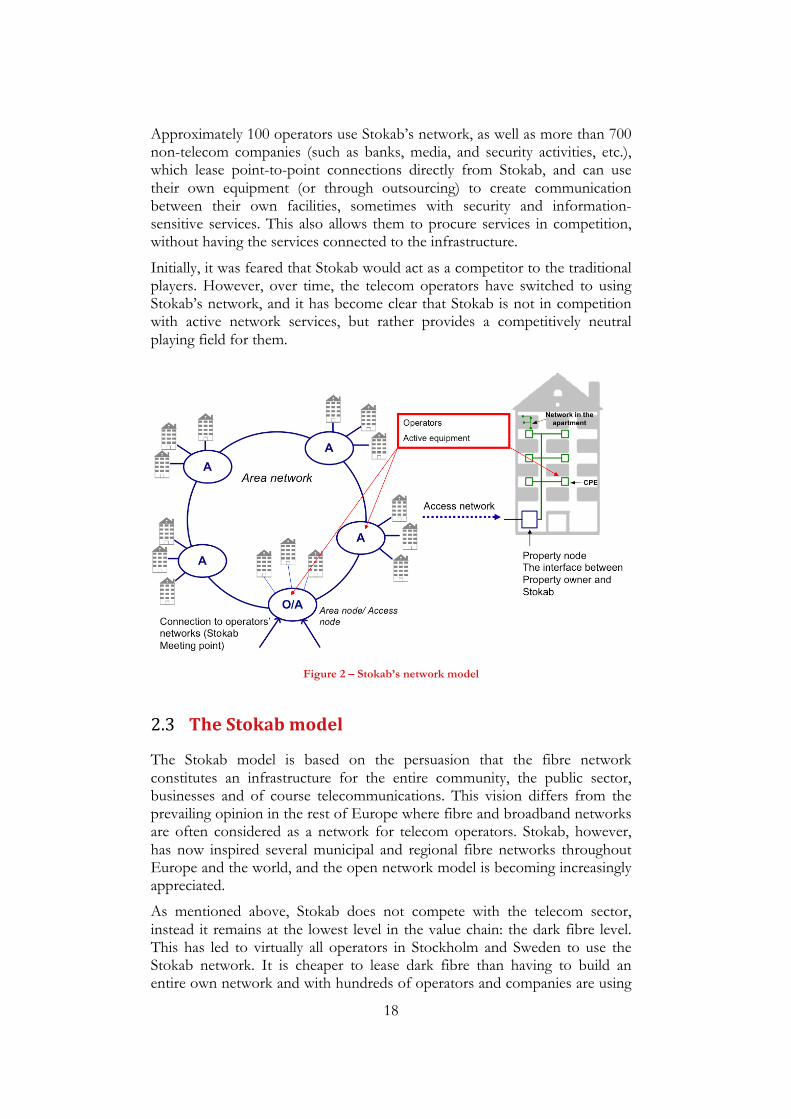
Stokab’s business model has had a positive effect on prices for businesses and end users. A more detailed description of the open network business model is in Appendix A1. Stokab’s model is roughly equivalent to model (d) described there, where Stokab obviously take the role of PIP (passive infrastructure provider), while the roles of NP (network provider) and SP (service provider) are left to the market.
The majority of the other network owners act simultaneously at several different levels in the value chain, which may involve risks of the monopoly-like structures and that the potential network customers (NP and SP) tend to see the network owner as a competitor and prefer to establish their own networks.
Figure 3 - The open network model

20
2.4 Housing)companies
Stockholm city’s housing companies took a major role in the broadband development. Today, the three municipality-owned housing companies have together approximately 70,000 apartments (in recent years, they have sold about 20,000 apartments). )Early on, housing companies adopted a broadband policy to install fibre all the way to each apartment. They have also built home networks inside the apartments with outlets in every room. Moreover, through collaborative models, they have inspired other property owners of MDUs to join Stokab’s network.
Housing companies have an important role, as they decide whether to connect their properties to a particular network provider. They make agreements for the provisioning of services to the tenants. The municipality-owned housing companies in Stockholm have chosen open solutions where the tenants are free to choose from a variety of TV and Internet service providers. To be able to accomplish this, the housing companies in Stockholm contributed in the early years to create a so-called network provider (NP).
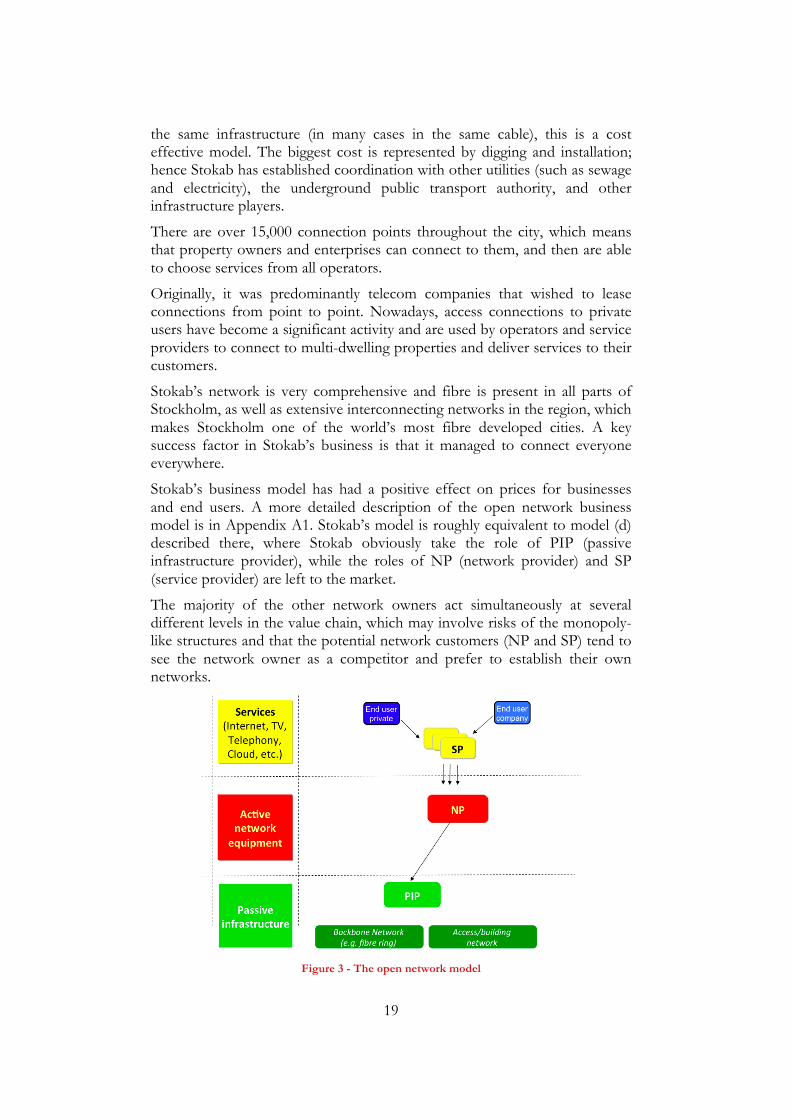
Figure 4 shows the value chain from the housing companies’ perspective. The housing companies installed, and paid for, the installation of the property network, which connects all apartments to a connection point. At a later stage, they have expanded the installation to also include apartment network with outlets in every room.
The network provider leases the network inside the premises of the housing companies and dark fibre connections in the municipality network of Stokab to get through to the property’s connection point. The network provider usually has no own services but has, in turn, made agreements with various service providers so that the tenants, the end users, are able to choose among several providers simultaneously.
Each of Stockholm city’s three housing companies have run their own tender and contracted the active network operation to different network providers. These contracts are time limited and at the end of the contract a new NP can be selected. This model has now spread across the country and more and more municipal networks contract out the active network operation to an external network provider (the prevalent model was before that the municipal company acted as both PIP and NP).
Some of the private property owners and housing associations sign contracts with a service provider who then gets the exclusive right to deliver in that particular property. One reason for that is that this offers favourable conditions for exclusive right. However, even in these cases the operators use Stokab’s network to connect the property. Today, virtually all residential properties in Stockholm are connected to Stokab.
Housing companies also see other benefits from building property networks than merely delivering broadband services to the residents. The property
21
owners get all parts of the property connected with a communication network that can be used for control, monitoring and measuring of equipment. It is mainly on the energy side that substantial savings can be made. It is possible to install sensor networks for measurement and monitoring even without a fibre network, but the communication cost with traditional infrastructure is generally much higher than using the fibre network.
Figure 4 - Value chain for broadband services and the housing companies
2.5 Stockholm’s)IT)development)
Besides operators (approximately 100, including telecom companies, mobile operators, cable TV providers), there are many other players (such as banks, media companies, security companies, etc. totalling 700 businesses) who lease Stokab’s fibre to interconnect their activities. Therefore, it is no exaggeration to claim that Stokab had great importance for enterprises and Stockholm’s IT development.
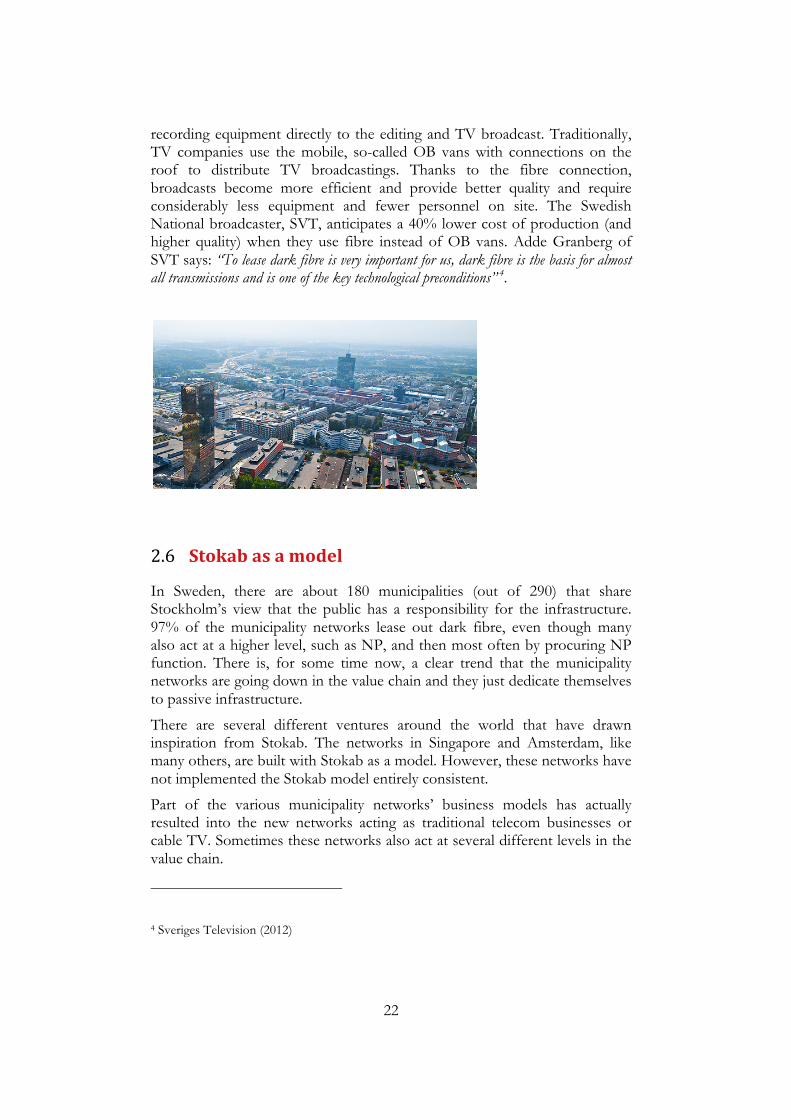
One example is the northern suburb of Kista has a huge impact on Stockholm’s development and is today an attractive environment for IT companies and developers. Today, many major IT and telecom companies have offices in Kista, as well as universities and research institutes such as Swedish ICT and other development activities. Kista has become Science City of Stockholm and today has more than 1,000 ICT companies, both big and small, and around 24,000 employees. In Kista Science City there are also 6,800 university students and 1,100 researchers within ICT. Of course, this would have not been possible without a comprehensive IT infrastructure of fibre.
The fibre network in Stockholm has gained great importance also for the media. Because the fibre is connected to many different locations in Stockholm, including stadiums, TV companies are able to connect their
22
recording equipment directly to the editing and TV broadcast. Traditionally, TV companies use the mobile, so-called OB vans with connections on the roof to distribute TV broadcastings. Thanks to the fibre connection, broadcasts become more efficient and provide better quality and require considerably less equipment and fewer personnel on site. The Swedish National broadcaster, SVT, anticipates a 40% lower cost of production (and higher quality) when they use fibre instead of OB vans. Adde Granberg of SVT says: “To lease dark fibre is very important for us, dark fibre is the basis for almost all transmissions and is one of the key technological preconditions” 4.
2.6 Stokab)as)a)model)
In Sweden, there are about 180 municipalities (out of 290) that share Stockholm’s view that the public has a responsibility for the infrastructure. 97% of the municipality networks lease out dark fibre, even though many also act at a higher level, such as NP, and then most often by procuring NP function. There is, for some time now, a clear trend that the municipality networks are going down in the value chain and they just dedicate themselves to passive infrastructure.
There are several different ventures around the world that have drawn inspiration from Stokab. The networks in Singapore and Amsterdam, like many others, are built with Stokab as a model. However, these networks have not implemented the Stokab model entirely consistent.
Part of the various municipality networks’ business models has actually resulted into the new networks acting as traditional telecom businesses or cable TV. Sometimes these networks also act at several different levels in the value chain.
4 Sveriges Television (2012)
23
Can the Stokab model serve as a model for other parts within the EU? Yes, especially if there are difficulties in achieving the objectives of the European digital agenda. The authors believe that it is clear that if more municipalities and regions in Europe would start using the Stokab model, broadband developments would appear different and probably go faster.
In Stokab’s case, the municipality is the driving force instead of the traditional telecom operators as it is in the rest of Europe. Municipalities and regions can make entirely different considerations and coordination if fibre networks are regarded as infrastructure for society, like streets and highways, rather than just telecom networks.
It could lead to IT infrastructure and fibre being treated as a natural part of the public sector’s areas of responsibility and being included in the urban planning. The prerequisite should be as in the Stokab model that the network is leased on equivalent terms for all players and that the network owner does not compete with the users.
3 Stokab’s!socioFeconomic'significance)
Several studies show that investments in fibre, broadband and IT lead to more jobs, higher productivity and higher GDP5. For example, a study by Arthur D. Little for Ericsson indicates that a 10% increase in basic broadband penetration leads to 1% increase in GDP6. A study that Acreo did in 2011 clearly shows that an increase in fibre penetration leads to increased employment7.
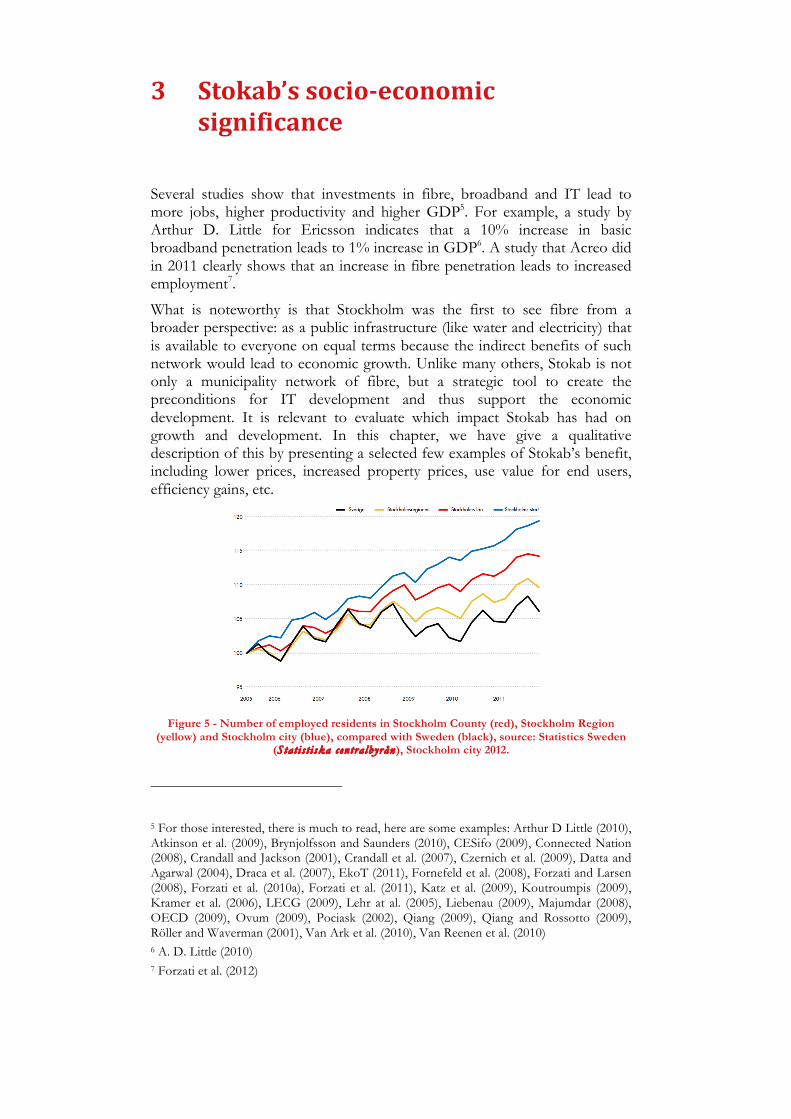
What is noteworthy is that Stockholm was the first to see fibre from a broader perspective: as a public infrastructure (like water and electricity) that is available to everyone on equal terms because the indirect benefits of such network would lead to economic growth. Unlike many others, Stokab is not only a municipality network of fibre, but a strategic tool to create the preconditions for IT development and thus support the economic development. It is relevant to evaluate which impact Stokab has had on growth and development. In this chapter, we have give a qualitative description of this by presenting a selected few examples of Stokab’s benefit, including lower prices, increased property prices, use value for end users, efficiency gains, etc.
Figure 5 - Number of employed residents in Stockholm County (red), Stockholm Region
(yellow) and Stockholm city (blue), compared with Sweden (black), source: Statistics Sweden (Stat i s t i ska centra lbyrån), Stockholm city 2012.
5 For those interested, there is much to read, here are some examples: Arthur D Little (2010), Atkinson et al. (2009), Brynjolfsson and Saunders (2010), CESifo (2009), Connected Nation (2008), Crandall and Jackson (2001), Crandall et al. (2007), Czernich et al. (2009), Datta and Agarwal (2004), Draca et al. (2007), EkoT (2011), Fornefeld et al. (2008), Forzati and Larsen (2008), Forzati et al. (2010a), Forzati et al. (2011), Katz et al. (2009), Koutroumpis (2009), Kramer et al. (2006), LECG (2009), Lehr at al. (2005), Liebenau (2009), Majumdar (2008), OECD (2009), Ovum (2009), Pociask (2002), Qiang (2009), Qiang and Rossotto (2009), Röller and Waverman (2001), Van Ark et al. (2010), Van Reenen et al. (2010) 6 A. D. Little (2010) 7 Forzati et al. (2012)
25
3.1 Dark)fibre)to)all)
One way to see the benefits of Stokab’s investment – and perhaps the most direct – is to think that investments are made only once by a neutral infrastructure holder. The operators that would have invested in fibre development can now instead lease fibre from Stokab and invest in other activities, such as product development, and be able to offer better services with lower prices.
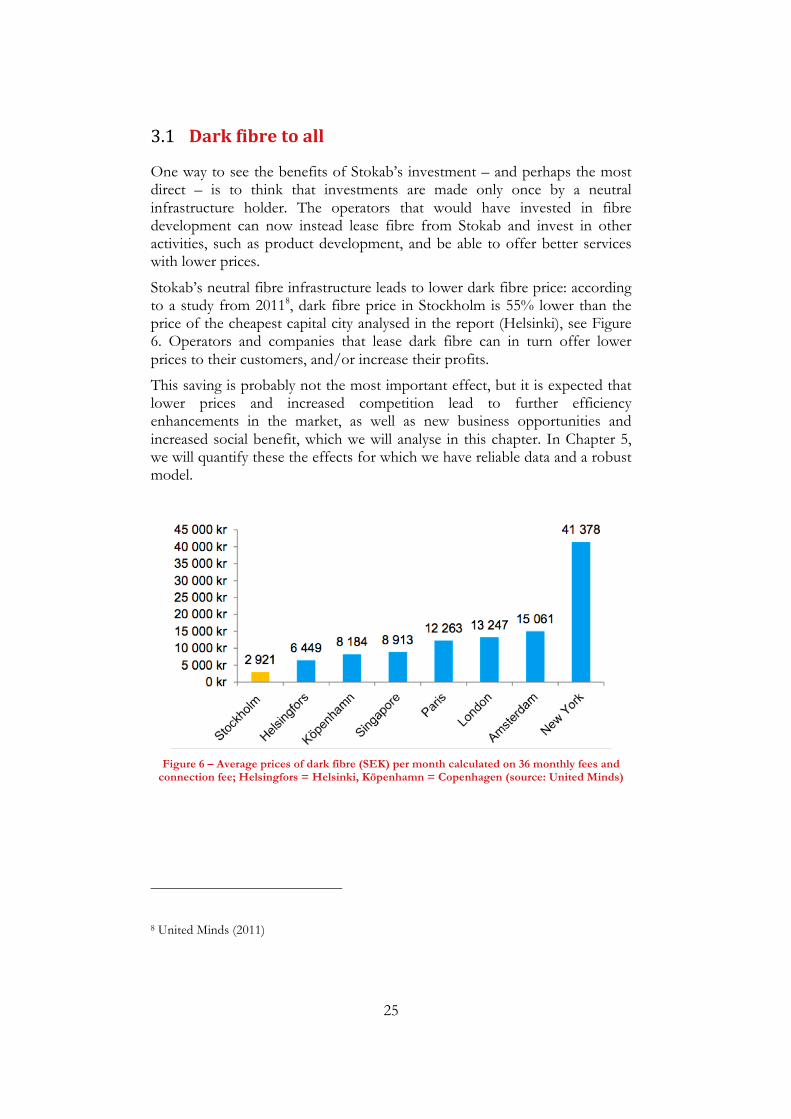
Stokab’s neutral fibre infrastructure leads to lower dark fibre price: according to a study from 20118, dark fibre price in Stockholm is 55% lower than the price of the cheapest capital city analysed in the report (Helsinki), see Figure 6. Operators and companies that lease dark fibre can in turn offer lower prices to their customers, and/or increase their profits.
This saving is probably not the most important effect, but it is expected that lower prices and increased competition lead to further efficiency enhancements in the market, as well as new business opportunities and increased social benefit, which we will analyse in this chapter. In Chapter 5, we will quantify these the effects for which we have reliable data and a robust model.
!Figure 6 – Average prices of dark fibre (SEK) per month calculated on 36 monthly fees and
connection fee; Helsingfors = Helsinki, Köpenhamn = Copenhagen (source: United Minds)
8 United Minds (2011)
26
3.2 Operators’)improved)opportunities$
Initial set-up costs are a threshold that restricts deployment opportunity for operators. In Stockholm, an operator can easily establish itself, because it is possible to lease infrastructure from a network owner that does not compete on service level. Moreover, Stokab’s is a comprehensive network both in the city and in the region. Stokab’s connection points and nodes are fully equipped for telecom equipment hence making connectivity set-up simpler and less costly than elsewhere. This leads to rather low market access threshold and an operator can start on a small scale large investments in infrastructure. This is one of the reasons why so many operators have established themselves and in some cases also started up in Stockholm.
The presence of approximately 100 operators in Stockholm using Stokab’s network shows the value of an operator neutral network. Since deployment costs and fibre cables are shared by multiple players, the number of operators has also resulted in the possibility of keeping the prices of fibre connections low. The deployment cost of a network is dominated by civil works (trenching, digging, cable laying, etc), rather than the number of fibres, therefore each additional player using the network results in reduced cost per network user.
Even mobile operators can quickly establish themselves and lease a whole basic network including antenna sites, which is one of the reasons why Stockholm rapidly became one of the most mobile friendly cities in the world, with several competing mobile companies. This is even more evident for 4G/LTE mobile systems which, unlike previous generations, require fibre as basic infrastructure for base stations and transmitters. The world’s first 4G/LTE network was installed in Stockholm, and Net4Mobility (jointly owned by operators Telenor and Tele2) states that 4G/LTE would have never been launched in Stockholm if the necessary fibre had not been available to lease form Stokab. Today, four extensive 4G/LTE-networks are present in Stockholm.
Currently we cannot confidently quantify the effects described in this chapter, so they are not included in the summary of Chapter 5.
3.3 Benefits)for)Stockholm’s)internal)city)operations))
When it comes to Stockholm City’s internal operations, Stokab has a subsidiary company, Sankt Erik Kommunication, which leases fibre from Stokab, and then connects the city’s operations. The city can then procure data and telecom services in an open market.
The fibre network has also inspired Stockholm City’s administrations to develop and introduce e-services with increased service for residents and enterprises. This has also meant that administrations have become more efficient. The requirements for investments in e-services are that these investments must be paid back within 3 years.
27
The fibre network has benefits also for other public institutions such as schools and hospitals, which now have a fast and reliable broadband connection. This, in turn, has enabled the introduction of functions that were not possible without fibre connection.
An arguably easier to quantify effect is the considerable cost savings for data and telecommunication made possible by the fibre network. This depends in part on increased efficiency (reduced equipment, energy consumption, and footprint per transmitted information unit), in part on the fibre network with high capacity allows more competition (generally, all operators can use the same fibre network9).
In 1996, Stockholm City procured the telephony service together with the Swedish Agency for Public Management (Statskontoret). A prerequisite for being able to procure telephony in full competition (which was a unique feature for public organisations in Europe at this time) was that, the city, through Stokab, connected the Stockholm City’s premises with its own fibre network. The city’s external telephony cost at the time was 150 million SEK per year. With fibre network as basis, Stockholm City was able to procure the telephony service in full competition resulting in a 30% saving, namely 45 million SEK annually10. Similar savings have been observed at county level. Stockholm County Council reduced its data and telecommunications costs by 50%, which translates to 60 million SEK, thanks to the fibre network11.
3.4 Housing)companies’)economic)gains)
There are many different economic gains that a property owner can obtain from a comprehensive fibre network, through better control and measurement systems, on one hand, and through increased return and increased property value and revenue on the other.
3.4.1 Automation$
Heating, electricity and water are the major costs for a housing company. Svenska Bostäder, which has 24,000 apartments, annually pays between 500 and 600 million SEK in consumption. By using the fibre network for monitoring and control systems, new functions can be introduced. Svenska Bostäder estimates to save 30% in 20 years12.
9 i.e. around 100 different network operators are present in Stockholm. 10 Stockholm City (2011) 11 Stockholm County Council (2011) 12 SvB (2012)
28
Also traditional home care can significantly reduce its costs while increasing service quality for the consumers by using broadband. The municipality-owned housing company Micasa manages Stockholm City’s care homes. Micasa expect to be able to introduce new services for the tenants and above all, to improve the condition of the care recipients. This will also bring substantial cost savings. Micasa states that they expect to be able to lower their energy costs by 2-3% annually and achieve savings of 20% in 10 years13. Micasa states that major economic benefits of installing broadband networks will come through the installation of sensors that can improve operations by introducing communications-based services, electronic locks (i.e. the transition to using electronic key system is expected to be paid back in one year, primarily thanks to reduced handling costs), etc.
Monitoring property’s condition can identify faults at an early stage, and hence prevent property damage. Water faults (by far the most common and type of fault) are a good example of how an early identification can considerably limit damage: according to the plumbing companies, water damages in buildings currently cost approximately 10 billion SEK per year in Sweden.
Based on discussions with the housing companies, the authors assess that the merits that have occurred thanks to improved monitoring and control on the energy lead to more than 1% savings. If the municipality-owned housing companies in Stockholm, which have 70,000 apartments, are able to save 1% annually, this translates to a saving of 14.5 million SEK per year. If we include every currently connected property (103,000 apartments), the benefit is expected to be 20.8 million SEK annually. The goal of the housing companies is to save 30% in 20 years (437.5 million SEK). Fibre infrastructure considerably facilitates the installation of such automation system, but it is probably not an absolute requirement.
Since we are currently lacking a good model to quantify which proportion of the savings can be attributed to fibre, we have decided not to include them here14.
3.4.2 Real$estate$value$
The value of a property depends on its location, its size, the building’s conditions, as well as the facilities and services available. Whenever a property is upgraded by new or upgraded facilities. A fairly standard way for real-estate owners to calculate the property value increase is to use the increased revenue
13 Micasa (2012) 14 The model will be updated during 2013.
29
generated by the new or upgraded facility as a basis. In particular, if a rental income from a property is increased by x (e.g. based on increased tenant use value, see section 3.5), the value of the property, is increased by the corresponding value, ΔV, which would be needed to generate the same value x based on a specified return rate r. In mathematical form: x =r × ΔV. The choice of r obviously influences the property evaluation, and must be chosen with care. In the case of the municipality-owned housing companies in Stockholm an annual return rate r = 5% is used, while the increase in rent was decided in an agreement with the tenant association to be 47 SEK per year per apartment. Considering there are 103,000 apartments connected, we obtain x = 58 kSEK per year, and hence the increase in real estate is valued to over 1 billion SEK. To be noted that the extra revenue of 47 SEK per month and apartment is only included as use value for the tenants (see below) and not as extra revenue for the housing company, as that would obviously amount to double counting.
There is also an additional rent for apartments that have installed apartment networks as well (40 SEK per apartment per month), although this is first activated when a new tenant enters gets access to an apartment. This means further increase in value, which will grow over time and will soon reach another 1 billion SEK.
We calculate in detail investments and profits for housing companies in Chapter 5.
3.5 End)User’s)use)value$
As we have observed before, individuals receive the benefits of FTTH in various direct and indirect ways: high-quality services at lower prices, especially entertainment and communication, the possibility to work remotely and to choose the work place and home more freely, improved personal health, reduced need for hospitalisation, simpler and more transparent interaction with public services, etc.15 It is difficult to calculate the added value of FTTH for end-users in SEK, but we can estimate a conservative amount through the following assumption.)The tenants association and the property owners in Stockholm have come to an agreement on the value of a fibre connection. It does not apply to the services themselves, but only to the access possibility. If the apartment is connected by fibre, a so-called increased use value of 47 SEK per apartment per month is implied. There will be an additional amount for the apartment network inside the apartment; however, this currently applies to only few
15 See, for example, the result among end-users in Ovum (2009).
30
apartments because the additional rent for the apartment network is first activated when the apartment changes tenant. The tenant that was originally living in the apartment during the installation pays no additional rent for the apartment network, only for the connection to fibre16.
The total of the municipally owned housing companies represents approximately 76,000 apartments, and the cooperative housing company, SKB, has 7,000 apartments. An additional 20,000 houses had previously been connected by the housing companies and, while still maintaining their original broadband contracts, have now been sold.
The annual use value of fibre connection of all the connected properties is 58.1 million SEK. This translates into a use value of 225 million SEK a year when all of Stockholm’s 400,000 apartments also become connected to the fibre network on equal terms.
In Chapter 5, however, we consider only the figures for the municipally owned apartments, since, when it comes to private housing companies and associations, we do not have figures reliable enough for take-up rate and property network’s investments.
3.6 Consumers’)savings)in)lower)prices)
The consumers’ prices for Internet are relatively similar across Sweden. However, there are some differences shown in both PTS and Acreo’s studies. The differences are mainly between networks with an Internet Service Provider (ISP) and networks with multiple competing ISPs. Of course it may be difficult for a supplier to justify the big differences between different parts of Sweden.
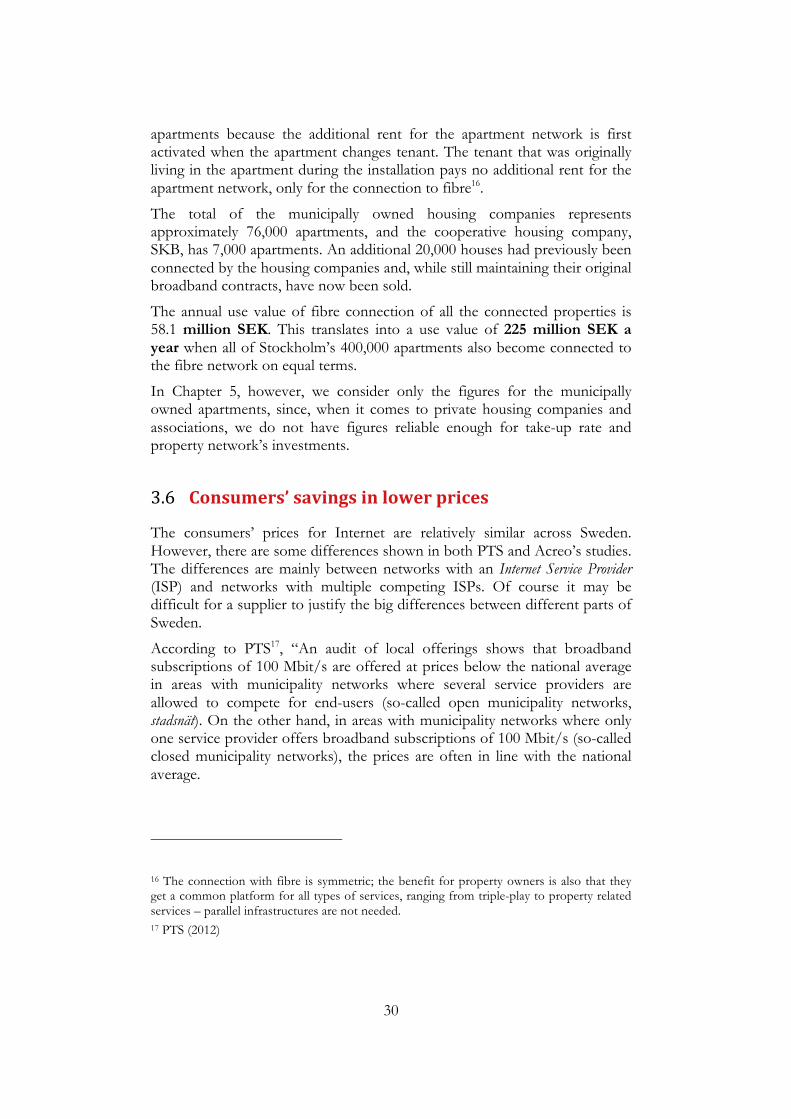
According to PTS17, “An audit of local offerings shows that broadband subscriptions of 100 Mbit/s are offered at prices below the national average in areas with municipality networks where several service providers are allowed to compete for end-users (so-called open municipality networks, stadsnät). On the other hand, in areas with municipality networks where only one service provider offers broadband subscriptions of 100 Mbit/s (so-called closed municipality networks), the prices are often in line with the national average.
16 The connection with fibre is symmetric; the benefit for property owners is also that they get a common platform for all types of services, ranging from triple-play to property related services – parallel infrastructures are not needed. 17 PTS (2012)
31
Figure 7 – Open networks and price for Internet service. The graph shows the average of the
lowest price (for 10 Mb/s symmetric) depending on the number of competitors in each network: fewer service providers means higher prices compared to more. (Each point in the
figure represents a fibre network, the position of each fibre network is defined by the number of service providers and the price for 10 Mb/s symmetric Internet service offered the cheapest
service provider on that network.)
Thus it can be stated that in areas with open networks, the price of broadband subscriptions via fibre is often cheaper for the end-user than in areas without open networks. PTS’ assessment is that the prices of broadband subscriptions via fibre in open municipality networks are often 20-30% lower than the corresponding nationwide offerings.”
Acreo carried out its own study on municipality networks’ prices, which clearly indicates that the price decreases with the number of competing, service providers (see preliminary results in Figure 7). The differences become clearer and more obvious in an international comparison.
In a comparison with Denmark, you can see broadband services that are based on fibre networks are more expensive in Denmark, while so-called broadband services, with lower transmission speeds that are delivered on copper networks is cheaper in Denmark. 100 Mb/s is now a regular service, while it is still fairly uncommon internationally, probably due to the lack of fibre.
Stokab’s network deployment has had a decisive influence on price trends by stimulating competition and diversity. A symmetric 100 Mb/s Internet service costs from approximately 300 SEK per month in Stockholm, and as low as around 70 SEK for group contracts with 100 apartments. There are very few cities where symmetric 100 Mb/s is available to residential customers at all. Considering instead a 100/10 Mb/s and an individual residential contract in Stockholm, this usually costs less than 250 SEK/month, often as low as 230 SEK/month. This can be compared with similar offers in the few international places where 100/10 Mb/s is available.
0!
50!
100!
150!
200!
250!
300!
350!
1! 2! 3! 4! 5! 6! 7! 8! 9! 10! 11!
32
Few examples from different European markets are illustrate the price benefit that Stockholm citizens enjoy:
• Fastweb in Italy offers 100/10 Mb/s for 450 SEK/month
• Orange in France offers PON-based asymmetric 100 Mb/s for 400 SEK/month
• BT offers “up to” 160/20 Mb/s for 500 SEK/month
• Portugal Telecom offers 100/10 Mb/s for 350 SEK/month
• Telekom Slovenje offers 100/10 Mb/s for 250 SEK/month18
However, we have decided not to quantify lower price in a general socio-economic gain in Chapter 5, we instead opted to take the conservative position that the increased use value for end-users partly depend on better services at lower prices.
3.7 Enterprises’)lower)prices)
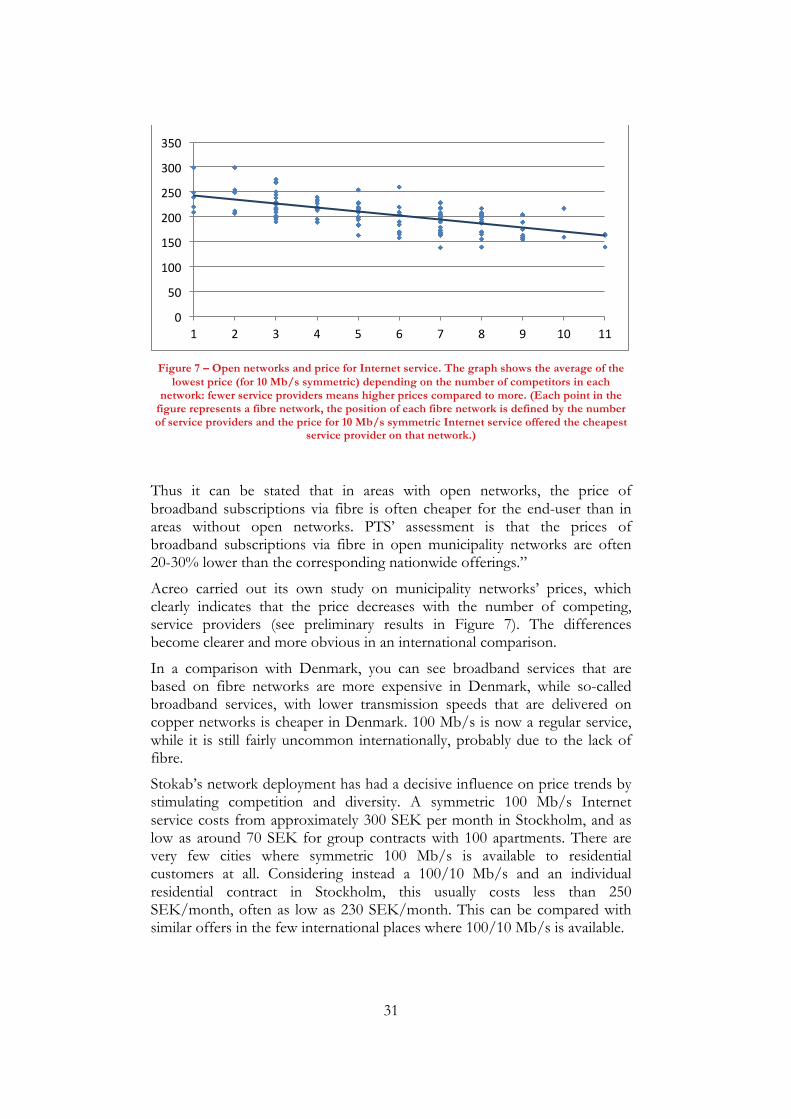
The fact that the prices for fibre connections for enterprises are cheaper in Stockholm constitutes a concrete value for the enterprises. In Stockholm, the Stokab’s open dark fibre network has created a competition in capacity provisioning, which has resulted in lower price levels than in other major cities19.
The difference in the cost for an enterprise compared with the cost in Copenhagen constitutes a value for the enterprises in Stockholm. We have calculated this value to the number of enterprises.
Difference in cost between Stockholm and Copenhagen (see Figure 8) is 9,936 SEK per year (even higher when compared with other European cities).
Calculated on the number of enterprises in Stockholm, it results in a total value of 75 million SEK per year (the assumption of the calculation is that 30% of the approximately 25,000 workplaces today have an average of a 100 Mb/s connection20).
18 It should be considered that the general cost and the purchasing power are lower in Slovenia than in Sweden and that 250 SEK for a Slovenian consumer are relatively more than for a consumer in Stockholm. 19 Source: United Minds (2011). 20 For comparison, the average fibre service take-up rate currently reported by housing companies is between 30% and 40%, SvB (2012), SABO (2012).
33
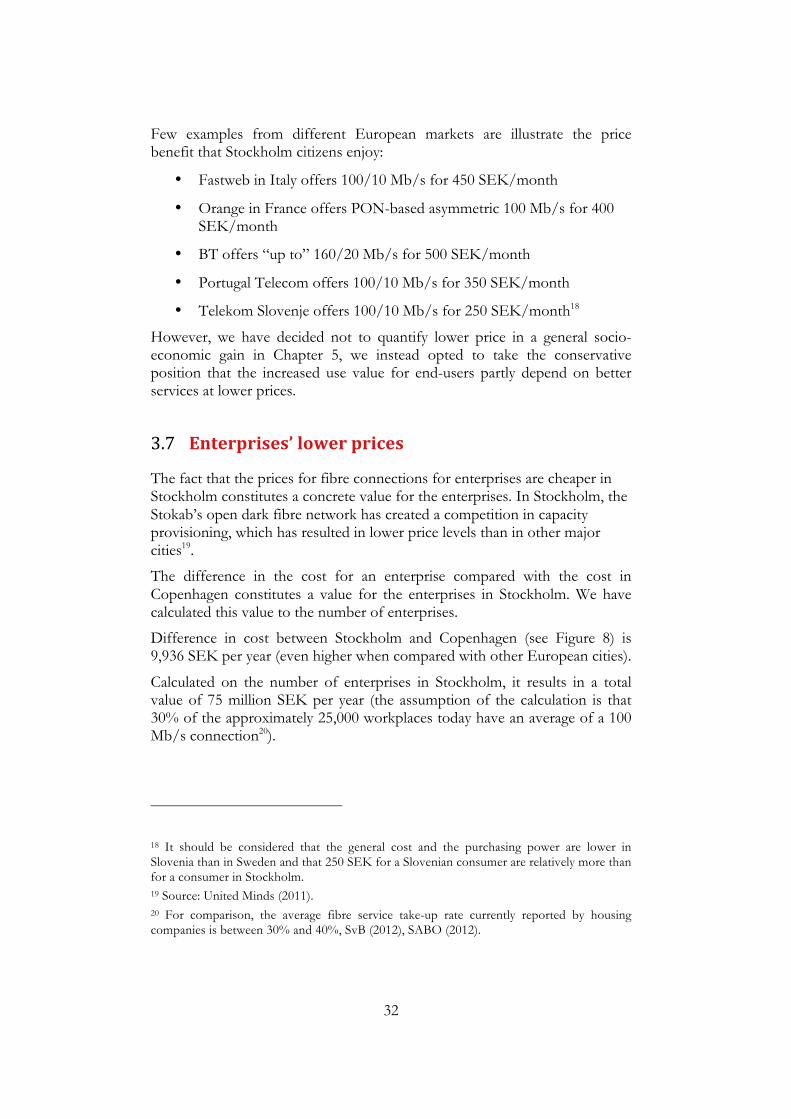
The costs of the companies have most likely a positive impact on the establishment of enterprises in Stockholm. Like the case of Kista, the growth of new businesses in Stockholm is also considerably higher than the national average or other major urban regions.
There are of course several reasons, major cities, capitals have a particular attraction and affect new establishments. But the access to infrastructure is important when it concerns IT infrastructure: prices and access can be crucial for the establishment possibilities.
Figure 8 - Average cost (SEK) per month calculated on 36 monthly fees and connection fee;
Helsingfors = Helsinki, Köpenhamn = Copenhagen; source: United Minds (2011)
Figure 9 - Number of enterprises per thousand inhabitants in Stockholm County (brown) compared with other counties and Sweden average (orange): it shows that Stockholm has always been more active, but the difference has increased over the past 15 years; source:
ekonomifakta.se
4 Comparison*with*Copenhagen)
Copenhagen’s socio-economic conditions are quite similar to Stockholm, but the Danish capital does not have a municipally owned network. There are also several public housing companies in Copenhagen; however, they are more similar to cooperative housing companies21. Some efforts have been made to establish fibre network in Copenhagen. Swedish company Bredbandsbolaget established a subsidiary in Copenhagen in the early 2000s and implemented some pilot projects in cooperation with housing company AKB. The project collapsed in connection with the so-called telecom crisis.
The Danish power companies, NVE and Dong also made a broadband venture; later the companies were merged and transferred to incumbent telecom operator TDC, which subsequently let it sort of fade out. Most likely this is because the activities compete with their own DSL and cable television networks.
In Jylland and other regions outside the greater Copenhagen area, there are some broadband initiatives from local power companies. Some broadband operators use fibre, but this is not marketed in the same way as in Sweden. Some fibre is leased from the so-called “carriers”. The fibre present in Denmark is mainly used by the operators to reach their own stations (nodes).
It exists no open solution where customers can choose several different service providers. The company Global Connect offers fibre to lease and has a relatively well developed network; however, it does not provide connections to end customers, but to operators and enterprises, mostly in the form of capacity. It appears that operators in Denmark prefer to lease capacity rather than dark fibre as in Sweden, possibly due to the fibre network not being as well developed and the monopolist’s pricing discouraging dark fibre lease.
Today, the municipalities and the housing companies in Denmark have no explicit fibre strategy (according to the housing companies’ association Boligsellskapernas Landsförening and the power companies’ association, Dansk Energi), and they rely entirely on DSL and cable. There is a general idea that municipalities should not get involved in broadband development and it is common to hear that it would not be allowed for municipalities to invest or own networks. Compare this with Sweden where the general belief is that it is important for municipalities to get involved (see Figure 11).
However, at the end of January, Carsten Hansen, of the Ministry of Housing, Urban and Rural Affairs, has declared that the municipalities should get involved, and referred to a study by Acreo, stating: “The Swedish analysis reinforces that good broadband connections create growth and prosperity in society and secure the future of welfare.”22 The minister will also explore the opportunities for public-private partnerships (PPPs) within the broadband area.
21 Dansk Energi (2012), Global Connect (2013), BSL (2012) 22 Børsen (2013)
35
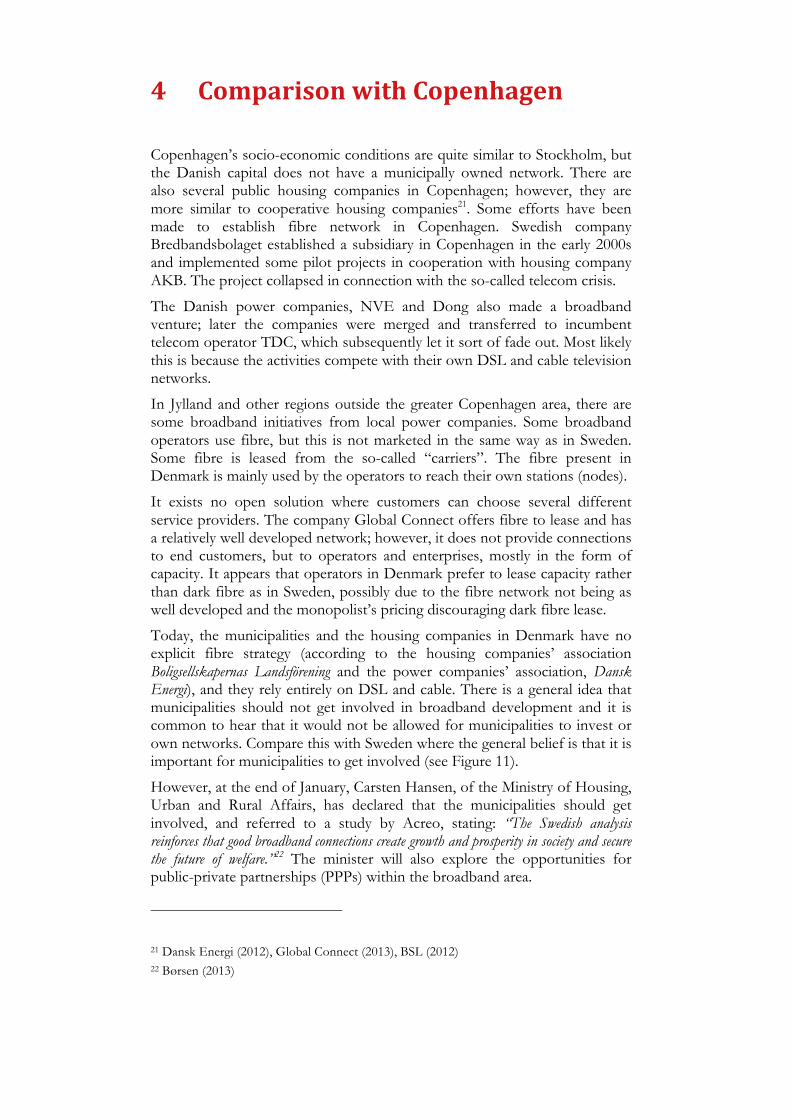
Stockholm Copenhagen
City’s involvement High Very low
Public funding No state subsidy. Stokab is built with bank loans.
No state subsidy. Some tax credit.23
Fibre infrastructure owned primarily by
Stokab (munipally owned); Skanova in a minor extent
TDC (privately owned telecom companies, the former monopolist); Global Connect in a minor extent (especially in industrial areas)
Neighbourhoods with fibre 100 % <60 %
Fibre-connected buildings (FTTB)
>90 % 15-20 % (not used today)
Dedicated fibre pair from each household to access node
Yes No
Business model Functional separation and open access
Vertical integrated operators
Access to dark fibre leasing
Yes, to everyone on equal and transparent conditions, from a neutral player (Stokab)
Limited access (from Global Connect, which also delivers services)
Figure 10 – The fibre situation in Copenhagen compared with Stockholm
Figure 11 – Perception among Swedish municipalities on whether society should own the fibre infrastructure (source: SSNf); 74% answer “yes, absolutely”, 21% “yes, in part”, and only 5% answer “no” or “don’t know”
23 Deloitte (2010)
36
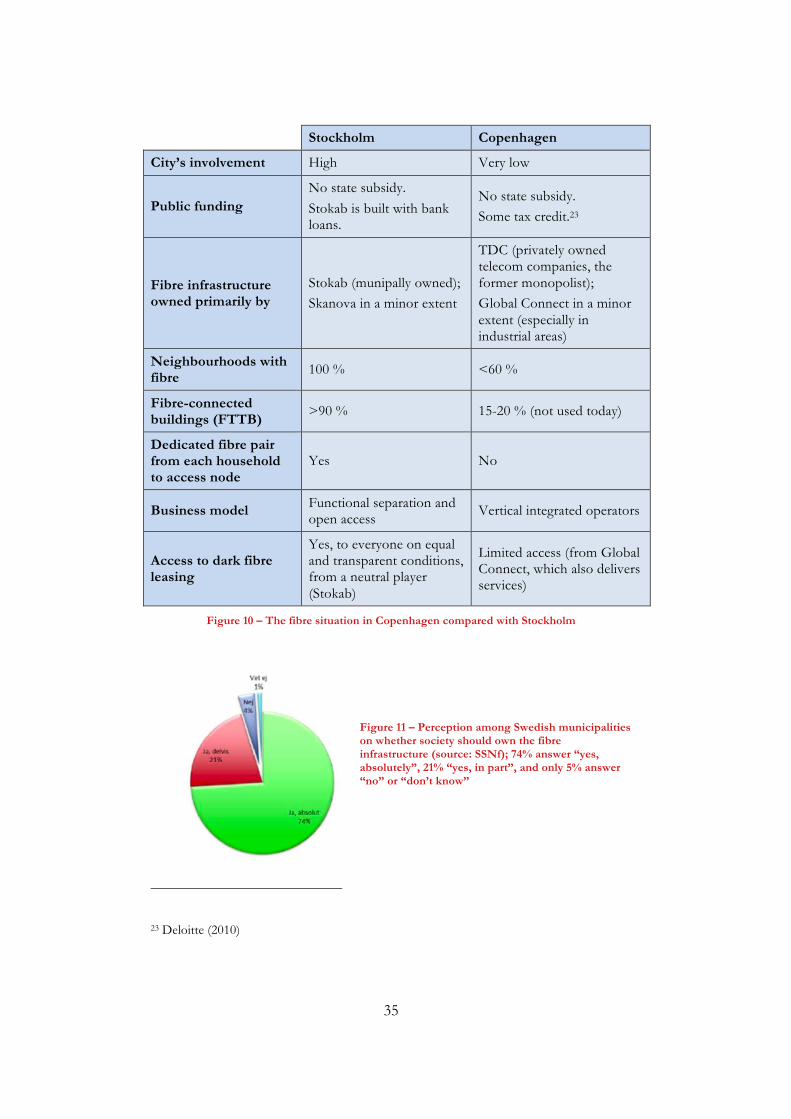
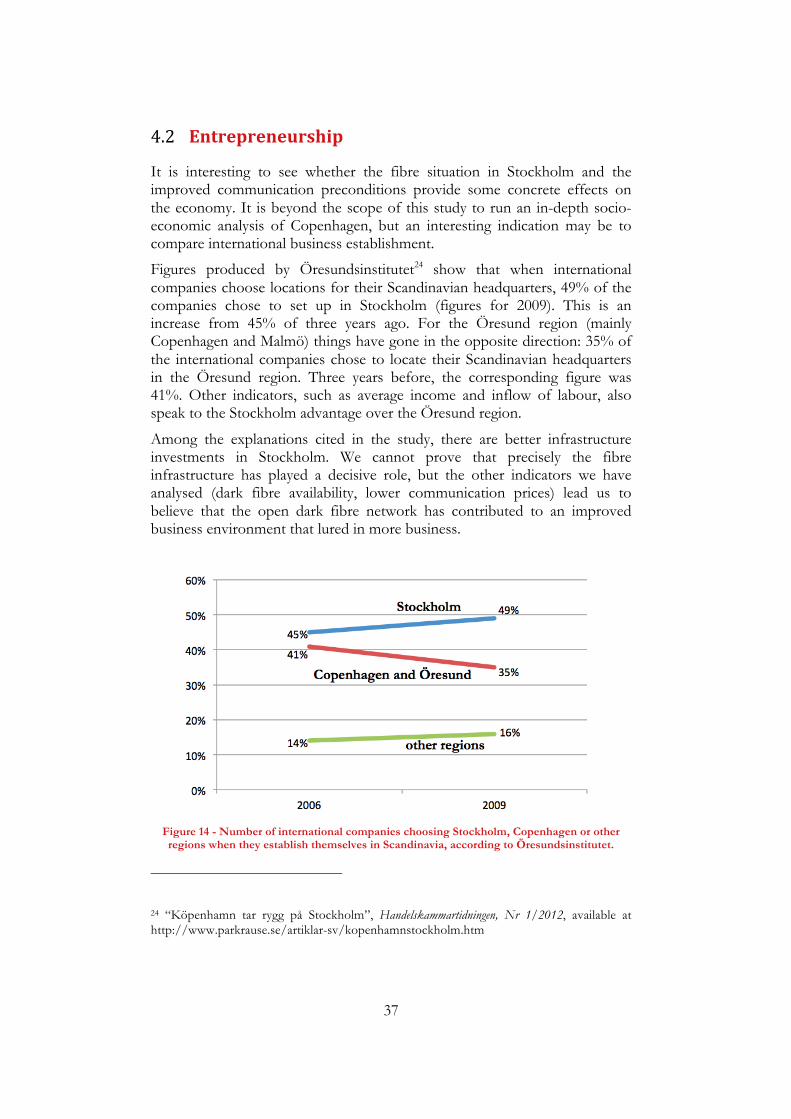
4.1 Prices)
The prices in Denmark for fibre connections’ companies are relatively low compared with many other large cities. And yet, the prices are significantly higher than in Stockholm (see Figure 12). This is especially true for dark fibre, which in Copenhagen is less frequent and, more importantly, in a big way owned by a non-neutral operator (TDC or Global Connect).
Figure 12 - Comparison of business prices (monthly price in SEK for 100 Mb/s, calculated over
36 monthly fees and connection fee) in Stockholm and Copenhagen; source: United Minds (2011)
Figure 13 - Comparison of consumer prices (monthly price in SEK for 100 Mb/s) in Stockholm and Copenhagen; source: online information from each respective service provider, retrieve on
4 February 2013
37
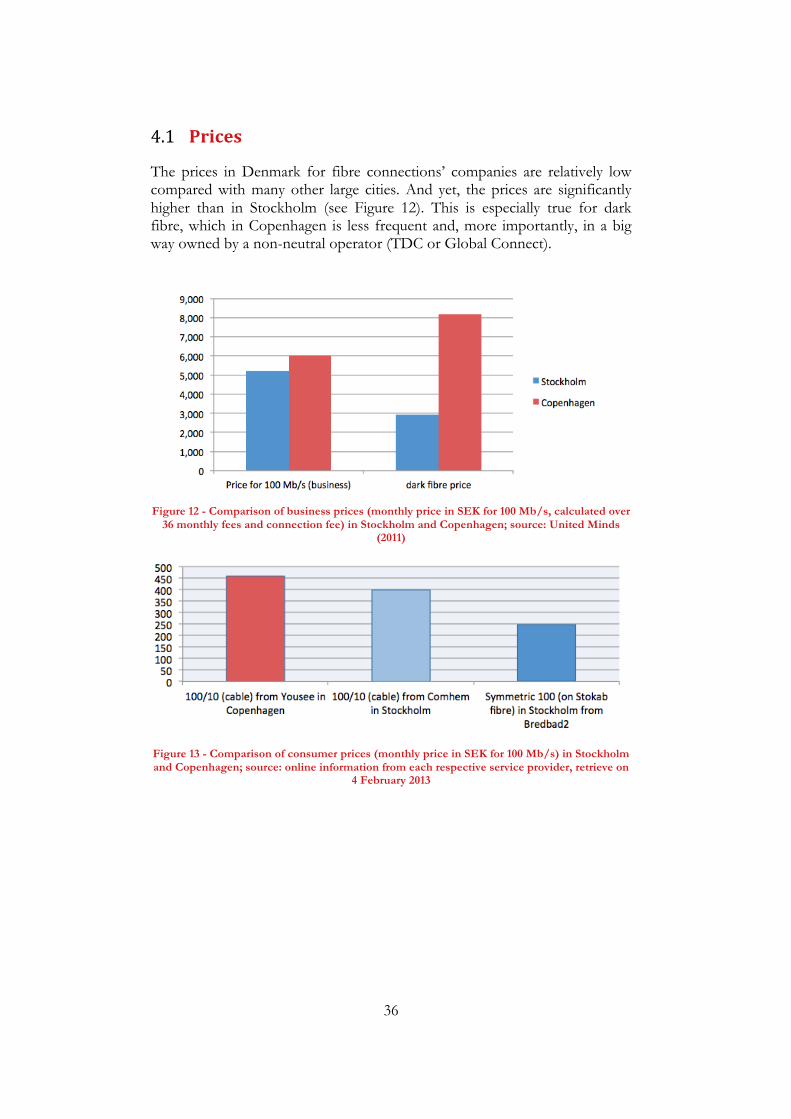
4.2 Entrepreneurship)
It is interesting to see whether the fibre situation in Stockholm and the improved communication preconditions provide some concrete effects on the economy. It is beyond the scope of this study to run an in-depth socio-economic analysis of Copenhagen, but an interesting indication may be to compare international business establishment.
Figures produced by Öresundsinstitutet24 show that when international companies choose locations for their Scandinavian headquarters, 49% of the companies chose to set up in Stockholm (figures for 2009). This is an increase from 45% of three years ago. For the Öresund region (mainly Copenhagen and Malmö) things have gone in the opposite direction: 35% of the international companies chose to locate their Scandinavian headquarters in the Öresund region. Three years before, the corresponding figure was 41%. Other indicators, such as average income and inflow of labour, also speak to the Stockholm advantage over the Öresund region.
Among the explanations cited in the study, there are better infrastructure investments in Stockholm. We cannot prove that precisely the fibre infrastructure has played a decisive role, but the other indicators we have analysed (dark fibre availability, lower communication prices) lead us to believe that the open dark fibre network has contributed to an improved business environment that lured in more business.
Figure 14 - Number of international companies choosing Stockholm, Copenhagen or other regions when they establish themselves in Scandinavia, according to Öresundsinstitutet.
24 “Köpenhamn tar rygg på Stockholm”, Handelskammartidningen, Nr 1/2012, available at http://www.parkrause.se/artiklar-sv/kopenhamnstockholm.htm
5 Summary!of!socioFeconomic'benefits)
In Chapter 3, we have given an overview of the various direct and indirect effects of Stokab’s fibre investment and business model. For some of these effects we were able to build a simplified but robust model and to collect reliable data. In this chapter, we present the result of an analysis in which we summarise these effects and estimate the accumulated gain over time. The calculations are made using SEK 2012 as a monetary quantification. No NPV adjustment was applied in the results presented here (which turn out to be undervalued by roughly one third when it comes to investment and by 11% when it comes to return, compared with the results obtained with NPV adjustment based on a 5% rate).
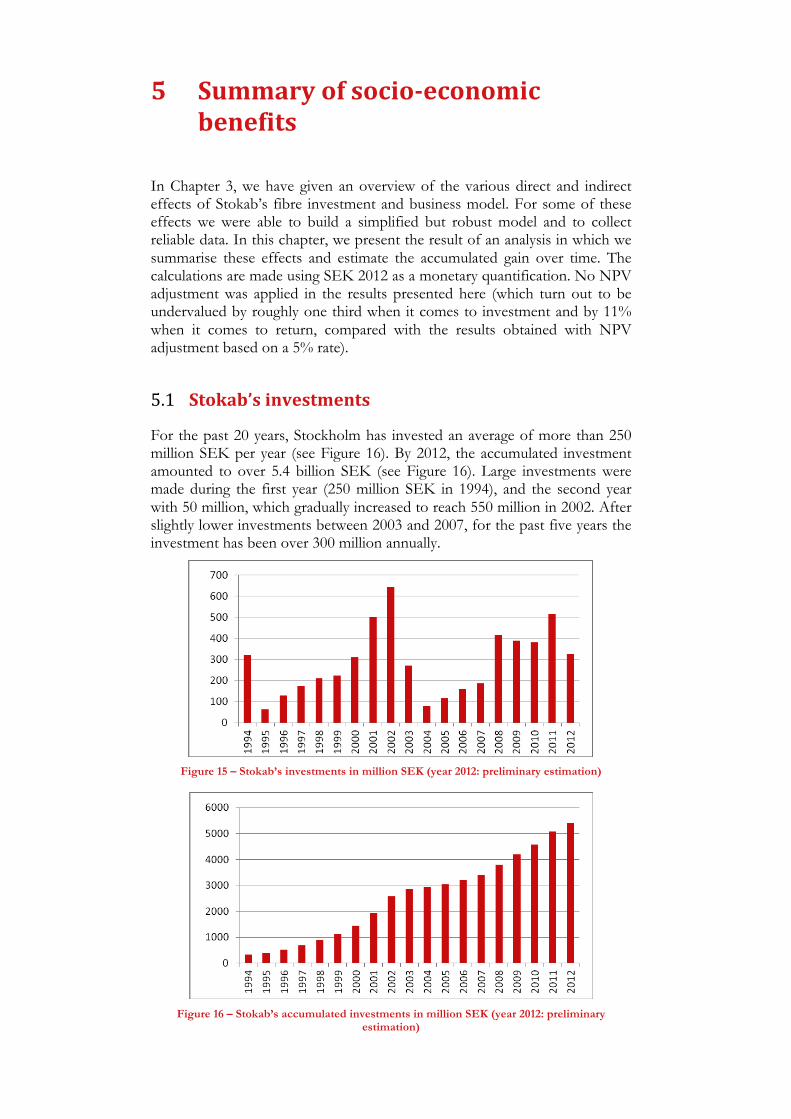
5.1 Stokab’s)investments)
For the past 20 years, Stockholm has invested an average of more than 250 million SEK per year (see Figure 16). By 2012, the accumulated investment amounted to over 5.4 billion SEK (see Figure 16). Large investments were made during the first year (250 million SEK in 1994), and the second year with 50 million, which gradually increased to reach 550 million in 2002. After slightly lower investments between 2003 and 2007, for the past five years the investment has been over 300 million annually.
Figure 15 – Stokab’s investments in million SEK (year 2012: preliminary estimation)
Figure 16 – Stokab’s accumulated investments in million SEK (year 2012: preliminary
estimation)
!
!
39
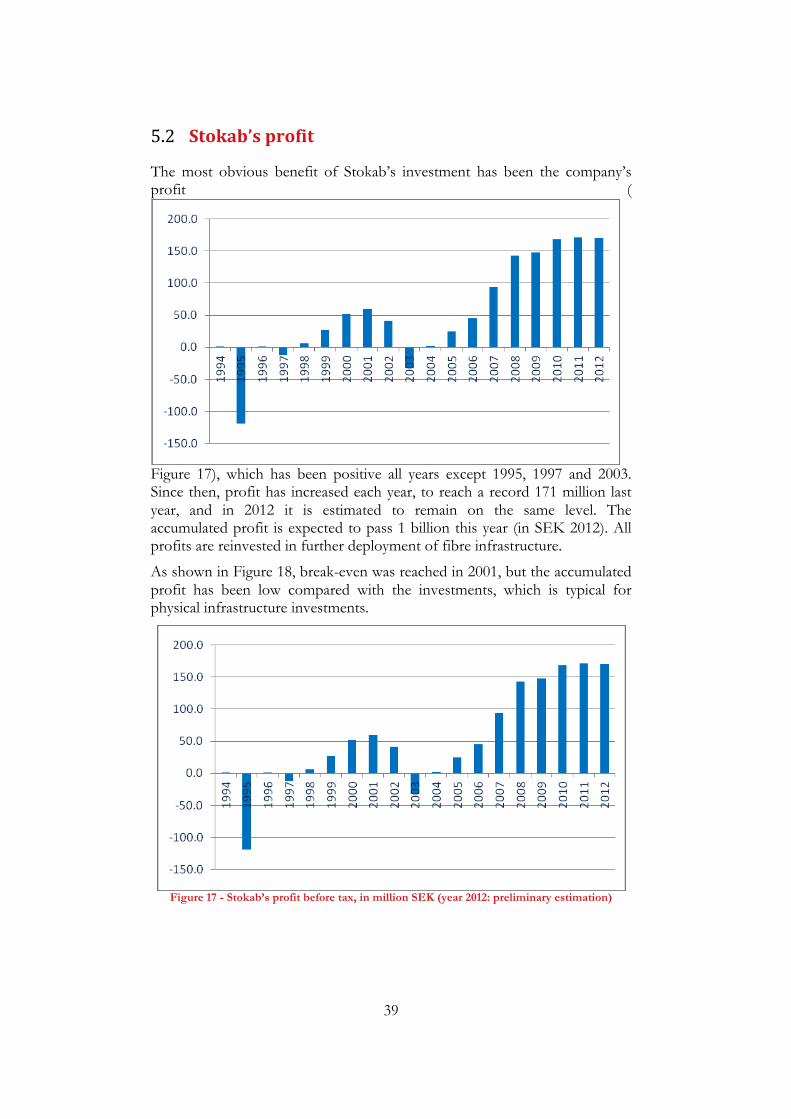
5.2 Stokab’s)profit)
The most obvious benefit of Stokab’s investment has been the company’s profit (
Figure 17), which has been positive all years except 1995, 1997 and 2003. Since then, profit has increased each year, to reach a record 171 million last year, and in 2012 it is estimated to remain on the same level. The accumulated profit is expected to pass 1 billion this year (in SEK 2012). All profits are reinvested in further deployment of fibre infrastructure.)As shown in Figure 18, break-even was reached in 2001, but the accumulated profit has been low compared with the investments, which is typical for physical infrastructure investments.
Figure 17 - Stokab’s profit before tax, in million SEK (year 2012: preliminary estimation)
!
!

40
Figure 18 - Stokab’s accumulated profit before tax, in million SEK 2012 (preliminary estimation for 2012)
5.3 Stokab)and)suppliers)
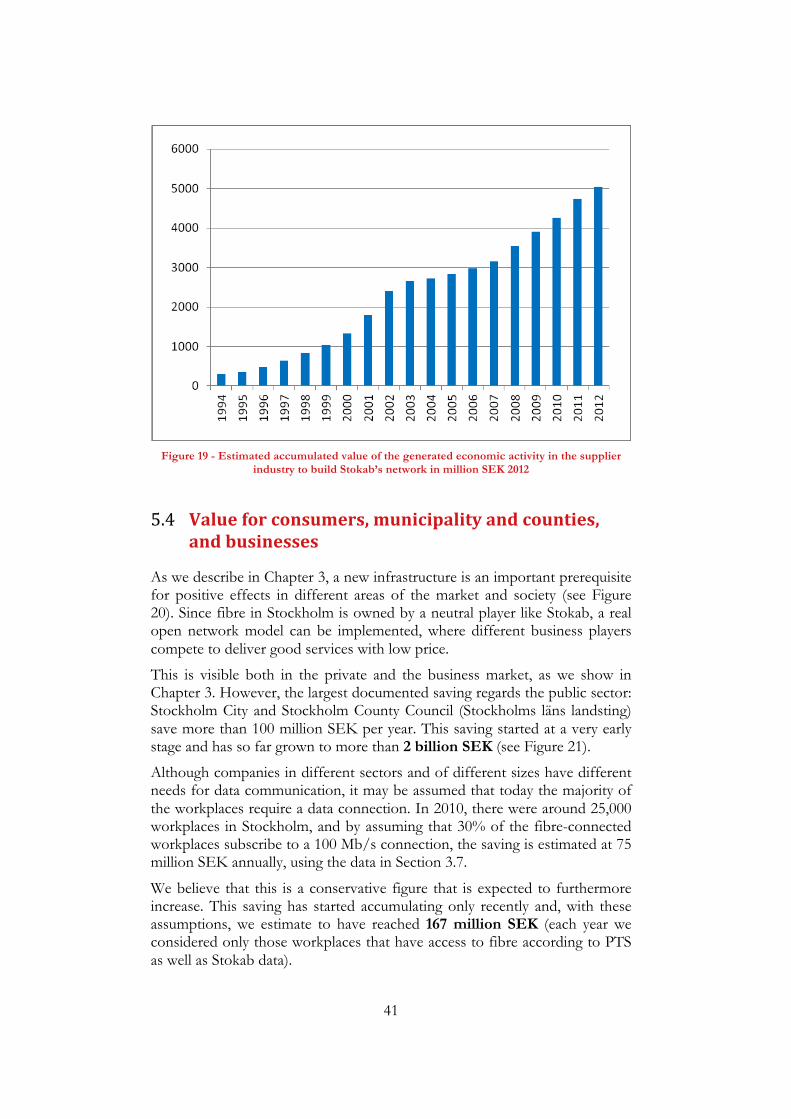
The first indirect effect of an infrastructure deployment is the supplier industry’s economic activity. In Stokab’s case, this applies to cable and equipment manufacturers, fibre installers, construction workers etc. We employ the Katz model which, through an extensive input-output analysis of the German broadband market, has calculated that one euro invested causes 0.93 euro in the economic activity during the same period. Considering Stokab’s annual investments, we can estimate that, until today, Stokab has generated an economic activity of over 5 billion SEK in the supplier industry (see Figure 19), which is more than four times larger than Stokab’s direct profit.
!
41
Figure 19 - Estimated accumulated value of the generated economic activity in the supplier
industry to build Stokab’s network in million SEK 2012
5.4 Value)for)consumers,)municipality)and)counties,)and)businesses)
As we describe in Chapter 3, a new infrastructure is an important prerequisite for positive effects in different areas of the market and society (see Figure 20). Since fibre in Stockholm is owned by a neutral player like Stokab, a real open network model can be implemented, where different business players compete to deliver good services with low price.
This is visible both in the private and the business market, as we show in Chapter 3. However, the largest documented saving regards the public sector: Stockholm City and Stockholm County Council (Stockholms läns landsting) save more than 100 million SEK per year. This saving started at a very early stage and has so far grown to more than 2 billion SEK (see Figure 21).
Although companies in different sectors and of different sizes have different needs for data communication, it may be assumed that today the majority of the workplaces require a data connection. In 2010, there were around 25,000 workplaces in Stockholm, and by assuming that 30% of the fibre-connected workplaces subscribe to a 100 Mb/s connection, the saving is estimated at 75 million SEK annually, using the data in Section 3.7.
We believe that this is a conservative figure that is expected to furthermore increase. This saving has started accumulating only recently and, with these assumptions, we estimate to have reached 167 million SEK (each year we considered only those workplaces that have access to fibre according to PTS as well as Stokab data).
!
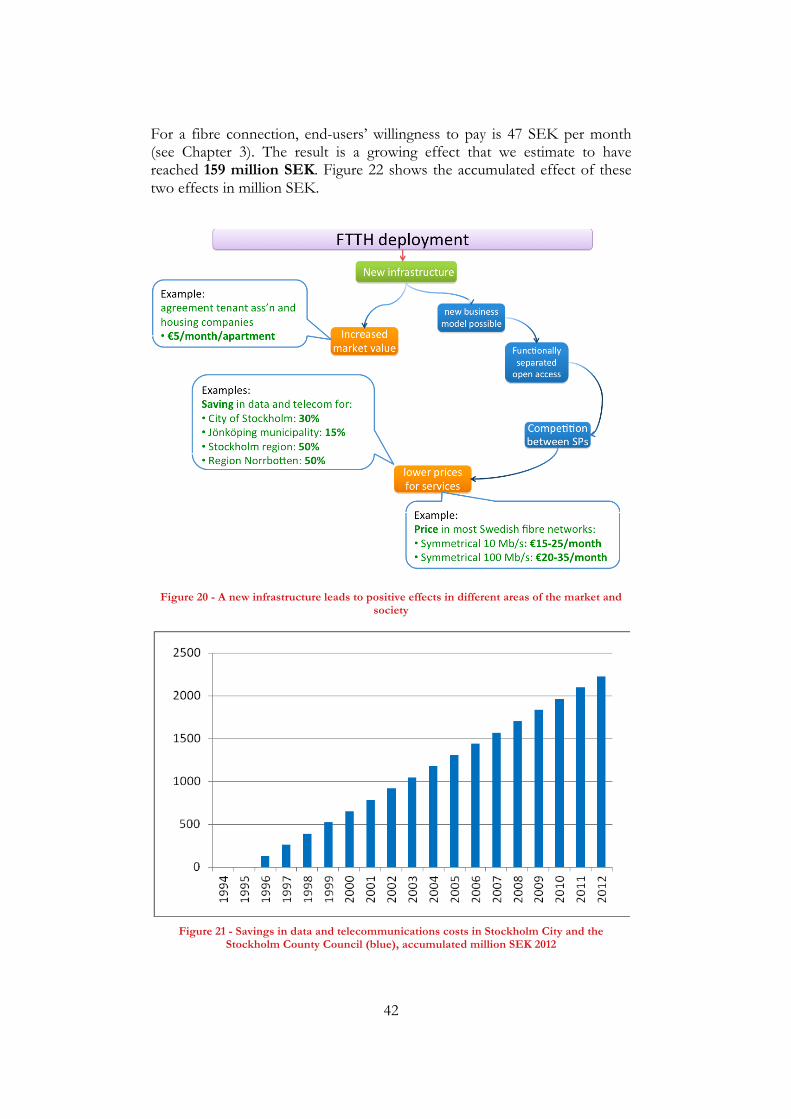
42
For a fibre connection, end-users’ willingness to pay is 47 SEK per month (see Chapter 3). The result is a growing effect that we estimate to have reached 159 million SEK. Figure 22 shows the accumulated effect of these two effects in million SEK.
)Figure 20 - A new infrastructure leads to positive effects in different areas of the market and
society
Figure 21 - Savings in data and telecommunications costs in Stockholm City and the
Stockholm County Council (blue), accumulated million SEK 2012
!
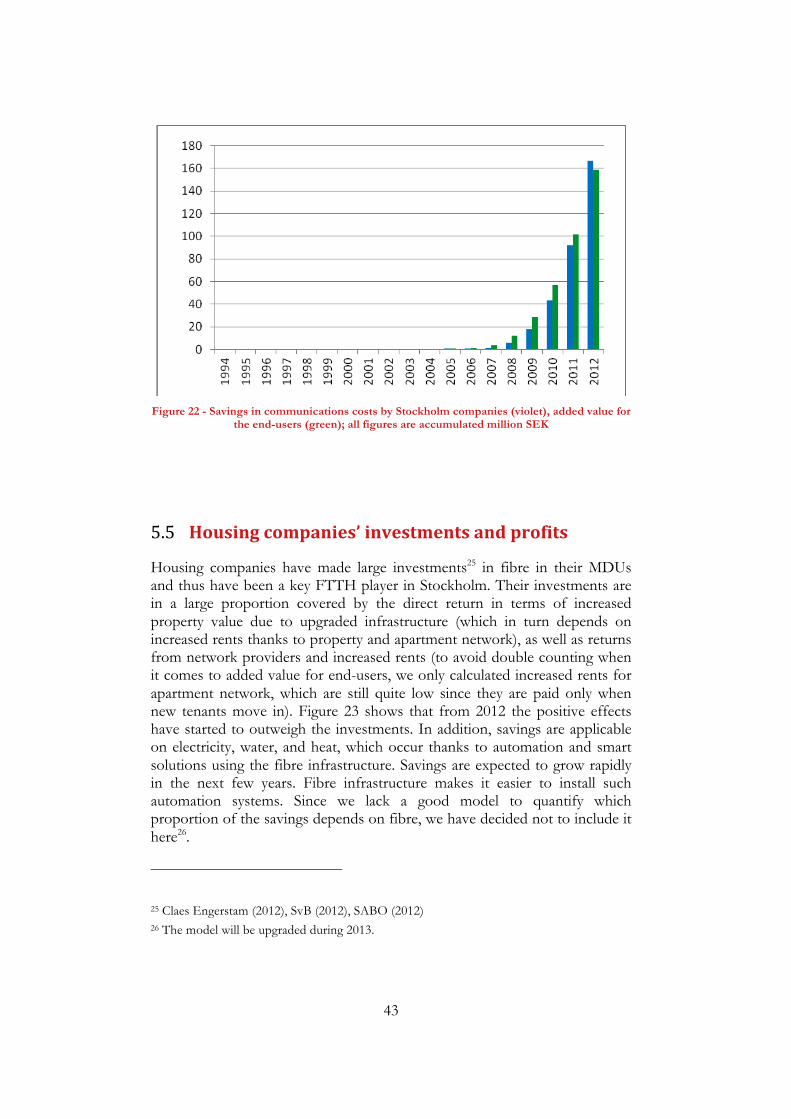
43
Figure 22 - Savings in communications costs by Stockholm companies (violet), added value for
the end-users (green); all figures are accumulated million SEK
5.5 Housing)companies’)investments)and)profits)
Housing companies have made large investments25 in fibre in their MDUs and thus have been a key FTTH player in Stockholm. Their investments are in a large proportion covered by the direct return in terms of increased property value due to upgraded infrastructure (which in turn depends on increased rents thanks to property and apartment network), as well as returns from network providers and increased rents (to avoid double counting when it comes to added value for end-users, we only calculated increased rents for apartment network, which are still quite low since they are paid only when new tenants move in). Figure 23 shows that from 2012 the positive effects have started to outweigh the investments. In addition, savings are applicable on electricity, water, and heat, which occur thanks to automation and smart solutions using the fibre infrastructure. Savings are expected to grow rapidly in the next few years. Fibre infrastructure makes it easier to install such automation systems. Since we lack a good model to quantify which proportion of the savings depends on fibre, we have decided not to include it here26.
25 Claes Engerstam (2012), SvB (2012), SABO (2012) 26 The model will be upgraded during 2013.
!
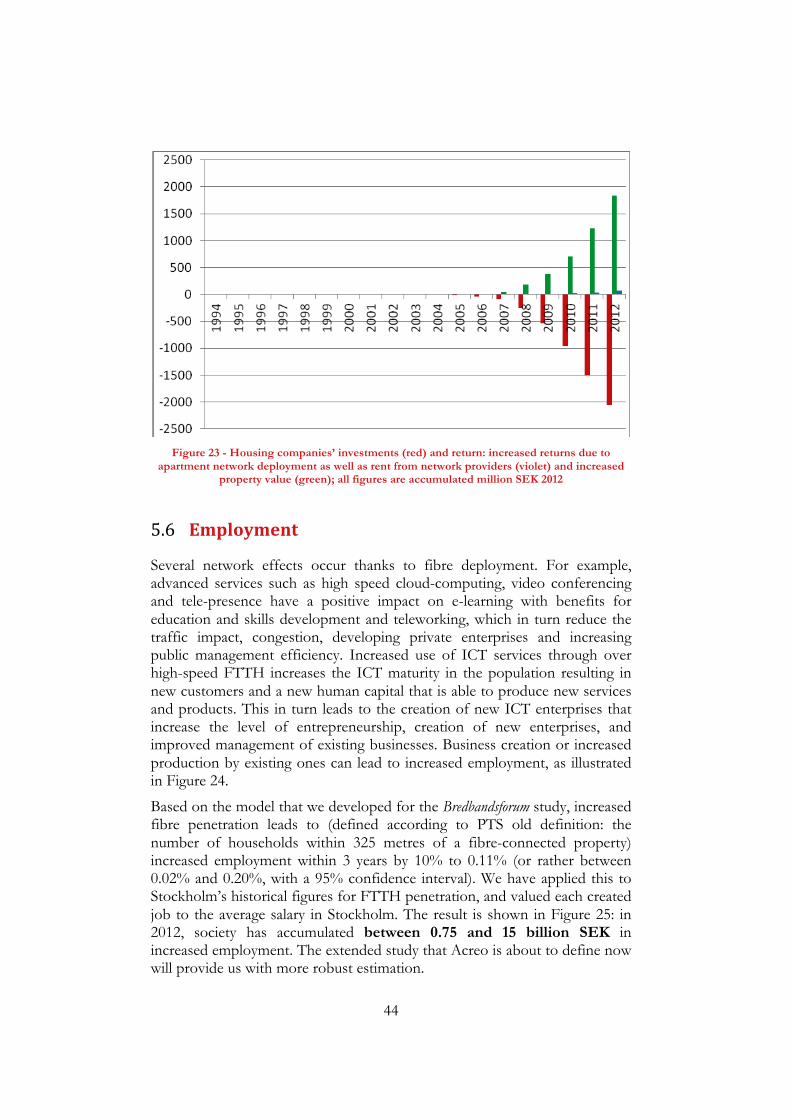
44
Figure 23 - Housing companies’ investments (red) and return: increased returns due to
apartment network deployment as well as rent from network providers (violet) and increased property value (green); all figures are accumulated million SEK 2012
5.6 Employment)
Several network effects occur thanks to fibre deployment. For example, advanced services such as high speed cloud-computing, video conferencing and tele-presence have a positive impact on e-learning with benefits for education and skills development and teleworking, which in turn reduce the traffic impact, congestion, developing private enterprises and increasing public management efficiency. Increased use of ICT services through over high-speed FTTH increases the ICT maturity in the population resulting in new customers and a new human capital that is able to produce new services and products. This in turn leads to the creation of new ICT enterprises that increase the level of entrepreneurship, creation of new enterprises, and improved management of existing businesses. Business creation or increased production by existing ones can lead to increased employment, as illustrated in Figure 24.
Based on the model that we developed for the Bredbandsforum study, increased fibre penetration leads to (defined according to PTS old definition: the number of households within 325 metres of a fibre-connected property) increased employment within 3 years by 10% to 0.11% (or rather between 0.02% and 0.20%, with a 95% confidence interval). We have applied this to Stockholm’s historical figures for FTTH penetration, and valued each created job to the average salary in Stockholm. The result is shown in Figure 25: in 2012, society has accumulated between 0.75 and 15 billion SEK in increased employment. The extended study that Acreo is about to define now will provide us with more robust estimation.
!

45
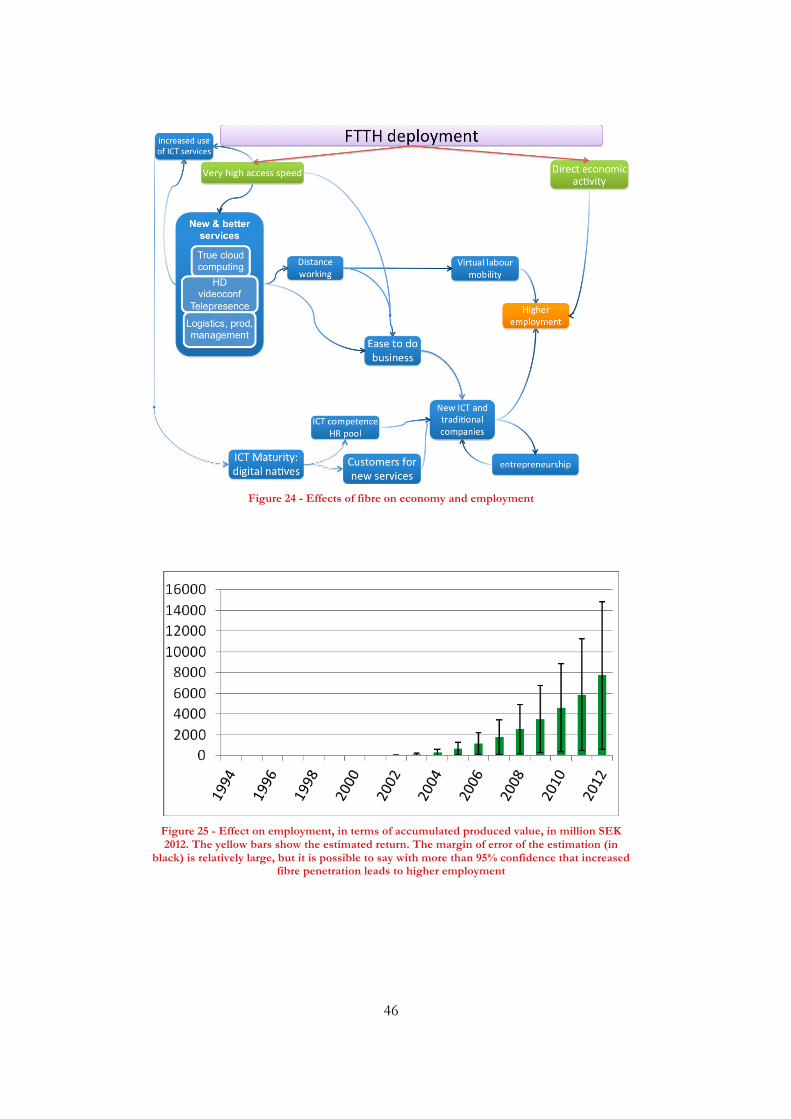
46
Figure 24 - Effects of fibre on economy and employment
Figure 25 - Effect on employment, in terms of accumulated produced value, in million SEK 2012. The yellow bars show the estimated return. The margin of error of the estimation (in
black) is relatively large, but it is possible to say with more than 95% confidence that increased fibre penetration leads to higher employment
!
!
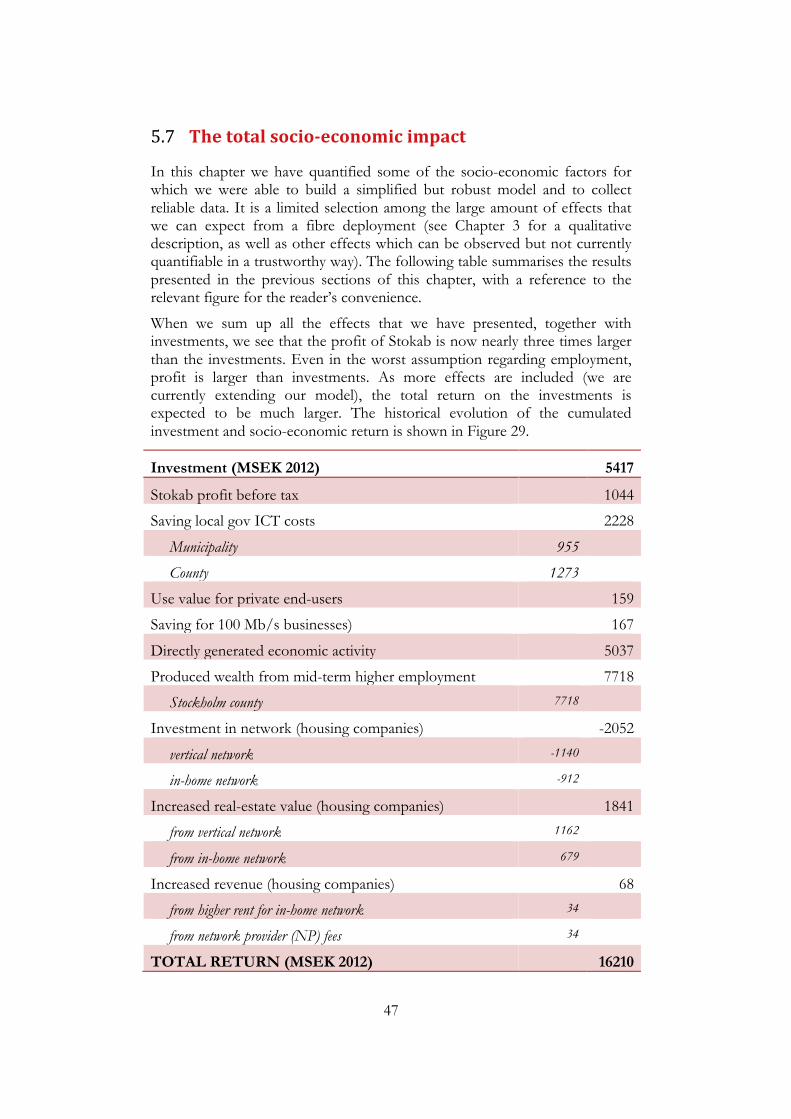
47
5.7 The)total)socioFeconomic)impact)
In this chapter we have quantified some of the socio-economic factors for which we were able to build a simplified but robust model and to collect reliable data. It is a limited selection among the large amount of effects that we can expect from a fibre deployment (see Chapter 3 for a qualitative description, as well as other effects which can be observed but not currently quantifiable in a trustworthy way). The following table summarises the results presented in the previous sections of this chapter, with a reference to the relevant figure for the reader’s convenience.
When we sum up all the effects that we have presented, together with investments, we see that the profit of Stokab is now nearly three times larger than the investments. Even in the worst assumption regarding employment, profit is larger than investments. As more effects are included (we are currently extending our model), the total return on the investments is expected to be much larger. The historical evolution of the cumulated investment and socio-economic return is shown in Figure 29.
Investment (MSEK 2012) 5417
Stokab profit before tax 1044
Saving local gov ICT costs 2228
Municipality 955
County 1273
Use value for private end-users 159
Saving for 100 Mb/s businesses) 167
Directly generated economic activity 5037
Produced wealth from mid-term higher employment 7718
Stockholm county 7718
Investment in network (housing companies) -2052
vertical network -1140
in-home network -912
Increased real-estate value (housing companies) 1841
from vertical network 1162
from in-home network 679
Increased revenue (housing companies) 68
from higher rent for in-home network 34
from network provider (NP) fees 34
TOTAL RETURN (MSEK 2012) 16210
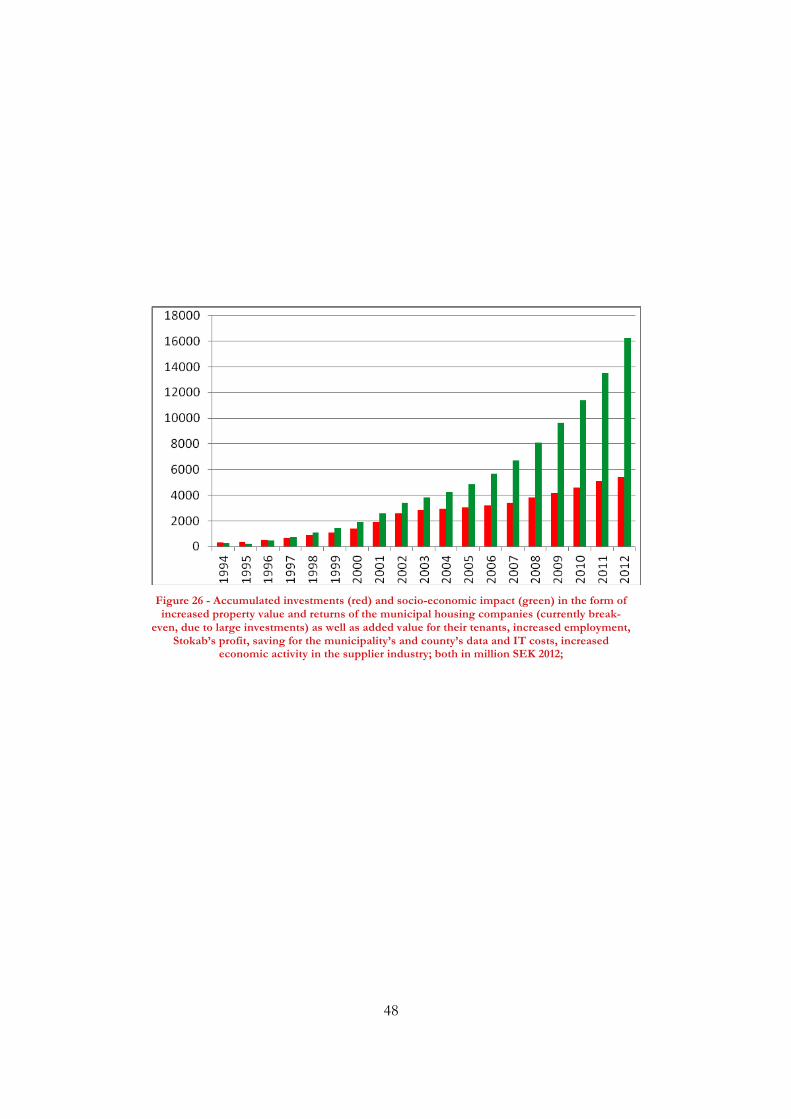
48
Figure 26 - Accumulated investments (red) and socio-economic impact (green) in the form of increased property value and returns of the municipal housing companies (currently break-
even, due to large investments) as well as added value for their tenants, increased employment, Stokab’s profit, saving for the municipality’s and county’s data and IT costs, increased
economic activity in the supplier industry; both in million SEK 2012;
!
!
49
References)
Arthur D Little (2010), Socioeconomic effects of broadband investments
Atkinson, RT, D. Castro and SJ Ezell (2009): “The Digital Road to Recovery: A Stimulus Plan to Create Jobs, Boost Productivity and Revitalize America,” The Information Technology & Innovation Foundation (ITIF), http://www.itif.org/files/roadtorecovery.pdf
BSL (Boligsellskaparnas landförening) (2012), interview med Bjarne Zetterström, Köpenhamn, december 2012
Børsen (2013), Fibernet er en mia-gevinst for samfundet, 22 januari 2013, http://borsen.dk/nyheder/avisen/artikel/11/39350/artikel.html?hl=ZmliZXJuZXQ7RmliZXJuZXQ
Brynjolfsson, E. and A. Saunders (2010): Wired for Information. How Information Technology is Reshaping the Economy, Cambridge, MA: The MIT Press.
CESifo (2009): “Investment in high speed Internet in the course of economic stimulus packages,” CESifo DICE Report 3/2009, 61-62,
Claes Engerstam (2012), f.d. bredbandssamordnare, telefoninterview, Nov. 2012
Connected Nation (2008), “The Economic Impact of Stimulating Broadband Nationally” http://www.connectednation.org/_documents/Connected_Nation_EIS_Study_Executive_Summary_02212008.pdf
Crandall, R. and C. Jackson (2001): “The $500 Billion Opportunity: The Potential Economic Benefit of Wide-spread Diffusion of Broadband Internet Access,” Criterion Economics, http://www.att.com/public_affairs/broadband_policy/BrookingsStudy.pdf
Crandall, R., W. Lehr and R. Litan (2007): “The Effects of Broadband Deployment on Output and Employment: A Cross-sectional Analysis of US Data,” The Brookings Institution: Issues in Economic Policy, Number 6, July 2007 www.brookings.edu/~/media/Files/rc/papers/2007/06labor_crandall/06labor_crandall.pdf
Czernich, N., O. Falk, T. Kretschmer and L. Woessmann (2009): „Broadband Infrastructure and Economic Growth,“ CESifo Working Paper
Deloitte (2010), Impact of Stokab – benchmarking study, december 2010
Dansk Energi (2012), interview med Christian Berg, Köpenhamn, Jan. 2013-01-31
Datta, A. and S. Agarwal (2004): “Telecommunications and economic
50
growth: a panel data approach,” Applied Economics, 36, 1649-1654.
Draca, M., R. Sadun and J. van Reenen (2007): “Productivity and ICTs: A review of the evidence,” in: Mansell, R., C. Avgerau, D. Quah and R. Silverstone (eds.), The Oxford Handbook of Information and Communication Technologies, Oxford University Press, 100-147.
EkoT (2011): email communication with Lars Hedberg, EkoT AB, September 2011
Felten B. (2012), Stockholm’s Stokab: A Blueprint for Ubiquitous Fiber Connectivity?, Diffraction Analysis, July 2012.
Fornefeld, M., G. Delaunay and D. Elixmann (2008), “The Impact of Broadband on Productivity and Growth,“ Micus Management Consulting (on behalf of the European Commission) http://ec.europa.eu/information_society/eeurope/i2010/docs/benchmarking/broadband_impact_2008.pdf
Forzati, M and Mattsson, C. (2011), Socio-economics return of ftth investment in sweden, a prestudy, Acreo report for Sveriges Bredbandsforum, 2011, available at https://www.acreo.se/sites/default/files/public/acreo.se/upload/publications/prestudy_socio-economic_return_of_ftth_0.pdf
Forzati, M, Mattsson, C., Aal E-Raza (2010a), S., Early effects of FTTH/FTTx on employment and population evolution, an analysis of the 2007-2010 time period in Sweden, proceedings of the 11th Conference of Telecommunication, Media and Internet Techno-Economics (CTTE), Athens, 2012.
Forzati, M., Larsen, CP, Mattson, C. (2010b), Open access networks, the Swedish experience (invited) , proceeding of International Conference on Transparent Optical Networks (ICTON), Munich, Germany.
Forzati, M. and Larsen, CP (2008), Broadband Access and its Impact on the Economy, a Swedish Perspective (invited) , proceeding of International Conference on Transparent Optical Networks (ICTON), paper Mo.B1.5, Athens, Greece.
Global Connect (2013), interview med Claus Bülow, Köpenhamn, jan 2013
Forzati, M and Mattsson, C. (2011), Socio-economics return of ftth investment in sweden, a prestudy, Acreo report for Sveriges Bredbandsforum, 2011, available at https://www.acreo.se/sites/default/files/public/acreo.se/upload/publications/prestudy_socio-economic_return_of_ftth_0.pdf
Katz, R. (2009): “The Impact of the Broadband Policy Framework on Jobs and the Economy,” The Parliament, 293, 2-3.
Katz, R., S. Vaterlaus, P. Zenhäusern, S. Suter and P. Mahler (2009): “The Impact of Broadband on Jobs and the German Economy,” http://www.elinoam.com/raulkatz/German_BB_2009.pdf
Koutroumpis, P. (2009): “Broadband Infrastructure and Economic Growth: A Simultaneous Approach,” Telecommunications Policy, 33(9), 471-485.
51
Kramer, R., Lopez, A., Koonen, T. (2006), Municipal broadband access networks in the Netherlands, three successful cases and how New Europe may benefit, AccessNets, Athens, Greece, September 2006.
LECG (2009): “Economic Impact of Broadband: An Empirical Study,” final report for Nokia Siemens Networks, http://www.connectivityscorecard.org/images/uploads/media/Report_BroadbandStudy_LECG_March6.pdf
Lehr, W., C. Osorio, S. Gillett, and MA Sirbu (2005): “Measuring Broadband’s Economic Impact” paper pre-pared for Telecommunications Policy Research Conference, Arlington, VA http://www.andrew.cmu.edu/user/sirbu/pubs/MeasuringBB_EconImpact.pdf
Liebenau, J., R. Atkinson, P. Kärrberg, D. Castro and S. Ezell (2009): “The UK’s Digital Road to Recovery, “ LSE / ITIF, April 2009, http://www.itif.org/files/digitalrecovery.pdf
Majumdar, S. (2008): “Broadband adoption, jobs and wages in the US telecommunications industry”, Telecommunications Policy, 32, 587-599
Micasa (2012), interview med Anders Nordstrand
OASE (2010): The FP7 Integrated Project ICT-OASE, Deliverable D5.2
OECD (2009): The Role of Communication Infrastructure Investment in Economic Recovery, http://www.oecd.org/dataoecd/4/43/42799709.pdf
Ovum (2009): Socio-economic Benefits of FTTH, Ovum draft report to the Market Intelligence Committee of the FTTH Council Europe, February 2009
Pociask, S. (2002): “Building a Nationwide Broadband Network: Speeding Job Growth,” TeleNomic Research, LLC, 29. Herndon, Virginia www.newmillenniumresearch.org/event-02-25-2002/jobspaper.pdf
Qiang, C. (2009): “Telecommunications and Economic Growth,” unpublished working paper, World Bank, Washington DC
Qiang, C. and C. Rossotto (2009): “Economic Impacts of Broadband,” in: World Bank Informations and Communications for Development 2009: Extending Reach and Increasing Impact, Washington, DC
Röller, LH and L. Waverman (2001): “Telecommunications Infrastructure and Economic Development: A Simultaneous Approach,” American Economic Review, 91(4), 909-923.
SABO (2012), interview med Anders Johansson, Nov. 2012
SCB (2012): Årsbok för Sveriges kommuner 2012, Statistiska centralbyrån
SOU (2004) "Liberalisering, regler och marknader", SOU 2004:5, samt partimotioner från m och fp - 1990/91:N34 respektive 1990/91:N33.
Stockholms Stad (2012): Fakta om företagandet i Stockholm 2012.
Stockholms Stad (2011): uttalande från Sten Nordin, Stockholms Stads
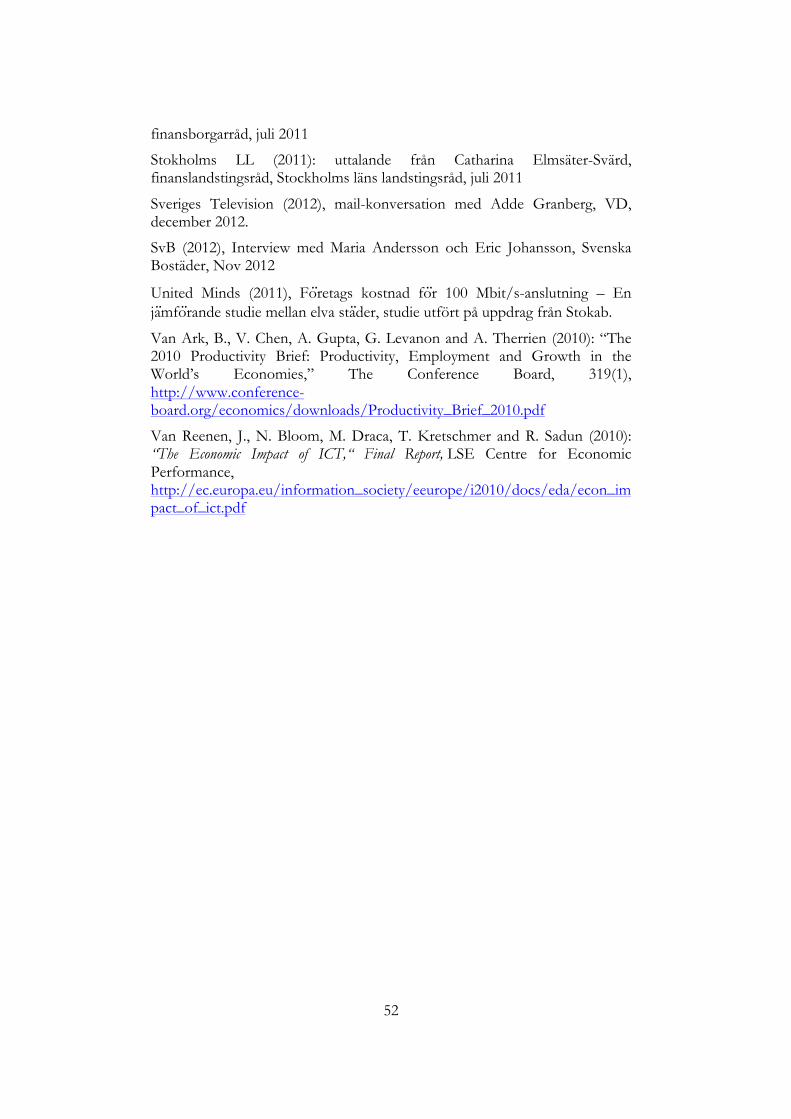
52
finansborgarråd, juli 2011
Stokholms LL (2011): uttalande från Catharina Elmsäter-Svärd, finanslandstingsråd, Stockholms läns landstingsråd, juli 2011
Sveriges Television (2012), mail-konversation med Adde Granberg, VD, december 2012.
SvB (2012), Interview med Maria Andersson och Eric Johansson, Svenska Bostäder, Nov 2012
United Minds (2011), Fo ̈retags kostnad fo ̈r 100 Mbit/s-anslutning – En ja ̈mfo ̈rande studie mellan elva sta ̈der, studie utfört på uppdrag från Stokab.
Van Ark, B., V. Chen, A. Gupta, G. Levanon and A. Therrien (2010): “The 2010 Productivity Brief: Productivity, Employment and Growth in the World’s Economies,” The Conference Board, 319(1), http://www.conference-board.org/economics/downloads/Productivity_Brief_2010.pdf
Van Reenen, J., N. Bloom, M. Draca, T. Kretschmer and R. Sadun (2010): “The Economic Impact of ICT,“ Final Report, LSE Centre for Economic Performance, http://ec.europa.eu/information_society/eeurope/i2010/docs/eda/econ_impact_of_ict.pdf
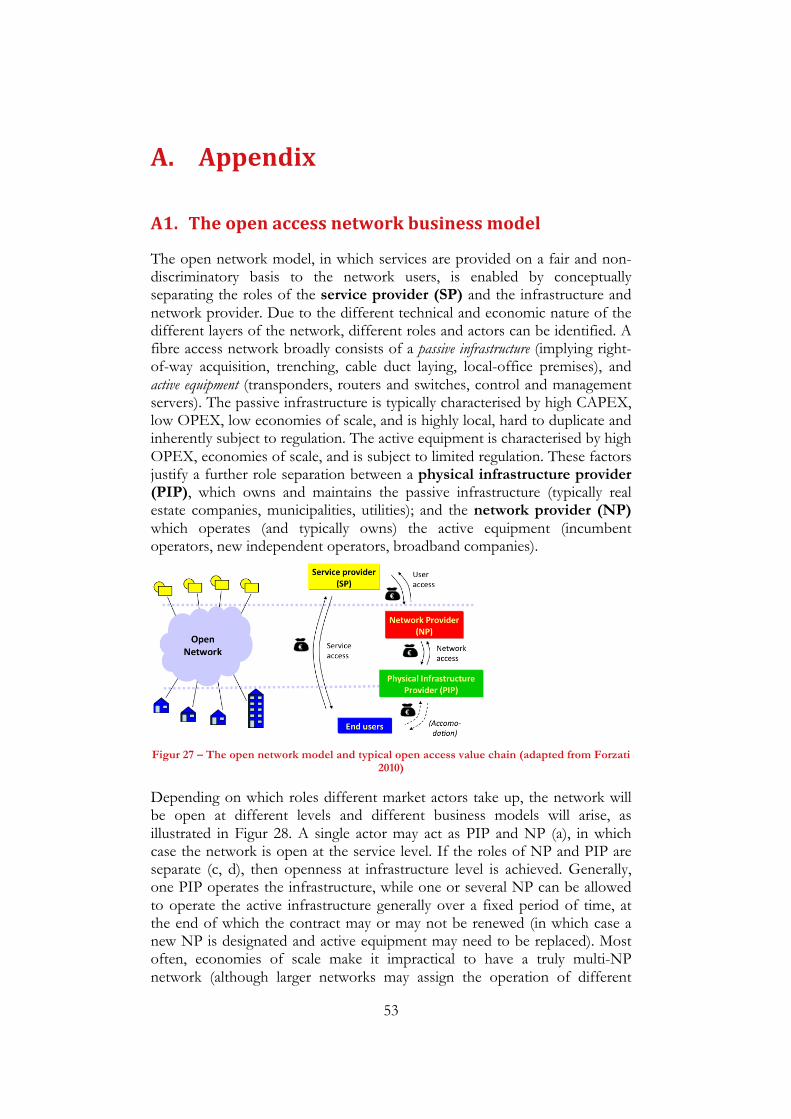
53
A. Appendix)
A1. The)open)access)network)business)model)
The open network model, in which services are provided on a fair and non-discriminatory basis to the network users, is enabled by conceptually separating the roles of the service provider (SP) and the infrastructure and network provider. Due to the different technical and economic nature of the different layers of the network, different roles and actors can be identified. A fibre access network broadly consists of a passive infrastructure (implying right-of-way acquisition, trenching, cable duct laying, local-office premises), and active equipment (transponders, routers and switches, control and management servers). The passive infrastructure is typically characterised by high CAPEX, low OPEX, low economies of scale, and is highly local, hard to duplicate and inherently subject to regulation. The active equipment is characterised by high OPEX, economies of scale, and is subject to limited regulation. These factors justify a further role separation between a physical infrastructure provider (PIP), which owns and maintains the passive infrastructure (typically real estate companies, municipalities, utilities); and the network provider (NP) which operates (and typically owns) the active equipment (incumbent operators, new independent operators, broadband companies).
Figur 27 – The open network model and typical open access value chain (adapted from Forzati
2010)
Depending on which roles different market actors take up, the network will be open at different levels and different business models will arise, as illustrated in Figur 28. A single actor may act as PIP and NP (a), in which case the network is open at the service level. If the roles of NP and PIP are separate (c, d), then openness at infrastructure level is achieved. Generally, one PIP operates the infrastructure, while one or several NP can be allowed to operate the active infrastructure generally over a fixed period of time, at the end of which the contract may or may not be renewed (in which case a new NP is designated and active equipment may need to be replaced). Most often, economies of scale make it impractical to have a truly multi-NP network (although larger networks may assign the operation of different
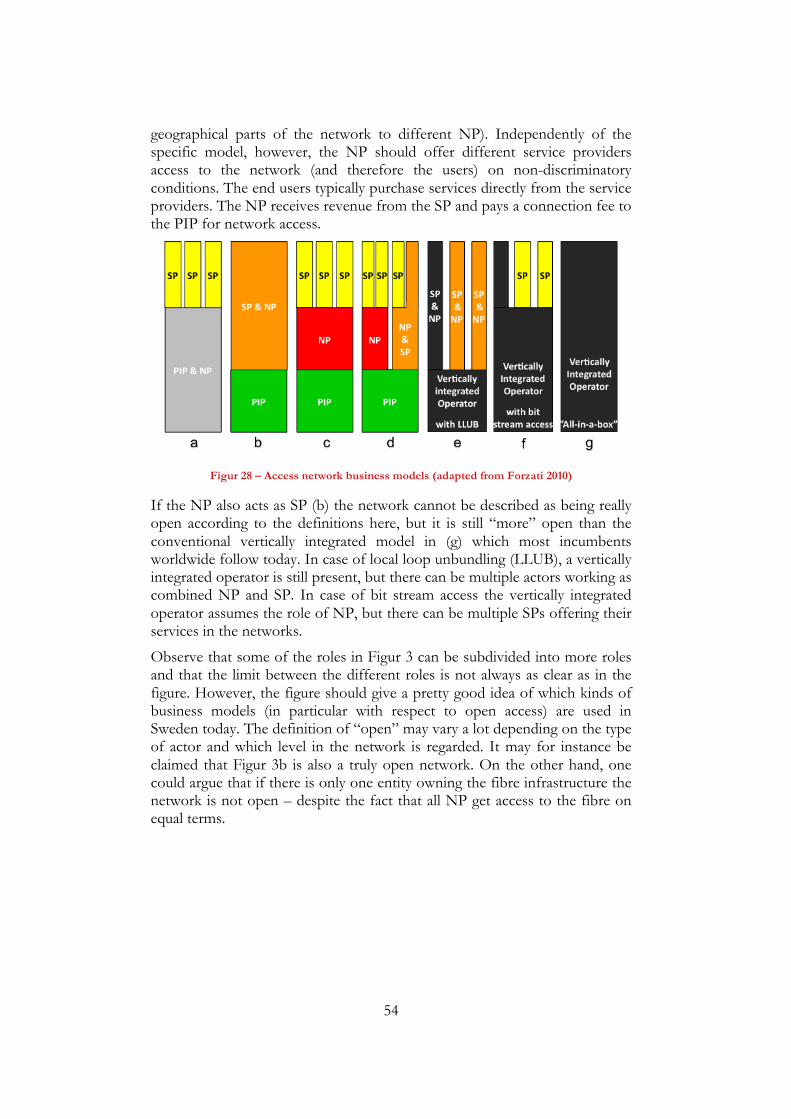
54
geographical parts of the network to different NP). Independently of the specific model, however, the NP should offer different service providers access to the network (and therefore the users) on non-discriminatory conditions. The end users typically purchase services directly from the service providers. The NP receives revenue from the SP and pays a connection fee to the PIP for network access.
Figur 28 – Access network business models (adapted from Forzati 2010)
If the NP also acts as SP (b) the network cannot be described as being really open according to the definitions here, but it is still “more” open than the conventional vertically integrated model in (g) which most incumbents worldwide follow today. In case of local loop unbundling (LLUB), a vertically integrated operator is still present, but there can be multiple actors working as combined NP and SP. In case of bit stream access the vertically integrated operator assumes the role of NP, but there can be multiple SPs offering their services in the networks.
Observe that some of the roles in Figur 3 can be subdivided into more roles and that the limit between the different roles is not always as clear as in the figure. However, the figure should give a pretty good idea of which kinds of business models (in particular with respect to open access) are used in Sweden today. The definition of “open” may vary a lot depending on the type of actor and which level in the network is regarded. It may for instance be claimed that Figur 3b is also a truly open network. On the other hand, one could argue that if there is only one entity owning the fibre infrastructure the network is not open – despite the fact that all NP get access to the fibre on equal terms.
55
A2. Fibre)deployment)effects:)the)uncaptured)values))
The benefits related to FTTH deployment can be roughly divided into direct, indirect and induced benefits. Many of these benefits are dependent on and related to each other, sometimes in a circular fashion. In this section we identify different effects starting from the direct ones and describing how this lead to medium- and long-term (indirect) effects on the FTTH market as well as the changes induced on the economy and the society. Figure 29 can work as a useful illustration of the different effects, and their mutual dependencies.
Direct effects – The direct effects of FTTH deployment are (i) significantly higher access speeds, (ii) the availability of a new, future-proof infrastructure, and (iii) the direct economic activity generated by the network deployment (civil works, fibre cables and active equipment). These are benefits available immediately during or at completion of the deployment.
Indirect effects – Higher access speed in turn allows for new and/or better-quality services as mentioned in the introduction, and typically leads to a higher use of these services. It is worthwhile to comment that some of these services (especially video-based ones, and others not yet envisaged) will only work on fibre connections. Many others will also work over traditional broadband connections, but may end up saturating the available bandwidth rapidly when more than one of them are provided simultaneously. Moreover, bandwidth-hungry services will in general be more reliable and offer better quality over a fibre connection.
Figure 29 - Direct, indirect, and induced effects of FTTH deployment
!"#$%&'%()*'%))+,)-./)'%$0!#%')
.+12%33+")4%56%%")78')
$%(*#%(),+$#%()1!9$&3+")
-./)#+12%5%"#%):;)2++<)
=&'%)5+)(+)4*'!"%'')
>//:)(%2<+?1%"5)
@%$?)A!9A)&##%'')'2%%() B%6)!",$&'5$*#5*$%) C!$%#5)%#+"+1!#)!5?)
/$*%)#<+*()#+12*3"9)
:C)&"()DC)/@)@+C)
@!(%+#+",)/%<%2$%'%"#%)
=EA%&<5A)
=E9+0%$"1%"5)
F+9!'3#'G)2$+(G)1&"&9%1%"5)
7%"'+$)"%56+$H')
C%1+#$&#?)'5$%"95A%"%()
5$&"'2&$%"#?))!")8I)
%J#!%"#?)!")8I)
C!'5&"#%)6+$H!"9)
$%(*#%()5$&J#)#+"9%'3+")
B%56+$H)9&1!"9)
C%0K)+,)"%6)5%#A"+<+9!%')
.*'5+1%$'),+$))"%6)'%$0!#%')
#+$$*23+")(!'#+*$&9%()
<+6%$)2*4<)'2%"(!"9)A!9A%$)5&L)$%0%"*%)
2$+(*#30!5?)
<%&$"!"9)#*$0%')
<+6%$)2$!#%'),+$)'%$0!#%')
<+6%$)%"5$?)4&$$!%$')
<+6)*2,$+"5)!"0%'51%"5),+$)B8)&"()78)
>*"#3+"&<)'%2&$&3+")
"%6)4*'!"%'')1+(%<)2+''!4<%)
A!9A%$)%12<+?1%"5)
@!$5*&<)<&4+*$)1+4!<!5?)
%"5$%2$%"%*$'A!2)
%E<%&$"!"9)
8$+M5&4!<!5?)+,)B8)&"()78)
8$+M5&4!<!5?)N,)8-8)
;+O)$%0%"*%')
$%(*#%()"0!$+"1%"5)!12)
PC8)
<+6%$)4*$(%")+,)4*$%&*#$&#?)
8%$#%!0%()Q*&<!5?)+,)<!,%)
@!(%+)'*$0%!<<&"#%)
8+6%$)9$!()%J#!%"#?)
B%6)-./)&"()5$&(!3+"&<)#+12&"!%')
!"#$%"&"'(()"'*+,")(
=(*#&3+")Q*&<!5?)&"()#+'5)
-./)R&5*$!5?S)(!9!5&<)"&30%')
-"#$%&'%()1&$H%5)0&<*%)
56
The widespread availability of fibre connections and high transmission speeds is also a powerful enabler of sensor networks, driving the deployment or improvement of such services as video surveillance, smart power grid, traffic congestion management, accident prevention through monitoring of buildings and utility infrastructure. Again, most of these services would work over existing copper infrastructure, but the aggregate bandwidth of numerous and increasingly data-intense services will be best met by fibre access.
Finally FTTH represent a future-proof infrastructure, because the optical fibre is a transmission medium that, for its inherent physical properties, offers orders-of-magnitude higher bandwidth and lower signal loss, when compared to radio- and microwave-frequency technologies. Therefore, deploying FTTH represents an investment leading to higher property value. Moreover, installing a new infrastructure offers the opportunity to more easily depart from the traditional business model and to fix market failures difficult to deal with in the presence of formalised ownerships, long-term contracts and established privileges. Seizing this opportunity is to a great degree a matter for regulators and public policy makers.
Induced effects – The direct and indirect effects of FTTH in turn have positive consequences in other areas than ICT. For instance services like high-quality cloud computing, video-conferencing and tele-presence have a positive impact on e-learning (with benefits on education and competence development) and distance working, which in turn reduces traffic congestion, increases virtual labour mobility, and reduces the cost of doing business. Reliable and high-quality e-health services reduce the need for expensive hospitalisation and home visits; while e-government services increase efficiency and transparency in public administration, which in turn strengthens democracy, increases transparency and decreases corruption and the burden of bureaucracy. Widespread use of advanced ICT services brought about by FTTH increases ICT maturity of the population, which creates both new potential customers of, and new human capital for the production of new services and products. This in turns leads to the creation of new ICT companies, which in turn increases the level of entrepreneurship, favouring the creation of more companies, or the improved management of existing ones.
Also, putting in place the correct business model induces other benefits back on the ICT sector: if network and service providers are freed from the heavy upfront investments required to deploy the passive, they can scale investments with the number of users served, and therefore achieve profitability in the short-medium term. This, together with the availability of end users with very high access speeds will allow the provision of bandwidth-hungry, but profitable services like HDTV, 3D TV, Video-on-Demand (VoD). Those profits will then propagate down the value chain to the NP and the PIP. At the same time, the separation of NP and SP introduces competition between SPs, which is expected to lead to lower prices for ICT services.
57
A key step in order to develop a business model, in which the uncaptured values of FTTH are internalised in the value chain, is to identify the key stakeholders and how they benefit from the direct, indirect and induced effects described in the section above.
Benefits for the individuals – Individuals benefit from FTTH in terms of improved perceived quality of life, both directly connected to new high-quality services at lower prices (especially entertainment and communications) but also indirectly in terms of improved individual health conditions, decreased hospitalisation, smoother and more transparent interaction with public administrations, increased sense safety in traffic and security in public space (see Figure 29). Higher perceived quality of life is also determined by the opportunity to work away from the desk more flexibly, and even to choose more freely where to live and work.
Benefits for housing companies and homeowners – Better building and infrastructure monitoring and housing management systems lead to decreased housing maintenance and insurance costs. If acting as a housing company may collect revenue from the NP, as well as other operators (e.g. 3G and 4G mobile operators placing their antennas on the building roof and renting fibre to transport the aggregate traffic). Moreover, the presence of a future-proof infrastructure increases the value of property for the housing company and the homeowners.
Benefits for media and service providers, and alternative operators – The FTTH infrastructure represents an efficient distribution channel for content, at the same time reducing the need for costly distribution network of the physical support, and introducing useful direct marketing and market analysis tools. Service providers will have access to a large number of potential customers of new bandwidth-hungry and profitable services. If functional separation is used, alternative operators can operate networks as NP, without having to face big deployment investments. They get revenue from SP, as well as other operators buying transmission capacity.
Benefits for telecommunication operators (telcos) – Telcos can benefit in different ways from FTTH, largely depending on which business role they decide to take. As SP they can benefit from the availability of very high-speed connections, allowing them to sell bandwidth-hungry services with high added value for the end users, and therefore increase their teke-up rate and possibly ARPU. Today these services consist almost exclusively of video-based services (HDTV, movie rental, and shortly 3D TV), but there is no reason to doubt that new profitable services will appear once large-scale ultra-high-speed access is there. As NP they can increase the attractiveness of their networks (through higher connection speeds) for end users and service providers and consequently increase take-up rate (more end users) and ARPU (more service providers per user).
Benefits for companies in general – Network equipment vendors and civil works firms, will benefit directly from massive fibre deployment, and will also climb the learning curve, therefore gaining longer-term competitive advantages over companies located farther away from the countries/regions
58
where the deployment takes place. In the medium-term, high transmission speed and increased ICT maturity should lead to improved productivity for the activities directly related to data transmission, but also through new services and products to manage logistics, production and operation. Tele-presence will not only decrease transport, lodging and allowance costs, but also employee stress (and hence increase productivity), and possible carbon-emission cost in terms of carbon permits or carbon tax. Also, access to reliable high-speed connections can lead to the access for employers to a larger pool of qualified (and/or cheap) labour, through distance-working and outsourcing. Symmetrically, fibre-enabled high access speed leads to the extension of market areas for goods and services (think of the Indian software outsourcing industry). In the long term, companies will benefit from increased education and ICT competence and entrepreneurship. More in general, new companies or new product offerings will appear that will capitalise on the new possibilities offered by the fibre infrastructure, and its induced effects in the society.
Benefits for public administrations – The local public authorities will benefit in the short-medium term from right-of-way fees from network providers, and from revenues from NP if they act as a PIP for the municipal network. In the medium-long term, public administrations will benefit from a number of induced effects, most notably increased efficiency and cost reductions connected to e.g. e-government and e-health. This is especially crucial in the developed world, where ageing population will lead to dramatic changes in society if no measures are taken to counteract the economic consequences related to the care of the elders. Fibre will provide the very high quality access connections to allow for a major rollout of electronic health services such as distant care & treatment, equipment in the home, prolonged staying, better supervision, etc, which is probably the only way of keeping the costs at a reasonable level. At local level, public utilities can increase the efficiency of their power grids; while distance working and increased traffic information collection and processing will reduce traffic congestion and cost for road maintenance and upgrade. Also, fibre will increase the economic attractiveness of rural municipalities, and lead to the establishment (or the decision to stay) of more companies, which will counter emigration with positive effects in terms of social cohesion and tax revenues. At national and international level, this will determine a more efficient labour market (virtual labour mobility: jobs more easily move where the people and skills are), especially in places with traditionally low mobility like Continental Europe. Finally, all the increased economic activity described above will result in higher employment and GDP, and therefore to increased tax revenue and reduced welfare expenditures.
Benefits for society at large and the environment – Social networking leads to contacts with people not necessarily in the immediate vicinity and with the leading to cultural and social exchange. Increased ICT maturity and education are positive societal development, and e-government is believed to benefit democracy, voting transparency and legitimacy. E-health services also lead to improved general health, and a better society inclusion of

59
disadvantaged people. Other benefits are increased safety in traffic and security in public space. Reduced environmental impact arises from e.g. reduced traffic congestion, reduced need for physical transport and travel, and increased power grid efficiency. The lessening of “economically forced” migration from rural areas to large cities also a positive social impact in that the social fabric of regions is not disrupted.
!

www.acreo.se