
Stocks & Flows - University of Saskatchewan · State Changes: Flows (“Fluxes”, “Rates”,...
48
Transcript of Stocks & Flows - University of Saskatchewan · State Changes: Flows (“Fluxes”, “Rates”,...
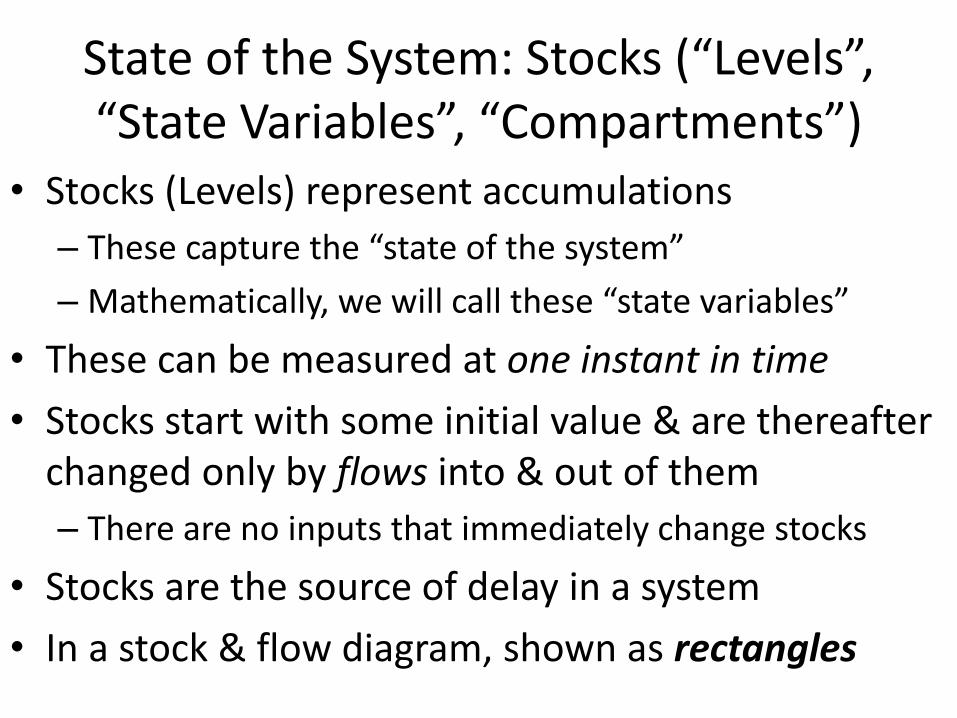
State of the System: Stocks (“Levels”, “State Variables”, “Compartments”)
• Stocks (Levels) represent accumulations
– These capture the “state of the system”
– Mathematically, we will call these “state variables”
• These can be measured at one instant in time
• Stocks start with some initial value & are thereafter changed only by flows into & out of them
– There are no inputs that immediately change stocks
• Stocks are the source of delay in a system
• In a stock & flow diagram, shown as rectangles
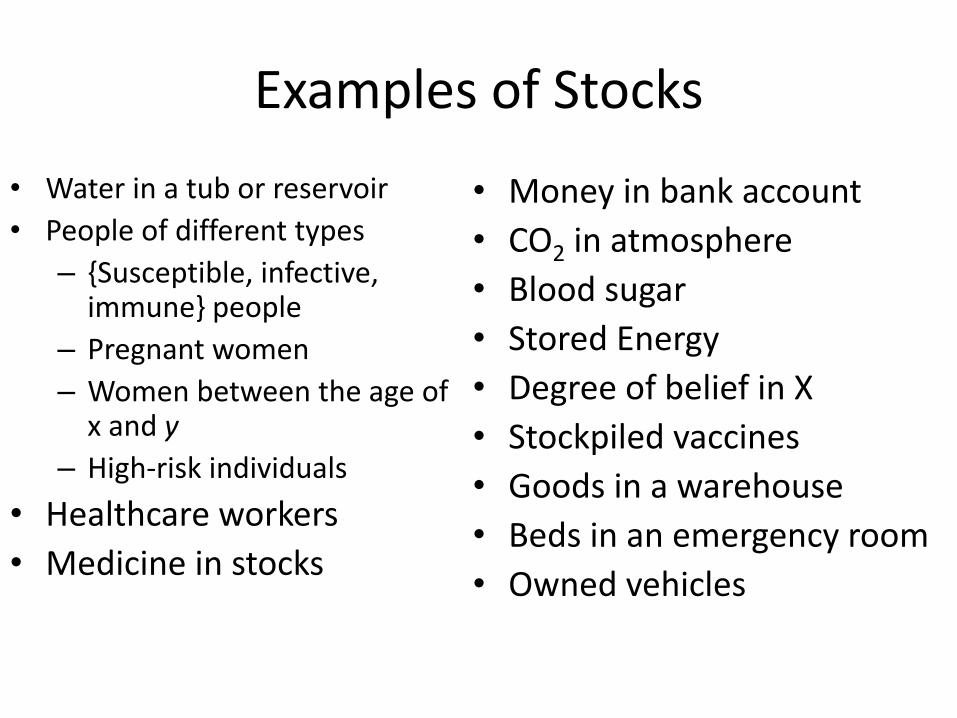
Examples of Stocks
• Water in a tub or reservoir
• People of different types
– {Susceptible, infective, immune} people
– Pregnant women
– Women between the age of x and y
– High-risk individuals
• Healthcare workers
• Medicine in stocks
• Money in bank account
• CO2 in atmosphere
• Blood sugar
• Stored Energy
• Degree of belief in X
• Stockpiled vaccines
• Goods in a warehouse
• Beds in an emergency room
• Owned vehicles
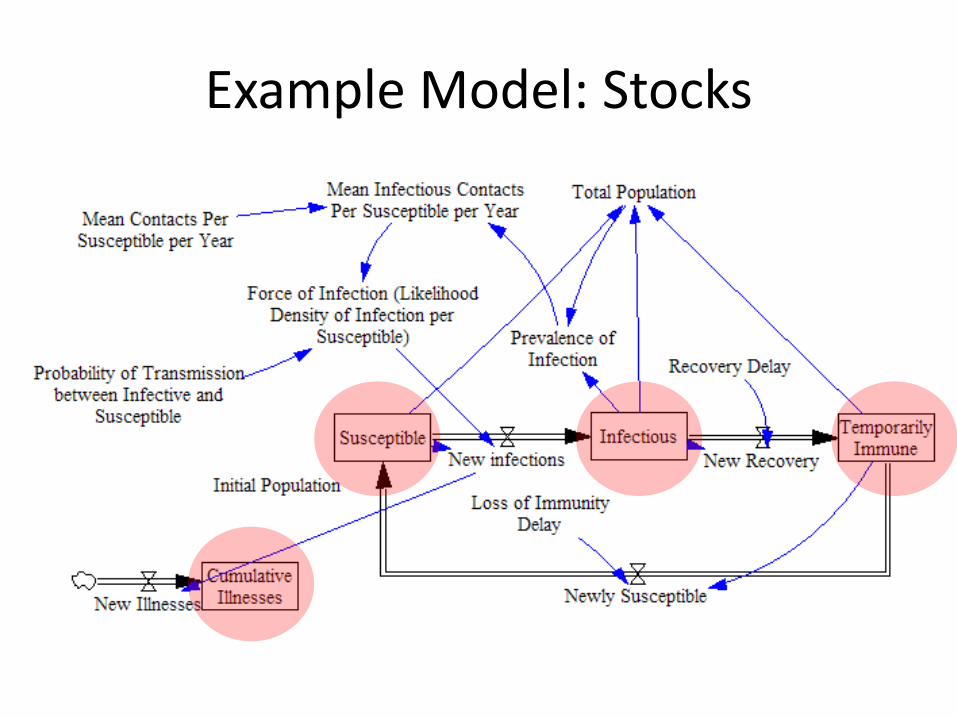
Example Model: Stocks
The Critical Role of Stocks in Dynamics
• Stocks determine current state of system
– Stocks often provide the basis for making choices
• Stocks central to most disequilibria phenomena (buildup, decay)
• Lead to inertia
• Give rise to delays

State Changes: Flows (“Fluxes”, “Rates”, “Derivatives”) • All changes to stocks occur via flows
• Always expressed per some unit time: If these flow into/out of a stock that keeps track of things of type X (e.g. persons), the rates are measured in X/(Time Unit) (e.g. persons/year, $/month, gallons/second)
• Typically measure over certain period of time (by considering accumulated quantity over a period of time) – e.g. Incidence Rates is calculated by accumulating
people over a year, revenue is $/Time, water flow is litres/minute
– Can be estimated for any point in time
Examples of Flows • Inflow or outflow of a
bathtub (litres/minute)
• Rate of incident cases (e.g. people/month)
• Rate of recovery
• Rate of mortality (e.g. people/year)
• Rate of births (e.g. babies/year)
• Rate of treatment (people/day)
• Rate of caloric consumption (kcal/day)
• Rate of pregnancies (pregnancies/month)
• Reactivation Rate (# of TB cases reactivating per unit time)
• Revenue ($/month)
• Spending rate ($/month)
• Power (Watts)
• Rate of energy expenditure
• Vehicle sales
• Vaccine sales
• Shipping rate of goods

Example Model: Flows
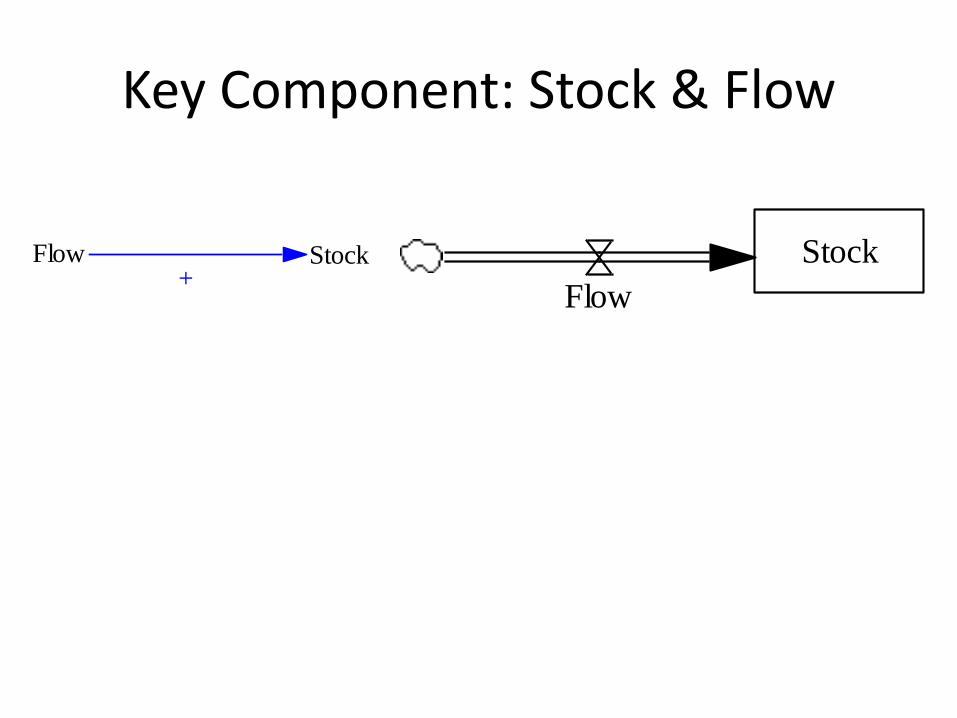
Key Component: Stock & Flow
StockFlow
+Stock
Flow
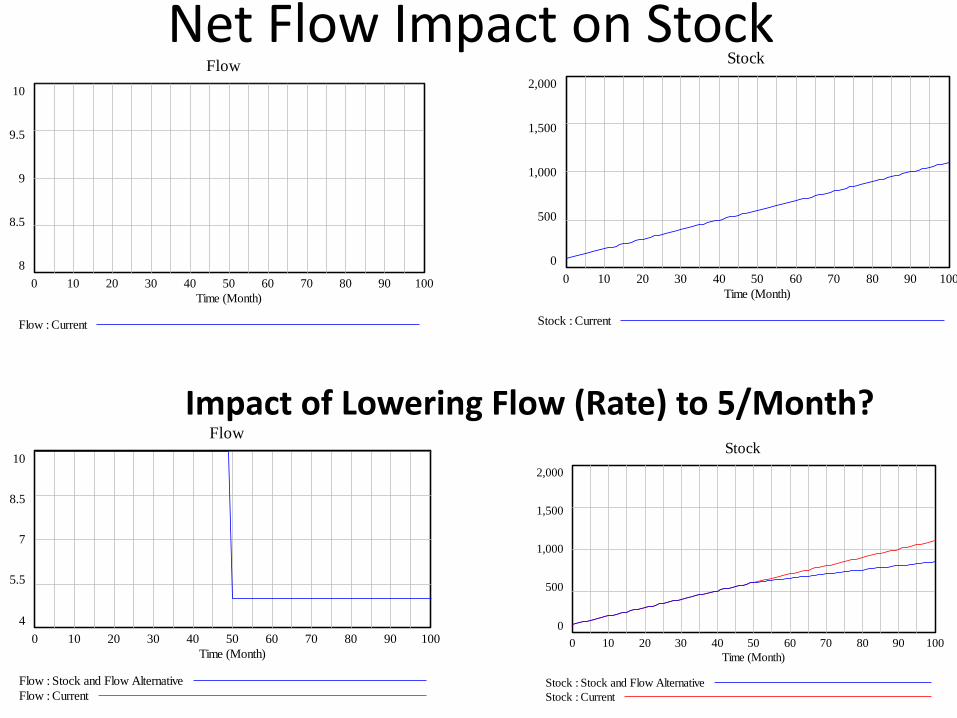
Net Flow Impact on Stock
Stock
2,000
1,500
1,000
500
0
0 10 20 30 40 50 60 70 80 90 100
Time (Month)
Stock : Current
Flow
10
9.5
9
8.5
8
0 10 20 30 40 50 60 70 80 90 100
Time (Month)
Flow : Current
Stock
2,000
1,500
1,000
500
0
0 10 20 30 40 50 60 70 80 90 100
Time (Month)
Stock : Stock and Flow Alternative
Stock : Current
Flow
10
8.5
7
5.5
4
0 10 20 30 40 50 60 70 80 90 100
Time (Month)
Flow : Stock and Flow Alternative
Flow : Current
Impact of Lowering Flow (Rate) to 5/Month?

Loops & Stocks • Causation does not effect big change
instantaneously
– Loops are not instantaneous
• Stocks only change by changes to the flows into & out of them
– There are no inputs that immediately change stocks
• All causal loops must involve at least one stock
– The state of the world must change as part of the process
– Absent a stock, loop would be instantaneous

Slides Adapted from External Source Redacted from Public PDF for Copyright
Reasons
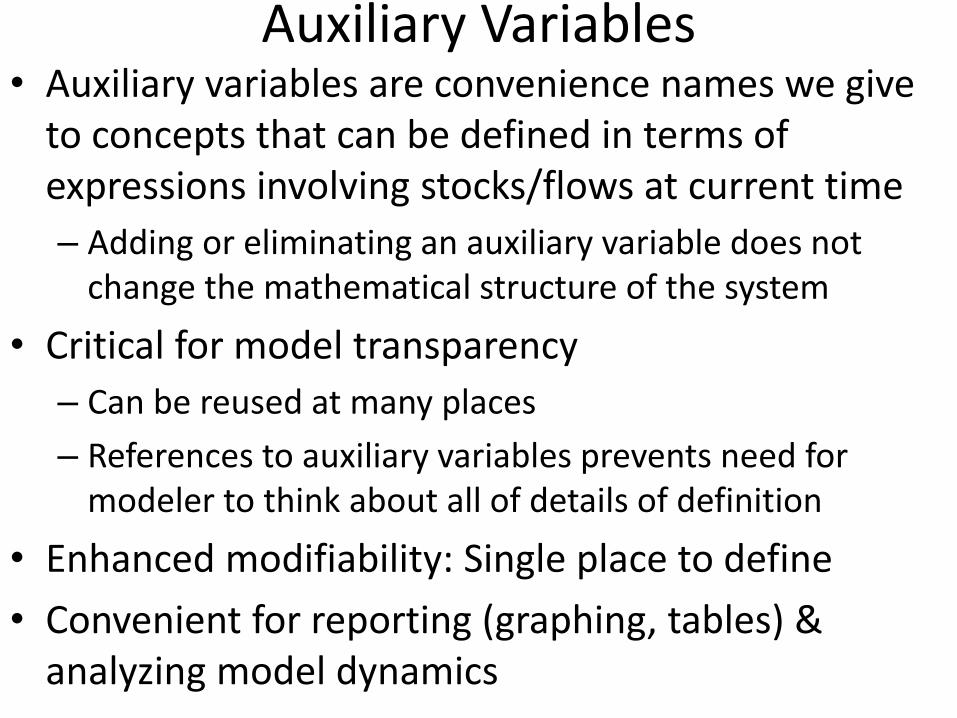
Auxiliary Variables • Auxiliary variables are convenience names we give
to concepts that can be defined in terms of expressions involving stocks/flows at current time
– Adding or eliminating an auxiliary variable does not change the mathematical structure of the system
• Critical for model transparency
– Can be reused at many places
– References to auxiliary variables prevents need for modeler to think about all of details of definition
• Enhanced modifiability: Single place to define
• Convenient for reporting (graphing, tables) & analyzing model dynamics
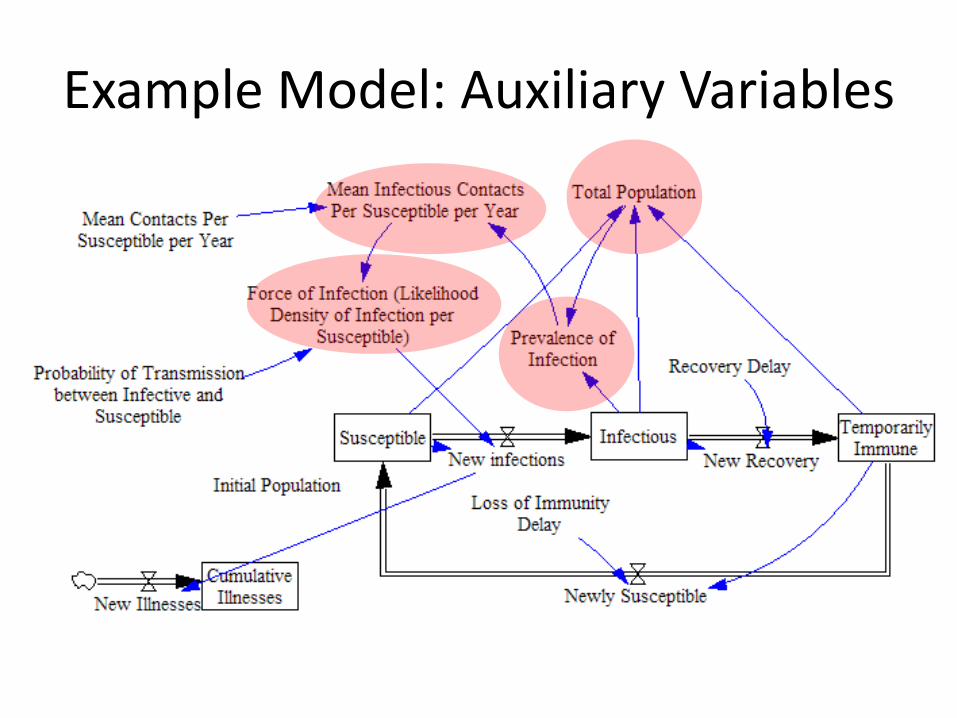
Example Model: Auxiliary Variables

Constants & Time Series Parameters
• For similar reasons to auxiliary variables, we give names to
– Model constants
– Time series
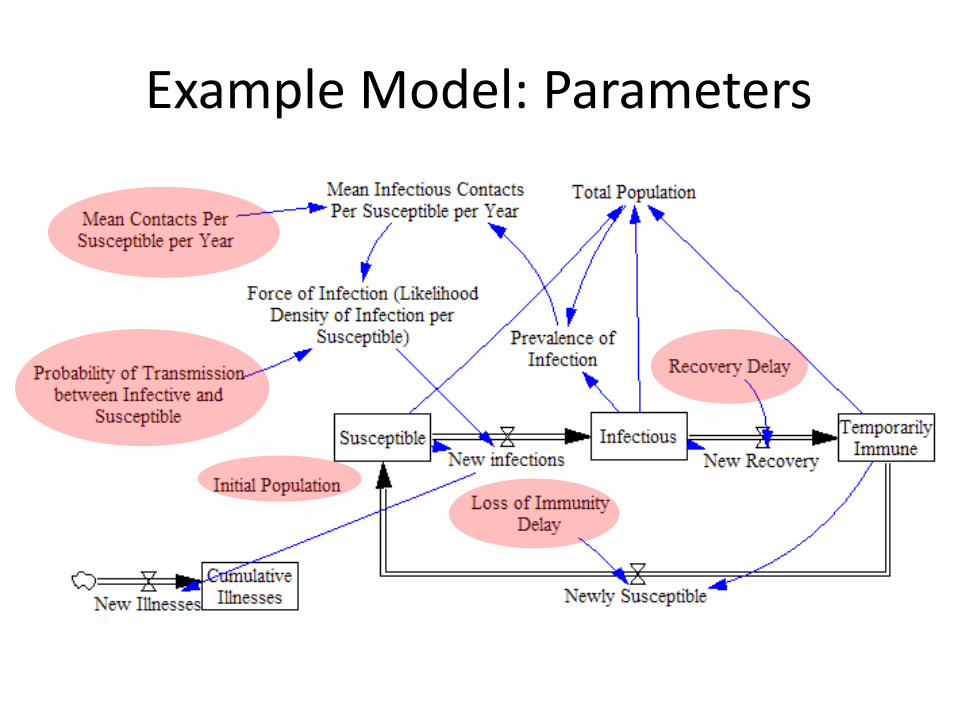
Example Model: Parameters
Stocks & Flows Compared with Markov Models
• Open population – Births
– Deaths
• Non-constant likelihood (density) of transitions – Likelihood of leaving a stock per unit time can depend on
other stocks • Force of Infection (likelihood of susceptible becoming infected)
can depend on prevalence of illness
• Likelihood of initiating smoking could depend on accumulated current or former smokers
• Multiple types of stocks – e.g. costs, QALYs, hosts & reservoir species, etc.
• Continuous time
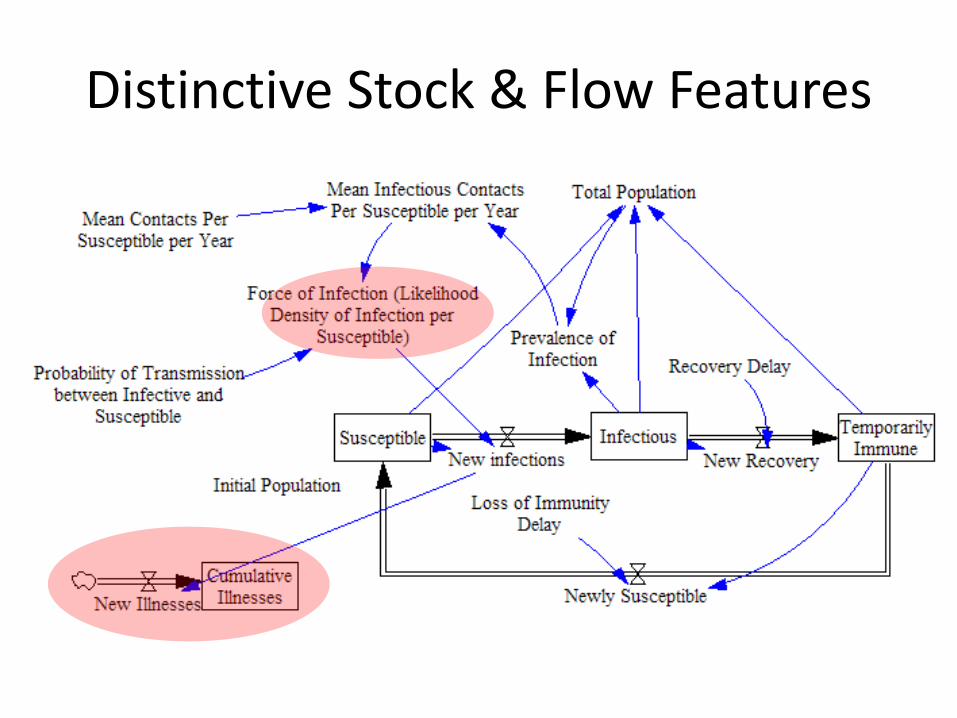
Distinctive Stock & Flow Features
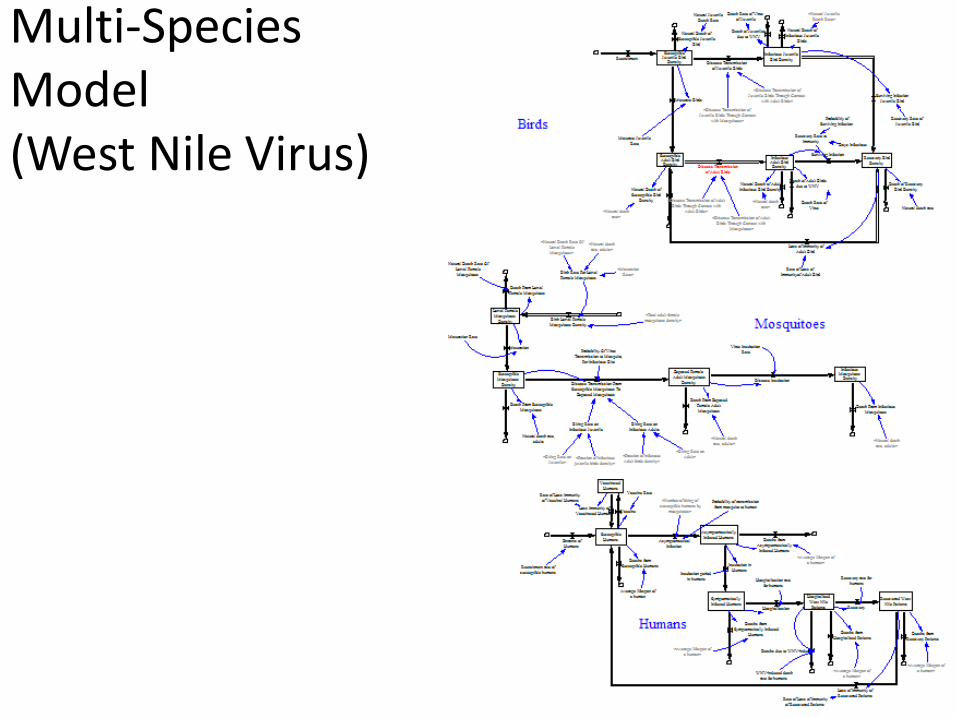
Multi-Species Model (West Nile Virus)
Refinement of Causal Loop Diagrams: System Structure Diagrams
• Still essentially a qualitative model, but less ambiguous – By clearly distinguish stocks & flows, this helps reduce the
artifactual loops discussed with CLDs
• Combine causal loops diagram elements with stock & flow structure
• If complete, all loops will go “through a stock” – Loop goes into the flow of a stock (as one variable in the
diagram)
– Loop comes comes out of stock (as next variable in diagram)
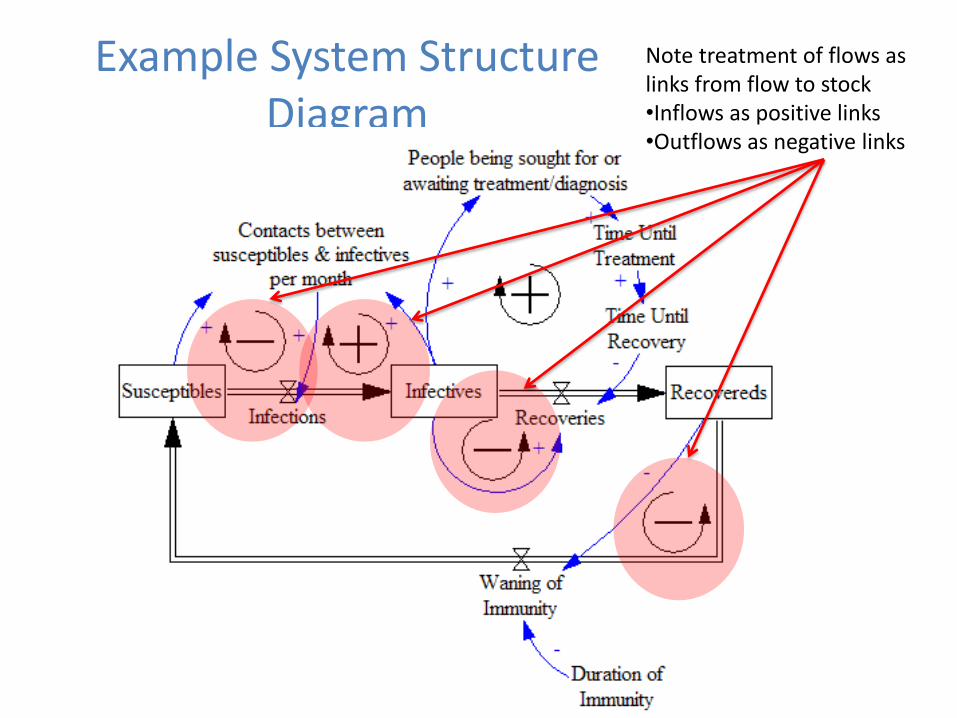
Example System Structure Diagram
Note treatment of flows as links from flow to stock •Inflows as positive links •Outflows as negative links

Slides Adapted from External Source Redacted from Public PDF for Copyright
Reasons
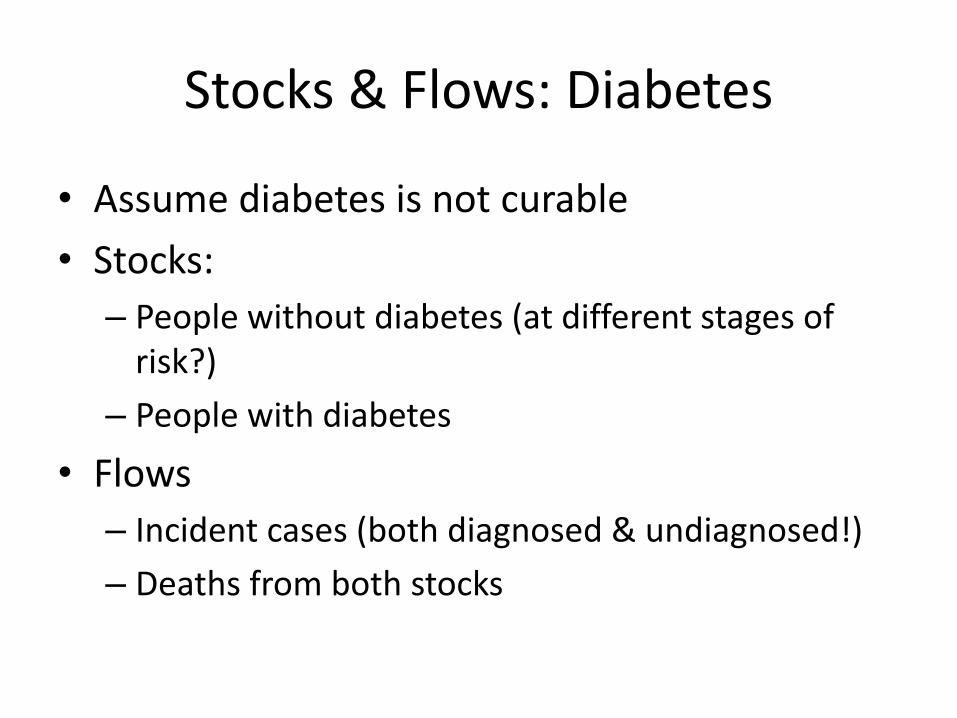
Stocks & Flows: Diabetes
• Assume diabetes is not curable
• Stocks:
– People without diabetes (at different stages of risk?)
– People with diabetes
• Flows
– Incident cases (both diagnosed & undiagnosed!)
– Deaths from both stocks
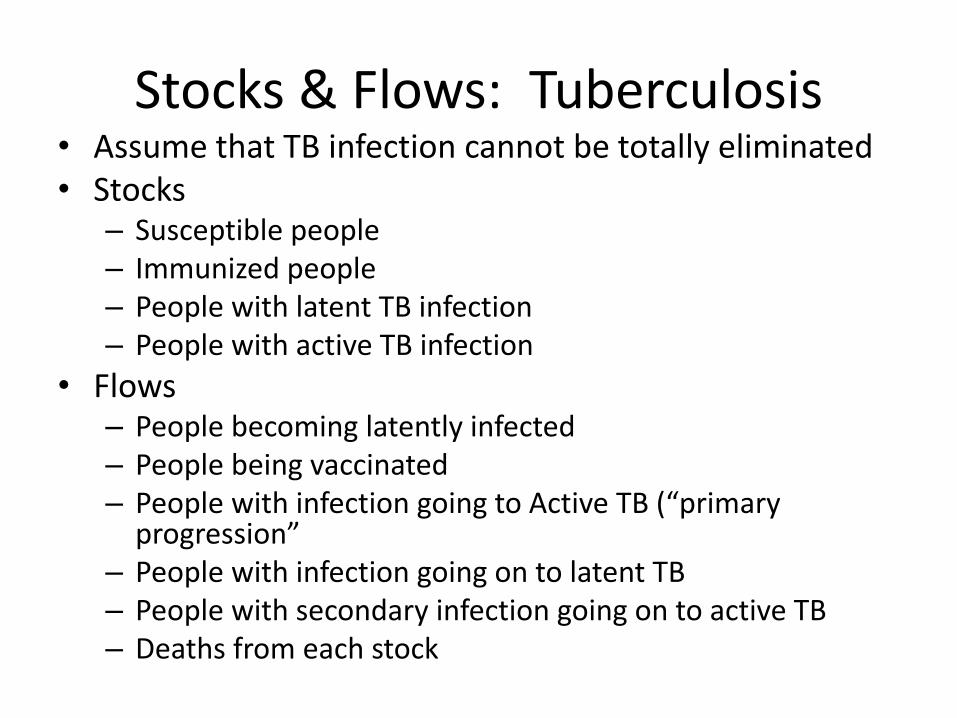
• Assume that TB infection cannot be totally eliminated • Stocks
– Susceptible people – Immunized people – People with latent TB infection – People with active TB infection
• Flows – People becoming latently infected – People being vaccinated – People with infection going to Active TB (“primary
progression” – People with infection going on to latent TB – People with secondary infection going on to active TB – Deaths from each stock
Stocks & Flows: Tuberculosis
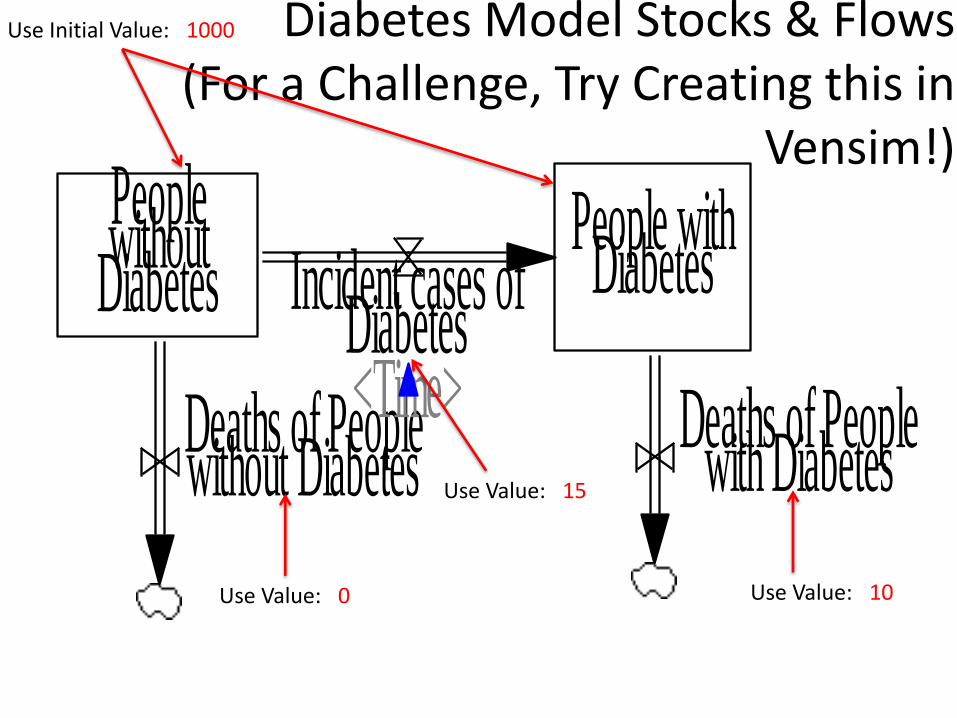
Diabetes Model Stocks & Flows (For a Challenge, Try Creating this in
Vensim!) Peoplewithout
DiabetesPeople with
DiabetesIncident cases ofDiabetes
Deaths of Peoplewith DiabetesDeaths of People
without Diabetes<Time>
Use Initial Value: 1000
Use Value: 0 Use Value: 10
Use Value: 15
Interactive Steps
• View flows and stocks – does this make sense?
• Hitch up constant “auxiliary” variables to flows
• How does changing constant variables change the stock?

Constant Flows
Diabetes Flows20
15
10
5
00 10 20 30 40 50 60 70 80 90 100
Time (Month)Deaths of People with Diabetes : CurrentIncident cases of Diabetes : Current
What happens to the stock?
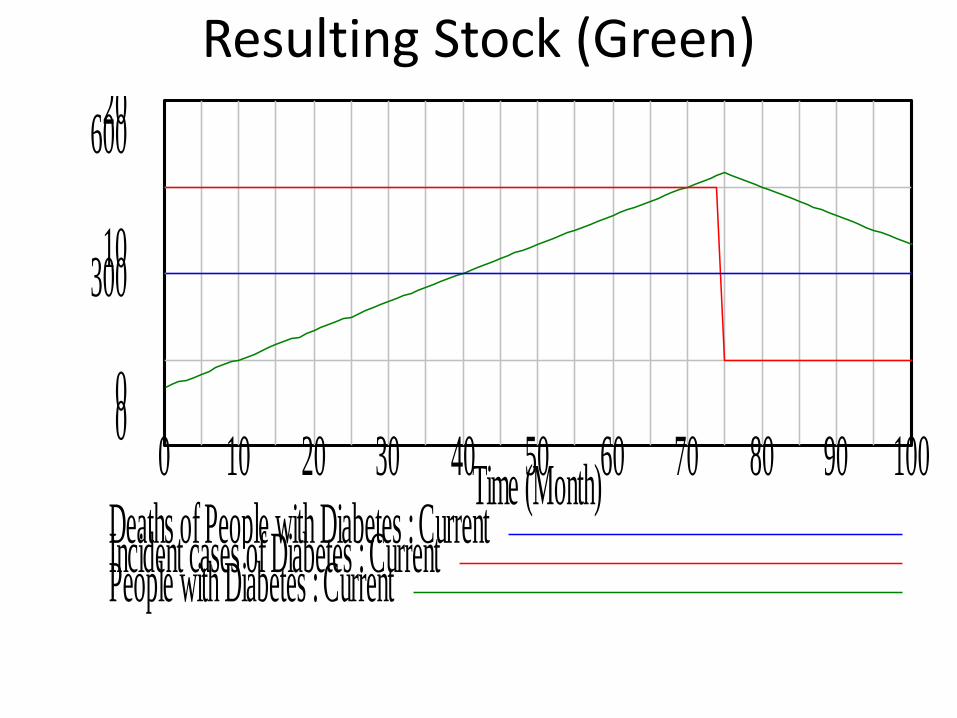
Resulting Stock (Green)
Diabetes Stock & Flows20
600
10300
00
0 10 20 30 40 50 60 70 80 90 100Time (Month)
Deaths of People with Diabetes : CurrentIncident cases of Diabetes : CurrentPeople with Diabetes : Current
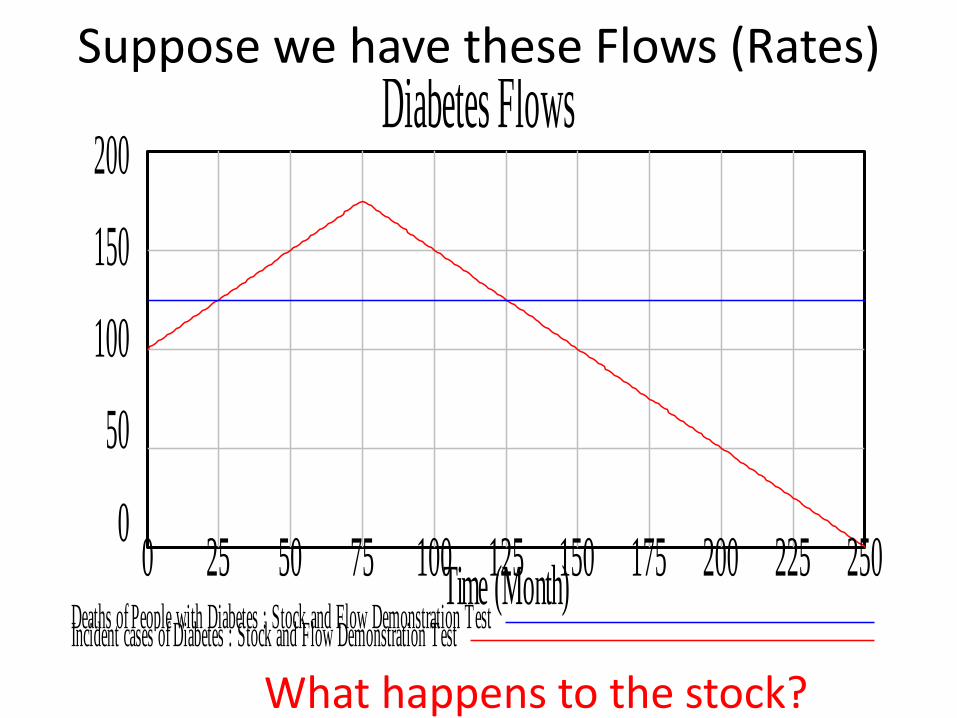
Suppose we have these Flows (Rates)
Diabetes Flows200
150
100
50
00 25 50 75 100 125 150 175 200 225 250
Time (Month)Deaths of People with Diabetes : Stock and Flow Demonstration TestIncident cases of Diabetes : Stock and Flow Demonstration Test
What happens to the stock?
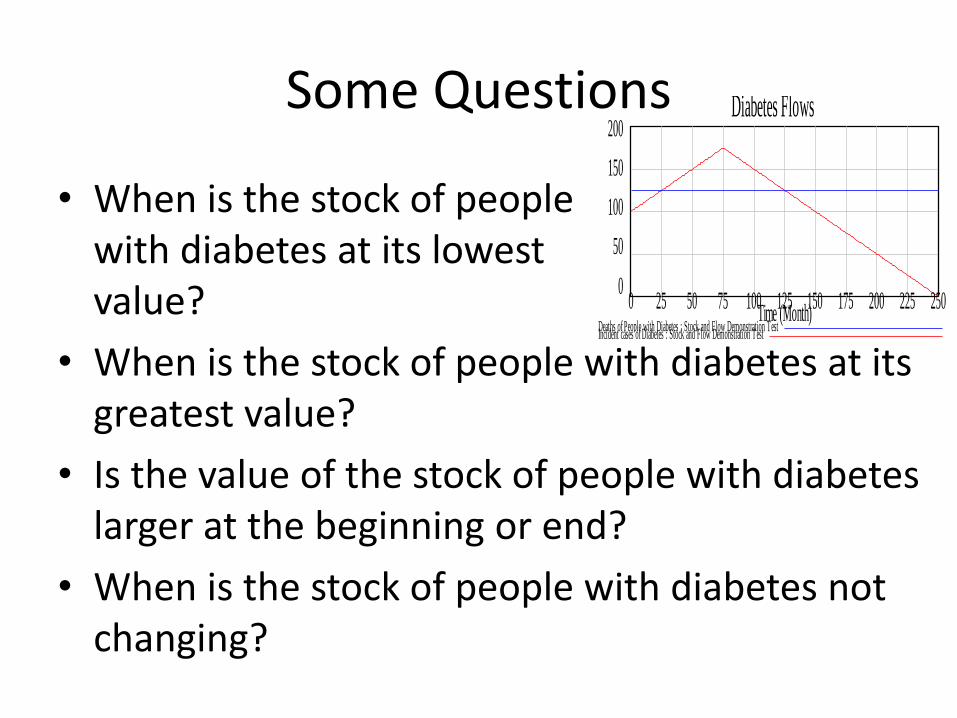
Some Questions
• When is the stock of people with diabetes at its lowest value?
• When is the stock of people with diabetes at its greatest value?
• Is the value of the stock of people with diabetes larger at the beginning or end?
• When is the stock of people with diabetes not changing?
Diabetes Flows200
150
100
50
00 25 50 75 100 125 150 175 200 225 250
Time (Month)Deaths of People with Diabetes : Stock and Flow Demonstration TestIncident cases of Diabetes : Stock and Flow Demonstration Test

Stock (Green)
Diabetes Stock & Flows
20020,000
10010,000
00
0 25 50 75 100 125 150 175 200 225 250Time (Month)
Deaths of People with Diabetes : Stock and Flow Demonstration TestIncident cases of Diabetes : Stock and Flow Demonstration TestPeople with Diabetes : Stock and Flow Demonstration Test
Flows and Feedbacks
• Stocks are always changed by flows
• In your experiments, we’ve used constant values for flows
• In general, the formulas for the flows will depend on things that are changing (state)
– Ultimately, these things must depend on the things that collectively specify the state – the stocks!
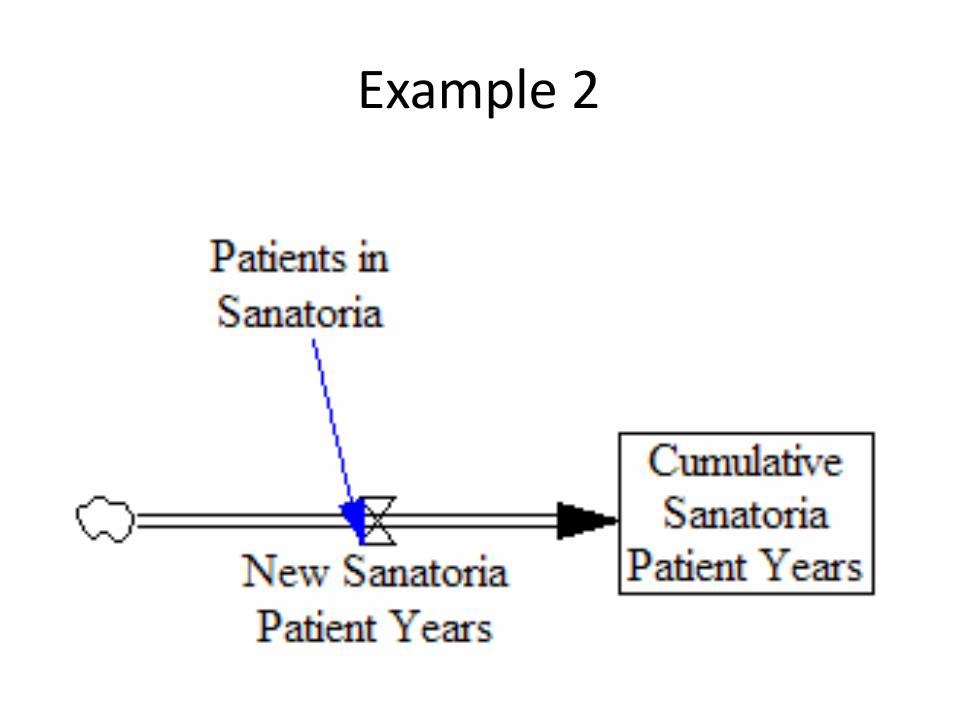
Example 2
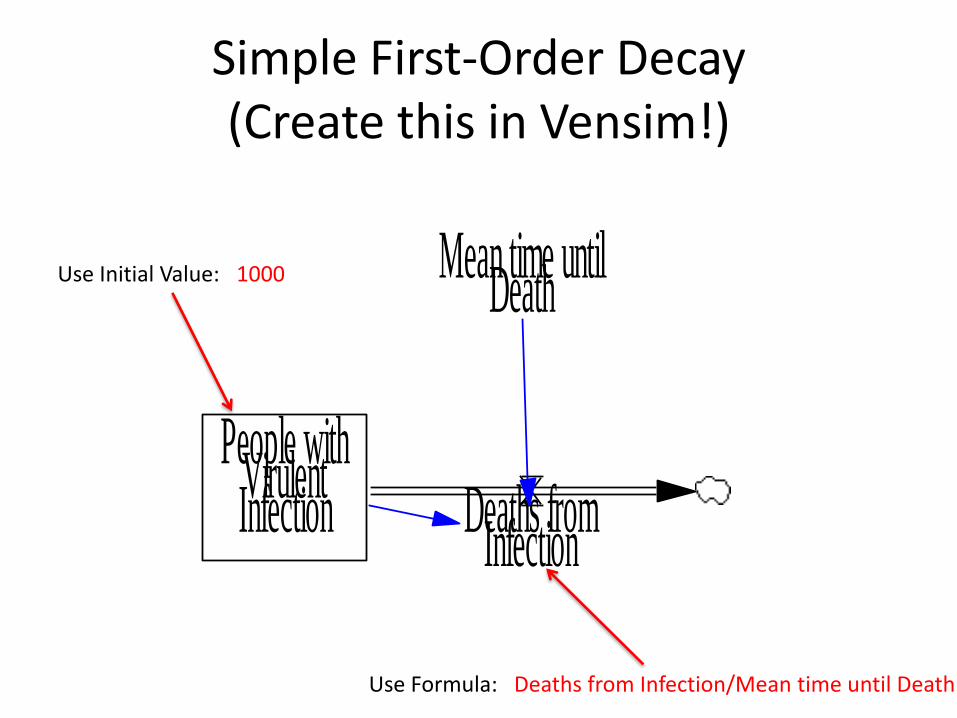
Simple First-Order Decay (Create this in Vensim!)
People withVirulentInfection Deaths from
Infection
Mean time untilDeath
Use Formula: Deaths from Infection/Mean time until Death
Use Initial Value: 1000
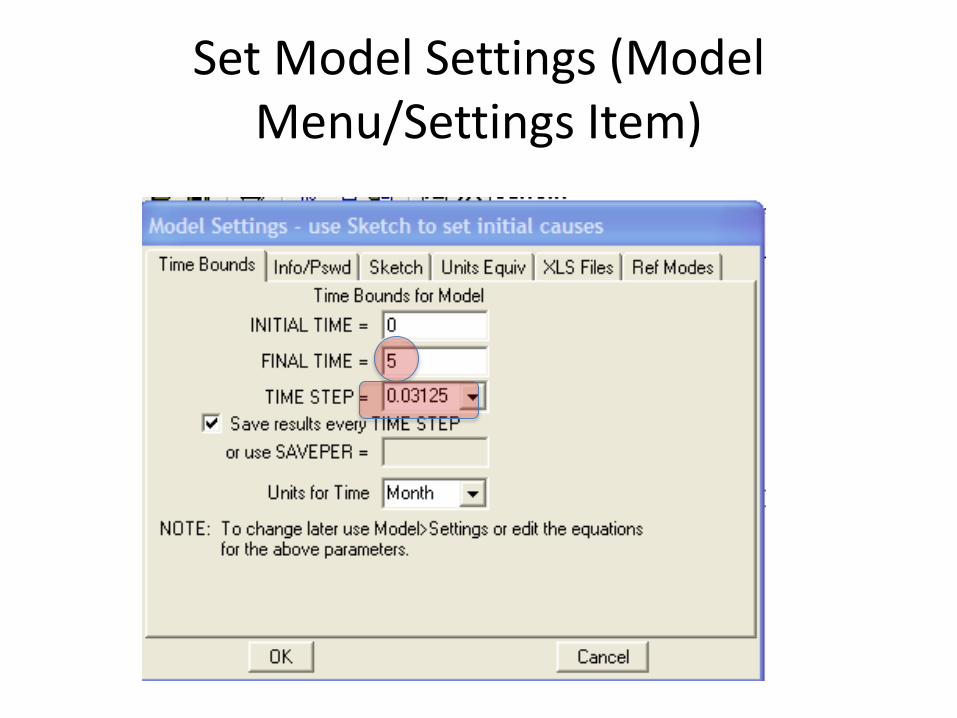
Set Model Settings (Model Menu/Settings Item)

Dynamics of Stock?
People with Virulent Infection1,000
750
500
250
00 1 2 3 4 5
Time (Month)People with Virulent Infection : Current
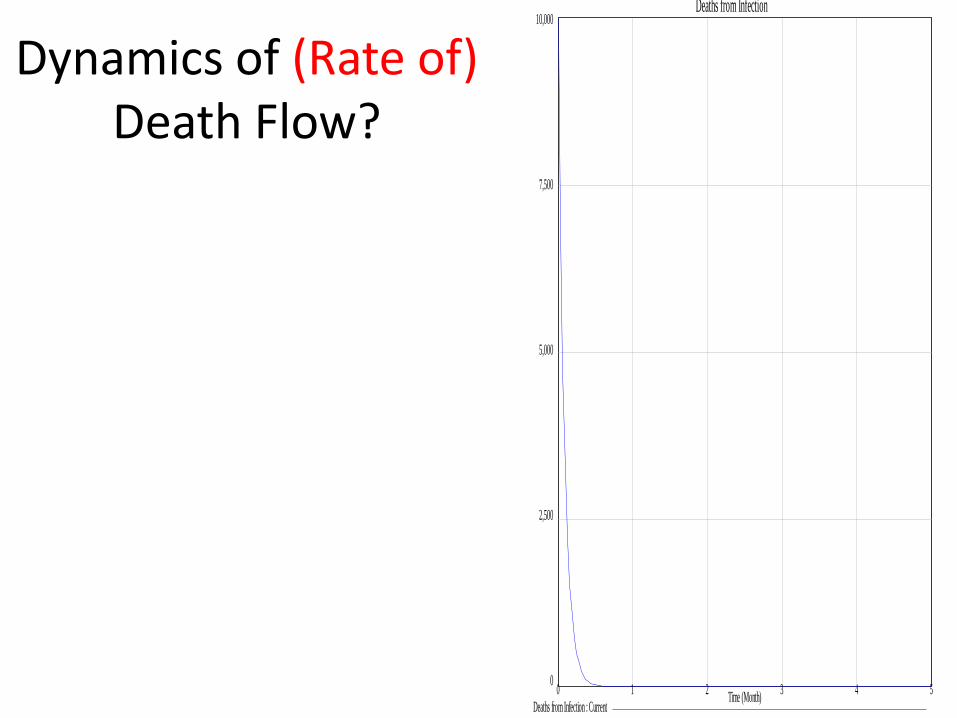
Dynamics of (Rate of) Death Flow?
Deaths from Infection10,000
7,500
5,000
2,500
00 1 2 3 4 5
Time (Month)Deaths from Infection : Current
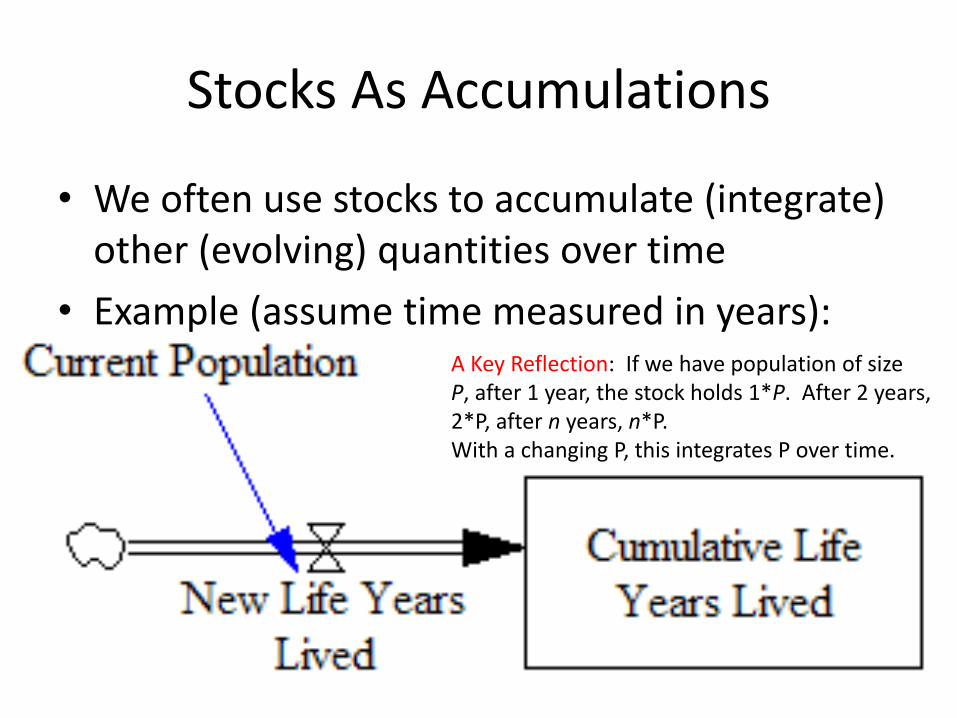
Stocks As Accumulations
• We often use stocks to accumulate (integrate) other (evolving) quantities over time
• Example (assume time measured in years): A Key Reflection: If we have population of size P, after 1 year, the stock holds 1*P. After 2 years, 2*P, after n years, n*P. With a changing P, this integrates P over time.

Example 2
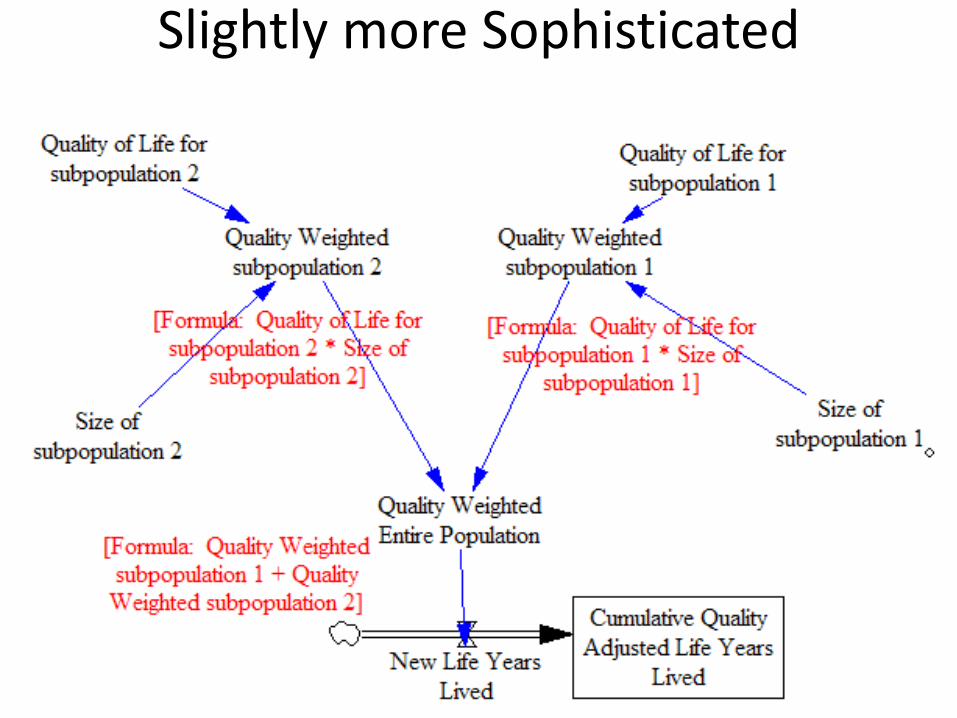
Slightly more Sophisticated
Principle: Structure Determines Behaviour
• Feedback & stock-and-flow structure of a system determines the possible patterns of behaviour
• Different sets of parameters (e.g. values for constants) will select particular behaviour within these behaviour patterns
• Changes to the feedback structure can change behaviour in fundamental ways
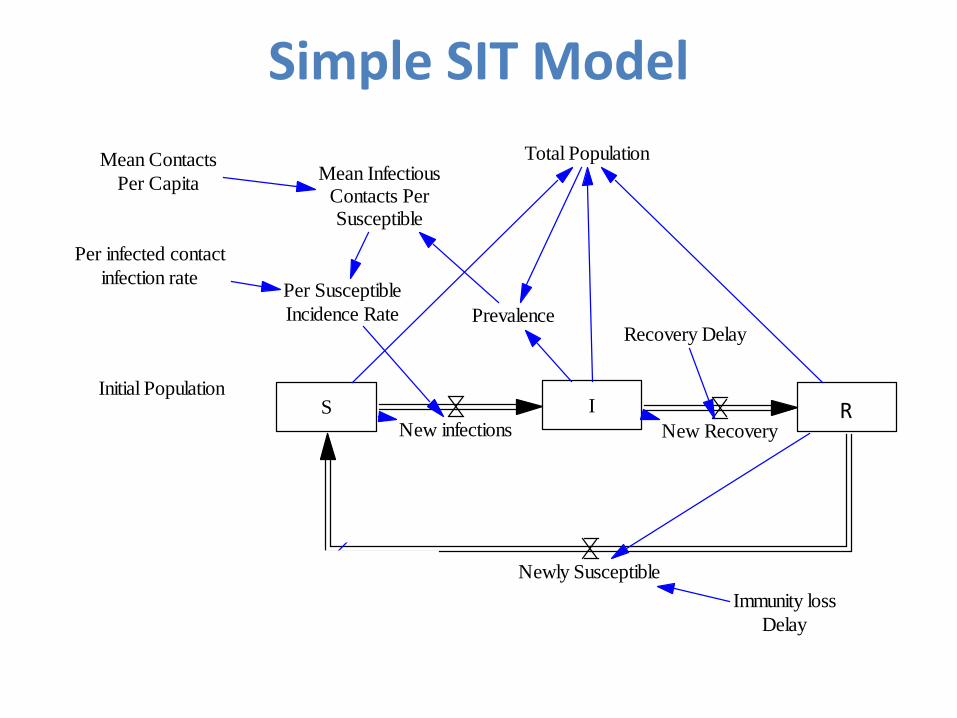
Simple SIT Model
S I TNew infections New Recovery
Newly Susceptible
Immunity loss
Delay
Per infected contact
infection rate
Mean Contacts
Per Capita
Total PopulationMean Infectious
Contacts PerSusceptible
Per Susceptible
Incidence Rate
Cumulative
IllnessesNew Illness
PrevalenceRecovery Delay
Initial Population
R
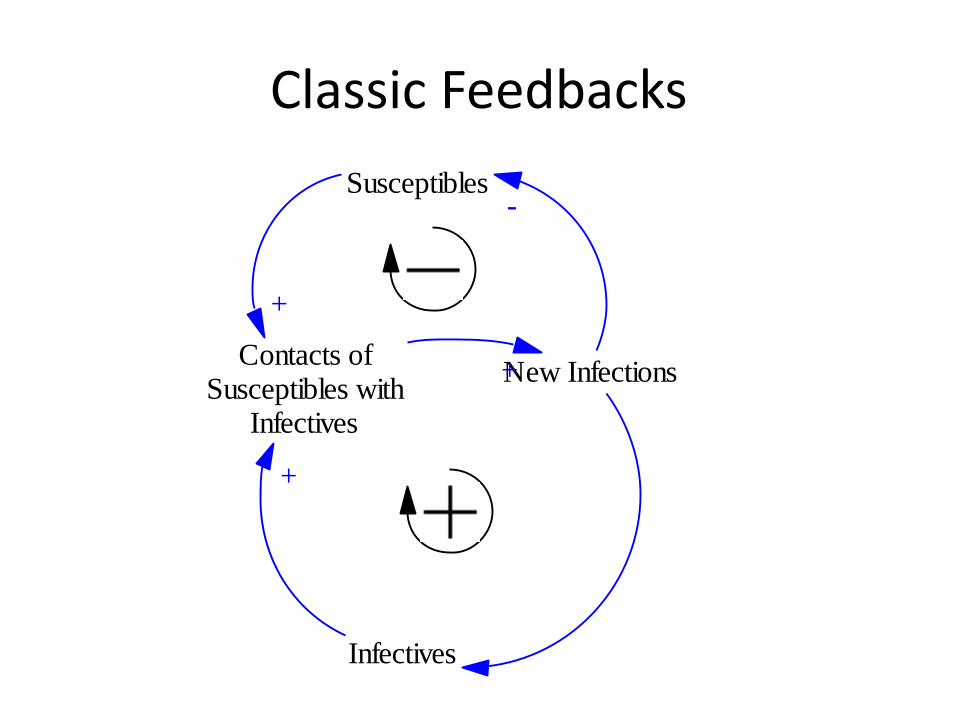
Classic Feedbacks
Infectives
New Infections
Susceptibles-
Contacts ofSusceptibles with
Infectives
+
+
+
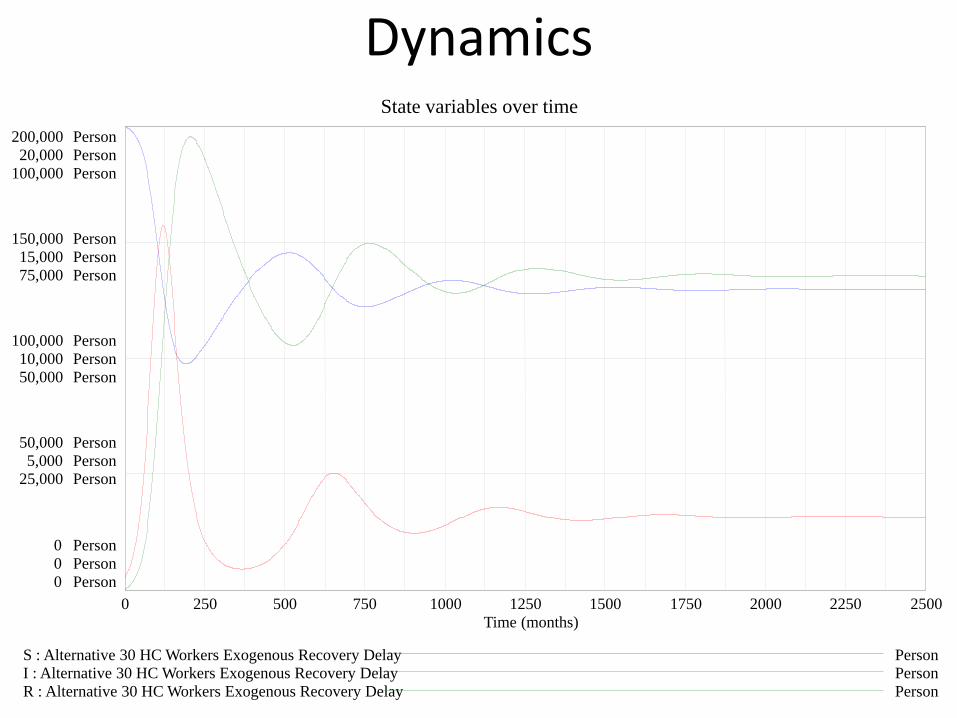
Dynamics
State variables over time
200,000 Person 20,000 Person
100,000 Person
150,000 Person 15,000 Person 75,000 Person
100,000 Person 10,000 Person 50,000 Person
50,000 Person 5,000 Person
25,000 Person
0 Person 0 Person 0 Person
0 250 500 750 1000 1250 1500 1750 2000 2250 2500 Time (months)
S : Alternative 30 HC Workers Exogenous Recovery Delay Person I : Alternative 30 HC Workers Exogenous Recovery Delay Person R : Alternative 30 HC Workers Exogenous Recovery Delay Person

Broadening the Model Boundaries: Endogenous Recovery Delay
S I RNew infections New Recovery
Newly Susceptible
Immunity loss
Delay
Per infected contact
infection rate
Mean Contacts
Per Capita
Total PopulationMean Infectious
Contacts PerSusceptible
Per Susceptible
Incidence RateFractional
Prevalence Time Until Seek
TreatmentRecovery Delay
Healthcare
Workers
Staff Time per
Patient
Initial Population

Broadening the Model Boundaries: Endogenous Recovery Delay
Infectives
New Infections
People Presenting
for Treatment
Waiting Times
+
+
Health Care Staff
-
Susceptibles-
Contacts ofSusceptibles with
Infectives
++
++
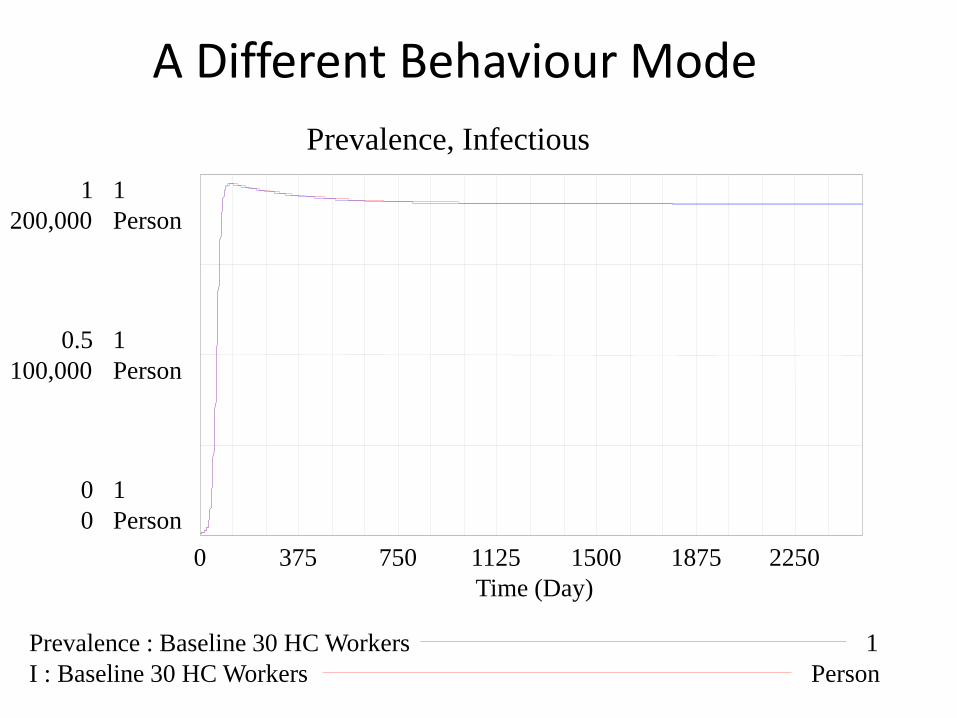
A Different Behaviour Mode
Prevalence, Infectious
1 1 200,000 Person
0.5 1 100,000 Person
0 1 0 Person
0 375 750 1125 1500 1875 2250 Time (Day)
Prevalence : Baseline 30 HC Workers 1 I : Baseline 30 HC Workers Person
Structure as Shaping Behaviour
• System structure is defined by – Stocks
– Flows
– Connections between them
• Nonlinearity: The behaviour of the whole is more than the sum of the behaviour of the parts – “Emergent” behaviour would not be anticipated from
simple behaviour of each piece in turn
• Stock and flow structure (including feedbacks) of a system determines the qualitative behaviour modes that the system can take on