R03-05-A14801 Stocks and flows of handheld batteries report
94
National Environment Protection Council Service Corporation Study into market share and stocks and flows of handheld batteries in Australia Trend analysis and market assessment report Final report
Transcript of R03-05-A14801 Stocks and flows of handheld batteries report
National Environment Protection Council Service Corporation
Study into market share and stocks and flows of handheld batteries in Australia
Trend analysis and market assessment report Final report
Study into market share and stocks and flows of handheld batteries in Australia
Sustainable Resource Use Pty Ltd
Page ii
Project name: Study into market share and stocks and flows of handheld batteries in Australia
Report title: Trend analysis and market assessment report
Authors: Kyle O’Farrell, Raphael Veit, Dan A’Vard
Reviewers: Peter Allan, David Perchard
Project reference: A14801 Sustainable Resource Use Pty Ltd (ABN 52 151 861 602)
Suite G‐03, 60 Leicester Street, Carlton VIC 3053
www.sru.net.au
Document reference: R03‐05‐A14801
Date: 14 July 2014
Disclaimer
This report has been prepared on behalf of and for the exclusive use of National Environment Protection Council Service Corporation, and is subject to and issued in accordance with the agreement between National Environment Protection Council Service Corporation, and Sustainable Resource Use Pty Ltd. Sustainable Resource Use Pty Ltd accepts no liability or responsibility whatsoever for any use of or reliance upon this report by any third party.
Study into market share and stocks and flows of handheld batteries in Australia
Sustainable Resource Use Pty Ltd
Page iii
CONTENTS
EXECUTIVE SUMMARY ........................................................................................................................... 5
E-1 Purpose ..................................................................................................................................... 5
E-2 Scope of this report ............................................................................................................ 5
E-3 Findings ..................................................................................................................................... 6
1 INTRODUCTION ............................................................................................................................... 11
1.1 This report ............................................................................................................................... 11
1.2 Handheld battery definition ............................................................................................ 11
1.3 Scope of study ...................................................................................................................... 11
1.4 Confidentiality ........................................................................................................................ 12
1.5 Scope and data considerations .................................................................................... 12
2 STUDY METHODOLOGY ............................................................................................................. 13
2.1 Classifications and definitions........................................................................................ 13
2.2 MFA system ............................................................................................................................ 13
2.3 Data collection ....................................................................................................................... 17
2.4 Data analysis ........................................................................................................................... 17
3 HANDHELD BATTERY SALES ................................................................................................. 18
3.1 Sales by battery size .......................................................................................................... 18
3.2 Sales by battery chemistry ............................................................................................. 19
3.3 Sales by battery weight range ...................................................................................... 20
3.4 Sales by product application area ............................................................................... 23
3.5 Sales by single use / rechargeable chemistries .................................................... 24
3.6 Sales by level of integration in products .................................................................. 25
3.7 Battery imports by Customs Tariff Code ................................................................. 26
3.8 Sales by jurisdiction ............................................................................................................ 27
4 HANDHELD BATTERY USE AND STORAGE .................................................................... 30
4.1 Battery use and storage periods .................................................................................. 30
4.2 Batteries in use (stocks) ................................................................................................... 30
5 HANDHELD BATTERY END-OF-LIFE DISPOSAL AND RECOVERY .................... 33
5.1 End-of-life disposal ............................................................................................................. 33
5.2 End-of-life recovery ............................................................................................................ 35
6 HANDHELD BATTERY TRENDS.............................................................................................. 40
6.1 Approach ................................................................................................................................. 40
6.2 Single use vs. rechargeable batteries ........................................................................ 41
6.3 Chemistries .............................................................................................................................. 42
7 MARKET ASSESSMENT AND BRANDS ............................................................................... 45
7.1 Summary of current major brand-owners and distributors ........................... 45
7.2 Retail World handheld battery sales data ............................................................... 47
7.3 Sustainability Victoria handheld battery recovery data ................................... 49
Study into market share and stocks and flows of handheld batteries in Australia
Sustainable Resource Use Pty Ltd
Page iv
8 DATA SENSITIVITY AND RELIABILITY................................................................................ 51
8.1 Sensitivity analysis ............................................................................................................... 51
8.2 Qualitative sensitivities discussion .............................................................................. 53
8.3 Data sensitivity and reliability conclusions ............................................................. 54
9 GLOSSARY AND ABBREVIATIONS ...................................................................................... 56
10 REFERENCES .................................................................................................................................... 60
APPENDIX A – Stakeholders consulted .......................................................................................... 64
APPENDIX B – Detailed methodology............................................................................................. 67
B.1 MFA system development .............................................................................................. 68
B.2 Data collection ....................................................................................................................... 77
B.3 Data analysis ........................................................................................................................... 82
B.4 Reporting ................................................................................................................................. 85
APPENDIX C – Imports and exports of batteries ....................................................................... 86
APPENDIX D – Battery sales and recovery survey forms...................................................... 89
Study into market share and stocks and flows of handheld batteries in Australia
Sustainable Resource Use Pty Ltd
Page 5
EXECUTIVE SUMMARY
E-1 Purpose In April 2013 the Standing Council on Environment and Water (SCEW) agreed to place development
of a model product stewardship scheme for handheld batteries on the 2013–14 workplan. On the
advice of the Product Stewardship Advisory Group handheld batteries were listed in June 2013 as
one of the Priority Products for development of stewardship arrangements on the 2013–14 Priority
Product List as required by the Product Stewardship (Commonwealth) Act 2011 (The Act).
As an outcome of this requirement the NEPC Service Corporation has commissioned this study to
undertake a material flow analysis (MFA) on:
stocks and flows of handheld batteries of 5 kilograms or less
market share of major brand owners.
A material flow analysis is an analytical method of quantifying flows and stocks of materials or
substances in a well‐defined system, in this case for handheld batteries. MFA is based on two
principles, system mapping and mass balance. The MFA system developed for this project is a model
of Australian handheld battery flows, built up from estimated flows of historical and current battery
sales, use and disposal, differentiated by chemistry, size, product application and other attributes.
Sustainable Resource Use (SRU), in association with Perchards Ltd and Sagis Ltd, has been engaged
by the NEPC Service Corporation to undertake this study on the targeted handheld battery products
in Australia.
The information generated through this study will contribute to an improved understanding of the
issues and opportunities for battery product stewardship in Australia. It provides a strong evidence
base to inform the work of the Battery Implementation Working Group (BIWG) on assessing the
preferred design for a voluntary and industry led product stewardship scheme under The Act.
E-2 Scope of this report For the development of the scheme it is essential that there is a sound understanding of the material
flows of handheld batteries used and disposed by householders and commercial sources.
The report provides information on:
The annual Australian consumption (sales) of handheld batteries at the national and state/territory levels.
The quantities of batteries in use (including storage).
The quantities of batteries reaching end‐of‐life and being disposed by householders and businesses via the different available disposal routes.
Study into market share and stocks and flows of handheld batteries in Australia
Sustainable Resource Use Pty Ltd
Page 6
E-3 Findings
Summary of stocks and flows
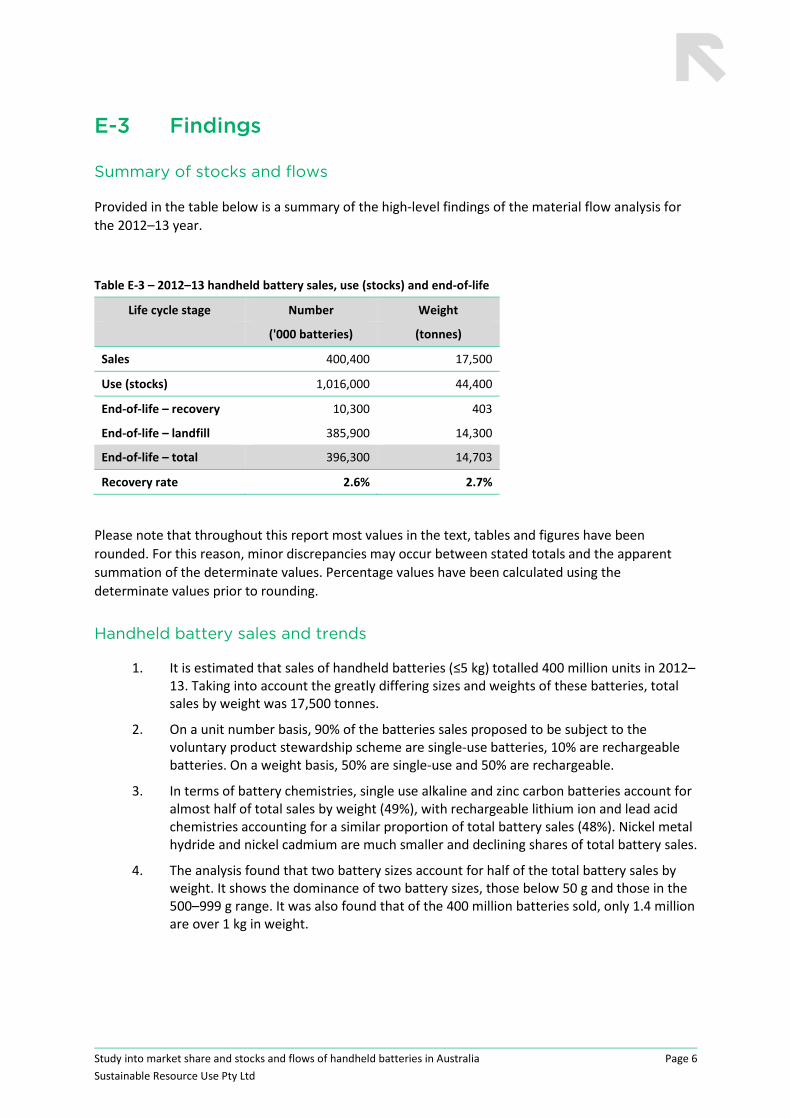
Provided in the table below is a summary of the high‐level findings of the material flow analysis for
the 2012–13 year.
Table E‐3 – 2012–13 handheld battery sales, use (stocks) and end‐of‐life
Life cycle stage Number Weight
('000 batteries) (tonnes)
Sales 400,400 17,500
Use (stocks) 1,016,000 44,400
End‐of‐life – recovery 10,300 403
End‐of‐life – landfill 385,900 14,300
End‐of‐life – total 396,300 14,703
Recovery rate 2.6% 2.7%
Please note that throughout this report most values in the text, tables and figures have been
rounded. For this reason, minor discrepancies may occur between stated totals and the apparent
summation of the determinate values. Percentage values have been calculated using the
determinate values prior to rounding.
Handheld battery sales and trends
1. It is estimated that sales of handheld batteries (≤5 kg) totalled 400 million units in 2012–13. Taking into account the greatly differing sizes and weights of these batteries, total sales by weight was 17,500 tonnes.
2. On a unit number basis, 90% of the batteries sales proposed to be subject to the voluntary product stewardship scheme are single‐use batteries, 10% are rechargeable batteries. On a weight basis, 50% are single‐use and 50% are rechargeable.
3. In terms of battery chemistries, single use alkaline and zinc carbon batteries account for almost half of total sales by weight (49%), with rechargeable lithium ion and lead acid chemistries accounting for a similar proportion of total battery sales (48%). Nickel metal hydride and nickel cadmium are much smaller and declining shares of total battery sales.
4. The analysis found that two battery sizes account for half of the total battery sales by weight. It shows the dominance of two battery sizes, those below 50 g and those in the 500–999 g range. It was also found that of the 400 million batteries sold, only 1.4 million are over 1 kg in weight.
Study into market share and stocks and flows of handheld batteries in Australia
Sustainable Resource Use Pty Ltd
Page 7
5. Three product applications account for the majority of battery sales by number: Information and Communication Technologies (ICT) and consumer electronics (47%); Torches/lanterns (30%); and Toys (19%). By weight, however, the distribution of battery sales is much more evenly spread across all application areas: ICT and consumer electronics (23%); Torches/lanterns (27%), Cordless power tools & gardening equipment (14%); Toys (13%); Emergency, storage and standby (18%); and Personal mobility (5%).
6. Laptops and mobile phones are the most significant products in consumer electronics, while power tools is spread fairly evenly across sales of drills, circular saws, blowers, grinders, edgers, screwdrivers and sanders.
7. Sales of consumer electronics have continued to grow strongly over recent years, and battery powered power tool sales have also climbed, based on convenience and reducing safety concerns on building sites with respect to tools with a cord. Both consumer electronics and power tools have now seen an almost complete shift to lithium ion based battery chemistries.
8. Sales of rechargeable lithium ion batteries account for about 24% of all batteries by weight and 7% by unit. They have grown strongly since 2003–04, and are forecast to continue to do so as they enable new applications and replace other chemistries in existing applications.
9. Sales of rechargeable sealed lead acid batteries account for about 24% of all batteries by weight and 0.5% by unit. Market share of ‘handheld’ sealed lead acid batteries is forecast to be steady until 2020.
10. Market share of nickel cadmium and nickel metal hydride battery chemistries have declined significantly over the last 2–3 years.
Handheld battery use (stocks) and storage
11. Single use batteries are estimated as having a typical use phase (the period between purchase and disposal) of 1.8 years. Rechargeable batteries have much longer use phases, with lithium ion batteries having a typical use phase of 5–6 years, and nickel cadmium batteries having a use phase of up to 14 years.
12. Batteries in active use in the economy are referred to in the MFA as ‘stocks’. Stocks of lithium ion batteries are forecast to grow by 250% from 2012–13 to 2019–20, from 11,100 tonnes in 2012–13 to 28,100 tonnes in 2019–20.
13. Stocks of alkaline and zinc carbon batteries are forecast to grow by a little over 20% from 2012–13 to 2019–20, from 8,300 tonnes in 2012–13 to 10,100 tonnes in 2019–20.
14. Stocks of sealed lead acid batteries are forecast to grow by 34% from 2012–13 to 2019–20, from 13,500 tonnes in 2012–13 to 18,100 tonnes in 2019–20.
15. Stocks of nickel metal hydride and nickel cadmium are both forecast to decrease by around 40% in aggregate from 2012–13 to 2019–20, from 11,200 tonnes in 2012–13 to 6,600 tonnes in 2019–20.
16. Growth in battery stocks will occur across all product application types from 2012–13 to 2019–20, but will be particularly strong in ICT and consumer electronics, where growth is forecast at nearly 100%, from 12,300 tonnes in 2012–13 to 23,900 tonnes in 2019–20.
Study into market share and stocks and flows of handheld batteries in Australia
Sustainable Resource Use Pty Ltd
Page 8
Handheld battery end-of-life disposal and recovery
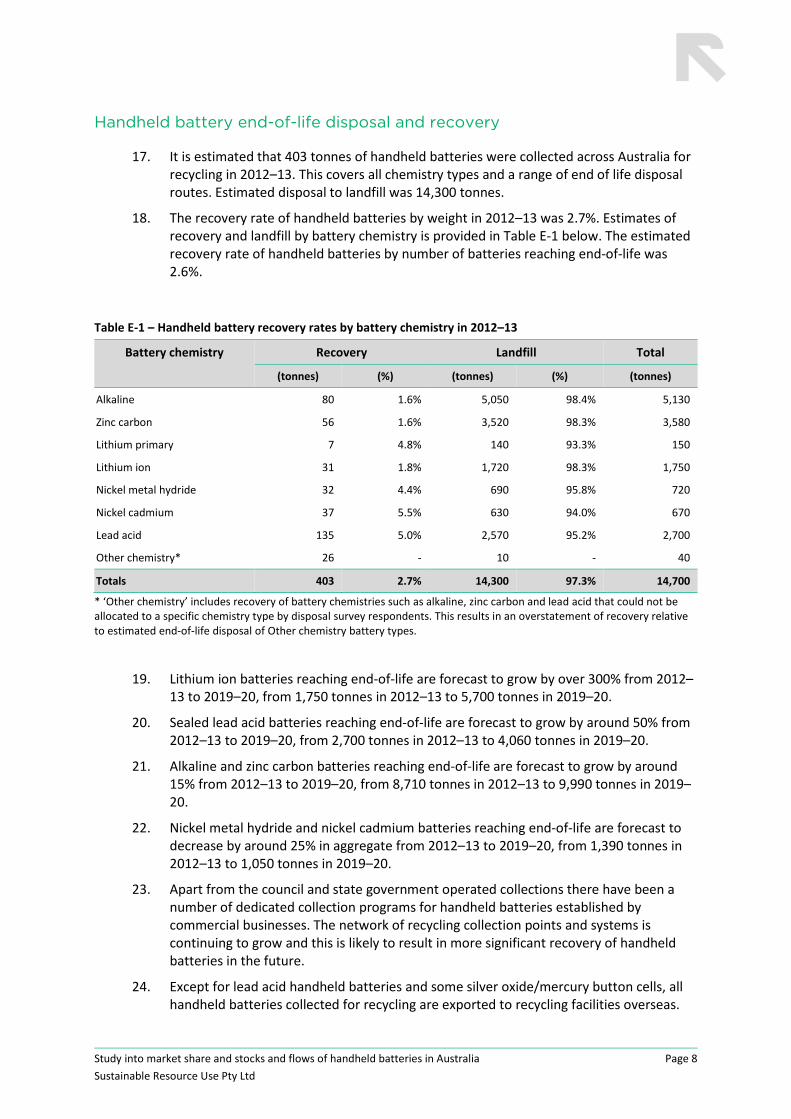
17. It is estimated that 403 tonnes of handheld batteries were collected across Australia for recycling in 2012–13. This covers all chemistry types and a range of end of life disposal routes. Estimated disposal to landfill was 14,300 tonnes.
18. The recovery rate of handheld batteries by weight in 2012–13 was 2.7%. Estimates of recovery and landfill by battery chemistry is provided in Table E‐1 below. The estimated recovery rate of handheld batteries by number of batteries reaching end‐of‐life was 2.6%.
Table E‐1 – Handheld battery recovery rates by battery chemistry in 2012–13
Battery chemistry Recovery Landfill Total
(tonnes) (%) (tonnes) (%) (tonnes)
Alkaline 80 1.6% 5,050 98.4% 5,130
Zinc carbon 56 1.6% 3,520 98.3% 3,580
Lithium primary 7 4.8% 140 93.3% 150
Lithium ion 31 1.8% 1,720 98.3% 1,750
Nickel metal hydride 32 4.4% 690 95.8% 720
Nickel cadmium 37 5.5% 630 94.0% 670
Lead acid 135 5.0% 2,570 95.2% 2,700
Other chemistry* 26 ‐ 10 ‐ 40
Totals 403 2.7% 14,300 97.3% 14,700
* ‘Other chemistry’ includes recovery of battery chemistries such as alkaline, zinc carbon and lead acid that could not be allocated to a specific chemistry type by disposal survey respondents. This results in an overstatement of recovery relative to estimated end‐of‐life disposal of Other chemistry battery types.
19. Lithium ion batteries reaching end‐of‐life are forecast to grow by over 300% from 2012–13 to 2019–20, from 1,750 tonnes in 2012–13 to 5,700 tonnes in 2019–20.
20. Sealed lead acid batteries reaching end‐of‐life are forecast to grow by around 50% from 2012–13 to 2019–20, from 2,700 tonnes in 2012–13 to 4,060 tonnes in 2019–20.
21. Alkaline and zinc carbon batteries reaching end‐of‐life are forecast to grow by around 15% from 2012–13 to 2019–20, from 8,710 tonnes in 2012–13 to 9,990 tonnes in 2019–20.
22. Nickel metal hydride and nickel cadmium batteries reaching end‐of‐life are forecast to decrease by around 25% in aggregate from 2012–13 to 2019–20, from 1,390 tonnes in 2012–13 to 1,050 tonnes in 2019–20.
23. Apart from the council and state government operated collections there have been a number of dedicated collection programs for handheld batteries established by commercial businesses. The network of recycling collection points and systems is continuing to grow and this is likely to result in more significant recovery of handheld batteries in the future.
24. Except for lead acid handheld batteries and some silver oxide/mercury button cells, all handheld batteries collected for recycling are exported to recycling facilities overseas.

Study into market share and stocks and flows of handheld batteries in Australia
Sustainable Resource Use Pty Ltd
Page 9
25. The great majority of handheld batteries currently go to landfill at end‐of‐life.
26. Sealed lead acid handheld batteries (SLABs) can be recycled with other lead acid batteries from automotive and industrial applications, however some major automotive battery recyclers surveyed for this study were unable to provide data on the quantity of SLABs recycled. For this reason the total quantity of lead acid batteries identified as recovered should be treated as conservative.
27. As noted previously the scope of this study does not include industrial and automotive lead‐acid batteries above 5 kg. Australian data on the consumption and recovery rates for these types of batteries can be found on the Australian Battery Recycling Initiative (ABRI) website at www.batteryrecycling.org.au.
Market assessment and brands
Outlined in Table E‐2 is a summary of available information on major Australian battery brand‐
owners and distributors by product application area. The Australian battery market is highly diverse
across many different batteries applications and chemistries however the companies identified in the
table below are anticipated to be responsible for 80% or more of handheld battery sales by weight
into the Australian market.
Table E‐2 – Current major brand‐owners and distributors – by product application area (brand‐names in brackets as required)
Product application area
Single use and nickel metal hydride batteries
Rechargeable batteries
Information and Communication Technologies (ICT) and consumer electronics
Energizer (Energizer/Eveready)
Procter and Gamble (Duracell)
Remington Products (Varta)
Panasonic (Panasonic)
Woolworths (Essentials)
Coles (Coles)
ALDI (Ultracell/Activ Energy)
Metcash (IGA Signature/Black and Gold)
Fuji (Fuji)
Dick Smith Electronics (DSE)
Battery World (Battery World)
Others: Sony, Maxell, Rocket, Toshiba, Philips, GP and Kodak
Acer
Apple
Asus
Canon
Dell
Lenovo
LG
Motorola
Nokia
Panasonic
RIM (BlackBerry)
Samsung
Sony
Toshiba
Others: Google, HP, HTC, Fujitsu, Huawei Technologies, Mitsubishi, NEC, Nikon, Olympus, Uniden.

Study into market share and stocks and flows of handheld batteries in Australia
Sustainable Resource Use Pty Ltd
Page 10
Product application area
Single use and nickel metal hydride batteries
Rechargeable batteries
Torches/lanterns Arlec
Cat Eye
Coleman
Duracell
Energizer (Energizer/Eveready/Dolphin)
LED Lenser
Maglite
Panasonic
Primus
Spinifex
Tactical
Tioga
Varta
Wild Country
Other: BBB, Blackburn, Blackfire, Coast, Cryo‐Lite, Dune, Knog, Lezyne, Meteor, Moon, Planet Bike, and many other torch/lantern brand‐names.
Arlec
Cat Eye
Coleman
LED Lenser
Primus
Spinifex
Varta
Wild Country
Other: Cryo‐Lite, Knog, Lezyne, Moon, Planet Bike, and many other torch/lantern brand‐names.
Cordless power tools & gardening equipment
N/A Black & Decker
Bosch
DeWALT
Hitachi
Makita
Ozito
Panasonic
TTI (Milwaukee/AEG/Ryobi/Homelite)
Others: Taurus, Wesco, Worx, Stihl, 909, Husqvarna Group (Gardena), Briggs and Stratton (Victa), Ramset.
Toys Insufficient information (many brand‐owners, distributors and brands)
Insufficient information (many brand‐owners, distributors and brands)
Personal mobility N/A Similar to Emergency, storage and standby below.
Emergency, storage and standby
N/A Battery Specialties Australia (Sonnenschein/ Power‐Sonic/CYB/SAFT/Eaton UPS)
Century Yuasa Batteries (Century/Yuasa)
Clevertronics (Clevertronics)
Enersys (PowerSafe/Genesis/Cyclon/Datasafe)
Federal Batteries (Federal)
Marshall Batteries (Marshall Batteries/Exide)
MPower (Sonnenschein/Powerblock)
Premier Batteries (Premier)
R&J Batteries (Fullriver)
Supercharge (SuperCharge)
YHI Power (CSB/Vision/C & D Technologies/ Neuton Power)
Study into market share and stocks and flows of handheld batteries in Australia
Sustainable Resource Use Pty Ltd
Page 11
1 INTRODUCTION
1.1 This report In April 2013 the Standing Council on Environment and Water (SCEW) agreed to place development
of a model product stewardship scheme for end‐of‐life handheld batteries on the 2013–14 workplan.
On the advice of the Product Stewardship Advisory Group handheld batteries were listed in June
2013 as one of the Priority Products for development of stewardship arrangements on the 2013–14
Priority Product List as required by the Product Stewardship (Commonwealth) Act 2011 (The Act).
As an outcome of this requirement the NEPC Service Corporation has commissioned this study to
undertake a material flow analysis (MFA) on Australian market share and stocks and flows of
handheld batteries of 5 kg or less.
Sustainable Resource Use (SRU), in association with Perchards Ltd and Sagis Ltd, has been engaged
by the NEPC Service Corporation to undertake this study on the targeted handheld batteries in
Australia.
The material flow analysis (MFA) component of the project is an update and refocussing onto
handheld batteries of the work undertaken by the Australian Battery Recycling Initiative (ABRI) in
2010 (Warnken, 2010). Time series modelling across a period of time (2009–10 to 2019–20) has also
been undertaken to better understand the flow and market share of handheld batteries in Australia.
Battery flows are generally tracked by both battery unit number and battery weight throughout the
MFA.
1.2 Handheld battery definition The handheld battery definition applied throughout this study is a battery or cell of any chemistry
that weighs 5 kg or less.
The only exclusion is wet cell (flooded cell) lead acid batteries that weigh 5 kg or less, such as those
used in motorcycles or scooters.
1.3 Scope of study The scope of the MFA included:
Batteries that are 5 kg or less in weight, excluding wet cell lead acid batteries.
All battery chemistries.
All battery product application areas, except automotive.
Both single use (primary) and rechargeable (secondary or accumulator) battery types.
Commercial and household battery sales and use.
Batteries that are separately purchased (standalone) batteries, e.g. alkaline AA cells.
Batteries sold in or with products that are easily removed by consumers, e.g. batteries in cordless power tools and most mobile phones.
Batteries sold ‘embedded’ in products that cannot be easily removed by consumers, e.g. batteries in some laptops and mobile phones.
Study into market share and stocks and flows of handheld batteries in Australia
Sustainable Resource Use Pty Ltd
Page 12
Imports and sales of batteries by original equipment manufacturers (OEM) and brand owners/retailers as well as parallel imports (a non‐counterfeit, legitimate product imported from another country without the permission of the intellectual property owner).
The fate of batteries at end‐of‐life (by number and weight), including recovery (both local and overseas), stockpiling and disposal to landfill.
1.4 Confidentiality Assurances were provided to stakeholders surveyed as part of this project on the confidentiality and
security of their responses. This report does not include any company specific data from survey
responses. All survey data published in this report has been aggregated to the level of general
battery types and state/territory.
1.5 Scope and data considerations Due to the specific scope and requirements for this project as compared with the main prior
Australian work in this area (Warnken, 2010), an updated modelling framework has been developed
for this study. For this reason the scope of this study and the material flow analysis findings are not
necessarily directly comparable with the Warnken (2010) report findings.
Throughout this report most values in the text, tables and figures have been rounded. For this
reason, minor discrepancies may occur between stated totals and the apparent summation of the
determinate values. Percentage values have been calculated using the determinate values prior to
rounding.
Study into market share and stocks and flows of handheld batteries in Australia
Sustainable Resource Use Pty Ltd
Page 13
2 STUDY METHODOLOGY
This section provides an overview of the study methodology, with the comprehensive methodology,
as developed during the project planning phase of the project, provided in Appendix B.
2.1 Classifications and definitions For the purpose of data collection, description and analysis, batteries were classified and defined in
line with the detailed classifications and definitions specification provided in Appendix B.1. A
summary of the applied classifications and definitions is provided below:
Size – common sizes and other application specific sizes.
Chemistry – alkaline; zinc carbon; lithium primary; lithium ion; nickel metal hydride; nickel cadmium; lead acid; and other chemistry.
Product application area – ICT and consumer electronics; torches/lanterns; cordless power tools & gardening equipment; toys; personal mobility; emergency, storage and standby; and other application area.
Single use or rechargeable.
Level of integration in products – separately sold batteries; batteries sold as part of electrical and electronic equipment (EEE) and easily removable by consumers; and batteries sold as part of EEE and not user removable (‘embedded’ batteries).
End user type – household and commercial; and large and industrial.
Supplier type – original equipment manufacturer (OEM); brandname (sold under local licence); and brandname (parallel import).
Also see Section 9 (Glossary and Abbreviations) for additional detail on the definitions provided
above.
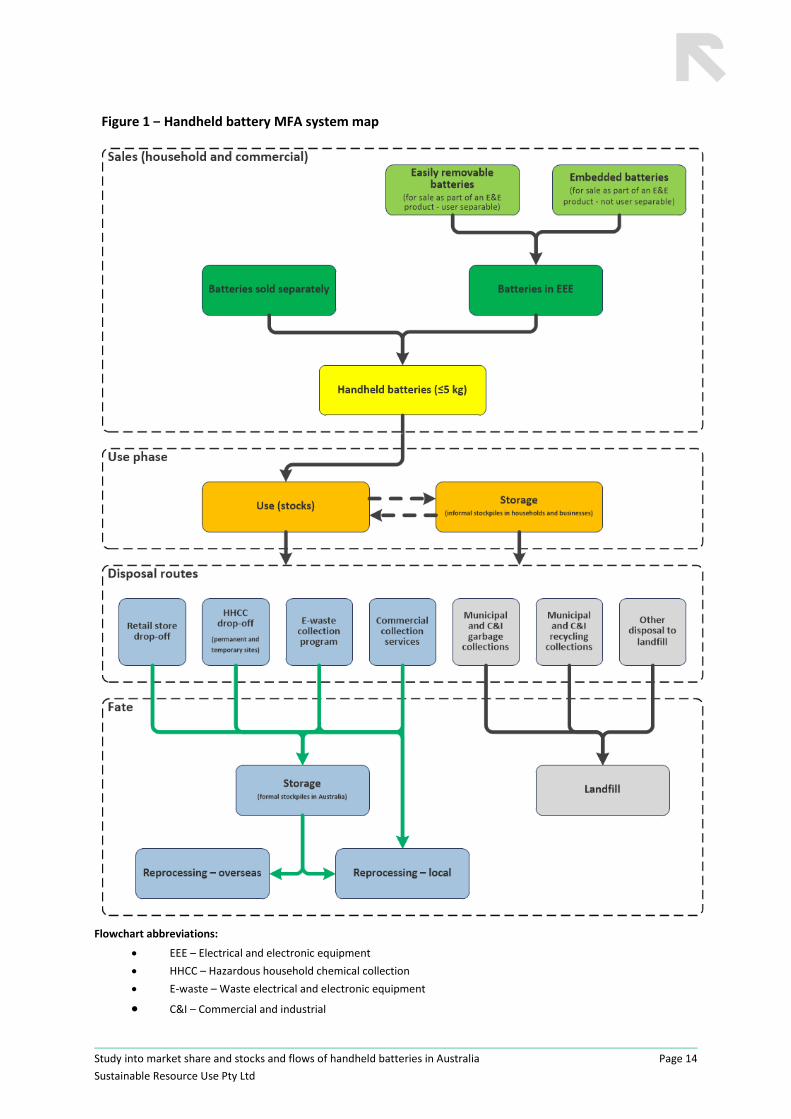
2.2 MFA system The ‘MFA system map’ presented in Figure 1 details the material flow analysis structure applied in
the MS Excel model. It also provides a summary of terms. It outlines the logic for the analysis and
boundaries of the study.
A summary of the MFA system is provided in this section of the report, with full detail provided in
Appendix B.1.
Study into market share and stocks and flows of handheld batteries in Australia
Sustainable Resource Use Pty Ltd
Page 14
Figure 1 – Handheld battery MFA system map
Flowchart abbreviations:
EEE – Electrical and electronic equipment
HHCC – Hazardous household chemical collection
E‐waste – Waste electrical and electronic equipment
C&I – Commercial and industrial
Study into market share and stocks and flows of handheld batteries in Australia
Sustainable Resource Use Pty Ltd
Page 15
MFA boundaries
Temporal
The MFA modelling time boundary is on an Australian financial year basis (1 July to 30 June). The
base year is 2012–13, with time series reporting from 2009–10 to 2019–20. Estimates of future
trends have been undertaken through consideration of historical trends in battery chemistries back
to 2004 as discussed in Section 6 of this report, and consideration of likely future trends in
chemistries as discussed specifically in Section 6.3. It is assumed that there are no interventions in
the local battery market driven by some form of handheld battery product stewardship scheme.
Geographic
The MFA geographic boundary is mainland Australia and Tasmania.
Sales phase
The handheld battery ‘sales phase’ targets handheld batteries going into household and commercial
applications. As outlined previously the battery level of integration in products is flow mapped
through the MFA.
The handheld battery sales related data collection activities are outlined in Section 2.3 and Appendix
B.2 of this report.
Use phase
The use phase of the MFA graphically represents the flows of handheld batteries across the following
areas:
1. Use (stocks) – Batteries in active use
2. Storage (informal) – Stockpiles of batteries (stand alone or in waste EEE) in households and businesses. These batteries may re‐enter use or be disposed of directly from storage.
The use phase analysis covers the entire period from product and battery import or sale through to
end‐of‐life disposal or recycling. Within that period there may be phases where the battery is not yet
in use, in use or stored prior to disposal. This breakdown could be analysed further to understand
consumer attitudes and behaviour, however it is not a focus of this analysis and does not change the
stock of batteries currently in the community. For this reason the retention of batteries in use is
treated in the modelling as a single period of time, and estimates of informal storage relative to the
active use period of handheld batteries by consumers have not been estimated.
Disposal routes – to recovery
In the MFA there are five main disposal routes modelled for which handheld batteries are recovered
for recycling, these are:
retail store drop‐off
Study into market share and stocks and flows of handheld batteries in Australia
Sustainable Resource Use Pty Ltd
Page 16
hazardous household chemical collections (HHCC) – both permanent and temporary sites that receive batteries, typically along with other problematic household wastes such as; waste paint, used engine oil and fluorescent globes and tubes
e‐waste collection programs – includes the TVs/computers scheme, MobileMuster and other phone collection schemes
commercial collection services – collection from individual businesses or organisations)
other recovery options – including public place drop‐off (e.g. schools and council buildings).
The handheld battery disposal (to recovery) data collection activities are outlined in Section 2.3 and
Section B.2 of this report.
Disposal routes – to landfill
The disposal (to landfill) phase of the MFA graphically represents the flows of handheld batteries
across the following streams:
municipal and commercial & industrial (C&I) garbage collections
municipal and C&I recycling collections
other disposal to landfill.
The model does not separately quantify handheld battery disposal via each of these routes, as
suitably detailed audit data of each of the waste streams is not available to provide the required level
of detail and data quality.
Aggregated disposal of batteries to landfill is calculated as the difference between the estimated
quantities of batteries reaching end‐of‐life in any given year, minus the disposal to recovery streams.
Fate of batteries
The final fate phase for end‐of‐life handheld batteries is graphically represented in the MFA across
the following streams:
storage (formal) –batteries that are stored in accordance with relevant regulations prior to transport or processing
reprocessing (local) – battery reprocessing which substantially takes place in Australia
reprocessing (overseas) – battery reprocessing which substantially takes place overseas.
The model does not separately quantify handheld battery fates via each of these routes. It is worth
noting that the battery reprocessing industry reports that all sealed lead acid batteries are
reprocessed locally, except for a proportion of SLABs recovered in Western Australia, which are
exported for reprocessing. All other battery chemistries, except for a small quantity of silver
oxide/mercury button cells, are exported for reprocessing.
Study into market share and stocks and flows of handheld batteries in Australia
Sustainable Resource Use Pty Ltd
Page 17
2.3 Data collection Data was collected from stakeholders through a written questionnaire and telephone interviews. An
initial phone discussion was followed by an e‐mailed request for specific data or reports. These
requests were followed up by additional telephone conversations as required. See Appendix D for full
copies of the survey forms used in the project.
Data was collected for each of the phases identified above from a mixture of primary sources and
available literature. Primary sources included:
OEMs and brand owners (sales data)
industry specialists and literature review (use related data)
recovery service/program operators and reprocessors (recovery data).
Another source of data utilised during the study was consumer market research and analysis
commissioned by the Australian Mobile Telecommunications Association (AMTA) with support from
BIWG, and undertaken by Ipsos Australia (2014a; 2014b).
2.4 Data analysis
2.4.1 Overview
A material flow analysis (MFA) model of handheld battery flows was built in MS Excel. For most key flows the MFA provides estimates of handheld battery flows across sales, use and disposal in terms of:
chemistries
single use/rechargeable battery type
level of integration in products
battery sizes
product applications.
2.4.2 Forecasting
While Australia does not have well developed historical data for battery consumption, legislation has
existed in Europe for some time that requires detailed data collection on batteries sales. As
consumption patterns in developed economies are largely similar, this historical trend data was
applied to Australia for the purposes of this study, with modifications for the known specific
attributes of the local market.
See Section 6.1 for a detailed outline of the forecasting method applied in the model.
Study into market share and stocks and flows of handheld batteries in Australia
Sustainable Resource Use Pty Ltd
Page 18
3 HANDHELD BATTERY SALES
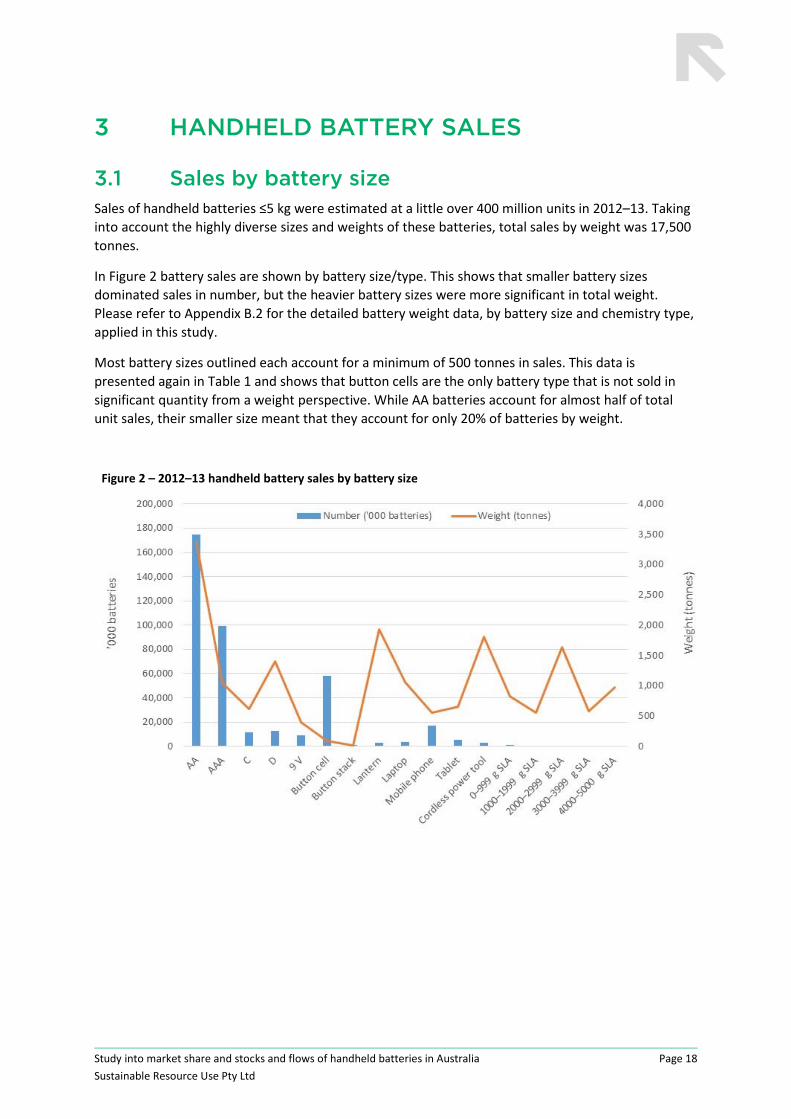
3.1 Sales by battery size Sales of handheld batteries ≤5 kg were estimated at a little over 400 million units in 2012–13. Taking
into account the highly diverse sizes and weights of these batteries, total sales by weight was 17,500
tonnes.
In Figure 2 battery sales are shown by battery size/type. This shows that smaller battery sizes
dominated sales in number, but the heavier battery sizes were more significant in total weight.
Please refer to Appendix B.2 for the detailed battery weight data, by battery size and chemistry type,
applied in this study.
Most battery sizes outlined each account for a minimum of 500 tonnes in sales. This data is
presented again in Table 1 and shows that button cells are the only battery type that is not sold in
significant quantity from a weight perspective. While AA batteries account for almost half of total
unit sales, their smaller size meant that they account for only 20% of batteries by weight.
Figure 2 – 2012–13 handheld battery sales by battery size

Study into market share and stocks and flows of handheld batteries in Australia
Sustainable Resource Use Pty Ltd
Page 19
Table 1 – 2012–13 handheld battery sales by battery size
Battery size Number Weight
('000 batteries) (tonnes)
AA 175,000 3,380
AAA 99,300 1,050
C 11,400 620
D 12,500 1,400
9 V 8,900 390
Button cell 58,200 90
Button stack 900 10
Lantern 2,900 1,930
Laptop 3,300 1,060
Mobile phone 17,300 560
Tablet 5,200 650
Cordless power tool 2,800 1,810
0–999 g SLA 1,200 820
1000–1999 g SLA 400 550
2000–2999 g SLA 600 1,630
3000–3999 g SLA 200 580
4000–5000 g SLA 200 970
Aggregated battery sizes 0 0
Other battery size 100 0
Totals 400,400 17,500
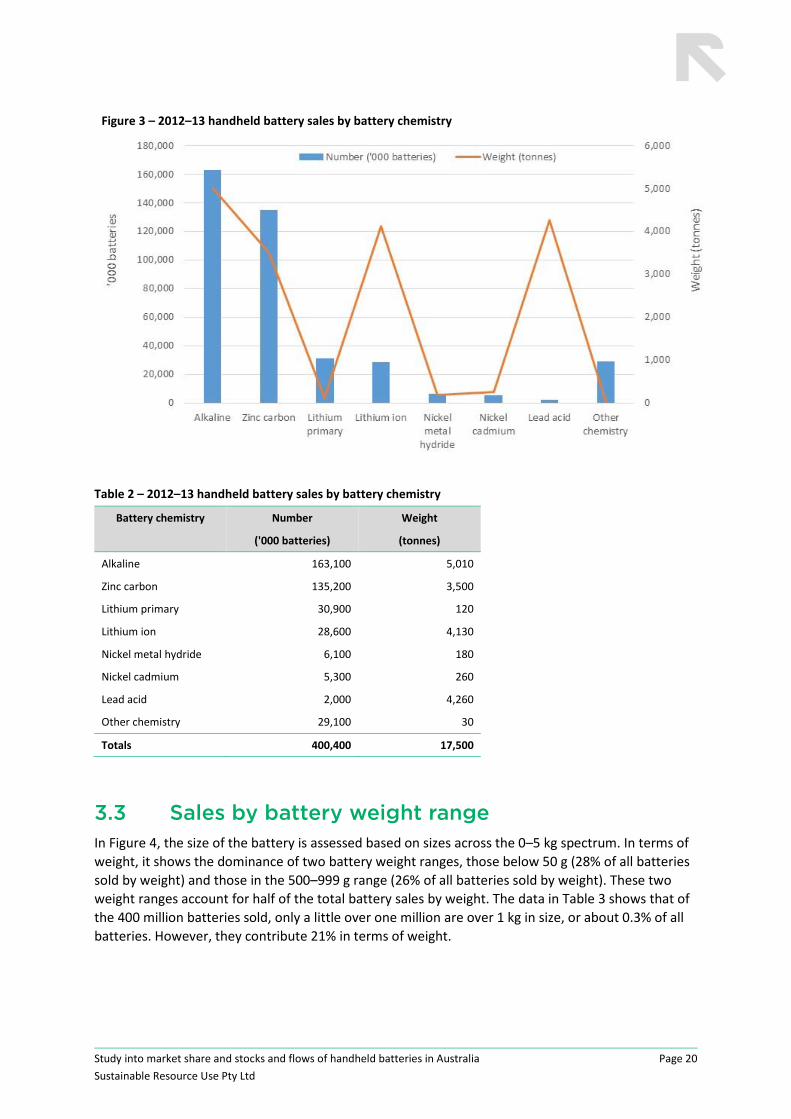
3.2 Sales by battery chemistry Analysis of battery sales by chemistry shows again that the alkaline and zinc carbon batteries, while
dominant in units are less dominant by weight. Figure 3 shows that lithium ion and lead acid are
linked to larger battery applications and therefore have a more significant share of battery sales by
weight. Nickel metal hydride and nickel cadmium batteries make up smaller and declining shares of
total battery sales. Alkaline and zinc carbon batteries used in smaller formats, account for almost half
of total sales by weight.
Study into market share and stocks and flows of handheld batteries in Australia
Sustainable Resource Use Pty Ltd
Page 20
Figure 3 – 2012–13 handheld battery sales by battery chemistry
Table 2 – 2012–13 handheld battery sales by battery chemistry
Battery chemistry Number Weight
('000 batteries) (tonnes)
Alkaline 163,100 5,010
Zinc carbon 135,200 3,500
Lithium primary 30,900 120
Lithium ion 28,600 4,130
Nickel metal hydride 6,100 180
Nickel cadmium 5,300 260
Lead acid 2,000 4,260
Other chemistry 29,100 30
Totals 400,400 17,500
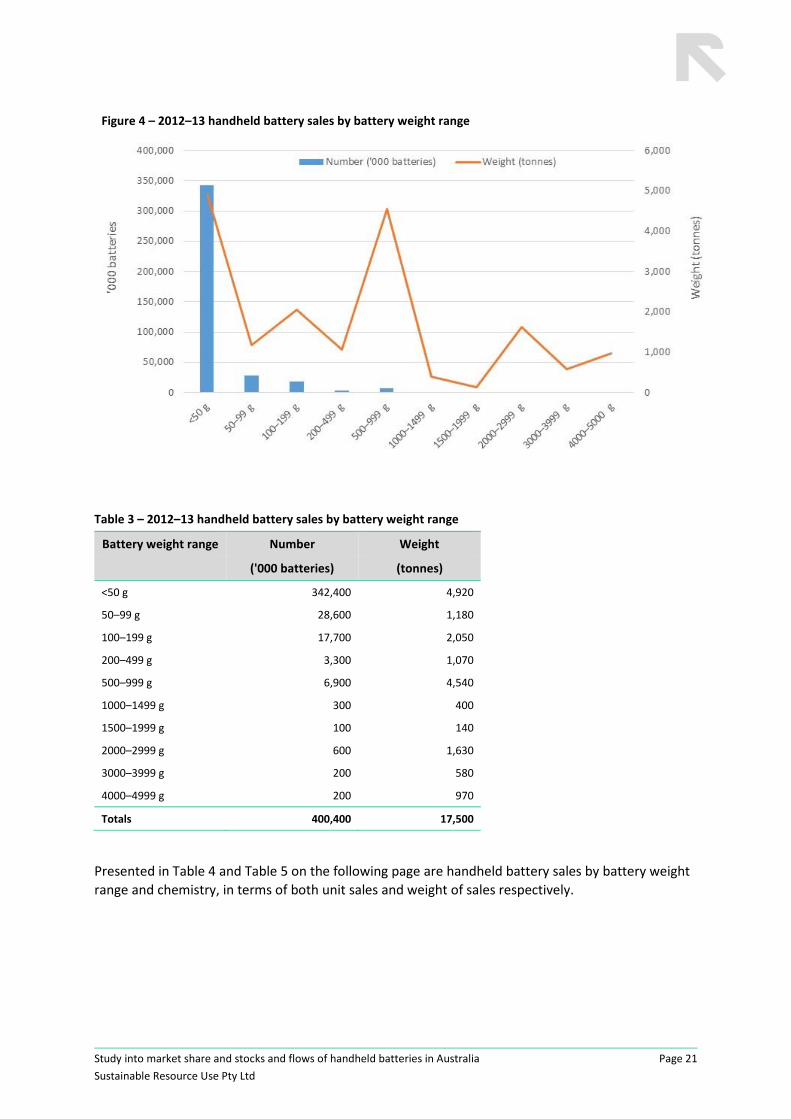
3.3 Sales by battery weight range In Figure 4, the size of the battery is assessed based on sizes across the 0–5 kg spectrum. In terms of
weight, it shows the dominance of two battery weight ranges, those below 50 g (28% of all batteries
sold by weight) and those in the 500–999 g range (26% of all batteries sold by weight). These two
weight ranges account for half of the total battery sales by weight. The data in Table 3 shows that of
the 400 million batteries sold, only a little over one million are over 1 kg in size, or about 0.3% of all
batteries. However, they contribute 21% in terms of weight.
Study into market share and stocks and flows of handheld batteries in Australia
Sustainable Resource Use Pty Ltd
Page 21
Figure 4 – 2012–13 handheld battery sales by battery weight range
Table 3 – 2012–13 handheld battery sales by battery weight range
Battery weight range Number Weight
('000 batteries) (tonnes)
<50 g 342,400 4,920
50–99 g 28,600 1,180
100–199 g 17,700 2,050
200–499 g 3,300 1,070
500–999 g 6,900 4,540
1000–1499 g 300 400
1500–1999 g 100 140
2000–2999 g 600 1,630
3000–3999 g 200 580
4000–4999 g 200 970
Totals 400,400 17,500
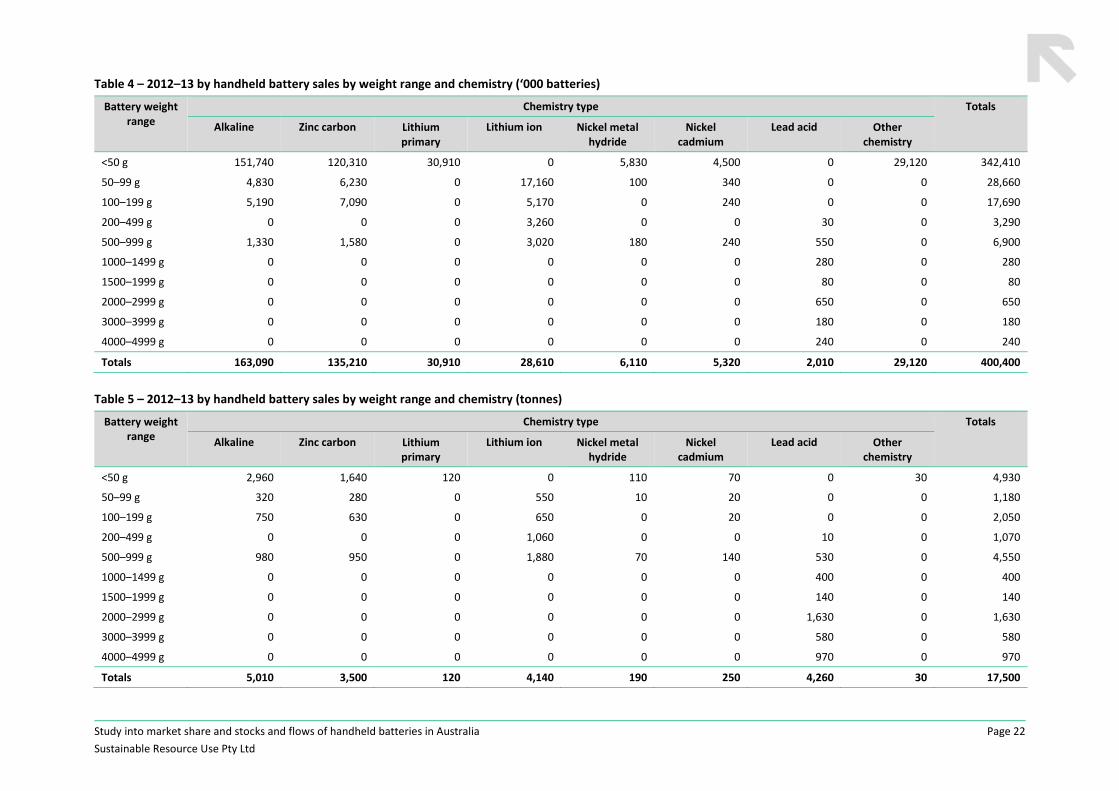
Presented in Table 4 and Table 5 on the following page are handheld battery sales by battery weight
range and chemistry, in terms of both unit sales and weight of sales respectively.
Study into market share and stocks and flows of handheld batteries in Australia
Sustainable Resource Use Pty Ltd
Page 22
Table 4 – 2012–13 by handheld battery sales by weight range and chemistry (‘000 batteries)
Battery weight range
Chemistry type Totals
Alkaline Zinc carbon Lithium primary
Lithium ion Nickel metal hydride
Nickel cadmium
Lead acid Other chemistry
<50 g 151,740 120,310 30,910 0 5,830 4,500 0 29,120 342,410
50–99 g 4,830 6,230 0 17,160 100 340 0 0 28,660
100–199 g 5,190 7,090 0 5,170 0 240 0 0 17,690
200–499 g 0 0 0 3,260 0 0 30 0 3,290
500–999 g 1,330 1,580 0 3,020 180 240 550 0 6,900
1000–1499 g 0 0 0 0 0 0 280 0 280
1500–1999 g 0 0 0 0 0 0 80 0 80
2000–2999 g 0 0 0 0 0 0 650 0 650
3000–3999 g 0 0 0 0 0 0 180 0 180
4000–4999 g 0 0 0 0 0 0 240 0 240
Totals 163,090 135,210 30,910 28,610 6,110 5,320 2,010 29,120 400,400
Table 5 – 2012–13 by handheld battery sales by weight range and chemistry (tonnes)
Battery weight range
Chemistry type Totals
Alkaline Zinc carbon Lithium primary
Lithium ion Nickel metal hydride
Nickel cadmium
Lead acid Other chemistry
<50 g 2,960 1,640 120 0 110 70 0 30 4,930
50–99 g 320 280 0 550 10 20 0 0 1,180
100–199 g 750 630 0 650 0 20 0 0 2,050
200–499 g 0 0 0 1,060 0 0 10 0 1,070
500–999 g 980 950 0 1,880 70 140 530 0 4,550
1000–1499 g 0 0 0 0 0 0 400 0 400
1500–1999 g 0 0 0 0 0 0 140 0 140
2000–2999 g 0 0 0 0 0 0 1,630 0 1,630
3000–3999 g 0 0 0 0 0 0 580 0 580
4000–4999 g 0 0 0 0 0 0 970 0 970
Totals 5,010 3,500 120 4,140 190 250 4,260 30 17,500
Study into market share and stocks and flows of handheld batteries in Australia
Sustainable Resource Use Pty Ltd
Page 23
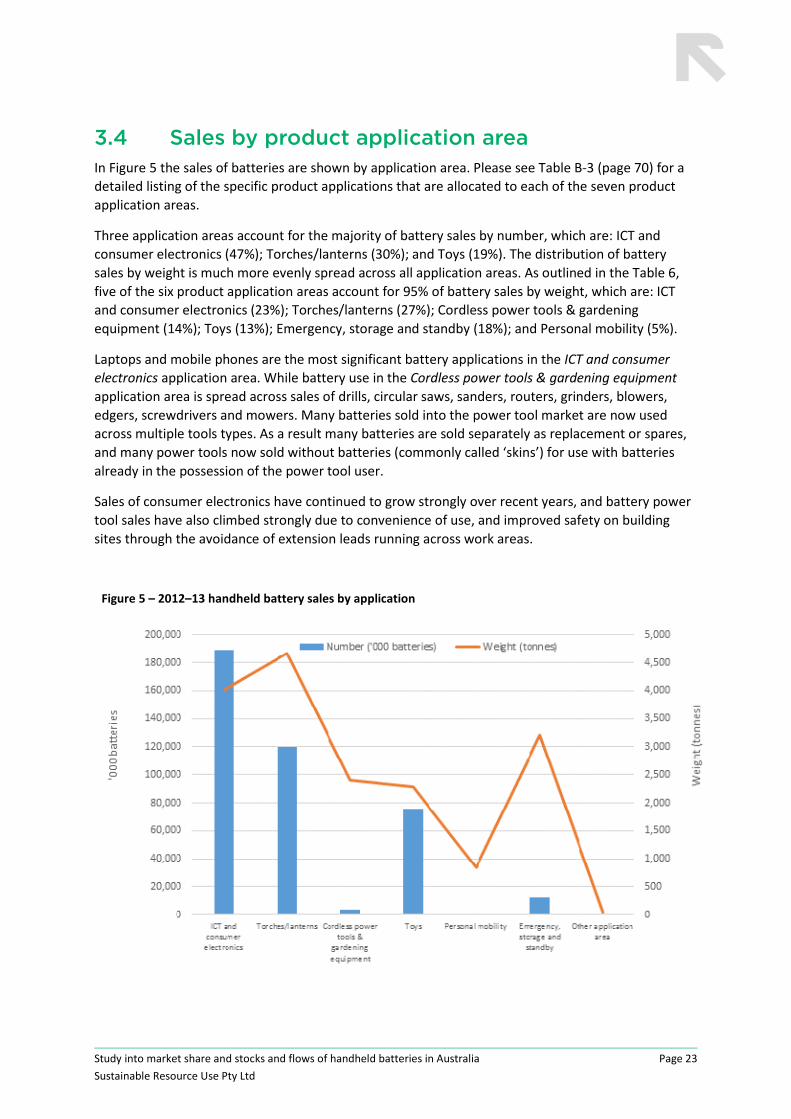
3.4 Sales by product application area In Figure 5 the sales of batteries are shown by application area. Please see Table B‐3 (page 70) for a
detailed listing of the specific product applications that are allocated to each of the seven product
application areas.
Three application areas account for the majority of battery sales by number, which are: ICT and
consumer electronics (47%); Torches/lanterns (30%); and Toys (19%). The distribution of battery
sales by weight is much more evenly spread across all application areas. As outlined in the Table 6,
five of the six product application areas account for 95% of battery sales by weight, which are: ICT
and consumer electronics (23%); Torches/lanterns (27%); Cordless power tools & gardening
equipment (14%); Toys (13%); Emergency, storage and standby (18%); and Personal mobility (5%).
Laptops and mobile phones are the most significant battery applications in the ICT and consumer
electronics application area. While battery use in the Cordless power tools & gardening equipment
application area is spread across sales of drills, circular saws, sanders, routers, grinders, blowers,
edgers, screwdrivers and mowers. Many batteries sold into the power tool market are now used
across multiple tools types. As a result many batteries are sold separately as replacement or spares,
and many power tools now sold without batteries (commonly called ‘skins’) for use with batteries
already in the possession of the power tool user.
Sales of consumer electronics have continued to grow strongly over recent years, and battery power
tool sales have also climbed strongly due to convenience of use, and improved safety on building
sites through the avoidance of extension leads running across work areas.
Figure 5 – 2012–13 handheld battery sales by application
Study into market share and stocks and flows of handheld batteries in Australia
Sustainable Resource Use Pty Ltd
Page 24
Table 6 – 2012–13 handheld battery sales by application
Battery size range Number Weight
('000 batteries) (tonnes)
ICT and consumer electronics 189,100 4,020
Torches/lanterns 119,700 4,660
Cordless power tools & gardening equipment 3,600 2,410
Toys 75,500 2,280
Personal mobility 200 850
Emergency, storage and standby 12,300 3,210
Other application area >100 50
Totals 400,400 17,500
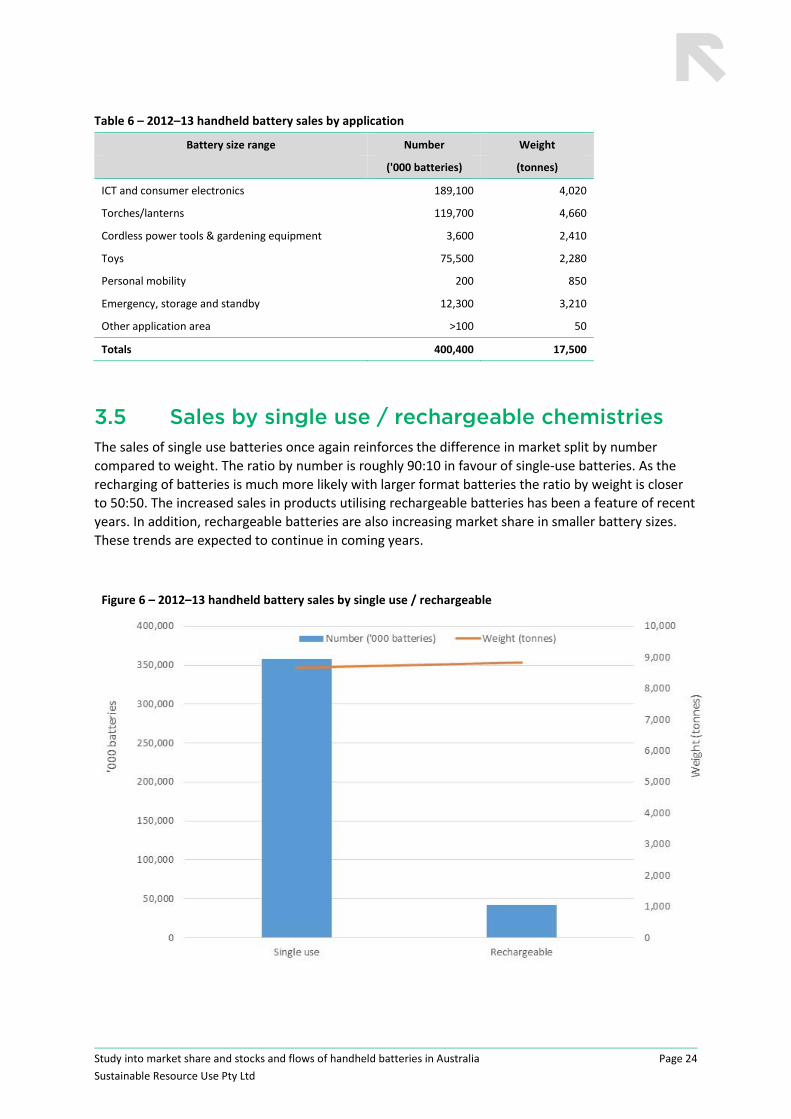
3.5 Sales by single use / rechargeable chemistries The sales of single use batteries once again reinforces the difference in market split by number
compared to weight. The ratio by number is roughly 90:10 in favour of single‐use batteries. As the
recharging of batteries is much more likely with larger format batteries the ratio by weight is closer
to 50:50. The increased sales in products utilising rechargeable batteries has been a feature of recent
years. In addition, rechargeable batteries are also increasing market share in smaller battery sizes.
These trends are expected to continue in coming years.
Figure 6 – 2012–13 handheld battery sales by single use / rechargeable
Study into market share and stocks and flows of handheld batteries in Australia
Sustainable Resource Use Pty Ltd
Page 25
Table 7 – 2012–13 handheld battery sales by single use / rechargeable
Battery size Number Weight Weight
('000 batteries) (tonnes) (%)
Single use 358,300 8,660 49.5%
Rechargeable 42,000 8,830 50.5%
Totals 400,300 17,490 100.0%
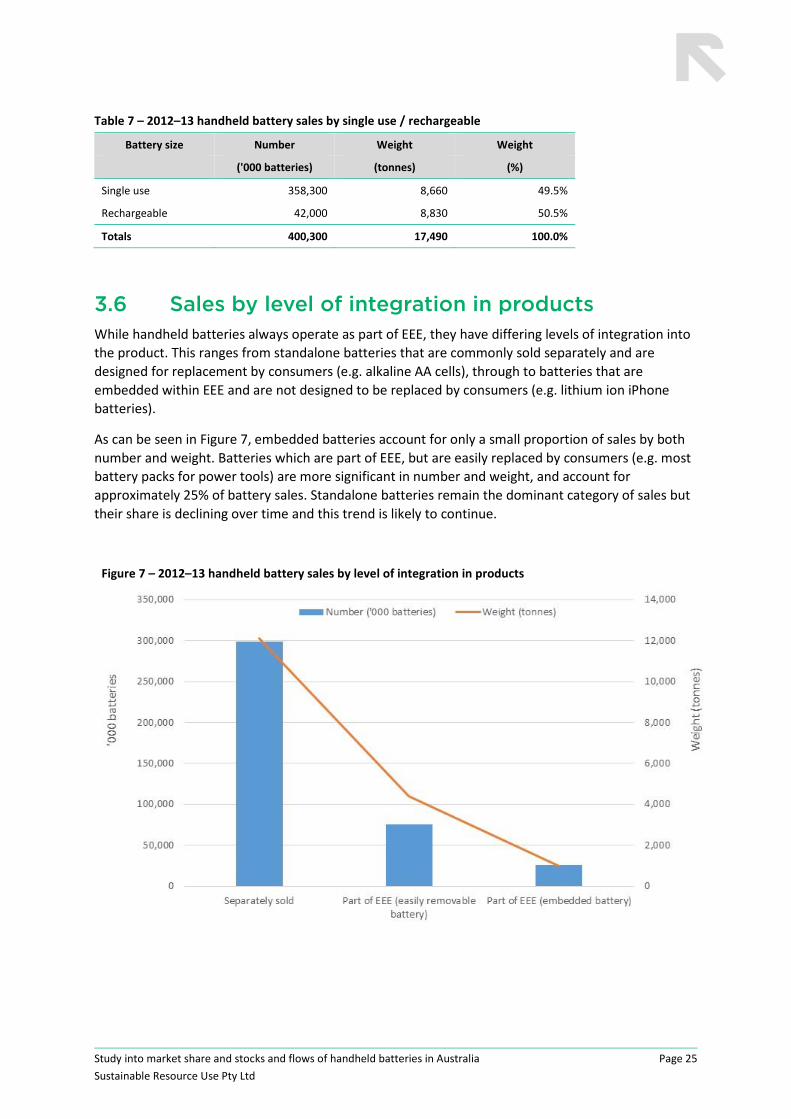
3.6 Sales by level of integration in products While handheld batteries always operate as part of EEE, they have differing levels of integration into
the product. This ranges from standalone batteries that are commonly sold separately and are
designed for replacement by consumers (e.g. alkaline AA cells), through to batteries that are
embedded within EEE and are not designed to be replaced by consumers (e.g. lithium ion iPhone
batteries).
As can be seen in Figure 7, embedded batteries account for only a small proportion of sales by both
number and weight. Batteries which are part of EEE, but are easily replaced by consumers (e.g. most
battery packs for power tools) are more significant in number and weight, and account for
approximately 25% of battery sales. Standalone batteries remain the dominant category of sales but
their share is declining over time and this trend is likely to continue.
Figure 7 – 2012–13 handheld battery sales by level of integration in products
Study into market share and stocks and flows of handheld batteries in Australia
Sustainable Resource Use Pty Ltd
Page 26
Table 8 – 2012–13 handheld battery sales by level of integration in products
Battery size Number Weight
('000 batteries) (tonnes)
Separately sold 298,800 12,110
Part of EEE (easily removable battery) 75,300 4,390
Part of EEE (embedded battery) 26,300 990
Totals 400,400 17,490
3.7 Battery imports by Customs Tariff Code All batteries included in the scope of this study are currently imported into Australia whether as a
standalone product or included in EEE. Table 9 shows the 20 largest import categories by imported
weight of battery.
The data presented in Table 9 is a summary of selected Combined Australian Customs Tariff
Nomenclature and Statistical Classification (the Customs Tariff) codes. The Customs Tariff coding
system is based on the international Harmonized Commodity Description and Coding System (HS).
Australia extends the HS to produce the Customs Tariff, which provides a finer level of detail than the
international HS system. At the 10‐digit level, which relates to imports only, the classification is also
known as the Harmonized Tariff Item Statistical Code (HTISC).
Table 9 – 2012–13 handheld battery and battery containing equipment imports (number and weight)
Customs Tariff Code
Description Imported items (number)
Imported battery
weight(kg)
8506100069 Manganese dioxide primary cells and primary batteries 202,456,342 4,186,918
8507200081 Lead‐acid type electric accumulators (excl machinery starting, lighting and ignition batteries)
2,701,589 4,002,653
8471300033 Laptops, notebooks and palmtops, between 1kg and 3kg 2,418,330 791,571
8471300031 Laptops, notebooks and palmtops, <1kg 3,780,428 481,329
8517120010 Telephones for cellular networks or for other wireless networks 11,974,379 383,180
8513100004 Portable electric lamps using own source of energy (excl. lighting or signalling equipment for cycles or motor vehicles)
14,339,244 299,066
8508110019 Vacuum cleaner <1500W and <20 L with a self‐contained electric motor
664,238 277,147
9503009932 Battery operated toys 7,612,953 216,969
8467290050 Hand held blowers, sweepers or vacuum with self‐contained electric motor
358,364 216,467
8467210023 Battery powered drills: drill bit <13mm diameter 334,888 212,933
8467290051 Hand held grinders with self‐contained electric motor 639,898 203,434
8525801019 Digital cameras 2,714,805 188,744
8467220043 Hand held circular with self‐contained electric motor 476,377 181,738
8471300034 Laptops, notebooks and palmtops, between 3kg and 10kg 509,863 166,889
Study into market share and stocks and flows of handheld batteries in Australia
Sustainable Resource Use Pty Ltd
Page 27
Customs Tariff Code
Description Imported items (number)
Imported battery
weight(kg)
8713900002 Invalid carriages (excl. those not mechanically propelled) 20,203 162,297
8467290057 Hand held screwdrivers with self‐contained electric motor 402,806 153,670
8467290058 Hand held garden edgers or trimmers with self‐contained electric motor
469,418 149,236
8467290056 Hand held sanders and polishers with self‐contained electric motor (excl. orbital sanders and polishers)
458,880 145,886
8467290059 Other hand held machine‐tools with self‐contained electric motor 1,110,912 141,271
9503008029 Toys & models, incorporating a motor 4,909,303 139,915
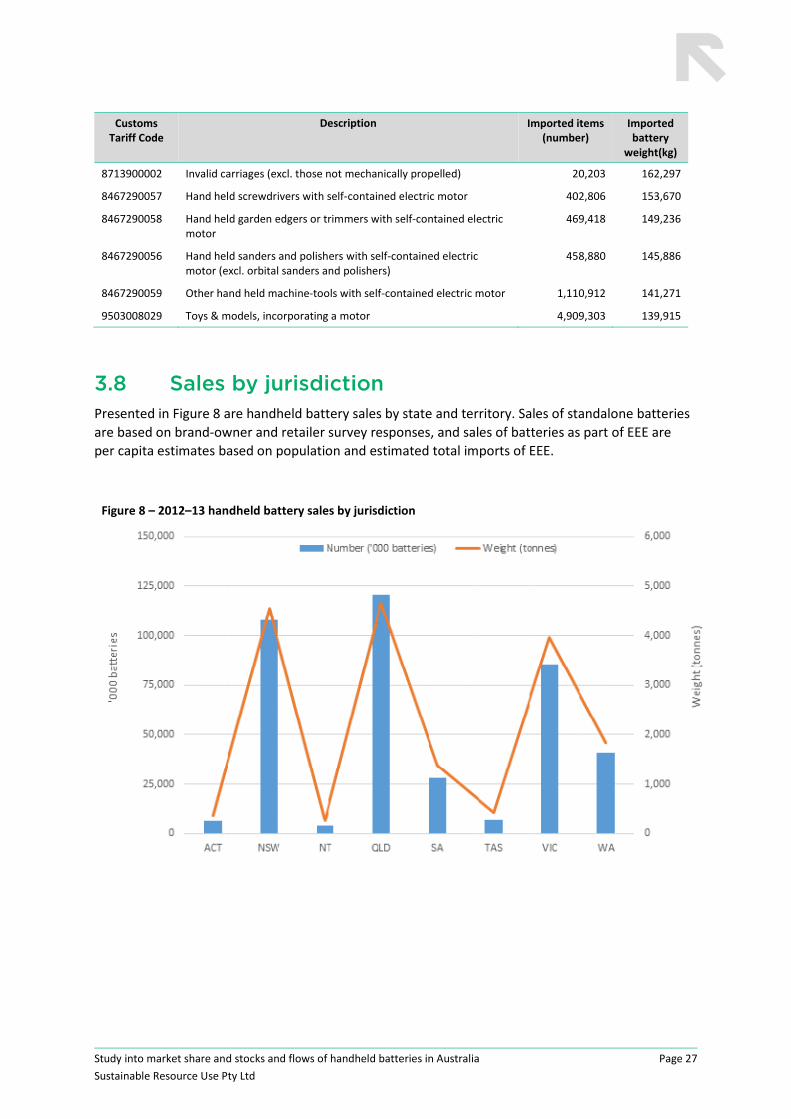
3.8 Sales by jurisdiction Presented in Figure 8 are handheld battery sales by state and territory. Sales of standalone batteries
are based on brand‐owner and retailer survey responses, and sales of batteries as part of EEE are
per capita estimates based on population and estimated total imports of EEE.
Figure 8 – 2012–13 handheld battery sales by jurisdiction

Study into market share and stocks and flows of handheld batteries in Australia
Sustainable Resource Use Pty Ltd
Page 28
Table 10 – 2012–13 handheld battery sales by jurisdiction (by number and weight)
Battery chemistry Number Weight
('000 batteries) (tonnes)
ACT 6,200 370
NSW 107,600 4,550
NT 4,100 260
QLD 120,800 4,660
SA 28,300 1,390
TAS 6,900 440
VIC 85,400 3,970
WA 41,000 1,840
Totals 400,400 17,500
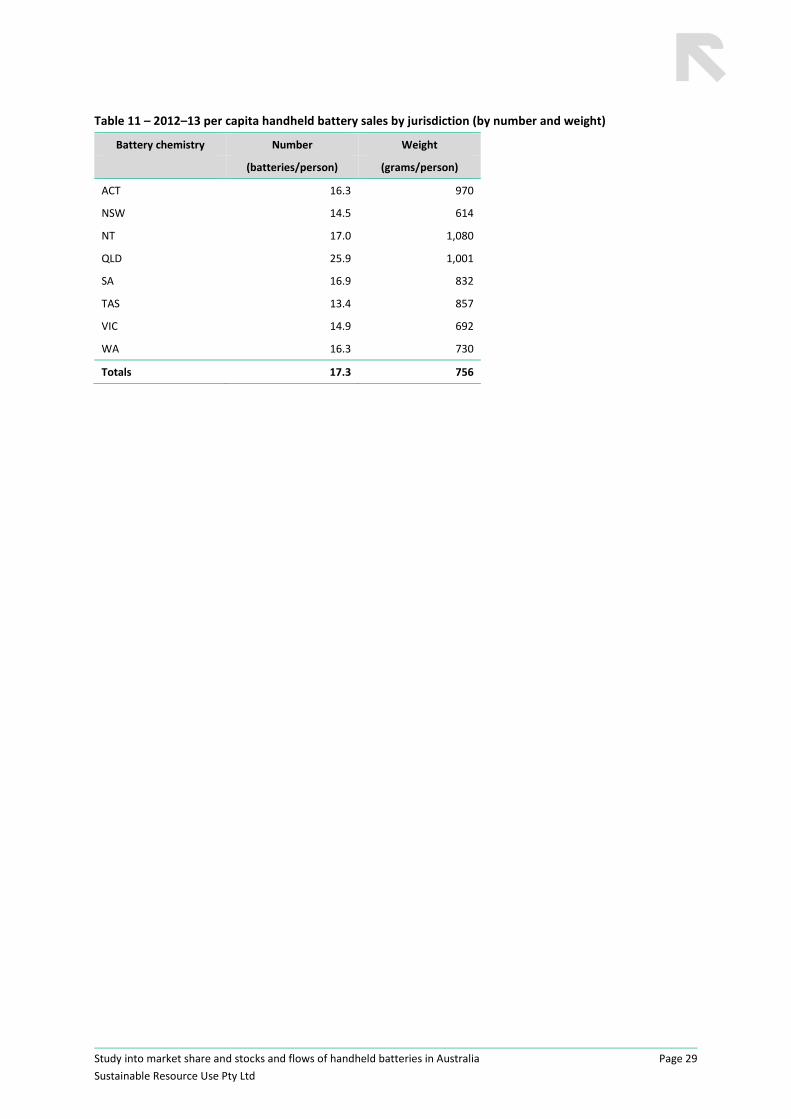
Presented in Figure 9 and Table 11 are per capita handheld battery sales by jurisdiction.
Consumption of batteries is relatively high in Queensland based on reported sales of standalone
batteries, which are primarily sold through supermarkets and other grocery channels. The reason for
higher standalone battery consumption in Queensland is uncertain, but may be related to a greater
level of emergency preparedness, or a higher per capita rate of camping or other outdoor activities.
The high per capita weight of battery sales in the Northern Territory is due to a relatively high
reported rate of sales of sealed lead acid batteries in this jurisdiction.
Figure 9 – 2012–13 per capita handheld battery sales by jurisdiction
Study into market share and stocks and flows of handheld batteries in Australia
Sustainable Resource Use Pty Ltd
Page 29
Table 11 – 2012–13 per capita handheld battery sales by jurisdiction (by number and weight)
Battery chemistry Number Weight
(batteries/person) (grams/person)
ACT 16.3 970
NSW 14.5 614
NT 17.0 1,080
QLD 25.9 1,001
SA 16.9 832
TAS 13.4 857
VIC 14.9 692
WA 16.3 730
Totals 17.3 756
Study into market share and stocks and flows of handheld batteries in Australia
Sustainable Resource Use Pty Ltd
Page 30
4 HANDHELD BATTERY USE AND STORAGE
This section of the report presents estimates of the stocks of battery types in use and storage across
Australia. The estimates are based on 2012–13 import and sales data, along with estimates of past
consumption levels and forecast consumption to provide trends over a ten year period from 2009–10
to 2019–20. Also incorporated into the calculations are estimates of the lifespans of batteries of
different chemistries across the different types of application. The modelling provides estimates of
the total number and weight of batteries that are in use in Australia each year, taking into account
the quantities that each year enter into service, and reach end‐of‐life, across the modelled
timeframe.
4.1 Battery use and storage periods Detailed data on the period of time between battery purchase and eventual disposal into formal
waste streams is provided in Appendix B. For the purposes of this study this period between
purchase and disposal is described as the ‘use phase’ and includes a time allowance for any storage
of the battery by the consumer after the active use period of the battery.
By number the majority of batteries are single use, and are typically estimated as having a use phase
of 1.8 years. Australian consumer market research (Ipsos, 2014a; Ipsos, 2014b) has estimated that
around 55 million single use batteries are used (flat/not working) and are in storage in Australian
households. Comparing this with the 360 million single use battery sales in Australia in 2012–13,
indicates that used single use batteries are on average stored for a month or two by consumers prior
to disposal into formal waste streams.
Other batteries, for example rechargeable nickel cadmium batteries, are estimated as having a use
phase of ten years or more, and are on average stored by consumers for much longer periods
following the active use period of the battery, or the product with the integrated battery.
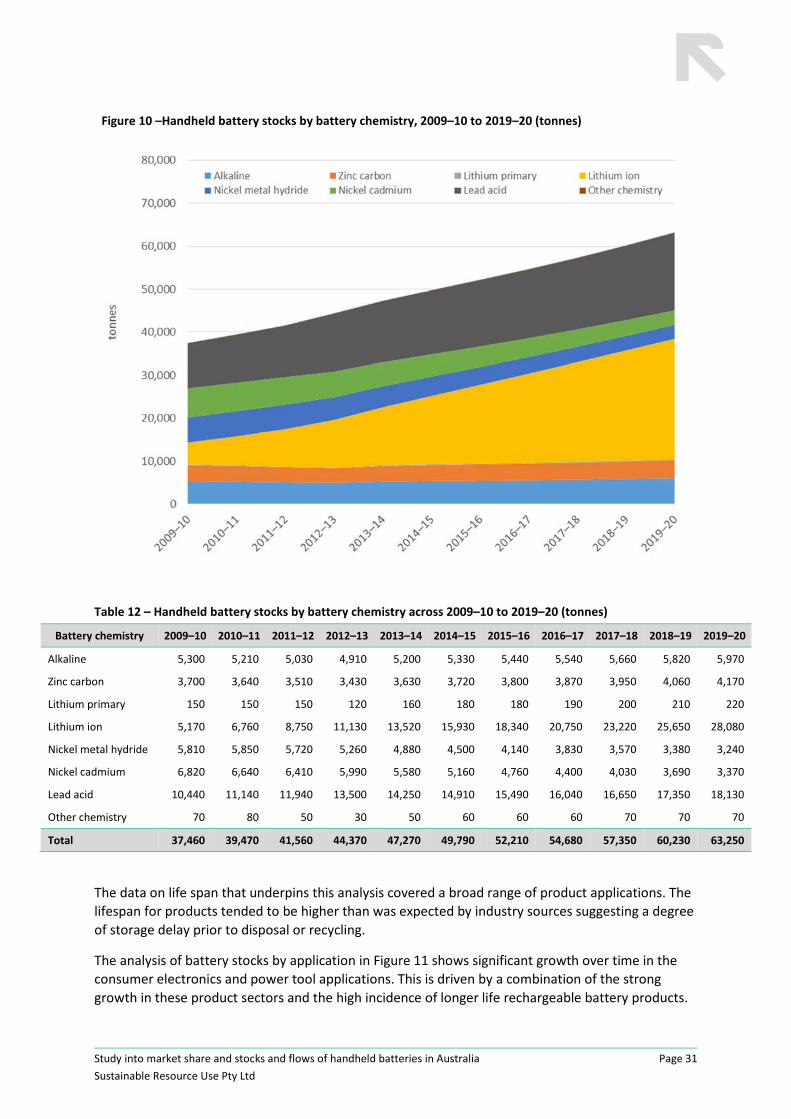
4.2 Batteries in use (stocks) Figure 10 shows the stocks of batteries by battery chemistry. Some chemistries are related to single
use applications which have shorter lifespans, and others to reusable longer life applications. Stocks
of longer lived batteries accumulate in use, while shorter lived batteries relatively quickly reach end‐
of‐life and significant stocks do not accumulate. This is further influenced by trends in battery
chemistry which shows a strong growth in lithium ion and declines in other types such as nickel metal
hydride and nickel cadmium.
Study into market share and stocks and flows of handheld batteries in Australia
Sustainable Resource Use Pty Ltd
Page 31
Figure 10 –Handheld battery stocks by battery chemistry, 2009–10 to 2019–20 (tonnes)
Table 12 – Handheld battery stocks by battery chemistry across 2009–10 to 2019–20 (tonnes)
Battery chemistry 2009–10 2010–11 2011–12 2012–13 2013–14 2014–15 2015–16 2016–17 2017–18 2018–19 2019–20
Alkaline 5,300 5,210 5,030 4,910 5,200 5,330 5,440 5,540 5,660 5,820 5,970
Zinc carbon 3,700 3,640 3,510 3,430 3,630 3,720 3,800 3,870 3,950 4,060 4,170
Lithium primary 150 150 150 120 160 180 180 190 200 210 220
Lithium ion 5,170 6,760 8,750 11,130 13,520 15,930 18,340 20,750 23,220 25,650 28,080
Nickel metal hydride 5,810 5,850 5,720 5,260 4,880 4,500 4,140 3,830 3,570 3,380 3,240
Nickel cadmium 6,820 6,640 6,410 5,990 5,580 5,160 4,760 4,400 4,030 3,690 3,370
Lead acid 10,440 11,140 11,940 13,500 14,250 14,910 15,490 16,040 16,650 17,350 18,130
Other chemistry 70 80 50 30 50 60 60 60 70 70 70
Total 37,460 39,470 41,560 44,370 47,270 49,790 52,210 54,680 57,350 60,230 63,250
The data on life span that underpins this analysis covered a broad range of product applications. The
lifespan for products tended to be higher than was expected by industry sources suggesting a degree
of storage delay prior to disposal or recycling.
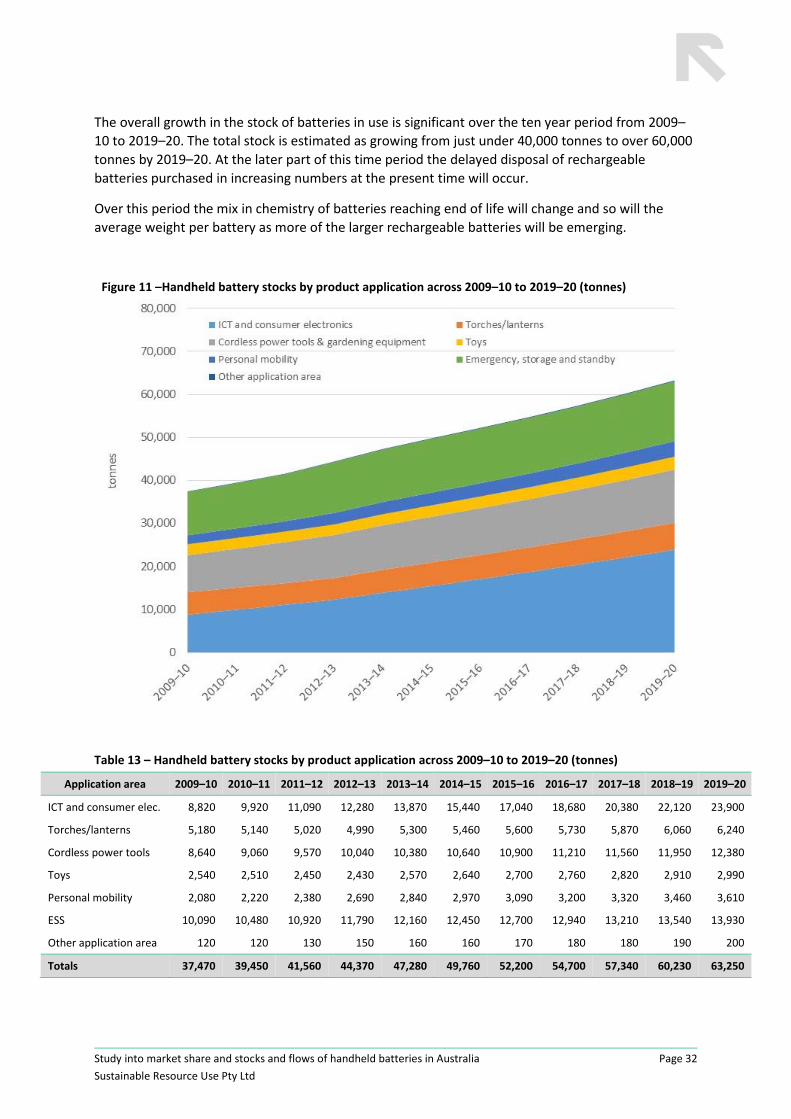
The analysis of battery stocks by application in Figure 11 shows significant growth over time in the
consumer electronics and power tool applications. This is driven by a combination of the strong
growth in these product sectors and the high incidence of longer life rechargeable battery products.
Study into market share and stocks and flows of handheld batteries in Australia
Sustainable Resource Use Pty Ltd
Page 32
The overall growth in the stock of batteries in use is significant over the ten year period from 2009–
10 to 2019–20. The total stock is estimated as growing from just under 40,000 tonnes to over 60,000
tonnes by 2019–20. At the later part of this time period the delayed disposal of rechargeable
batteries purchased in increasing numbers at the present time will occur.
Over this period the mix in chemistry of batteries reaching end of life will change and so will the
average weight per battery as more of the larger rechargeable batteries will be emerging.
Figure 11 –Handheld battery stocks by product application across 2009–10 to 2019–20 (tonnes)
Table 13 – Handheld battery stocks by product application across 2009–10 to 2019–20 (tonnes)
Application area 2009–10 2010–11 2011–12 2012–13 2013–14 2014–15 2015–16 2016–17 2017–18 2018–19 2019–20
ICT and consumer elec. 8,820 9,920 11,090 12,280 13,870 15,440 17,040 18,680 20,380 22,120 23,900
Torches/lanterns 5,180 5,140 5,020 4,990 5,300 5,460 5,600 5,730 5,870 6,060 6,240
Cordless power tools 8,640 9,060 9,570 10,040 10,380 10,640 10,900 11,210 11,560 11,950 12,380
Toys 2,540 2,510 2,450 2,430 2,570 2,640 2,700 2,760 2,820 2,910 2,990
Personal mobility 2,080 2,220 2,380 2,690 2,840 2,970 3,090 3,200 3,320 3,460 3,610
ESS 10,090 10,480 10,920 11,790 12,160 12,450 12,700 12,940 13,210 13,540 13,930
Other application area 120 120 130 150 160 160 170 180 180 190 200
Totals 37,470 39,450 41,560 44,370 47,280 49,760 52,200 54,700 57,340 60,230 63,250
Study into market share and stocks and flows of handheld batteries in Australia
Sustainable Resource Use Pty Ltd
Page 33
5 HANDHELD BATTERY END-OF-LIFE DISPOSAL AND RECOVERY
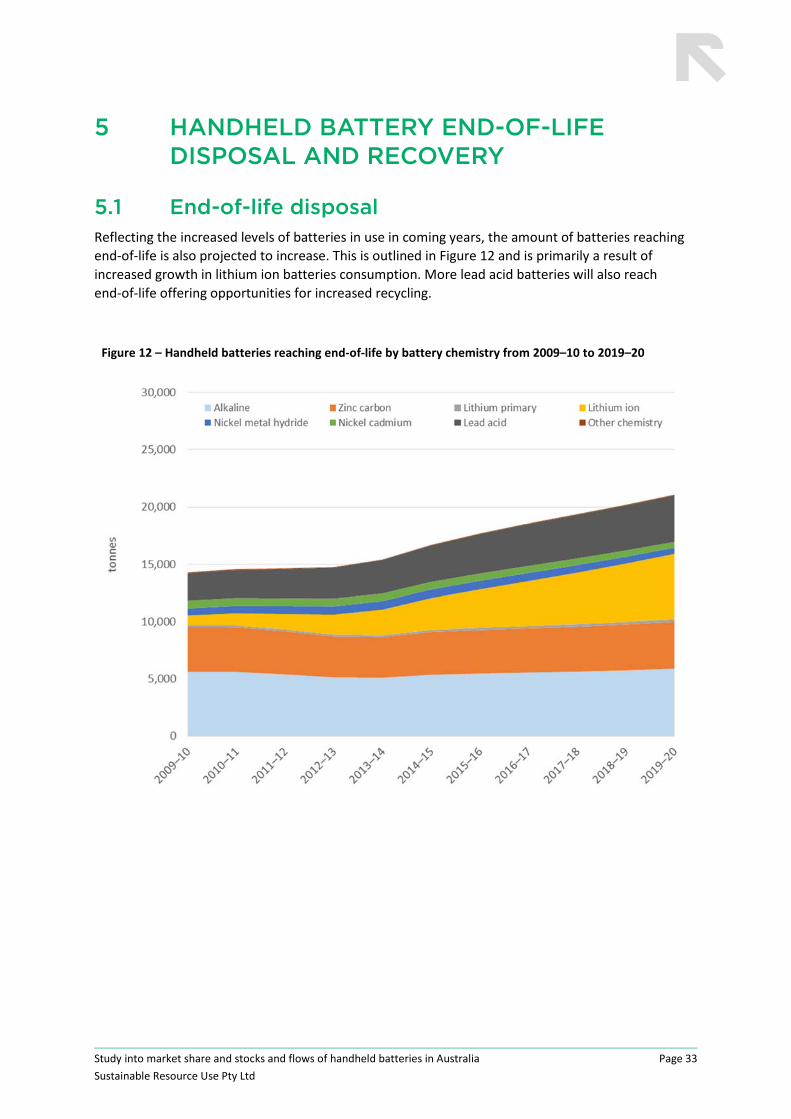
5.1 End-of-life disposal Reflecting the increased levels of batteries in use in coming years, the amount of batteries reaching
end‐of‐life is also projected to increase. This is outlined in Figure 12 and is primarily a result of
increased growth in lithium ion batteries consumption. More lead acid batteries will also reach
end‐of‐life offering opportunities for increased recycling.
Figure 12 – Handheld batteries reaching end‐of‐life by battery chemistry from 2009–10 to 2019–20

Study into market share and stocks and flows of handheld batteries in Australia
Sustainable Resource Use Pty Ltd
Page 34
Table 14 – Handheld batteries reaching end‐of‐life by battery chemistry across 2009–10 to 2019–20 (tonnes)
Battery chemistry 2009–10 2010–11 2011–12 2012–13 2013–14 2014–15 2015–16 2016–17 2017–18 2018–19 2019–20
Alkaline 5,610 5,600 5,390 5,130 5,100 5,350 5,460 5,550 5,630 5,740 5,880
Zinc carbon 3,910 3,910 3,760 3,580 3,560 3,740 3,810 3,870 3,930 4,010 4,110
Lithium primary 150 160 160 150 140 180 190 200 210 220 230
Lithium ion 860 1,060 1,350 1,750 2,240 2,770 3,340 3,910 4,490 5,080 5,680
Nickel metal hydride 620 650 690 720 740 750 740 710 660 600 540
Nickel cadmium 680 680 680 670 670 660 640 620 590 550 510
Lead acid 2,380 2,440 2,540 2,700 2,920 3,180 3,440 3,660 3,810 3,920 4,060
Other chemistry 80 80 70 40 40 50 60 60 60 70 70
Total 14,290 14,580 14,640 14,740 15,410 16,680 17,680 18,580 19,380 20,190 21,080
The overall growth in end‐of‐life batteries reflects the flow through of the trends in sales outlined
earlier. This shows a strong increase in batteries from consumer electronics reaching end‐of‐life.
Overall end‐of‐life totals are projected to increase by around 50% over the period of 2009–10 to
2019–20.
Figure 13 – Handheld battery disposal by application area from 2009–10 to 2019–20
Study into market share and stocks and flows of handheld batteries in Australia
Sustainable Resource Use Pty Ltd
Page 35
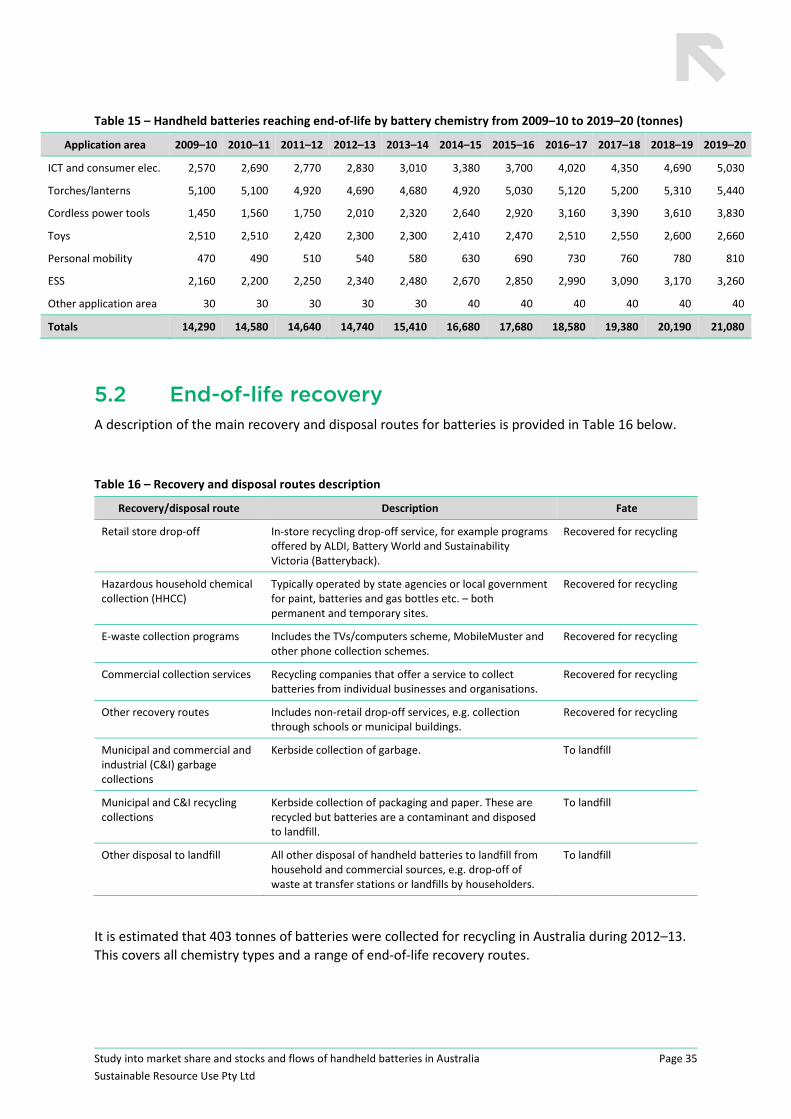
Table 15 – Handheld batteries reaching end‐of‐life by battery chemistry from 2009–10 to 2019–20 (tonnes)
Application area 2009–10 2010–11 2011–12 2012–13 2013–14 2014–15 2015–16 2016–17 2017–18 2018–19 2019–20
ICT and consumer elec. 2,570 2,690 2,770 2,830 3,010 3,380 3,700 4,020 4,350 4,690 5,030
Torches/lanterns 5,100 5,100 4,920 4,690 4,680 4,920 5,030 5,120 5,200 5,310 5,440
Cordless power tools 1,450 1,560 1,750 2,010 2,320 2,640 2,920 3,160 3,390 3,610 3,830
Toys 2,510 2,510 2,420 2,300 2,300 2,410 2,470 2,510 2,550 2,600 2,660
Personal mobility 470 490 510 540 580 630 690 730 760 780 810
ESS 2,160 2,200 2,250 2,340 2,480 2,670 2,850 2,990 3,090 3,170 3,260
Other application area 30 30 30 30 30 40 40 40 40 40 40
Totals 14,290 14,580 14,640 14,740 15,410 16,680 17,680 18,580 19,380 20,190 21,080
5.2 End-of-life recovery A description of the main recovery and disposal routes for batteries is provided in Table 16 below.
Table 16 – Recovery and disposal routes description
Recovery/disposal route Description Fate
Retail store drop‐off In‐store recycling drop‐off service, for example programs offered by ALDI, Battery World and Sustainability Victoria (Batteryback).
Recovered for recycling
Hazardous household chemical collection (HHCC)
Typically operated by state agencies or local government for paint, batteries and gas bottles etc. – both permanent and temporary sites.
Recovered for recycling
E‐waste collection programs Includes the TVs/computers scheme, MobileMuster and other phone collection schemes.
Recovered for recycling
Commercial collection services Recycling companies that offer a service to collect batteries from individual businesses and organisations.
Recovered for recycling
Other recovery routes Includes non‐retail drop‐off services, e.g. collection through schools or municipal buildings.
Recovered for recycling
Municipal and commercial and industrial (C&I) garbage collections
Kerbside collection of garbage. To landfill
Municipal and C&I recycling collections
Kerbside collection of packaging and paper. These are recycled but batteries are a contaminant and disposed to landfill.
To landfill
Other disposal to landfill All other disposal of handheld batteries to landfill from household and commercial sources, e.g. drop‐off of waste at transfer stations or landfills by householders.
To landfill
It is estimated that 403 tonnes of batteries were collected for recycling in Australia during 2012–13.
This covers all chemistry types and a range of end‐of‐life recovery routes.
Study into market share and stocks and flows of handheld batteries in Australia
Sustainable Resource Use Pty Ltd
Page 36
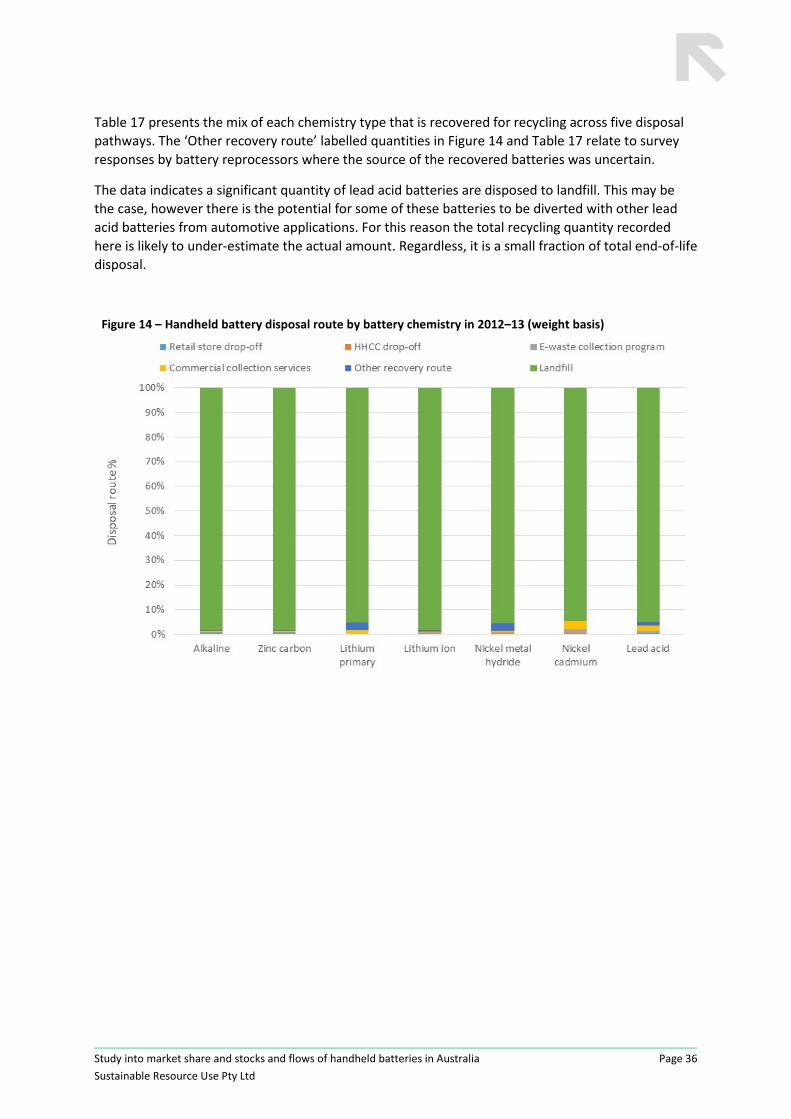
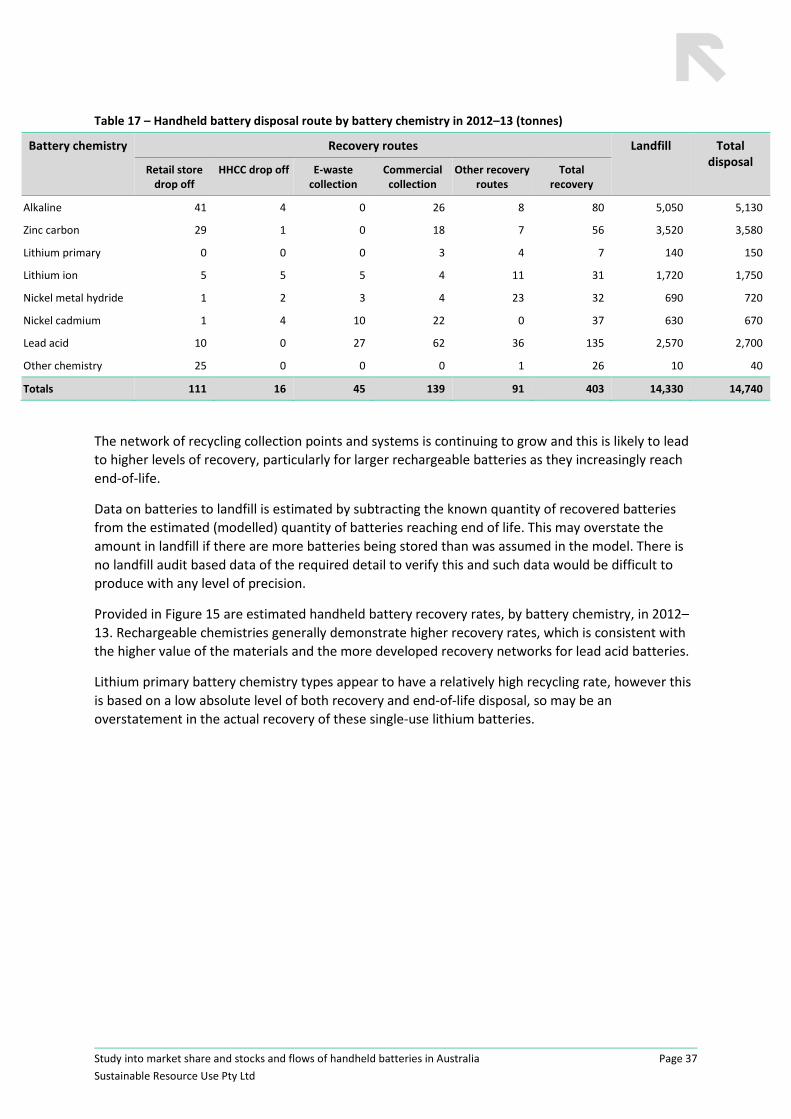
Table 17 presents the mix of each chemistry type that is recovered for recycling across five disposal
pathways. The ‘Other recovery route’ labelled quantities in Figure 14 and Table 17 relate to survey
responses by battery reprocessors where the source of the recovered batteries was uncertain.
The data indicates a significant quantity of lead acid batteries are disposed to landfill. This may be
the case, however there is the potential for some of these batteries to be diverted with other lead
acid batteries from automotive applications. For this reason the total recycling quantity recorded
here is likely to under‐estimate the actual amount. Regardless, it is a small fraction of total end‐of‐life
disposal.
Figure 14 – Handheld battery disposal route by battery chemistry in 2012–13 (weight basis)
Study into market share and stocks and flows of handheld batteries in Australia
Sustainable Resource Use Pty Ltd
Page 37
Table 17 – Handheld battery disposal route by battery chemistry in 2012–13 (tonnes)
Battery chemistry Recovery routes Landfill Total disposal
Retail store drop off
HHCC drop off E‐waste collection
Commercial collection
Other recovery routes
Total recovery
Alkaline 41 4 0 26 8 80 5,050 5,130
Zinc carbon 29 1 0 18 7 56 3,520 3,580
Lithium primary 0 0 0 3 4 7 140 150
Lithium ion 5 5 5 4 11 31 1,720 1,750
Nickel metal hydride 1 2 3 4 23 32 690 720
Nickel cadmium 1 4 10 22 0 37 630 670
Lead acid 10 0 27 62 36 135 2,570 2,700
Other chemistry 25 0 0 0 1 26 10 40
Totals 111 16 45 139 91 403 14,330 14,740
The network of recycling collection points and systems is continuing to grow and this is likely to lead
to higher levels of recovery, particularly for larger rechargeable batteries as they increasingly reach
end‐of‐life.
Data on batteries to landfill is estimated by subtracting the known quantity of recovered batteries
from the estimated (modelled) quantity of batteries reaching end of life. This may overstate the
amount in landfill if there are more batteries being stored than was assumed in the model. There is
no landfill audit based data of the required detail to verify this and such data would be difficult to
produce with any level of precision.
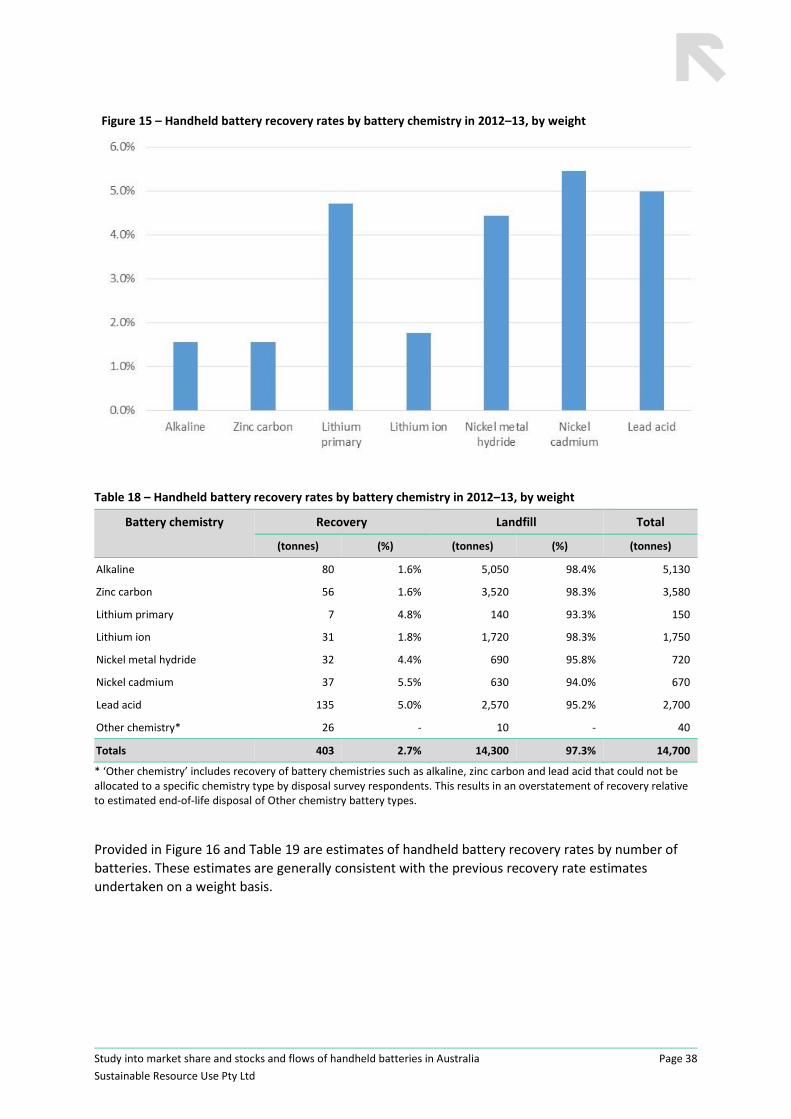
Provided in Figure 15 are estimated handheld battery recovery rates, by battery chemistry, in 2012–
13. Rechargeable chemistries generally demonstrate higher recovery rates, which is consistent with
the higher value of the materials and the more developed recovery networks for lead acid batteries.
Lithium primary battery chemistry types appear to have a relatively high recycling rate, however this
is based on a low absolute level of both recovery and end‐of‐life disposal, so may be an
overstatement in the actual recovery of these single‐use lithium batteries.
Study into market share and stocks and flows of handheld batteries in Australia
Sustainable Resource Use Pty Ltd
Page 38
Figure 15 – Handheld battery recovery rates by battery chemistry in 2012–13, by weight
Table 18 – Handheld battery recovery rates by battery chemistry in 2012–13, by weight
Battery chemistry Recovery Landfill Total
(tonnes) (%) (tonnes) (%) (tonnes)
Alkaline 80 1.6% 5,050 98.4% 5,130
Zinc carbon 56 1.6% 3,520 98.3% 3,580
Lithium primary 7 4.8% 140 93.3% 150
Lithium ion 31 1.8% 1,720 98.3% 1,750
Nickel metal hydride 32 4.4% 690 95.8% 720
Nickel cadmium 37 5.5% 630 94.0% 670
Lead acid 135 5.0% 2,570 95.2% 2,700
Other chemistry* 26 ‐ 10 ‐ 40
Totals 403 2.7% 14,300 97.3% 14,700
* ‘Other chemistry’ includes recovery of battery chemistries such as alkaline, zinc carbon and lead acid that could not be allocated to a specific chemistry type by disposal survey respondents. This results in an overstatement of recovery relative to estimated end‐of‐life disposal of Other chemistry battery types.
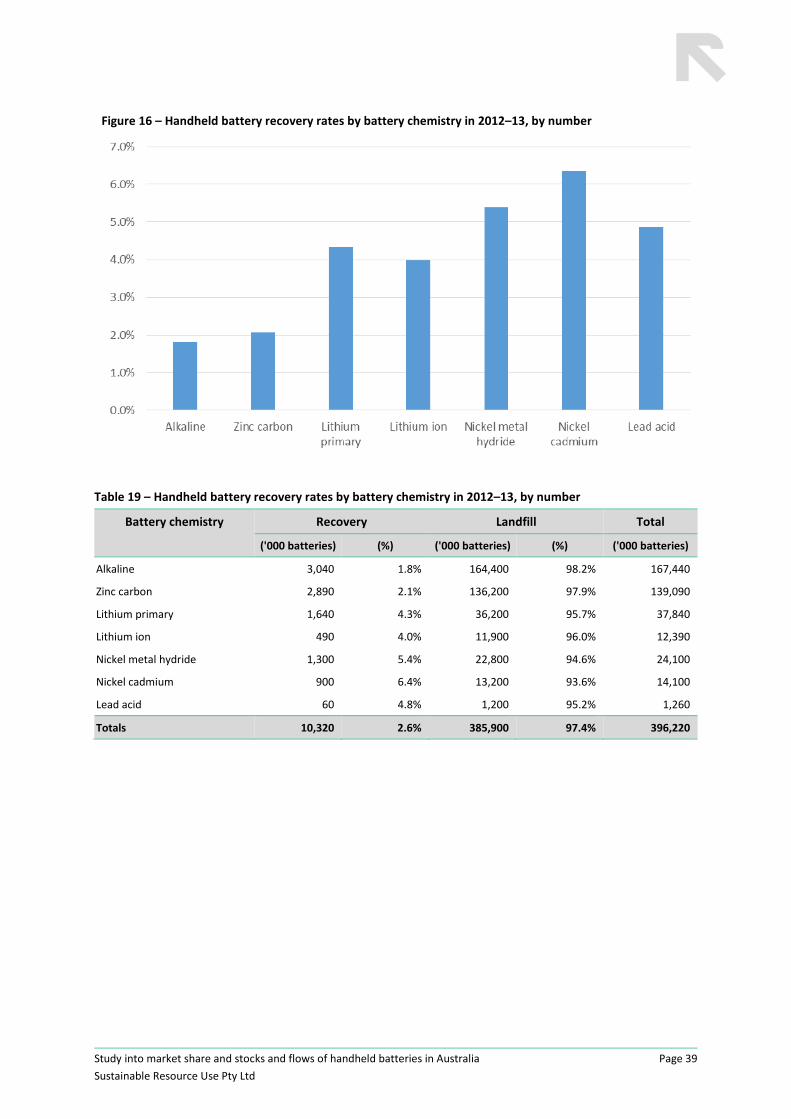
Provided in Figure 16 and Table 19 are estimates of handheld battery recovery rates by number of
batteries. These estimates are generally consistent with the previous recovery rate estimates
undertaken on a weight basis.
Study into market share and stocks and flows of handheld batteries in Australia
Sustainable Resource Use Pty Ltd
Page 39
Figure 16 – Handheld battery recovery rates by battery chemistry in 2012–13, by number
Table 19 – Handheld battery recovery rates by battery chemistry in 2012–13, by number
Battery chemistry Recovery Landfill Total
('000 batteries) (%) ('000 batteries) (%) ('000 batteries)
Alkaline 3,040 1.8% 164,400 98.2% 167,440
Zinc carbon 2,890 2.1% 136,200 97.9% 139,090
Lithium primary 1,640 4.3% 36,200 95.7% 37,840
Lithium ion 490 4.0% 11,900 96.0% 12,390
Nickel metal hydride 1,300 5.4% 22,800 94.6% 24,100
Nickel cadmium 900 6.4% 13,200 93.6% 14,100
Lead acid 60 4.8% 1,200 95.2% 1,260
Totals 10,320 2.6% 385,900 97.4% 396,220
Study into market share and stocks and flows of handheld batteries in Australia
Sustainable Resource Use Pty Ltd
Page 40
6 HANDHELD BATTERY TRENDS
6.1 Approach As limited historical handheld battery sales data is currently available for Australia, battery sales data
from countries with an available history were selected as a basis for the estimation of Australian
handheld battery trends by chemistry type and per capita growth in battery consumption.
Consumption patterns across the developed economies reviewed are largely similar, and this is also
assumed to hold for Australia. While the overseas markets will differ to some degree from Australia,
the large scale trends are likely to be similar.
In Europe, producer responsibility legislation on batteries and Waste Electrical and Electronic
Equipment (WEEE) requires importers and producers to declare the weight (and in most countries
also the number of units) of batteries they place on the market. This information was used to
develop market histories using data released by national battery registers or equivalent organisations
in Belgium (BEBAT, 2013), Germany (GRS, 2003–2012), France (ADEME, 2003–2012) and Switzerland
(INOBAT, 2012). These four countries represent a population of 165 million and their aggregation
should mitigate annual fluctuations observable in smaller markets and any national peculiarities.
The European data has some limitations including:
battery categorisations have changed over time due to Battery Directive 2006/66/EC (portable, automotive, starter)
different countries collect different battery categories and details
quantities of embedded batteries, particularly from earlier data, is significantly less certain than recent data.
For the purpose of applying the European market trend data to the modelling undertaking for this
study, the aggregated European data was adjusted for changes in population (Eurostat, 2014) and
converted to a per capita basis (units and grams per capita).
As this Australian study has collected and estimated detailed sales data for the 2012–13 financial
year the data for this year was used as a reference point to normalise the European market trend
data, by chemistry market share and per capita battery sales, to the Australian market over the 2004
to 2012 period, based on the 2012–13 reference year. Forecasts out to 2019–20 were then
developed based on an estimate of battery sales growth, and changes in battery chemistry market
share that are consistent with those observed in the reference countries over the last few years.
Consideration was also made of the anticipated continuing shifts in battery chemistries, particularly
the ongoing growth in rechargeable lithium based chemistries.
Over the period of 2004 to 2012, battery consumption in the reference European countries increased
from about 17 units per capita to 20 units, an annual growth rate of about 2.4% on a unit basis. By
weight, handheld battery consumption across the reference European countries grew at 0.5% per
annum, from about 610 g per capita in 2004 to 630 g in 2012. It is anticipated that as improved
battery technologies become available, new applications with heavier batteries will accelerate this
growth rate. An estimated growth rate of 3% will lead to consumption of 800 g per capita by 2020 in
the reference European countries. This growth rate was applied to Australian handheld battery
consumption out to 2020.
Study into market share and stocks and flows of handheld batteries in Australia
Sustainable Resource Use Pty Ltd
Page 41
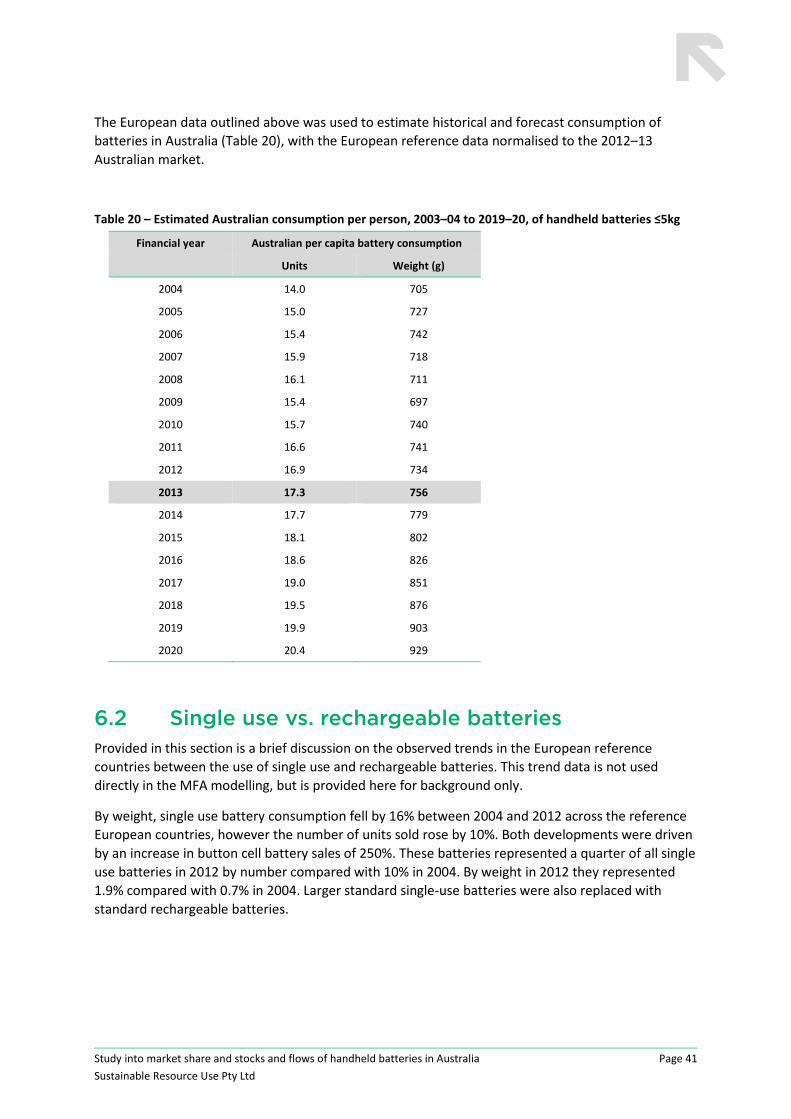
The European data outlined above was used to estimate historical and forecast consumption of
batteries in Australia (Table 20), with the European reference data normalised to the 2012–13
Australian market.
Table 20 – Estimated Australian consumption per person, 2003–04 to 2019–20, of handheld batteries ≤5kg
Financial year Australian per capita battery consumption
Units Weight (g)
2004 14.0 705
2005 15.0 727
2006 15.4 742
2007 15.9 718
2008 16.1 711
2009 15.4 697
2010 15.7 740
2011 16.6 741
2012 16.9 734
2013 17.3 756
2014 17.7 779
2015 18.1 802
2016 18.6 826
2017 19.0 851
2018 19.5 876
2019 19.9 903
2020 20.4 929
6.2 Single use vs. rechargeable batteries Provided in this section is a brief discussion on the observed trends in the European reference
countries between the use of single use and rechargeable batteries. This trend data is not used
directly in the MFA modelling, but is provided here for background only.
By weight, single use battery consumption fell by 16% between 2004 and 2012 across the reference
European countries, however the number of units sold rose by 10%. Both developments were driven
by an increase in button cell battery sales of 250%. These batteries represented a quarter of all single
use batteries in 2012 by number compared with 10% in 2004. By weight in 2012 they represented
1.9% compared with 0.7% in 2004. Larger standard single‐use batteries were also replaced with
standard rechargeable batteries.

Study into market share and stocks and flows of handheld batteries in Australia
Sustainable Resource Use Pty Ltd
Page 42
By contrast, the combined weight of all rechargeable batteries placed on the markets of the
European reference countries increased by about 1.5 times between 2004 and 2012, both by number
and combined weight. While rechargeable battery packs have become significantly larger (the
average weight of a lithium battery increased from 41 g in 2004 to 97 g in 2012), a 250% times
increase in sales numbers of rechargeable button cells hides this trend in the overall number. The
disproportionate weight increase in battery packs was driven mainly by the proliferation of mobile
devices that provided new markets for larger rechargeable batteries.
Due to both these trends, the share of rechargeable batteries of all batteries has continuously
increased both by weight (from 30% in 2004 to 44% in 2012) and number (from 9% in 2004 to 13% in
2012). The share of single use batteries has declined correspondingly.
As improved battery technologies drive the widespread adoption of cordless power tools and garden
equipment and enable new applications in these and other sectors (small personal mobility, standby,
power packs and small energy storage), it is expected that these trends will continue until the
innovation pipeline dries up and the market for these products is saturated, which appears unlikely
before 2020.
6.3 Chemistries Summarised here are the estimated market trends for battery consumption in Australia by chemistry
type (Table 21). The chemistry market share trends are based on European data, as described in
Section 6.1, with the trends normalised to the survey data for the 2012–13 year.
Table 21 – Estimated Australian consumption trends by battery chemistry type from 2003–04 to 2019–20 by weight
Financial year
Alkaline Zinc carbon
Lithium primary
Lithium ion
Nickel metal hydride
Nickel cadmium
Lead acid Other chemistry
Total
2004 42.7% 29.8% 1.0% 3.0% 2.0% 5.0% 16.0% 0.5% 100%
2005 41.5% 29.0% 1.0% 4.0% 4.0% 4.0% 16.0% 0.5% 100%
2006 40.6% 28.4% 1.0% 4.5% 4.5% 4.5% 16.0% 0.5% 100%
2007 38.9% 27.1% 1.0% 7.5% 4.5% 4.5% 16.0% 0.5% 100%
2008 38.3% 26.7% 1.0% 8.0% 5.0% 4.5% 16.0% 0.5% 100%
2009 37.1% 25.9% 1.0% 9.0% 5.0% 4.5% 17.0% 0.5% 100%
2010 35.0% 24.5% 1.0% 12.0% 5.0% 4.0% 18.0% 0.5% 100%
2011 33.3% 23.2% 1.0% 16.0% 4.0% 3.0% 19.0% 0.5% 100%
2012 31.2% 21.8% 1.0% 20.0% 3.0% 2.7% 20.0% 0.3% 100%
2013 28.6% 20.0% 0.7% 23.6% 1.1% 1.5% 24.3% 0.1% 100%
2014 29.4% 20.6% 1.0% 25.3% 2.0% 1.4% 20.0% 0.3% 100%
2015 28.6% 19.9% 1.0% 27.0% 2.0% 1.2% 20.0% 0.3% 100%
2016 27.7% 19.3% 1.0% 28.5% 2.0% 1.2% 20.0% 0.3% 100%
2017 26.8% 18.7% 1.0% 30.0% 2.0% 1.2% 20.0% 0.3% 100%
2018 26.0% 18.2% 1.0% 31.5% 2.0% 1.0% 20.0% 0.3% 100%
2019 25.5% 17.8% 1.0% 32.5% 2.0% 0.9% 20.0% 0.3% 100%
2020 25.0% 17.4% 1.0% 33.5% 2.0% 0.8% 20.0% 0.3% 100%
Study into market share and stocks and flows of handheld batteries in Australia
Sustainable Resource Use Pty Ltd
Page 43
6.3.1 Alkaline
In the historical data for the European reference countries reviewed alkaline batteries contribute the
majority of all batteries both by weight and number. Alkaline battery sales fell as a proportion of
overall sales (by weight) from 66% in 2004 to 55% in 2012. However, there was a smaller decline in
sales numbers, from 66% to 62% over the same period.
The number of alkaline batteries sold in 2012 increased by 8% over 2004, However over that period,
their combined weight declined (‐13%), driven by the increase in alkaline button cells (+300%), which
had the fastest growth of any button cell chemistry.
In the reference countries, button cells of all chemistries contributed 25% of all single use batteries
by units in 2012 and 3% by weight (2004: 12% and 1%), and three times more button cells were sold
in 2012 than in 2004. Sales of all major button cell chemistries increased, but alkaline button cells
gained, while zinc air and lithium button cells lost market share (2004: 28% / 30% / 42%; 2012: 37%,
26%, 37%).
6.3.2 Lithium
Lithium – Rechargeable
In the historical data for the European reference countries reviewed the lithium share of the total
market increased to almost 17% in 2012 (up from 4% in 2004). The quantity of lithium batteries sold
increased four times in terms of weight and doubled by number.
Ninety per cent of lithium batteries by weight, and 33% by unit, were rechargeable batteries in 2012
(compared with 75% and 31% respectively in 2004).
Sales of rechargeable lithium batteries increased 5 times by weight and over 2 times in units, largely
by powering new applications and replacing other chemistries in existing applications, notably nickel
cadmium. Excluding lead batteries, lithium’s share of the rechargeable market grew from 25% in
2004 to 60% in 2012. Lithium battery packs enable increasingly powerful applications, as the average
weight of a rechargeable lithium battery doubled between in 2004 in 2012.
Rechargeable button cells makes up about 7% of rechargeable lithium batteries by units. Their unit
sales doubled from 2004 to 2012.
Lithium is likely to absorb nearly all the growth of the batteries market in weight terms as it is the
chemistry enabling the emerging battery application. In addition, it will continue to gain market
share as a result of the cadmium phase out. Changes in lead acid battery consumption could also
significantly change market size, due to their high average weight.
Lithium – single use
Despite having doubled in unit sales from 2004, the relative share of single use lithium batteries
declined by 10% by 2012 by weight and 77% by unit in the reference European countries. This is due
the faster growth of lithium rechargeable batteries.
25% of single use lithium batteries are button cells, the remainder mostly smaller standard sizes.
Lighter lithium button cells have lost market share to other chemistries.
Study into market share and stocks and flows of handheld batteries in Australia
Sustainable Resource Use Pty Ltd
Page 44
6.3.3 Nickel metal hydride
In Europe, nickel metal hydride’s share of the batteries market increased from about 2% in 2004 to
6% in 2012 in terms of weight, and 24% to 51% in unit terms. The average weight per battery
increased only slightly from 25 g to 30 g.
In terms of market size, the number of nickel metal hydride batteries increased 20 fold between
2004 and 2012.
6.3.4 Nickel cadmium
In the historical data for the European reference countries reviewed nickel cadmium battery sales
declined by half from 2004 to 2012 on a weight basis. Nickel cadmium’s share of the total market
also declined from around 7% in 2004 to 4% in 2012. In terms of units, the drop was steeper, to
about 25% of the volume shipped in 2004.
Nickel cadmium’s decline in Europe has been driven by legislation restricting hazardous substances
(European Commission, 2003) that require the phase out of this chemistry also in batteries used in
cordless tools from 2017. Smaller size cadmium batteries were first replaced with lithium batteries in
IT equipment and now also in power tools.
6.3.5 Lead acid
In the historical data for the European reference countries reviewed lead acid batteries of 5 kg or less
are estimated as adding about 20% to the total weight of all chemistries (single use and
rechargeable), but only 0.25% to the number of batteries. This estimate has been applied directly in
forward forecasts out to 2019–20 for the Australian trend estimates.
6.3.6 Zinc air
In the historical data for the European reference countries reviewed over 99% of zinc air units are
single use button cells. They represent 9% of batteries by unit and 0.5% by weight of the total
batteries market. This is compared with 4% and 1% respectively in 2004.
The remaining 0.02 % (by units) are large rechargeable specialty batteries that can weigh several
tonnes and are can easily distort zinc air statistics.
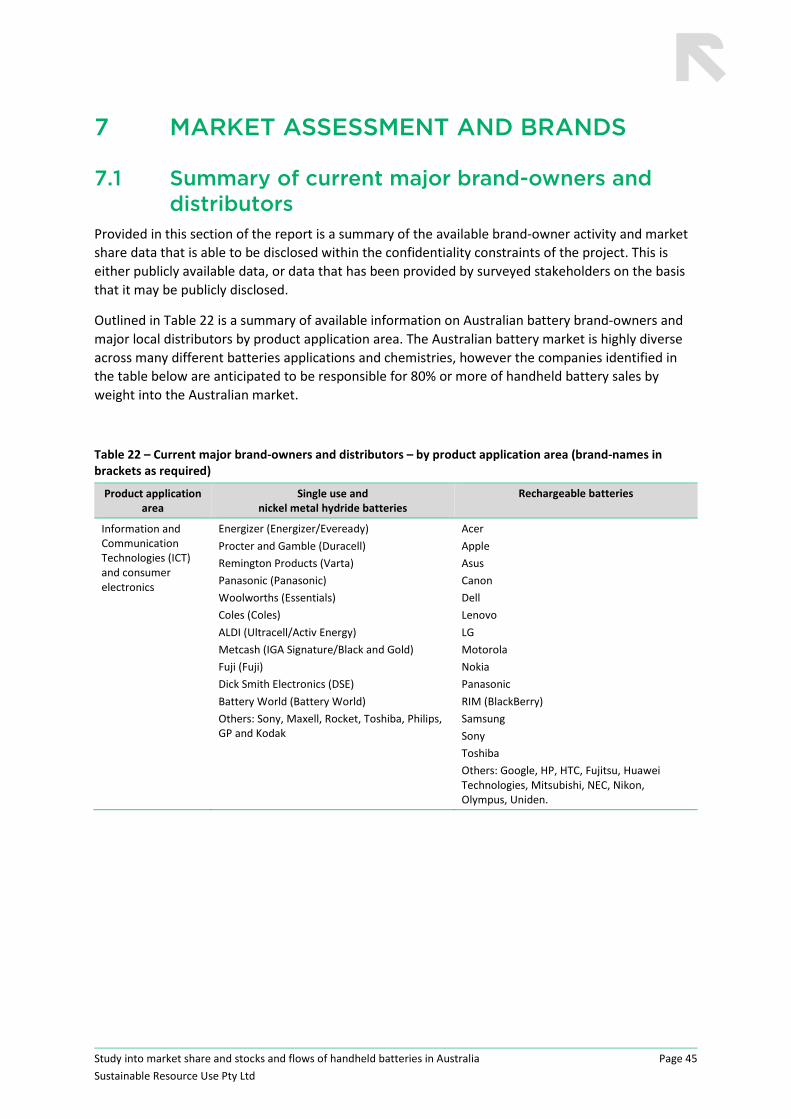
Study into market share and stocks and flows of handheld batteries in Australia
Sustainable Resource Use Pty Ltd
Page 45
7 MARKET ASSESSMENT AND BRANDS
7.1 Summary of current major brand-owners and distributors
Provided in this section of the report is a summary of the available brand‐owner activity and market
share data that is able to be disclosed within the confidentiality constraints of the project. This is
either publicly available data, or data that has been provided by surveyed stakeholders on the basis
that it may be publicly disclosed.
Outlined in Table 22 is a summary of available information on Australian battery brand‐owners and
major local distributors by product application area. The Australian battery market is highly diverse
across many different batteries applications and chemistries, however the companies identified in
the table below are anticipated to be responsible for 80% or more of handheld battery sales by
weight into the Australian market.
Table 22 – Current major brand‐owners and distributors – by product application area (brand‐names in brackets as required)
Product application area
Single use and nickel metal hydride batteries
Rechargeable batteries
Information and Communication Technologies (ICT) and consumer electronics
Energizer (Energizer/Eveready)
Procter and Gamble (Duracell)
Remington Products (Varta)
Panasonic (Panasonic)
Woolworths (Essentials)
Coles (Coles)
ALDI (Ultracell/Activ Energy)
Metcash (IGA Signature/Black and Gold)
Fuji (Fuji)
Dick Smith Electronics (DSE)
Battery World (Battery World)
Others: Sony, Maxell, Rocket, Toshiba, Philips, GP and Kodak
Acer
Apple
Asus
Canon
Dell
Lenovo
LG
Motorola
Nokia
Panasonic
RIM (BlackBerry)
Samsung
Sony
Toshiba
Others: Google, HP, HTC, Fujitsu, Huawei Technologies, Mitsubishi, NEC, Nikon, Olympus, Uniden.
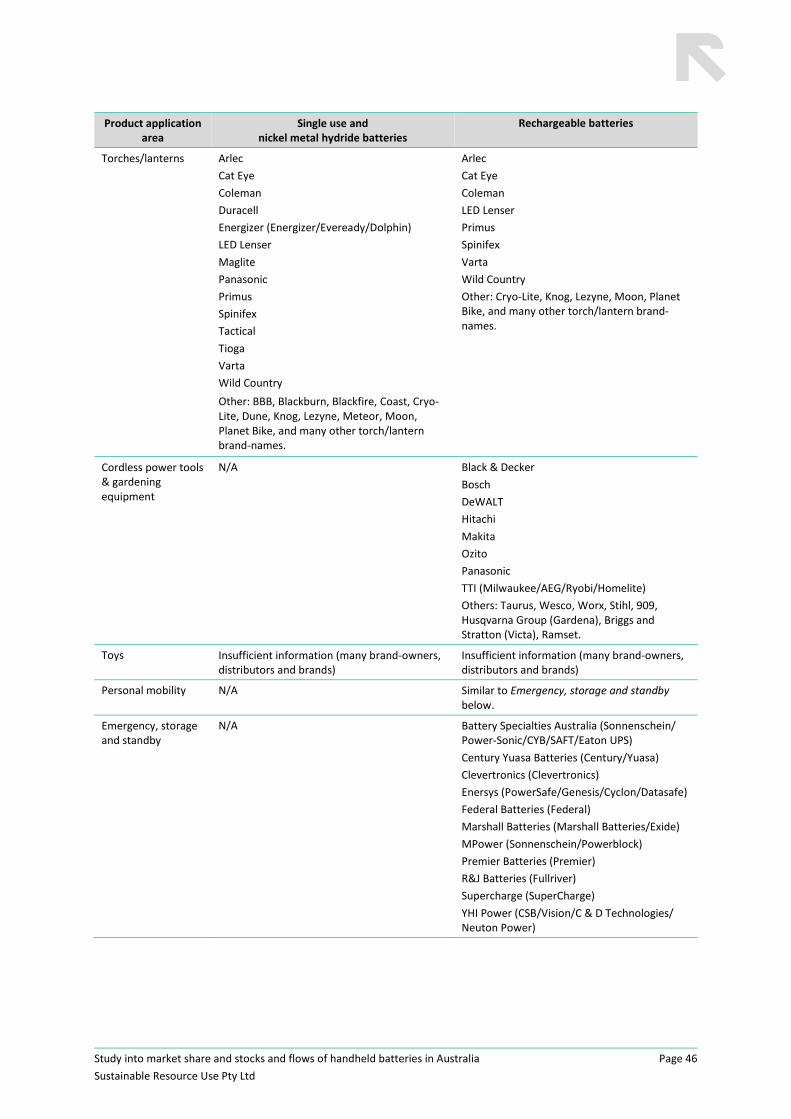
Study into market share and stocks and flows of handheld batteries in Australia
Sustainable Resource Use Pty Ltd
Page 46
Product application area
Single use and nickel metal hydride batteries
Rechargeable batteries
Torches/lanterns Arlec
Cat Eye
Coleman
Duracell
Energizer (Energizer/Eveready/Dolphin)
LED Lenser
Maglite
Panasonic
Primus
Spinifex
Tactical
Tioga
Varta
Wild Country
Other: BBB, Blackburn, Blackfire, Coast, Cryo‐Lite, Dune, Knog, Lezyne, Meteor, Moon, Planet Bike, and many other torch/lantern brand‐names.
Arlec
Cat Eye
Coleman
LED Lenser
Primus
Spinifex
Varta
Wild Country
Other: Cryo‐Lite, Knog, Lezyne, Moon, Planet Bike, and many other torch/lantern brand‐names.
Cordless power tools & gardening equipment
N/A Black & Decker
Bosch
DeWALT
Hitachi
Makita
Ozito
Panasonic
TTI (Milwaukee/AEG/Ryobi/Homelite)
Others: Taurus, Wesco, Worx, Stihl, 909, Husqvarna Group (Gardena), Briggs and Stratton (Victa), Ramset.
Toys Insufficient information (many brand‐owners, distributors and brands)
Insufficient information (many brand‐owners, distributors and brands)
Personal mobility N/A Similar to Emergency, storage and standby below.
Emergency, storage and standby
N/A Battery Specialties Australia (Sonnenschein/ Power‐Sonic/CYB/SAFT/Eaton UPS)
Century Yuasa Batteries (Century/Yuasa)
Clevertronics (Clevertronics)
Enersys (PowerSafe/Genesis/Cyclon/Datasafe)
Federal Batteries (Federal)
Marshall Batteries (Marshall Batteries/Exide)
MPower (Sonnenschein/Powerblock)
Premier Batteries (Premier)
R&J Batteries (Fullriver)
Supercharge (SuperCharge)
YHI Power (CSB/Vision/C & D Technologies/ Neuton Power)
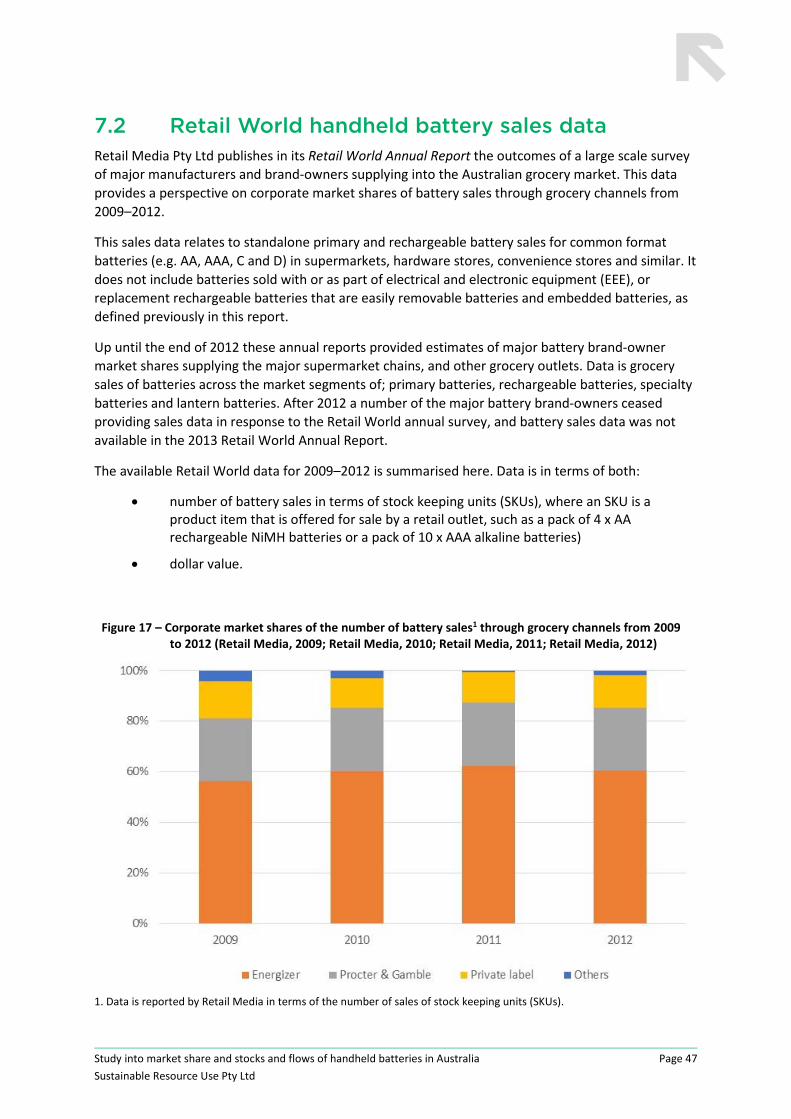
Study into market share and stocks and flows of handheld batteries in Australia
Sustainable Resource Use Pty Ltd
Page 47
7.2 Retail World handheld battery sales data Retail Media Pty Ltd publishes in its Retail World Annual Report the outcomes of a large scale survey
of major manufacturers and brand‐owners supplying into the Australian grocery market. This data
provides a perspective on corporate market shares of battery sales through grocery channels from
2009–2012.
This sales data relates to standalone primary and rechargeable battery sales for common format
batteries (e.g. AA, AAA, C and D) in supermarkets, hardware stores, convenience stores and similar. It
does not include batteries sold with or as part of electrical and electronic equipment (EEE), or
replacement rechargeable batteries that are easily removable batteries and embedded batteries, as
defined previously in this report.
Up until the end of 2012 these annual reports provided estimates of major battery brand‐owner
market shares supplying the major supermarket chains, and other grocery outlets. Data is grocery
sales of batteries across the market segments of; primary batteries, rechargeable batteries, specialty
batteries and lantern batteries. After 2012 a number of the major battery brand‐owners ceased
providing sales data in response to the Retail World annual survey, and battery sales data was not
available in the 2013 Retail World Annual Report.
The available Retail World data for 2009–2012 is summarised here. Data is in terms of both:
number of battery sales in terms of stock keeping units (SKUs), where an SKU is a product item that is offered for sale by a retail outlet, such as a pack of 4 x AA rechargeable NiMH batteries or a pack of 10 x AAA alkaline batteries)
dollar value.
Figure 17 – Corporate market shares of the number of battery sales1 through grocery channels from 2009 to 2012 (Retail Media, 2009; Retail Media, 2010; Retail Media, 2011; Retail Media, 2012)
1. Data is reported by Retail Media in terms of the number of sales of stock keeping units (SKUs).
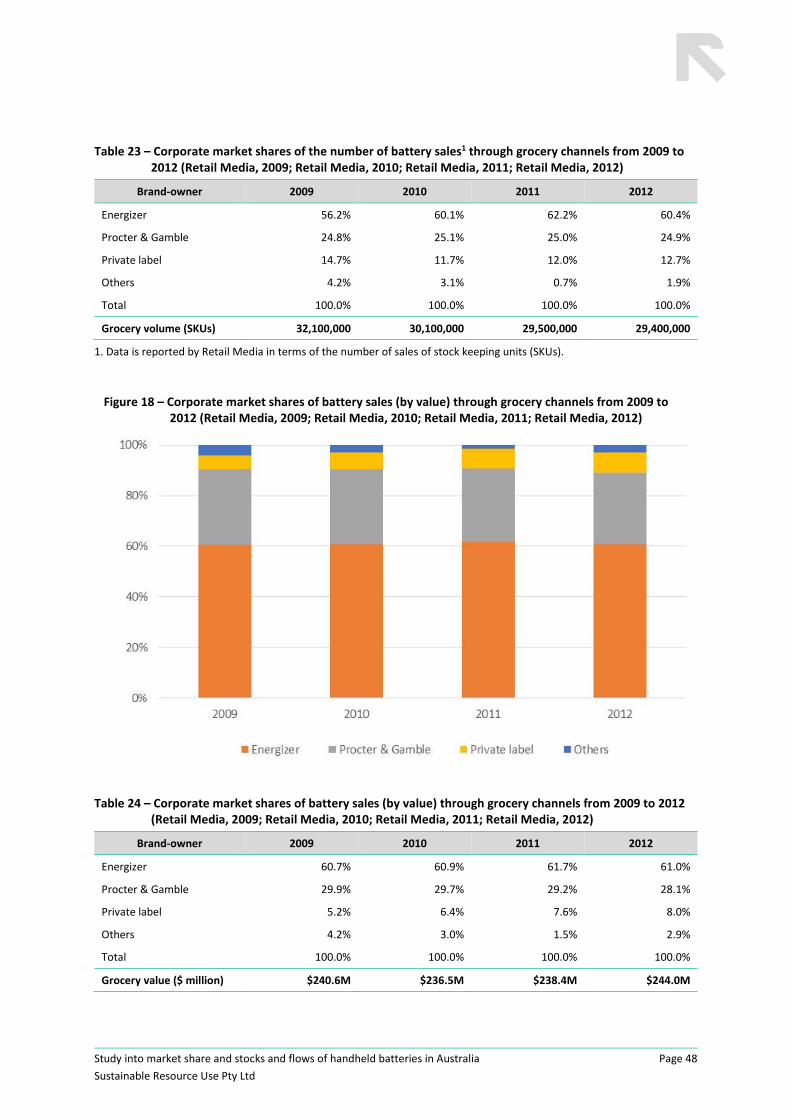
Study into market share and stocks and flows of handheld batteries in Australia
Sustainable Resource Use Pty Ltd
Page 48
Table 23 – Corporate market shares of the number of battery sales1 through grocery channels from 2009 to 2012 (Retail Media, 2009; Retail Media, 2010; Retail Media, 2011; Retail Media, 2012)
Brand‐owner 2009 2010 2011 2012
Energizer 56.2% 60.1% 62.2% 60.4%
Procter & Gamble 24.8% 25.1% 25.0% 24.9%
Private label 14.7% 11.7% 12.0% 12.7%
Others 4.2% 3.1% 0.7% 1.9%
Total 100.0% 100.0% 100.0% 100.0%
Grocery volume (SKUs) 32,100,000 30,100,000 29,500,000 29,400,000
1. Data is reported by Retail Media in terms of the number of sales of stock keeping units (SKUs).
Figure 18 – Corporate market shares of battery sales (by value) through grocery channels from 2009 to 2012 (Retail Media, 2009; Retail Media, 2010; Retail Media, 2011; Retail Media, 2012)
Table 24 – Corporate market shares of battery sales (by value) through grocery channels from 2009 to 2012 (Retail Media, 2009; Retail Media, 2010; Retail Media, 2011; Retail Media, 2012)
Brand‐owner 2009 2010 2011 2012
Energizer 60.7% 60.9% 61.7% 61.0%
Procter & Gamble 29.9% 29.7% 29.2% 28.1%
Private label 5.2% 6.4% 7.6% 8.0%
Others 4.2% 3.0% 1.5% 2.9%
Total 100.0% 100.0% 100.0% 100.0%
Grocery value ($ million) $240.6M $236.5M $238.4M $244.0M
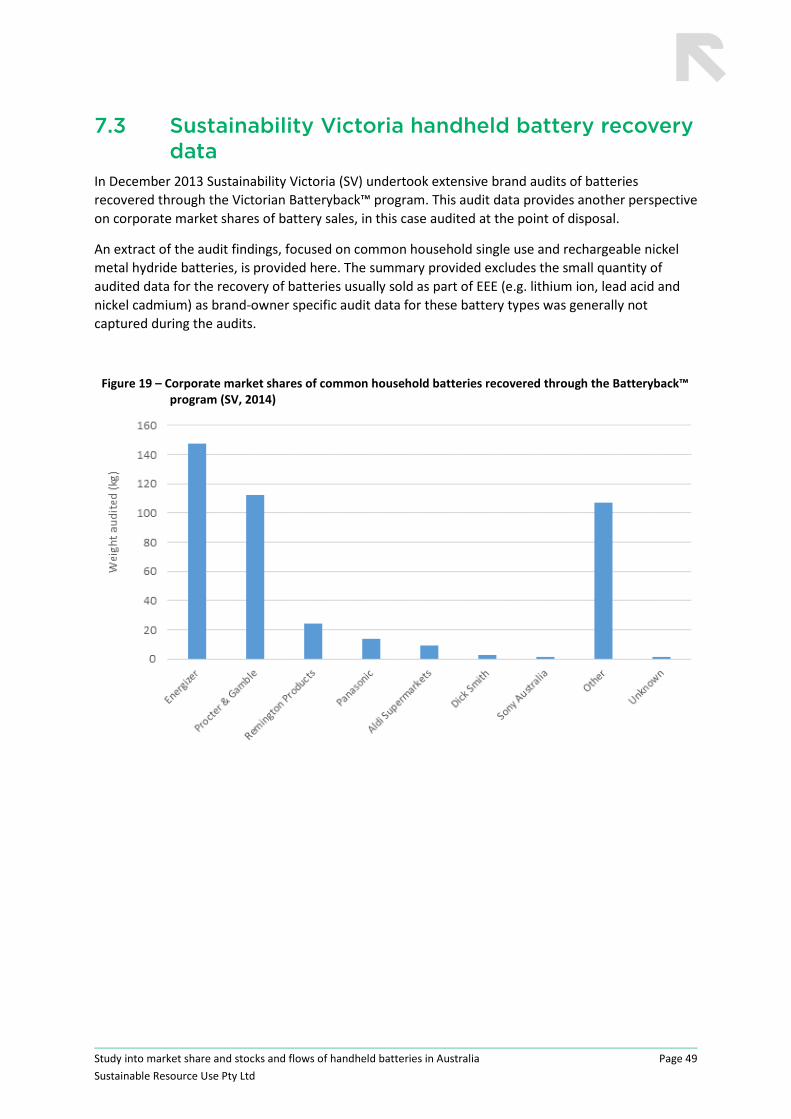
Study into market share and stocks and flows of handheld batteries in Australia
Sustainable Resource Use Pty Ltd
Page 49
7.3 Sustainability Victoria handheld battery recovery data
In December 2013 Sustainability Victoria (SV) undertook extensive brand audits of batteries
recovered through the Victorian Batteryback™ program. This audit data provides another perspective
on corporate market shares of battery sales, in this case audited at the point of disposal.
An extract of the audit findings, focused on common household single use and rechargeable nickel
metal hydride batteries, is provided here. The summary provided excludes the small quantity of
audited data for the recovery of batteries usually sold as part of EEE (e.g. lithium ion, lead acid and
nickel cadmium) as brand‐owner specific audit data for these battery types was generally not
captured during the audits.
Figure 19 – Corporate market shares of common household batteries recovered through the Batteryback™ program (SV, 2014)
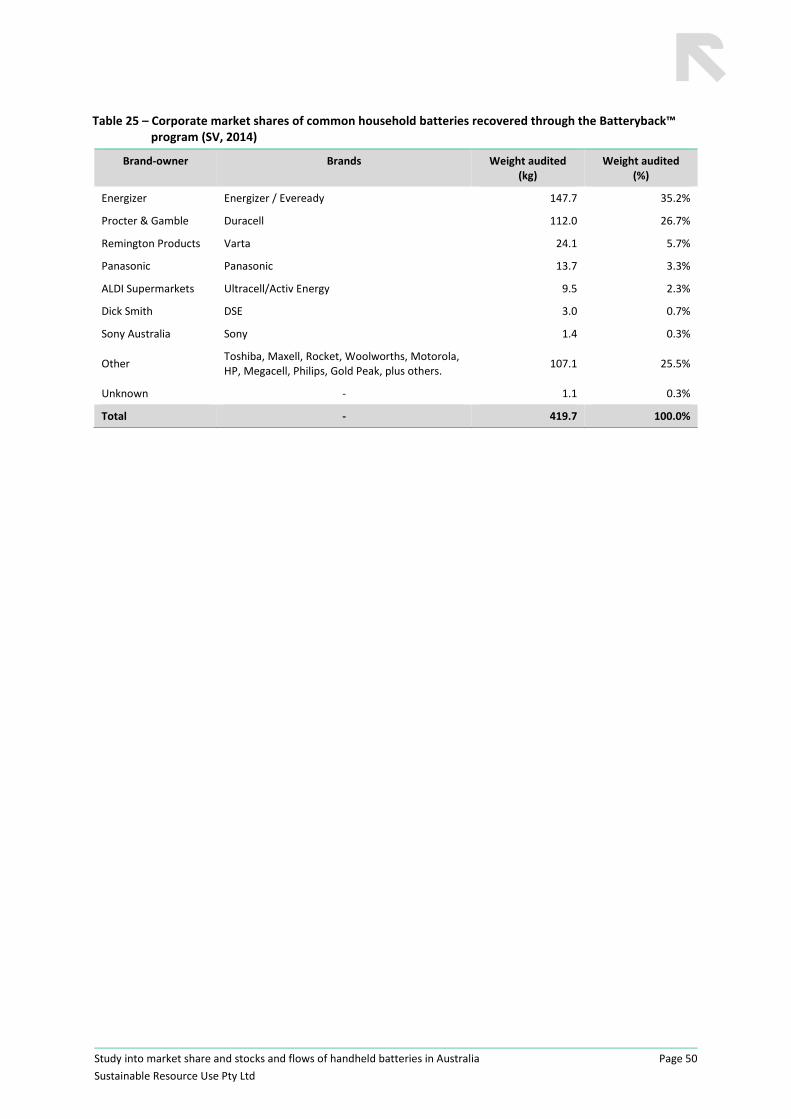
Study into market share and stocks and flows of handheld batteries in Australia
Sustainable Resource Use Pty Ltd
Page 50
Table 25 – Corporate market shares of common household batteries recovered through the Batteryback™ program (SV, 2014)
Brand‐owner Brands Weight audited (kg)
Weight audited (%)
Energizer Energizer / Eveready 147.7 35.2%
Procter & Gamble Duracell 112.0 26.7%
Remington Products Varta 24.1 5.7%
Panasonic Panasonic 13.7 3.3%
ALDI Supermarkets Ultracell/Activ Energy 9.5 2.3%
Dick Smith DSE 3.0 0.7%
Sony Australia Sony 1.4 0.3%
Other Toshiba, Maxell, Rocket, Woolworths, Motorola, HP, Megacell, Philips, Gold Peak, plus others.
107.1 25.5%
Unknown ‐ 1.1 0.3%
Total ‐ 419.7 100.0%
Study into market share and stocks and flows of handheld batteries in Australia
Sustainable Resource Use Pty Ltd
Page 51
8 DATA SENSITIVITY AND RELIABILITY
8.1 Sensitivity analysis Sensitivity analysis has been undertaken on a number of key parameters to assist in informing on the
model sensitivities and future areas where additional data collection could be considered to improve
the accuracy of the data. The parameters selected for assessment are summarised in the table
below.
Table 26 – Parameters selected for sensitivity analysis
Parameter to be tested Reason for selection
The average length of handheld battery use.
The retention time of batteries in use may have a significant impact on end‐of‐life disposal estimates, and there are relatively few sources of Australian specific or international data on battery use periods prior to disposal.
Per capita growth in battery consumption. Per capita growth estimates are largely based on European data which may not apply to Australian market conditions. In addition, per capita growth estimates are exponential and so small apparent changes can have a large impact over a number of years.
No change in battery chemistry market shares from 2012–13 to 2019–20.
The forecasts in handheld battery chemistry market share are informed speculation, and it is important to test the sensitivity of findings to these forecasts.
Sealed lead acid battery import estimates under HTSIC 8507200081, which account for approximately 30% of battery imports by weight.
The assumptions made in relation to converting this Customs Tariff code into an estimated weight and number of batteries may have a significant impact on the overall MFA findings. The sensitivity of the MFA to changes in this significant Customs Tariff code should be tested.
Alkaline and zinc carbon battery import estimates under HTSIC 8506100069, which account for approximately 31% of battery imports by weight.
The assumptions made in relation to converting this Customs Tariff code into an estimated weight and number of batteries may have a significant impact on the overall MFA findings. The sensitivity of the MFA to changes in this significant Customs Tariff code should be tested.
Quantity of used SLAB recovered in general lead acid battery collections (e.g. in automotive and industrial related collections).
It was estimated that nearly 120,000 tonnes of used lead acid batteries, from automotive and industrial sources, were recycled (or stockpiled for future recycling) during 2010 (Warnken, 2010, p. viii). During the surveys undertaken for this current study it was difficult or impossible for some significant lead acid battery reprocessors to provide an estimate of the weight of used SLAB recovered by their facilities, either in absolute weight terms or as a proportion of total ULAB reprocessing. This was due to the much greater quantity of ULAB heavier than 5 kg being handled. For this reason the sensitivity of the used SLAB recycling rate is tested here by assuming it is a (small) proportion of batteries recovered by large scale ULAB recyclers.
The variations applied to each of the first five parameters listed above are summarised in the following two tables, which also present the impact of the changes on both sales and disposal during the 2012–13 and 2019–20 financial years.
The sensitivity analysis on increasing the quantity of used SLAB recovery in general lead acid battery collections has no impact on either sales or (total) disposal, so is undertaken separately following the analysis provided in Table 27 and Table 28.
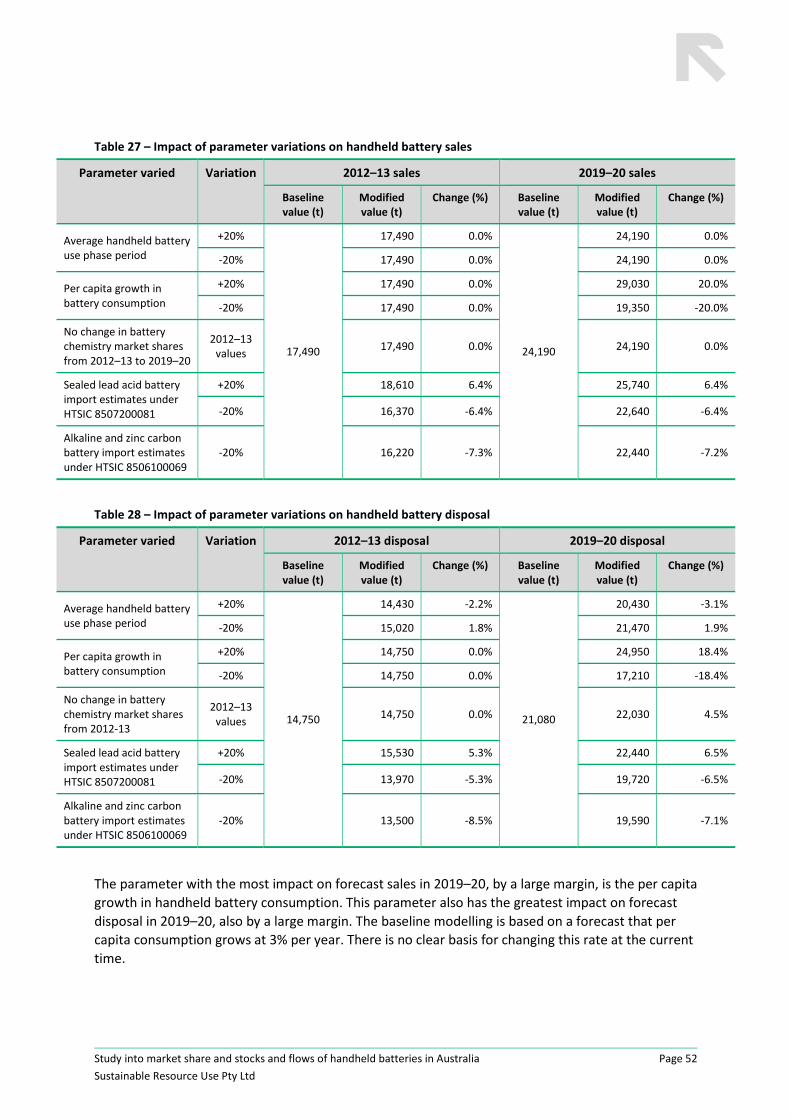
Study into market share and stocks and flows of handheld batteries in Australia
Sustainable Resource Use Pty Ltd
Page 52
Table 27 – Impact of parameter variations on handheld battery sales
Parameter varied Variation 2012–13 sales 2019–20 sales
Baseline value (t)
Modified value (t)
Change (%) Baseline value (t)
Modified value (t)
Change (%)
Average handheld battery use phase period
+20%
17,490
17,490 0.0%
24,190
24,190 0.0%
‐20% 17,490 0.0% 24,190 0.0%
Per capita growth in battery consumption
+20% 17,490 0.0% 29,030 20.0%
‐20% 17,490 0.0% 19,350 ‐20.0%
No change in battery chemistry market shares from 2012–13 to 2019–20
2012–13 values
17,490 0.0% 24,190 0.0%
Sealed lead acid battery import estimates under HTSIC 8507200081
+20% 18,610 6.4% 25,740 6.4%
‐20% 16,370 ‐6.4% 22,640 ‐6.4%
Alkaline and zinc carbon battery import estimates under HTSIC 8506100069
‐20% 16,220 ‐7.3% 22,440 ‐7.2%
Table 28 – Impact of parameter variations on handheld battery disposal
Parameter varied Variation 2012–13 disposal 2019–20 disposal
Baseline value (t)
Modified value (t)
Change (%) Baseline value (t)
Modified value (t)
Change (%)
Average handheld battery use phase period
+20%
14,750
14,430 ‐2.2%
21,080
20,430 ‐3.1%
‐20% 15,020 1.8% 21,470 1.9%
Per capita growth in battery consumption
+20% 14,750 0.0% 24,950 18.4%
‐20% 14,750 0.0% 17,210 ‐18.4%
No change in battery chemistry market shares from 2012‐13
2012–13 values
14,750 0.0% 22,030 4.5%
Sealed lead acid battery import estimates under HTSIC 8507200081
+20% 15,530 5.3% 22,440 6.5%
‐20% 13,970 ‐5.3% 19,720 ‐6.5%
Alkaline and zinc carbon battery import estimates under HTSIC 8506100069
‐20% 13,500 ‐8.5% 19,590 ‐7.1%
The parameter with the most impact on forecast sales in 2019–20, by a large margin, is the per capita
growth in handheld battery consumption. This parameter also has the greatest impact on forecast
disposal in 2019–20, also by a large margin. The baseline modelling is based on a forecast that per
capita consumption grows at 3% per year. There is no clear basis for changing this rate at the current
time.
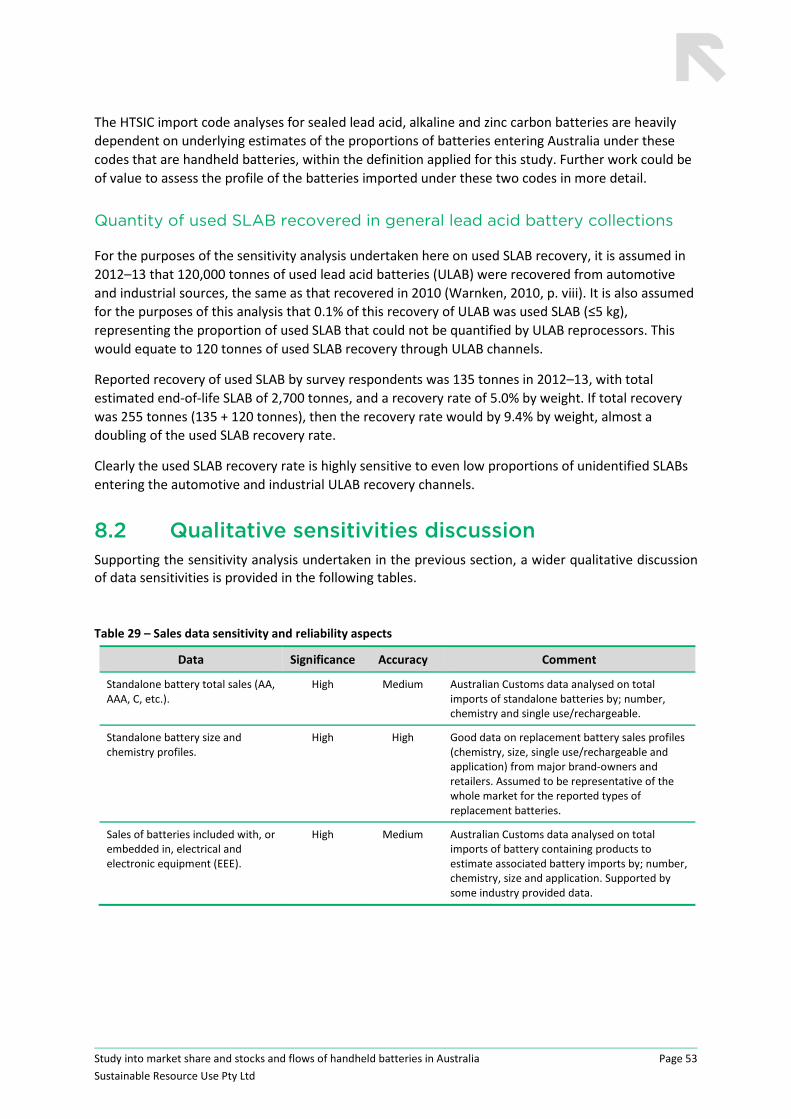
Study into market share and stocks and flows of handheld batteries in Australia
Sustainable Resource Use Pty Ltd
Page 53
The HTSIC import code analyses for sealed lead acid, alkaline and zinc carbon batteries are heavily
dependent on underlying estimates of the proportions of batteries entering Australia under these
codes that are handheld batteries, within the definition applied for this study. Further work could be
of value to assess the profile of the batteries imported under these two codes in more detail.
Quantity of used SLAB recovered in general lead acid battery collections
For the purposes of the sensitivity analysis undertaken here on used SLAB recovery, it is assumed in
2012–13 that 120,000 tonnes of used lead acid batteries (ULAB) were recovered from automotive
and industrial sources, the same as that recovered in 2010 (Warnken, 2010, p. viii). It is also assumed
for the purposes of this analysis that 0.1% of this recovery of ULAB was used SLAB (≤5 kg),
representing the proportion of used SLAB that could not be quantified by ULAB reprocessors. This
would equate to 120 tonnes of used SLAB recovery through ULAB channels.
Reported recovery of used SLAB by survey respondents was 135 tonnes in 2012–13, with total
estimated end‐of‐life SLAB of 2,700 tonnes, and a recovery rate of 5.0% by weight. If total recovery
was 255 tonnes (135 + 120 tonnes), then the recovery rate would by 9.4% by weight, almost a
doubling of the used SLAB recovery rate.
Clearly the used SLAB recovery rate is highly sensitive to even low proportions of unidentified SLABs
entering the automotive and industrial ULAB recovery channels.
8.2 Qualitative sensitivities discussion Supporting the sensitivity analysis undertaken in the previous section, a wider qualitative discussion of data sensitivities is provided in the following tables.
Table 29 – Sales data sensitivity and reliability aspects
Data Significance Accuracy Comment
Standalone battery total sales (AA, AAA, C, etc.).
High Medium Australian Customs data analysed on total imports of standalone batteries by; number, chemistry and single use/rechargeable.
Standalone battery size and chemistry profiles.
High High Good data on replacement battery sales profiles (chemistry, size, single use/rechargeable and application) from major brand‐owners and retailers. Assumed to be representative of the whole market for the reported types of replacement batteries.
Sales of batteries included with, or embedded in, electrical and electronic equipment (EEE).
High Medium Australian Customs data analysed on total imports of battery containing products to estimate associated battery imports by; number, chemistry, size and application. Supported by some industry provided data.

Study into market share and stocks and flows of handheld batteries in Australia
Sustainable Resource Use Pty Ltd
Page 54
Table 30 – Use phase data sensitivity and reliability aspects
Data Significance Accuracy Comment
Battery lifespan estimates Medium Medium Some information available in the literature on battery lifespans, and storage periods prior to disposal by householders and businesses.
Trends in total quantities of batteries consumed
High Medium Good information available from comparable European countries on historical battery trends. Estimates of future trends are approximate only.
Trend from primary to secondary batteries
Medium Medium Good information available from comparable European countries on historical battery trends. Estimates of future trends are approximate only.
Trends between different chemistries
Medium Medium Good information available from comparable European countries on historical battery trends. Estimates of future trends are approximate only.
Trends toward new applications Medium Low Estimates of future battery chemistry and size trends in different applications are approximate only.
Current stocks (in use) and storage estimates
High Medium Current estimates based upon MFA modelling with limited verification available.
Table 31 – Disposal data sensitivity and reliability aspects
Data Significance Accuracy Comment
Batteries recovered through retail store drop‐off
Medium Medium Reasonable coverage of services operated nationally. Good survey coverage of related major local reprocessors.
HHC collection program quantities Medium Medium Accurate for NSW, South Australia, Victoria and Western Australia. Depending on the reprocessing destination, some quantities may be missing for Australian Capital Territory, Northern Territory, Queensland and Tasmania.
E‐waste collection program Medium Low–Medium
A number of potential receivers of waste batteries from e‐waste did not respond to the survey. Customs data indicates that exports of waste batteries was low, which indicates that any missed quantities are exported for reprocessing oversea are minimal.
Commercial collection services Low Low Potential gaps with respect to SLAB recovery. Reported totals appear very low relative to end‐of‐life arisings.
Batteries to landfill High Medium Current estimates based upon MFA modelling with limited verification available.
8.3 Data sensitivity and reliability conclusions The suggested highest priorities for future data collection to improve the accuracy of this study are:
achieve a higher participation rate with the major brand‐owners for common batteries types.

Study into market share and stocks and flows of handheld batteries in Australia
Sustainable Resource Use Pty Ltd
Page 55
undertake a targeted survey to assist in quantifying current household stockpiles, and 'in use' periods for different battery types.
undertake audits of used sealed lead acid batteries (≤5 kg) recovered with automotive or industrial used lead acid batteries.
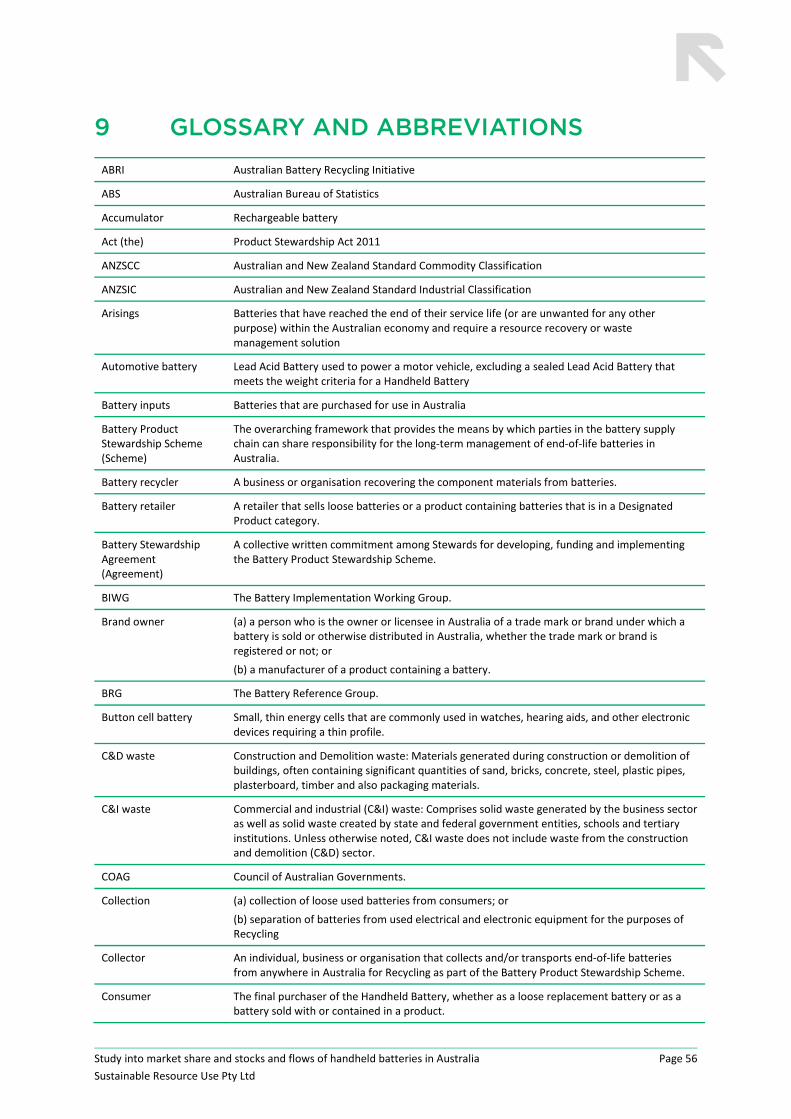
Study into market share and stocks and flows of handheld batteries in Australia
Sustainable Resource Use Pty Ltd
Page 56
9 GLOSSARY AND ABBREVIATIONS
ABRI Australian Battery Recycling Initiative
ABS Australian Bureau of Statistics
Accumulator Rechargeable battery
Act (the) Product Stewardship Act 2011
ANZSCC Australian and New Zealand Standard Commodity Classification
ANZSIC Australian and New Zealand Standard Industrial Classification
Arisings Batteries that have reached the end of their service life (or are unwanted for any other purpose) within the Australian economy and require a resource recovery or waste management solution
Automotive battery Lead Acid Battery used to power a motor vehicle, excluding a sealed Lead Acid Battery that meets the weight criteria for a Handheld Battery
Battery inputs Batteries that are purchased for use in Australia
Battery Product Stewardship Scheme (Scheme)
The overarching framework that provides the means by which parties in the battery supply chain can share responsibility for the long‐term management of end‐of‐life batteries in Australia.
Battery recycler A business or organisation recovering the component materials from batteries.
Battery retailer A retailer that sells loose batteries or a product containing batteries that is in a Designated Product category.
Battery Stewardship Agreement (Agreement)
A collective written commitment among Stewards for developing, funding and implementing the Battery Product Stewardship Scheme.
BIWG The Battery Implementation Working Group.
Brand owner (a) a person who is the owner or licensee in Australia of a trade mark or brand under which a battery is sold or otherwise distributed in Australia, whether the trade mark or brand is registered or not; or
(b) a manufacturer of a product containing a battery.
BRG The Battery Reference Group.
Button cell battery Small, thin energy cells that are commonly used in watches, hearing aids, and other electronic devices requiring a thin profile.
C&D waste Construction and Demolition waste: Materials generated during construction or demolition of buildings, often containing significant quantities of sand, bricks, concrete, steel, plastic pipes, plasterboard, timber and also packaging materials.
C&I waste Commercial and industrial (C&I) waste: Comprises solid waste generated by the business sector as well as solid waste created by state and federal government entities, schools and tertiary institutions. Unless otherwise noted, C&I waste does not include waste from the construction and demolition (C&D) sector.
COAG Council of Australian Governments.
Collection (a) collection of loose used batteries from consumers; or
(b) separation of batteries from used electrical and electronic equipment for the purposes of Recycling
Collector An individual, business or organisation that collects and/or transports end‐of‐life batteries from anywhere in Australia for Recycling as part of the Battery Product Stewardship Scheme.
Consumer The final purchaser of the Handheld Battery, whether as a loose replacement battery or as a battery sold with or contained in a product.
Study into market share and stocks and flows of handheld batteries in Australia
Sustainable Resource Use Pty Ltd
Page 57
Data year The year defined for reporting purposes.
Easily removable battery
‘Easily removable’ means readily detachable by a person without the use of tools, or designed with the intent that the battery is easily removed with the use of common household tools.
EEE Electrical and electronic equipment.
Embedded battery A battery that is an integral part of a product and cannot be easily removed without rendering the product inoperable.
End‐of‐life (EoL) An item which is no longer deemed to be capable of performing the function for which it was originally intended.
Environmentally Sound Management
The management of whole or part of an end‐of‐life Handheld Battery in such a way as to reduce or prevent environmental and health and safety impacts and to optimise the recovery and reuse of the materials in the battery. Disposal through direct incineration, landfilling and dumping are excluded from the definition of Environmentally Sound Management.
Equivalent Battery Unit (EBU)
A standardised measure for the quantity of end‐of‐life Handheld Batteries. One EBU is equivalent to one standard AA battery.
Export Export from Australia.
Formal stockpiles Batteries that are stored in accordance with relevant regulations prior to transport or processing.
Free‐rider An Importer that is not a signatory to the Agreement or otherwise not fulfilling the commitments of a Steward.
Handheld battery A battery or cell of any chemistry that weighs less than 5kg.
HTISC The Harmonized Tariff Item Statistical Code. An Australian extension of the international Harmonized Commodity Description and Coding System (HS), to provide a finer level of detail than the international HS system. The HTISC relates to imports, but not to exports.
The Combined Australian Customs Tariff Nomenclature and Statistical Classification (the Customs Tariff) is the broader Australian extension of the HS which covers both imports and exports. The HTISC is a subset of the Customs Tariff.
Import Import into Australia, and includes bringing in with or as part of another product.
Importer A party operating in Australia who, within a Data Year, imports Handheld Batteries or products containing Handheld Batteries into Australia, including Handheld Batteries for which no Brand Owner exists, above a specified threshold.
Individual Producer Responsibility (IPR)
Each producer is responsible for financing the operations relating to the waste from their own products, rather than collective responsibility through a shared product stewardship scheme.
Industrial battery A large battery used in industrial applications for standby or motive power.
Informal stockpiles Storage of batteries by consumers prior to reuse at a later stage or disposal into formal waste streams/disposal routes. This storage could be, for example, in a disused piece of equipment within a household, or separately in rural and regional settings.
JASANZ Joint Accreditation System of Australia and New Zealand.
LCA Life‐cycle assessment.
Lead acid battery A battery with lead electrodes and using dilute sulphuric acid as the electrolyte.
Lithium batteries Disposable (primary) batteries that have lithium metal or compounds as an anode and manganese dioxide typically as a cathode. They are widely used in portable consumer electronic devices.
LiCoO2 Lithium cobalt oxide.
Study into market share and stocks and flows of handheld batteries in Australia
Sustainable Resource Use Pty Ltd
Page 58
LIB Lithium ion battery, a member of a family of rechargeable batteries. Lithium ion batteries are typically found in a range of uses from pacemakers, power tools, cameras, smoke alarms and security systems and are increasingly replacing Lead Acid Batteries for use in golf carts. Chemistry, performance, cost and safety characteristics vary across LIB types—for example, LiCoO2, NMC and LMO.
LMO Lithium manganese oxide.
Municipal waste Household wastes plus material from public place collection.
NiCd Nickel cadmium.
NiMH Nickel‐metal hydride.
NMC Lithium nickel manganese cobalt oxide, a chemistry typically found in batteries for power tools and medical equipment.
NTCRS National Television and Computer Recycling Scheme.
OEM Original equipment manufacturer.
Orphan product A battery or a product containing a battery that was manufactured or imported by a company that no longer exists.
Parallel import A non‐counterfeit, legitimate product imported from another country without the permission of the intellectual property owner.
PDA Personal digital assistant.
Primary battery A battery not intended for recharging.
Primary Product List The list of products, published each year by the Australian Government under the Product Stewardship Act 2011 that are being considered for product stewardship approaches.
Producer Responsibility Organisation (PRO)
The entity responsible for administering the Battery Product Stewardship Scheme to ensure the objectives and targets of the Scheme are met.
Product Stewardship An approach to reducing the environmental and other impacts of products by encouraging or requiring manufacturers, importers, distributors and other persons to take responsibility for those products.
RAM battery Rechargeable alkaline‐manganese battery that has a manganese dioxide positive electrode (cathode), a potassium hydroxide electrolyte, and a porous zinc gel as the negative electrode (anode).
Recyclable Material that can be collected separately from the general waste and sent for recycling. The precise definition will vary, depending upon location (i.e. systems exist for the recycling of some materials in some areas and not in others).
Recycle A process to recover constituent materials and use these materials to produce other products.
Recycling Where a material or product undergoes a form of processing to produce a feedstock suitable for the manufacture of new products.
Recycling efficiency The percentage of a battery that is recycled by weight.
Recovery End‐of‐life products or materials collected for either recycling or energy recovery.
RIS Regulation Impact Statement.
Reuse The transfer of a product to another user, with no major dismantling or processing required.
Secondary battery A battery intended for recharging.
Signatory A party that has signed the Battery Stewardship Agreement.
SKU Stock keeping unit. Typically a product that is offered for sale as a single item by a retail outlet. Examples of common handheld battery SKUs are a pack of 4 x AA rechargeable NiMH batteries, or a pack of 10 x AAA alkaline batteries.
Study into market share and stocks and flows of handheld batteries in Australia
Sustainable Resource Use Pty Ltd
Page 59
SLAB Sealed lead acid battery. A type of lead acid battery that is sealed and contains no free liquid electrolyte. These are commonly used for portable electrical devices, emergency lighting and alarm systems.
SLI Starting, lighting and ignition batteries.
Sorting To categorise batteries by their chemical composition to determine the most appropriate management process.
SSLA Small sealed lead acid (battery).
Steward A Signatory to the Battery Stewardship Agreement.
Stocks Handheld batteries in service within the economy.
ULAB Used lead acid battery.
UNLAB Used non‐lead acid battery.
UPS Uninterruptible power supply.
Waste arising The estimate of handheld batteries in a particular year that have reached the end of their useful life or that are unwanted for any reason and require disposal through any route.
Study into market share and stocks and flows of handheld batteries in Australia
Sustainable Resource Use Pty Ltd
Page 60
10 REFERENCES ABRI, 2012a. Confidential survey of Australian used lead‐acid battery (ULAB) recycling. Sydney: Australian Battery Recycling Initiative.
ABRI, 2012b. ABRI submission on the battery backup capability on the National Broadband Network. Sydney: Australian Battery Recycling Initiative.
ABS, 2010. Household and Faily Projections 2006 to 2031, time series spreadsheet, cat. no. 3236.0. [Online] Available at: http://www.abs.gov.au/ausstats/[email protected]/mf/1233.0 [Accessed 20 December 2013].
ABS, 2011. Australian Harmonized Export Commodity Classification (AHECC), cat. no. 1233. [Online] Available at: http://www.abs.gov.au/ausstats/[email protected]/mf/1233.0 [Accessed 20 December 2013].
ABS, 2012. Environmental Issues: Waste Management, Transport and Motor Vehicle Usage, time series spreadsheet, Mar 2012. cat. no. 4602.0.55.002. [Online] Available at: http://www.abs.gov.au/ausstats/[email protected]/cat/4602.0.55.002 [Accessed 20 December 2013].
ABS, 2013a. Population by Age and Sex, Regions of Australia, Time series spreadsheet 30 June 2012. cat. no. 3235.0. [Online] Available at: http://www.abs.gov.au/AUSSTATS/[email protected]/DetailsPage/3235.02012?OpenDocument [Accessed 23 January 2014].
ADEME, 2003–2012. Rapport annuel du Registre des Piles et Accumulateurs, France.
AMTA, 2013. Annual Report 2013, Canberra: Australian Mobile Telecommunications Association.
ASARI, M., 2012. Battery recycling and flow analysis of them in Japan.
Avicenne, 2012. The worldwide Battery market 2011‐2025.
BCC Research, 2012. Portable Battery Powered Products: Global Markets, Wellesley, Massachusetts: BCC Research.
BCN Award, 2014. BCN Award 2014. [Online] Available at: http://bcnranking.jp/award/gallery/2014/hard/p2.html [Accessed 8 May 2014].
BEBAT, 2013. Personal correspondence.
Bing Lee, 2014. Bathroom scale manufacturer specifications. [Online] Available at: http://www.binglee.com.au/personal‐care/scales‐1 [Accessed 30 April 2014].
Bio Intelligence, 2008. Battery labelling study for European Commission.
Business Spectator, 2014. Tablet sales in Australia double to 4.8 million units, Melbourne: Business Specator.
Canis, B., 2013. Battery Manufacturing for Hybrid and Electric Vehicles: Policy Issues, Congressional Research Service.
Canon, 2014. Canon Europe calculator specifications. [Online] Available at: http://www.canon‐europe.com/ [Accessed 6 May 2014].
Century Yuasa, 2014. Century Yuasa Batteries product catalogue, Brisbane: Century Yuasa Batteries.
Study into market share and stocks and flows of handheld batteries in Australia
Sustainable Resource Use Pty Ltd
Page 61
Choice, 2014. Various product reviews, Marrickville: Choice.
DFAT, 2014a. Battery related imports by the Combined Australian Customs Tariff Nomenclature and Statistical Classification (the Customs Tariff) code – Customised report, Canberra: Department of Foreign Affairs and Trade.
DFAT, 2014b. Battery related exports by the Combined Australian Customs Tariff Nomenclature and Statistical Classification (the Customs Tariff) code – Customised report, Canberra: Department of Foreign Affairs and Trade.
Energizer, 2014. Technical Information ‐ Product Engineering Guide. [Online] Available at: http://data.energizer.com/Default.aspx [Accessed 30 April 2014].
European Commission, 2003. EUR‐Lex ‐ 32002L0095 ‐ EN‐EUR. [Online] Available at: http://eur‐lex.europa.eu/legal‐content/EN/NOT/?uri=CELEX:32002L0095 [Accessed 13 May 2014].
Eurostat, 2014. Total population, Candidate countries and potential candidates (tgs0027). [Online] Available at: http://epp.eurostat.ec.europa.eu/portal/page/portal/population/data/main_tables# [Accessed 13 May 2014].
Every Battery, 2014. Every Battery. [Online] Available at: http://www.everybattery.com.au/ [Accessed 8 May 2014].
Feuilherade, P., 2012. Electric cycles gaining ground worldwide. [Online] Available at: http://www.iec.ch/etech/2012/etech_0412/ind‐1.htm
Frank E. Jamerson, P. w. E. B., 2014. LEV / EV Technology Revealing the Revolution in Two Wheel Mobility.
Gartner, 2014. Gartner Says Annual Smartphone Sales Surpassed Sales of Feature Phones for the First Time in 2013. [Online] Available at: http://www.gartner.com/newsroom/id/2665715 [Accessed 7 May 2014].
Global Industry Analysts, 2013. Outdoor Appliances and Power Tools Market.
GRS, 2003–2012. Annual Review, Hamburg, Germany.
Industry Survey, 2014. Confidential industry survey responses.
INOBAT, 2012. Tätigkeitsbericht, Zurich, Switzerland.
Ipsos, 2014a. Battery recycling consumer survey, North Sydney: Ipsos Australia – Report prepared for the Australian Mobile Telecommunications Association (AMTA).
Ipsos, 2014b. Batteries in storage estimates short report, North Sydney: Ipsos Australia – Report prepared for the Australian Mobile Telecommunications Association (AMTA).
Kyocera, 2010. Kyocera FS‐C2026MFP/FS‐C2126MFP Operation Guide. Fairfield: Kyocera Corporation.
MacArthur, J., 2014. E‐Bikes in the North America: Results from an online survey, s.l.: Portland State University.
Navigant Research, 2013. Electric Vehicle Batteries: Global Market Analysis and Forecasts. [Online] Available at: http://transportation.research.pdx.edu/sites/default/files/JMacArthur%2010‐18.pdf
Study into market share and stocks and flows of handheld batteries in Australia
Sustainable Resource Use Pty Ltd
Page 62
Navigant Research, 2013. Global Market Opportunities, Barriers, Technology Issues, and Demand Forecasts for E‐Bicycles, Pedal‐Assist Bicycles, and E‐Bicycle Batteries and Motors.
NBR, 2010. National Battery Register of Luxembourg, Luxembourg: Luxembourg Government.
News, C. I., n.d. Electric bike laws to bring on changes. [Online] Available at: http://www.allianz.com.au/car‐insurance/news/electric‐bike‐laws‐to‐bring‐on‐changes
NPD Group, 2014. U.S. Commercial Channel Computing Device Sales Set to End 2013 with Double‐Digit Growth, Port Washington: NPD Group.
NSW EPA, 2014. NSW battery information request response, Sydney: New South Wales Environment Protection Authority.
NT Government, 2014. NT battery information request response [Interview] 2014.
Panasonic, 2013. The Latest Survey for Average Age of Batteries Returned in Japan (conference presentation). Dubrovnik, Mike Takao for Panasonic Corp. & Battery Association of Japan.
Peplow, M., 2014. Cheap battery stores energy for a rainy day. [Online] Available at: http://www.nature.com/news/cheap‐battery‐stores‐energy‐for‐a‐rainy‐day‐1.14486
ProductReview.com.au, 2014. Kitchen scale reviews and specifications. [Online] Available at: http://www.productreview.com.au/c/kitchen‐scales.html [Accessed 30 April 2014].
Queensland DEHP, 2014. QLD battery information data request [Interview] 2014.
R&J Batteries, 2014. Fullriver Batteries product catalogue, Guangzhou: Fullriver Battery Manufacture Co. Ltd..
Retail Media, 2009. Retail World Annual Report 2009, North Parramatta: Retail Media.
Retail Media, 2010. Retail World Annual Report 2010, North Parramatta: Retail Media.
Retail Media, 2011. Retail World Annual Report 2011, North Parramatta: Retail Media.
Retail Media, 2012. Retail World Annual Report 2012, North Parramatta: Retail Media.
Richard Van Noorden, 2014. The rechargeable revolution: A better battery. [Online] Available at: http://www.nature.com/news/the‐rechargeable‐revolution‐a‐better‐battery‐1.14815
Rose, G., 2005. Encouraging E‐bike use: the need for regulatory reform in Australia. [Online] Available at: http://eng.monash.edu.au/civil/assets/document/research/centres/its/confs‐workshops/archive/rose‐tram.pdf
SRU, 2014a. MRI site visit and interview, Melbourne: Sustainable Resource Use.
SRU, 2014b. R&J Batteries site visit and interview, Melbourne: Sustainable Resource Use.
SRU, 2014c. Supermarket and hardware shop audits, Melbourne: Sustainable Resource Use.
SRU, 2014d. National survey of handheld battery brandowners, Melbourne: Sustainable Resource Use.
SRU, 2014e. National survey of handheld battery collection programs and reprocessors, Melbourne: Sustainable Resource Use.
Study into market share and stocks and flows of handheld batteries in Australia
Sustainable Resource Use Pty Ltd
Page 63
SSB PowerSport, 2014. SSB LawnPower. [Online] Available at: http://www.ssbpowersport.com.au/ [Accessed 06 May 2014].
Stihl, 2013. Annual Report.
SV, 2013a. Detox Your Home permanent sites data 2005–2012, Melbourne: Sustainability Victoria.
SV, 2013b. Mobile Detox your Home ‐ Collections Statistics 1994–2013, Melbourne: Sustainability Victoria.
SV, 2014. Brand‐owner battery audits of the Victorian Batteryback program (December 2013), Melbourne: Sustainability Victoria.
Takao, M., 2013. The Latest Survey for Average Age of Batteries Returned in Japan. s.l., Panasonic.
Viking, 2014. VIKING übersteigt erstmals 150 Millionen Euro Umsatz. [Online] Available at: http://www.viking.at/erfreuliche‐bilanz‐2014‐fuer‐viking.aspx
WA DER, 2014. WA battery information request response [Interview] 2014.
WA LGA, 2013. Household Hazardous Waste Program Annual Report 2012–2013, Perth: WA Local Government Association.
Warnken, 2010. Analysis of Battery Consumption, Recycling and Disposal in Australia, Glebe: Warnken ISE, reported prepared for the Australian Battery Recycling Initiative (ABRI).
Weydanz, W., 2009. Power Tools: Batteries, s.l.: Elsevier B.V..
Wiaux, J.‐P., 2012. Challenges for the rechargeable battery industry. Belgium, RECHARGE ‐ The European Association for Advanced Rechargeable Batteries.
Yanoresearch, 2012. Next‐Generation Rechargeable Batteries Market.
Yanoresearch, 2012. UPS Market in Japan: Key Research Findings. [Online] Available at: http://www.yanoresearch.com/press/press.php/001037
Zero Waste SA, 2014. SA battery information request response, Adelaide: Zero Waste SA.
Study into market share and stocks and flows of handheld batteries in Australia
Sustainable Resource Use Pty Ltd
Page 64
APPENDIX A – STAKEHOLDERS CONSULTED
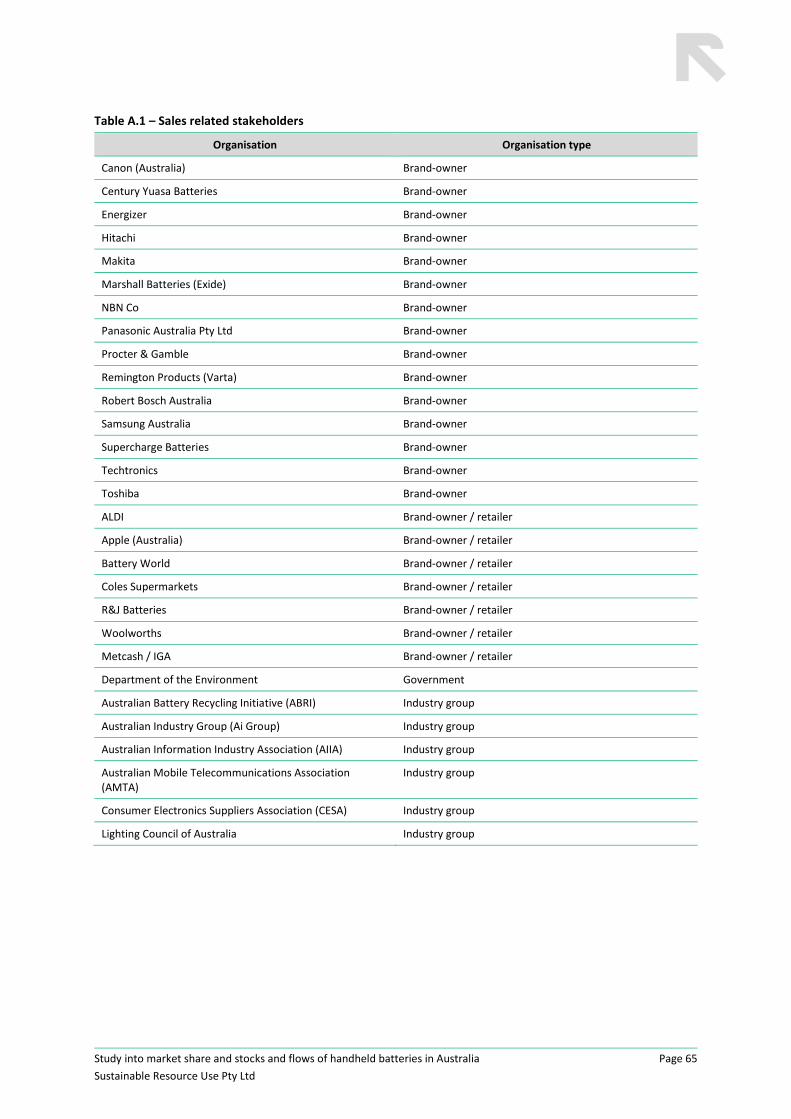
Study into market share and stocks and flows of handheld batteries in Australia
Sustainable Resource Use Pty Ltd
Page 65
Table A.1 – Sales related stakeholders
Organisation Organisation type
Canon (Australia) Brand‐owner
Century Yuasa Batteries Brand‐owner
Energizer Brand‐owner
Hitachi Brand‐owner
Makita Brand‐owner
Marshall Batteries (Exide) Brand‐owner
NBN Co Brand‐owner
Panasonic Australia Pty Ltd Brand‐owner
Procter & Gamble Brand‐owner
Remington Products (Varta) Brand‐owner
Robert Bosch Australia Brand‐owner
Samsung Australia Brand‐owner
Supercharge Batteries Brand‐owner
Techtronics Brand‐owner
Toshiba Brand‐owner
ALDI Brand‐owner / retailer
Apple (Australia) Brand‐owner / retailer
Battery World Brand‐owner / retailer
Coles Supermarkets Brand‐owner / retailer
R&J Batteries Brand‐owner / retailer
Woolworths Brand‐owner / retailer
Metcash / IGA Brand‐owner / retailer
Department of the Environment Government
Australian Battery Recycling Initiative (ABRI) Industry group
Australian Industry Group (Ai Group) Industry group
Australian Information Industry Association (AIIA) Industry group
Australian Mobile Telecommunications Association (AMTA)
Industry group
Consumer Electronics Suppliers Association (CESA) Industry group
Lighting Council of Australia Industry group
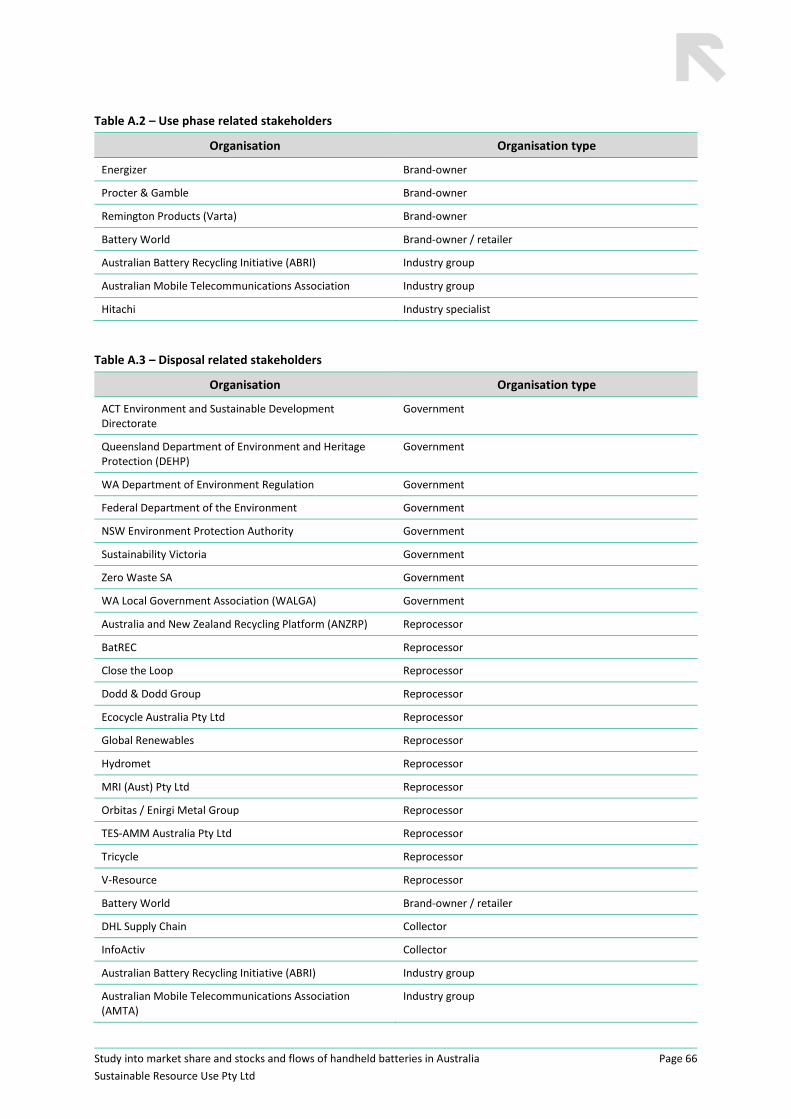
Study into market share and stocks and flows of handheld batteries in Australia
Sustainable Resource Use Pty Ltd
Page 66
Table A.2 – Use phase related stakeholders
Organisation Organisation type
Energizer Brand‐owner
Procter & Gamble Brand‐owner
Remington Products (Varta) Brand‐owner
Battery World Brand‐owner / retailer
Australian Battery Recycling Initiative (ABRI) Industry group
Australian Mobile Telecommunications Association Industry group
Hitachi Industry specialist
Table A.3 – Disposal related stakeholders
Organisation Organisation type
ACT Environment and Sustainable Development Directorate
Government
Queensland Department of Environment and Heritage Protection (DEHP)
Government
WA Department of Environment Regulation Government
Federal Department of the Environment Government
NSW Environment Protection Authority Government
Sustainability Victoria Government
Zero Waste SA Government
WA Local Government Association (WALGA) Government
Australia and New Zealand Recycling Platform (ANZRP) Reprocessor
BatREC Reprocessor
Close the Loop Reprocessor
Dodd & Dodd Group Reprocessor
Ecocycle Australia Pty Ltd Reprocessor
Global Renewables Reprocessor
Hydromet Reprocessor
MRI (Aust) Pty Ltd Reprocessor
Orbitas / Enirgi Metal Group Reprocessor
TES‐AMM Australia Pty Ltd Reprocessor
Tricycle Reprocessor
V‐Resource Reprocessor
Battery World Brand‐owner / retailer
DHL Supply Chain Collector
InfoActiv Collector
Australian Battery Recycling Initiative (ABRI) Industry group
Australian Mobile Telecommunications Association (AMTA)
Industry group
Study into market share and stocks and flows of handheld batteries in Australia
Sustainable Resource Use Pty Ltd
Page 67
APPENDIX B – DETAILED METHODOLOGY
Study into market share and stocks and flows of handheld batteries in Australia
Sustainable Resource Use Pty Ltd
Page 68
The study methodology was originally presented in the detailed project plan report which was approved by the project steering group.
The methodology has comprised the following main elements:
1. MFA system development
Classifications and definitions specification.
MFA system flowcharting and specification.
2. Data collection
Primary data collection.
Supporting data collection.
Data collection summary reporting.
Steering group meeting.
3. Data analysis
Material flow analysis (MFA) development.
Forecasting.
Sensitivity analysis.
4. Reporting
Trend analysis/market assessment report (draft).
Steering group meeting.
Trend analysis/market assessment report (final).
Presentation of findings to the BIWG.
The method applied to each of these elements is described below.
B.1 MFA system development
Classifications and definitions specification
Provided in this section is the specification of the lists of key terms that inform the structure of data
collection, the material flow analysis (MFA) modelling and reporting.
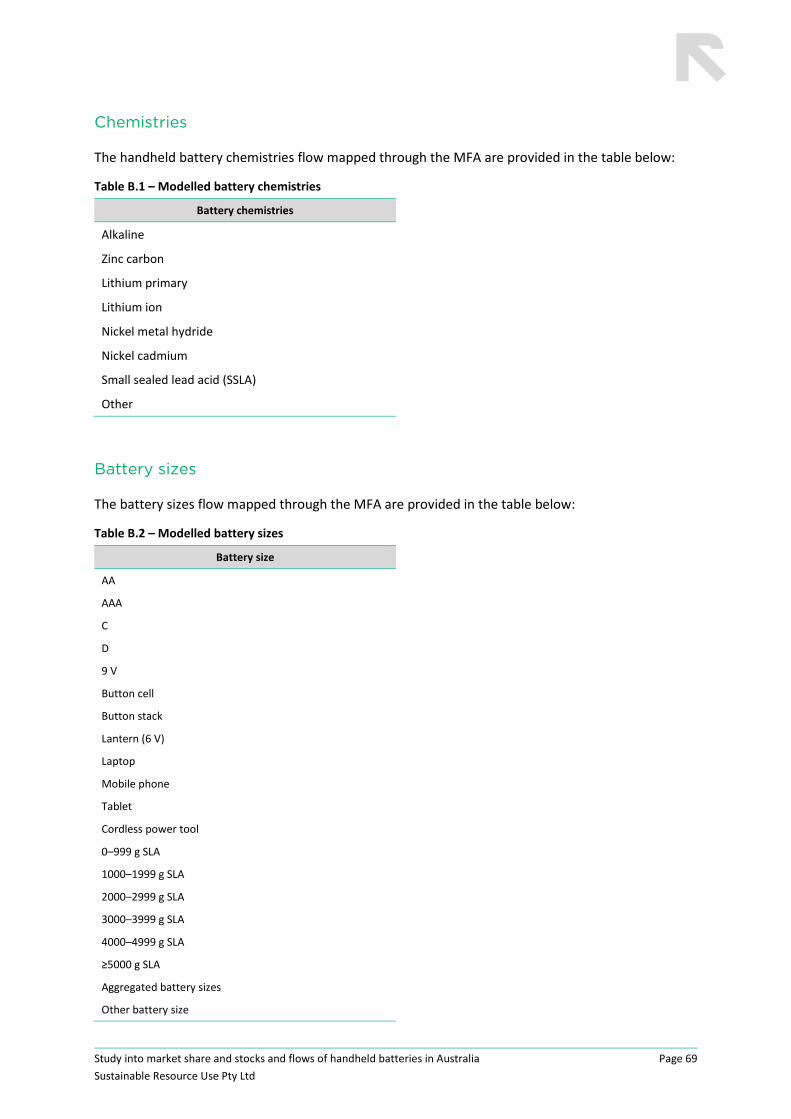
Study into market share and stocks and flows of handheld batteries in Australia
Sustainable Resource Use Pty Ltd
Page 69
Chemistries
The handheld battery chemistries flow mapped through the MFA are provided in the table below:
Table B.1 – Modelled battery chemistries
Battery chemistries
Alkaline
Zinc carbon
Lithium primary
Lithium ion
Nickel metal hydride
Nickel cadmium
Small sealed lead acid (SSLA)
Other
Battery sizes
The battery sizes flow mapped through the MFA are provided in the table below:
Table B.2 – Modelled battery sizes
Battery size
AA
AAA
C
D
9 V
Button cell
Button stack
Lantern (6 V)
Laptop
Mobile phone
Tablet
Cordless power tool
0–999 g SLA
1000–1999 g SLA
2000–2999 g SLA
3000–3999 g SLA
4000–4999 g SLA
≥5000 g SLA
Aggregated battery sizes
Other battery size
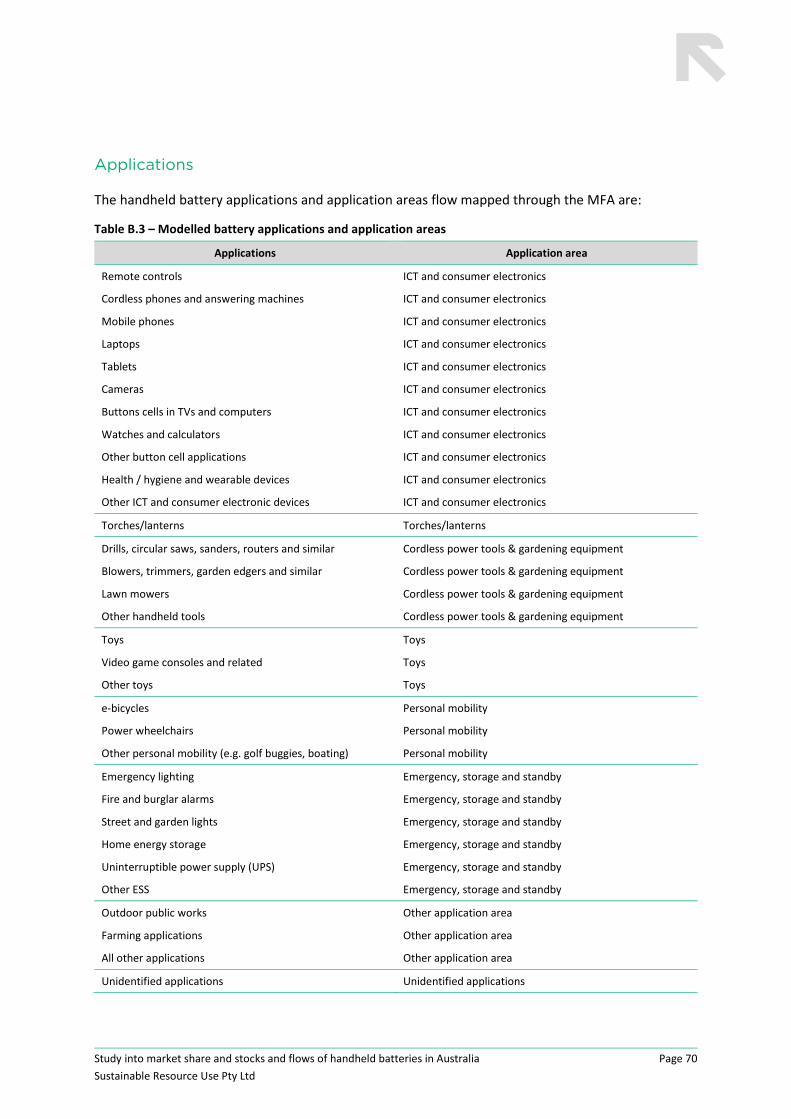
Study into market share and stocks and flows of handheld batteries in Australia
Sustainable Resource Use Pty Ltd
Page 70
Applications
The handheld battery applications and application areas flow mapped through the MFA are:
Table B.3 – Modelled battery applications and application areas
Applications Application area
Remote controls ICT and consumer electronics
Cordless phones and answering machines ICT and consumer electronics
Mobile phones ICT and consumer electronics
Laptops ICT and consumer electronics
Tablets ICT and consumer electronics
Cameras ICT and consumer electronics
Buttons cells in TVs and computers ICT and consumer electronics
Watches and calculators ICT and consumer electronics
Other button cell applications ICT and consumer electronics
Health / hygiene and wearable devices ICT and consumer electronics
Other ICT and consumer electronic devices ICT and consumer electronics
Torches/lanterns Torches/lanterns
Drills, circular saws, sanders, routers and similar Cordless power tools & gardening equipment
Blowers, trimmers, garden edgers and similar Cordless power tools & gardening equipment
Lawn mowers Cordless power tools & gardening equipment
Other handheld tools Cordless power tools & gardening equipment
Toys Toys
Video game consoles and related Toys
Other toys Toys
e‐bicycles Personal mobility
Power wheelchairs Personal mobility
Other personal mobility (e.g. golf buggies, boating) Personal mobility
Emergency lighting Emergency, storage and standby
Fire and burglar alarms Emergency, storage and standby
Street and garden lights Emergency, storage and standby
Home energy storage Emergency, storage and standby
Uninterruptible power supply (UPS) Emergency, storage and standby
Other ESS Emergency, storage and standby
Outdoor public works Other application area
Farming applications Other application area
All other applications Other application area
Unidentified applications Unidentified applications
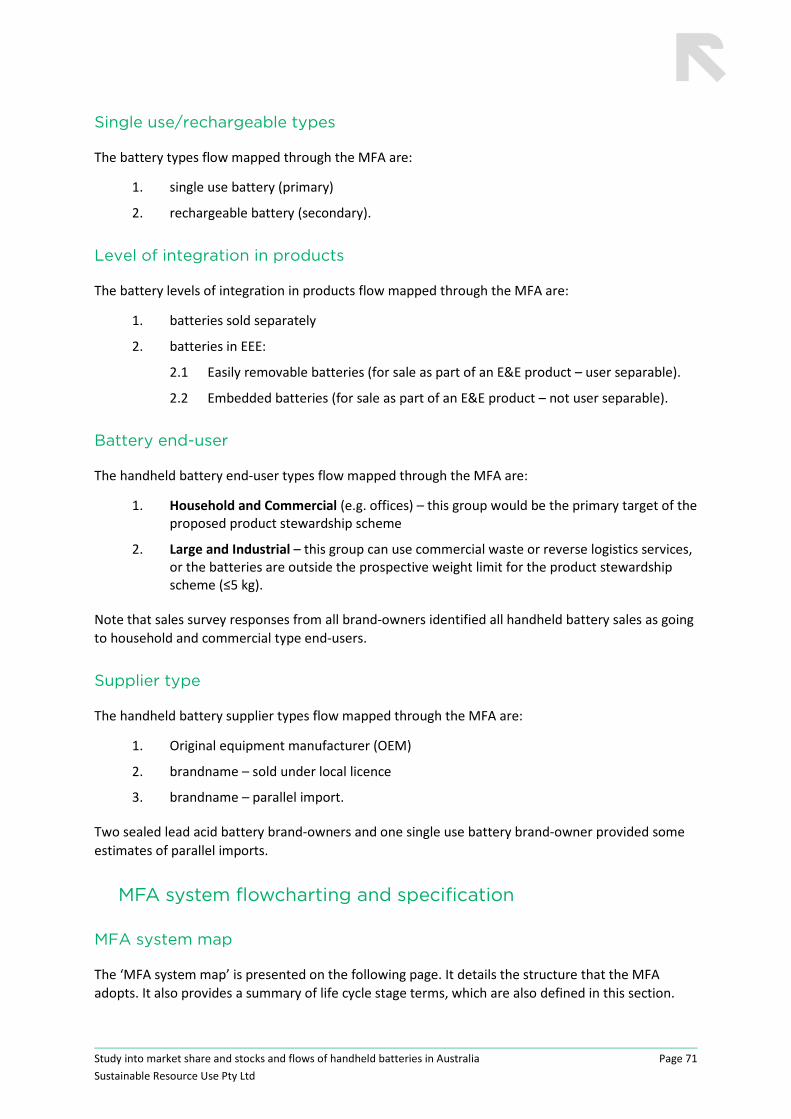
Study into market share and stocks and flows of handheld batteries in Australia
Sustainable Resource Use Pty Ltd
Page 71
Single use/rechargeable types
The battery types flow mapped through the MFA are:
1. single use battery (primary)
2. rechargeable battery (secondary).
Level of integration in products
The battery levels of integration in products flow mapped through the MFA are:
1. batteries sold separately
2. batteries in EEE:
2.1 Easily removable batteries (for sale as part of an E&E product – user separable).
2.2 Embedded batteries (for sale as part of an E&E product – not user separable).
Battery end-user
The handheld battery end‐user types flow mapped through the MFA are:
1. Household and Commercial (e.g. offices) – this group would be the primary target of the proposed product stewardship scheme
2. Large and Industrial – this group can use commercial waste or reverse logistics services, or the batteries are outside the prospective weight limit for the product stewardship scheme (≤5 kg).
Note that sales survey responses from all brand‐owners identified all handheld battery sales as going
to household and commercial type end‐users.
Supplier type
The handheld battery supplier types flow mapped through the MFA are:
1. Original equipment manufacturer (OEM)
2. brandname – sold under local licence
3. brandname – parallel import.
Two sealed lead acid battery brand‐owners and one single use battery brand‐owner provided some
estimates of parallel imports.
MFA system flowcharting and specification
MFA system map
The ‘MFA system map’ is presented on the following page. It details the structure that the MFA
adopts. It also provides a summary of life cycle stage terms, which are also defined in this section.

Study into market share and stocks and flows of handheld batteries in Australia
Sustainable Resource Use Pty Ltd
Page 72
Figure B.1 – Handheld battery MFA system map
Flowchart abbreviations:
EEE – Electrical and electronic equipment
HHCC – Hazardous household chemical collection
E‐waste – Waste electrical and electronic equipment
C&I – Commercial and industrial
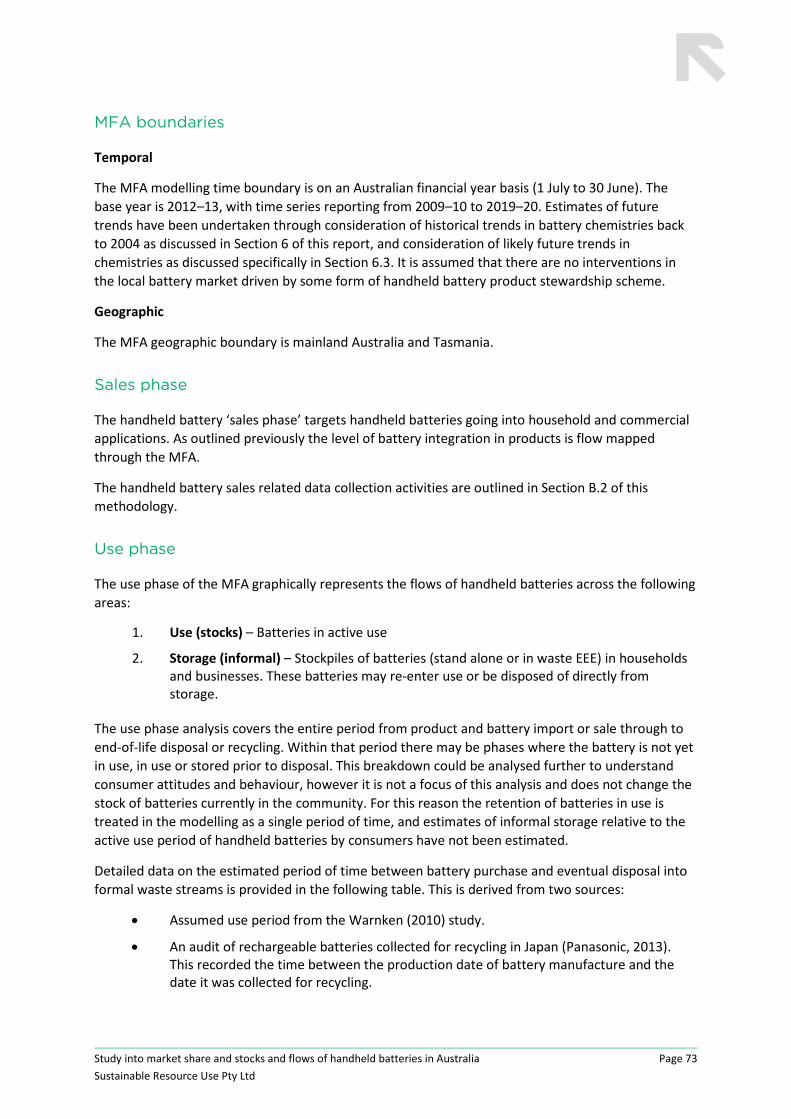
Study into market share and stocks and flows of handheld batteries in Australia
Sustainable Resource Use Pty Ltd
Page 73
MFA boundaries
Temporal
The MFA modelling time boundary is on an Australian financial year basis (1 July to 30 June). The
base year is 2012–13, with time series reporting from 2009–10 to 2019–20. Estimates of future
trends have been undertaken through consideration of historical trends in battery chemistries back
to 2004 as discussed in Section 6 of this report, and consideration of likely future trends in
chemistries as discussed specifically in Section 6.3. It is assumed that there are no interventions in
the local battery market driven by some form of handheld battery product stewardship scheme.
Geographic
The MFA geographic boundary is mainland Australia and Tasmania.
Sales phase
The handheld battery ‘sales phase’ targets handheld batteries going into household and commercial
applications. As outlined previously the level of battery integration in products is flow mapped
through the MFA.
The handheld battery sales related data collection activities are outlined in Section B.2 of this
methodology.
Use phase
The use phase of the MFA graphically represents the flows of handheld batteries across the following
areas:
1. Use (stocks) – Batteries in active use
2. Storage (informal) – Stockpiles of batteries (stand alone or in waste EEE) in households and businesses. These batteries may re‐enter use or be disposed of directly from storage.
The use phase analysis covers the entire period from product and battery import or sale through to
end‐of‐life disposal or recycling. Within that period there may be phases where the battery is not yet
in use, in use or stored prior to disposal. This breakdown could be analysed further to understand
consumer attitudes and behaviour, however it is not a focus of this analysis and does not change the
stock of batteries currently in the community. For this reason the retention of batteries in use is
treated in the modelling as a single period of time, and estimates of informal storage relative to the
active use period of handheld batteries by consumers have not been estimated.
Detailed data on the estimated period of time between battery purchase and eventual disposal into
formal waste streams is provided in the following table. This is derived from two sources:
Assumed use period from the Warnken (2010) study.
An audit of rechargeable batteries collected for recycling in Japan (Panasonic, 2013). This recorded the time between the production date of battery manufacture and the date it was collected for recycling.
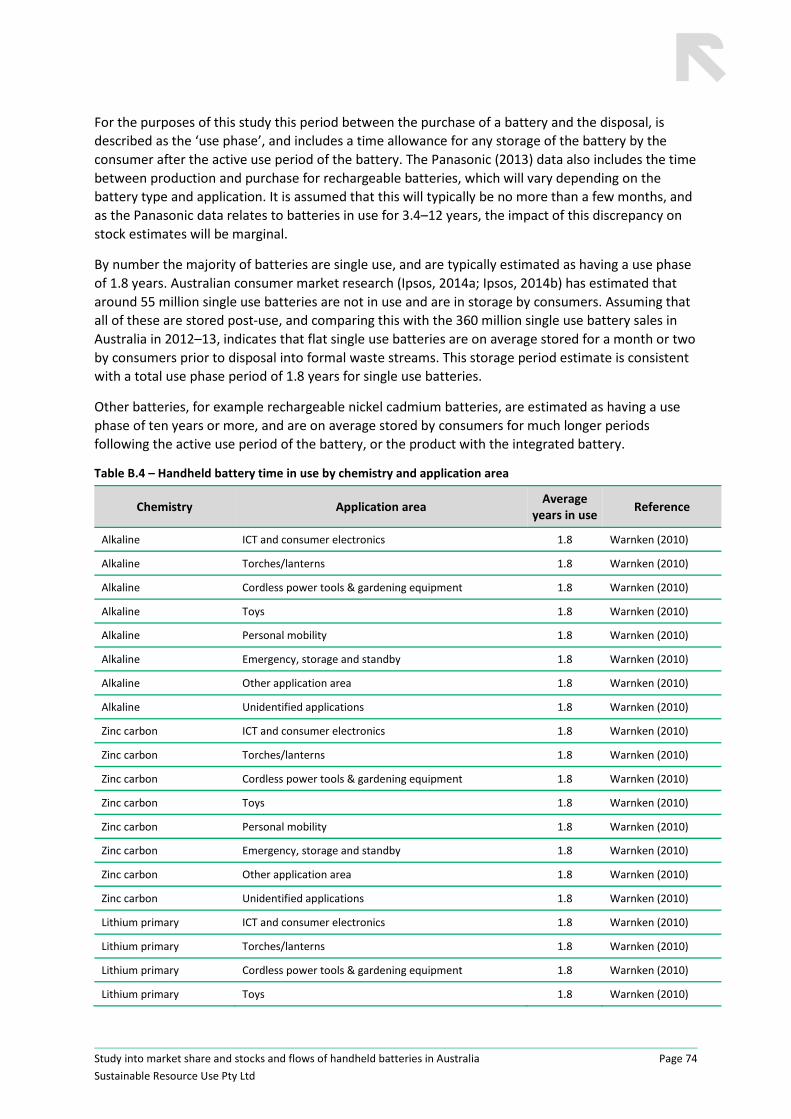
Study into market share and stocks and flows of handheld batteries in Australia
Sustainable Resource Use Pty Ltd
Page 74
For the purposes of this study this period between the purchase of a battery and the disposal, is
described as the ‘use phase’, and includes a time allowance for any storage of the battery by the
consumer after the active use period of the battery. The Panasonic (2013) data also includes the time
between production and purchase for rechargeable batteries, which will vary depending on the
battery type and application. It is assumed that this will typically be no more than a few months, and
as the Panasonic data relates to batteries in use for 3.4–12 years, the impact of this discrepancy on
stock estimates will be marginal.
By number the majority of batteries are single use, and are typically estimated as having a use phase
of 1.8 years. Australian consumer market research (Ipsos, 2014a; Ipsos, 2014b) has estimated that
around 55 million single use batteries are not in use and are in storage by consumers. Assuming that
all of these are stored post‐use, and comparing this with the 360 million single use battery sales in
Australia in 2012–13, indicates that flat single use batteries are on average stored for a month or two
by consumers prior to disposal into formal waste streams. This storage period estimate is consistent
with a total use phase period of 1.8 years for single use batteries.
Other batteries, for example rechargeable nickel cadmium batteries, are estimated as having a use
phase of ten years or more, and are on average stored by consumers for much longer periods
following the active use period of the battery, or the product with the integrated battery.
Table B.4 – Handheld battery time in use by chemistry and application area
Chemistry Application area Average
years in use Reference
Alkaline ICT and consumer electronics 1.8 Warnken (2010)
Alkaline Torches/lanterns 1.8 Warnken (2010)
Alkaline Cordless power tools & gardening equipment 1.8 Warnken (2010)
Alkaline Toys 1.8 Warnken (2010)
Alkaline Personal mobility 1.8 Warnken (2010)
Alkaline Emergency, storage and standby 1.8 Warnken (2010)
Alkaline Other application area 1.8 Warnken (2010)
Alkaline Unidentified applications 1.8 Warnken (2010)
Zinc carbon ICT and consumer electronics 1.8 Warnken (2010)
Zinc carbon Torches/lanterns 1.8 Warnken (2010)
Zinc carbon Cordless power tools & gardening equipment 1.8 Warnken (2010)
Zinc carbon Toys 1.8 Warnken (2010)
Zinc carbon Personal mobility 1.8 Warnken (2010)
Zinc carbon Emergency, storage and standby 1.8 Warnken (2010)
Zinc carbon Other application area 1.8 Warnken (2010)
Zinc carbon Unidentified applications 1.8 Warnken (2010)
Lithium primary ICT and consumer electronics 1.8 Warnken (2010)
Lithium primary Torches/lanterns 1.8 Warnken (2010)
Lithium primary Cordless power tools & gardening equipment 1.8 Warnken (2010)
Lithium primary Toys 1.8 Warnken (2010)
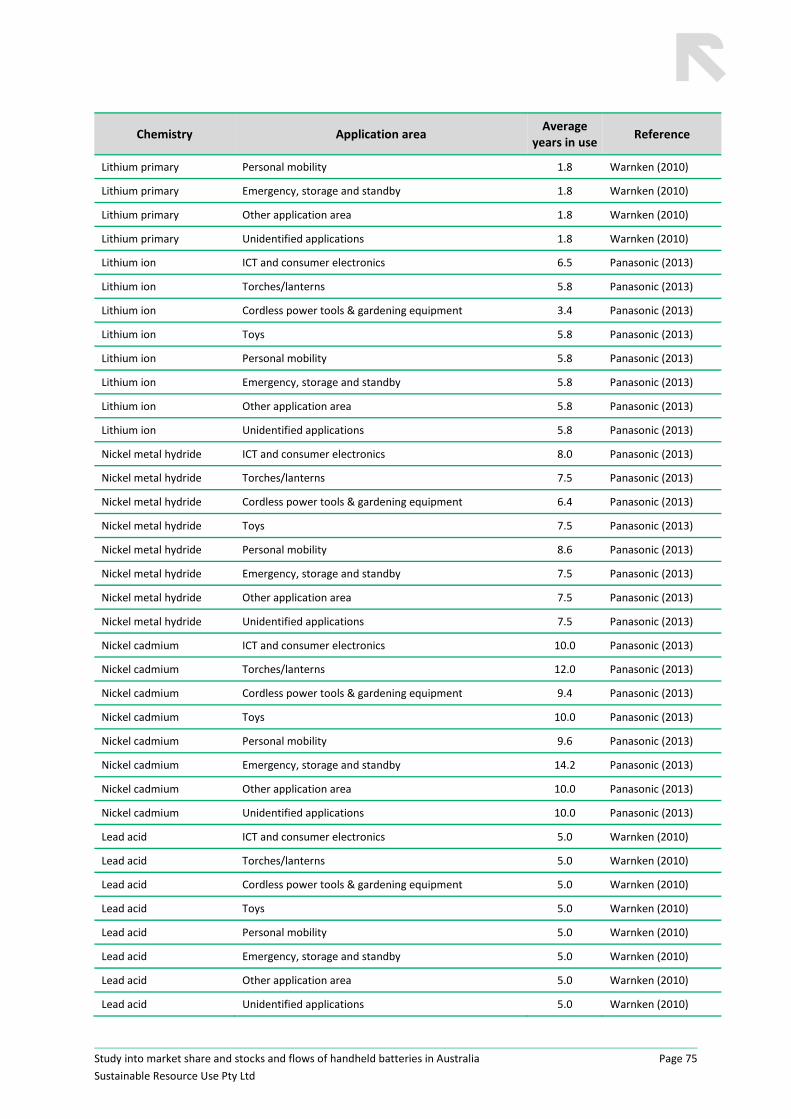
Study into market share and stocks and flows of handheld batteries in Australia
Sustainable Resource Use Pty Ltd
Page 75
Chemistry Application area Average
years in use Reference
Lithium primary Personal mobility 1.8 Warnken (2010)
Lithium primary Emergency, storage and standby 1.8 Warnken (2010)
Lithium primary Other application area 1.8 Warnken (2010)
Lithium primary Unidentified applications 1.8 Warnken (2010)
Lithium ion ICT and consumer electronics 6.5 Panasonic (2013)
Lithium ion Torches/lanterns 5.8 Panasonic (2013)
Lithium ion Cordless power tools & gardening equipment 3.4 Panasonic (2013)
Lithium ion Toys 5.8 Panasonic (2013)
Lithium ion Personal mobility 5.8 Panasonic (2013)
Lithium ion Emergency, storage and standby 5.8 Panasonic (2013)
Lithium ion Other application area 5.8 Panasonic (2013)
Lithium ion Unidentified applications 5.8 Panasonic (2013)
Nickel metal hydride ICT and consumer electronics 8.0 Panasonic (2013)
Nickel metal hydride Torches/lanterns 7.5 Panasonic (2013)
Nickel metal hydride Cordless power tools & gardening equipment 6.4 Panasonic (2013)
Nickel metal hydride Toys 7.5 Panasonic (2013)
Nickel metal hydride Personal mobility 8.6 Panasonic (2013)
Nickel metal hydride Emergency, storage and standby 7.5 Panasonic (2013)
Nickel metal hydride Other application area 7.5 Panasonic (2013)
Nickel metal hydride Unidentified applications 7.5 Panasonic (2013)
Nickel cadmium ICT and consumer electronics 10.0 Panasonic (2013)
Nickel cadmium Torches/lanterns 12.0 Panasonic (2013)
Nickel cadmium Cordless power tools & gardening equipment 9.4 Panasonic (2013)
Nickel cadmium Toys 10.0 Panasonic (2013)
Nickel cadmium Personal mobility 9.6 Panasonic (2013)
Nickel cadmium Emergency, storage and standby 14.2 Panasonic (2013)
Nickel cadmium Other application area 10.0 Panasonic (2013)
Nickel cadmium Unidentified applications 10.0 Panasonic (2013)
Lead acid ICT and consumer electronics 5.0 Warnken (2010)
Lead acid Torches/lanterns 5.0 Warnken (2010)
Lead acid Cordless power tools & gardening equipment 5.0 Warnken (2010)
Lead acid Toys 5.0 Warnken (2010)
Lead acid Personal mobility 5.0 Warnken (2010)
Lead acid Emergency, storage and standby 5.0 Warnken (2010)
Lead acid Other application area 5.0 Warnken (2010)
Lead acid Unidentified applications 5.0 Warnken (2010)
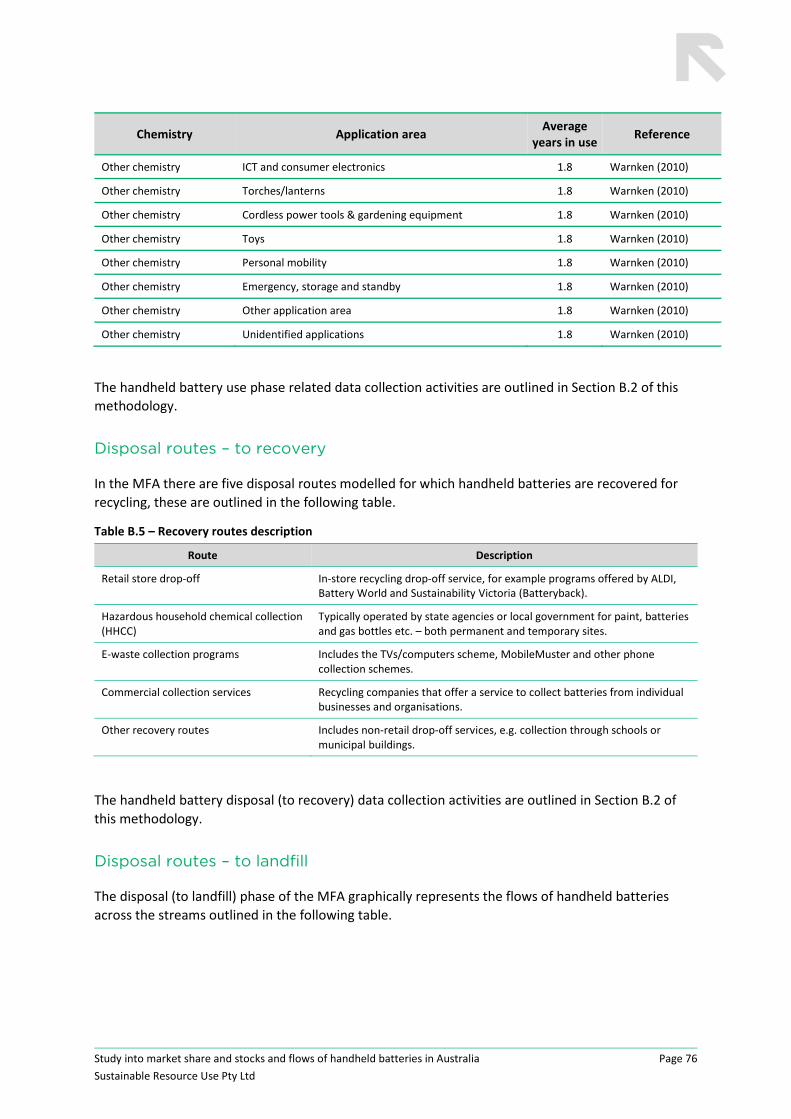
Study into market share and stocks and flows of handheld batteries in Australia
Sustainable Resource Use Pty Ltd
Page 76
Chemistry Application area Average
years in use Reference
Other chemistry ICT and consumer electronics 1.8 Warnken (2010)
Other chemistry Torches/lanterns 1.8 Warnken (2010)
Other chemistry Cordless power tools & gardening equipment 1.8 Warnken (2010)
Other chemistry Toys 1.8 Warnken (2010)
Other chemistry Personal mobility 1.8 Warnken (2010)
Other chemistry Emergency, storage and standby 1.8 Warnken (2010)
Other chemistry Other application area 1.8 Warnken (2010)
Other chemistry Unidentified applications 1.8 Warnken (2010)
The handheld battery use phase related data collection activities are outlined in Section B.2 of this
methodology.
Disposal routes – to recovery
In the MFA there are five disposal routes modelled for which handheld batteries are recovered for
recycling, these are outlined in the following table.
Table B.5 – Recovery routes description
Route Description
Retail store drop‐off In‐store recycling drop‐off service, for example programs offered by ALDI, Battery World and Sustainability Victoria (Batteryback).
Hazardous household chemical collection (HHCC)
Typically operated by state agencies or local government for paint, batteries and gas bottles etc. – both permanent and temporary sites.
E‐waste collection programs Includes the TVs/computers scheme, MobileMuster and other phone collection schemes.
Commercial collection services Recycling companies that offer a service to collect batteries from individual businesses and organisations.
Other recovery routes Includes non‐retail drop‐off services, e.g. collection through schools or municipal buildings.
The handheld battery disposal (to recovery) data collection activities are outlined in Section B.2 of
this methodology.
Disposal routes – to landfill
The disposal (to landfill) phase of the MFA graphically represents the flows of handheld batteries
across the streams outlined in the following table.
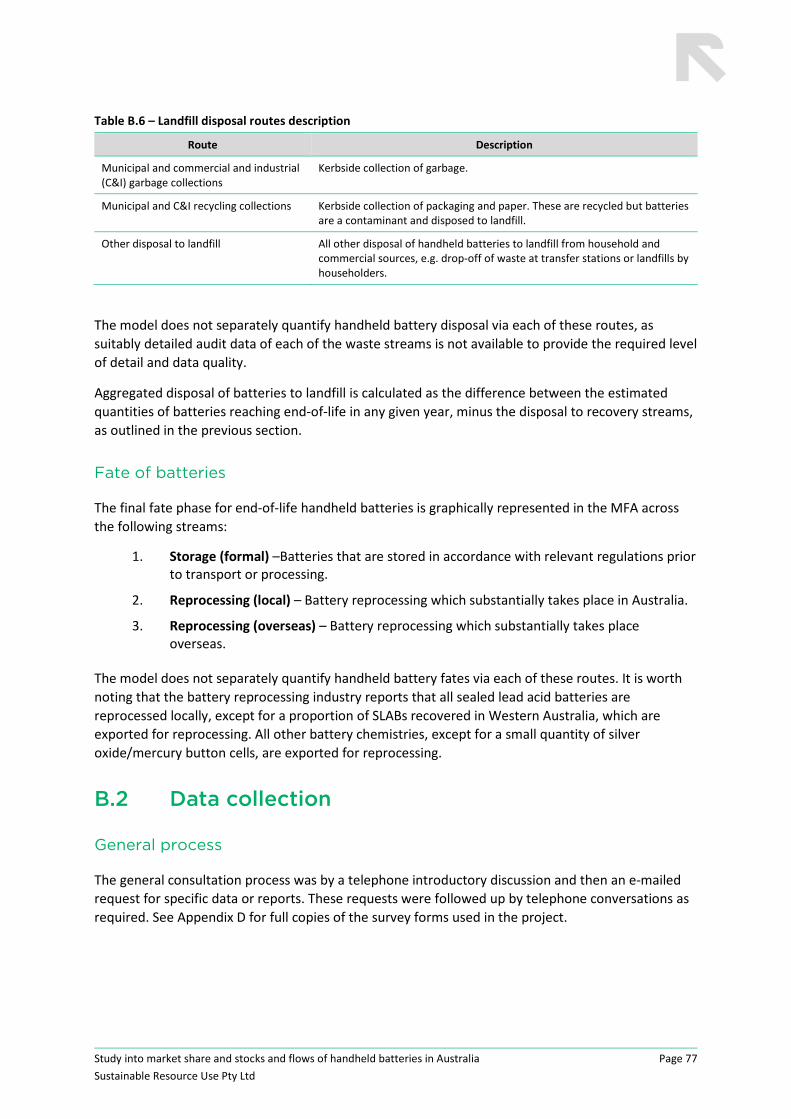
Study into market share and stocks and flows of handheld batteries in Australia
Sustainable Resource Use Pty Ltd
Page 77
Table B.6 – Landfill disposal routes description
Route Description
Municipal and commercial and industrial (C&I) garbage collections
Kerbside collection of garbage.
Municipal and C&I recycling collections Kerbside collection of packaging and paper. These are recycled but batteries are a contaminant and disposed to landfill.
Other disposal to landfill All other disposal of handheld batteries to landfill from household and commercial sources, e.g. drop‐off of waste at transfer stations or landfills by householders.
The model does not separately quantify handheld battery disposal via each of these routes, as
suitably detailed audit data of each of the waste streams is not available to provide the required level
of detail and data quality.
Aggregated disposal of batteries to landfill is calculated as the difference between the estimated
quantities of batteries reaching end‐of‐life in any given year, minus the disposal to recovery streams,
as outlined in the previous section.
Fate of batteries
The final fate phase for end‐of‐life handheld batteries is graphically represented in the MFA across
the following streams:
1. Storage (formal) –Batteries that are stored in accordance with relevant regulations prior to transport or processing.
2. Reprocessing (local) – Battery reprocessing which substantially takes place in Australia.
3. Reprocessing (overseas) – Battery reprocessing which substantially takes place overseas.
The model does not separately quantify handheld battery fates via each of these routes. It is worth
noting that the battery reprocessing industry reports that all sealed lead acid batteries are
reprocessed locally, except for a proportion of SLABs recovered in Western Australia, which are
exported for reprocessing. All other battery chemistries, except for a small quantity of silver
oxide/mercury button cells, are exported for reprocessing.
B.2 Data collection
General process
The general consultation process was by a telephone introductory discussion and then an e‐mailed
request for specific data or reports. These requests were followed up by telephone conversations as
required. See Appendix D for full copies of the survey forms used in the project.
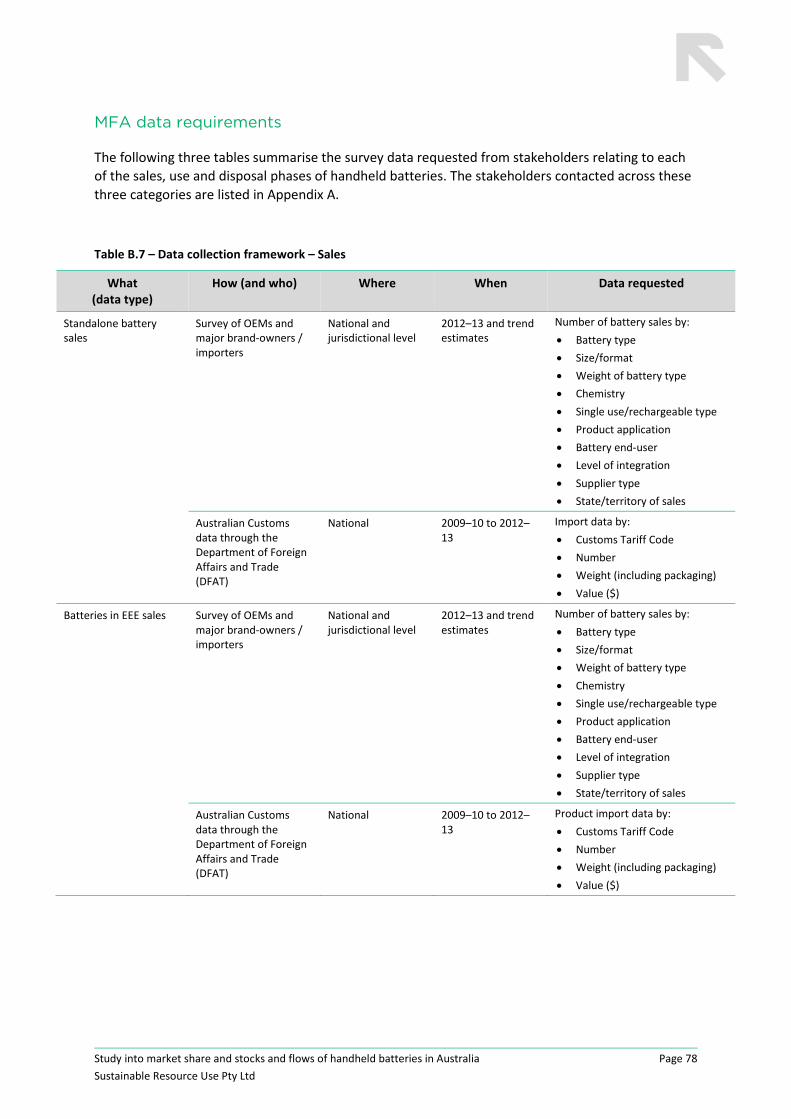
Study into market share and stocks and flows of handheld batteries in Australia
Sustainable Resource Use Pty Ltd
Page 78
MFA data requirements
The following three tables summarise the survey data requested from stakeholders relating to each
of the sales, use and disposal phases of handheld batteries. The stakeholders contacted across these
three categories are listed in Appendix A.
Table B.7 – Data collection framework – Sales
What (data type)
How (and who) Where When Data requested
Standalone battery sales
Survey of OEMs and major brand‐owners / importers
National and jurisdictional level
2012–13 and trend estimates
Number of battery sales by:
Battery type
Size/format
Weight of battery type
Chemistry
Single use/rechargeable type
Product application
Battery end‐user
Level of integration
Supplier type
State/territory of sales
Australian Customs data through the Department of Foreign Affairs and Trade (DFAT)
National 2009–10 to 2012–13
Import data by:
Customs Tariff Code
Number
Weight (including packaging)
Value ($)
Batteries in EEE sales Survey of OEMs and major brand‐owners / importers
National and jurisdictional level
2012–13 and trend estimates
Number of battery sales by:
Battery type
Size/format
Weight of battery type
Chemistry
Single use/rechargeable type
Product application
Battery end‐user
Level of integration
Supplier type
State/territory of sales
Australian Customs data through the Department of Foreign Affairs and Trade (DFAT)
National 2009–10 to 2012–13
Product import data by:
Customs Tariff Code
Number
Weight (including packaging)
Value ($)
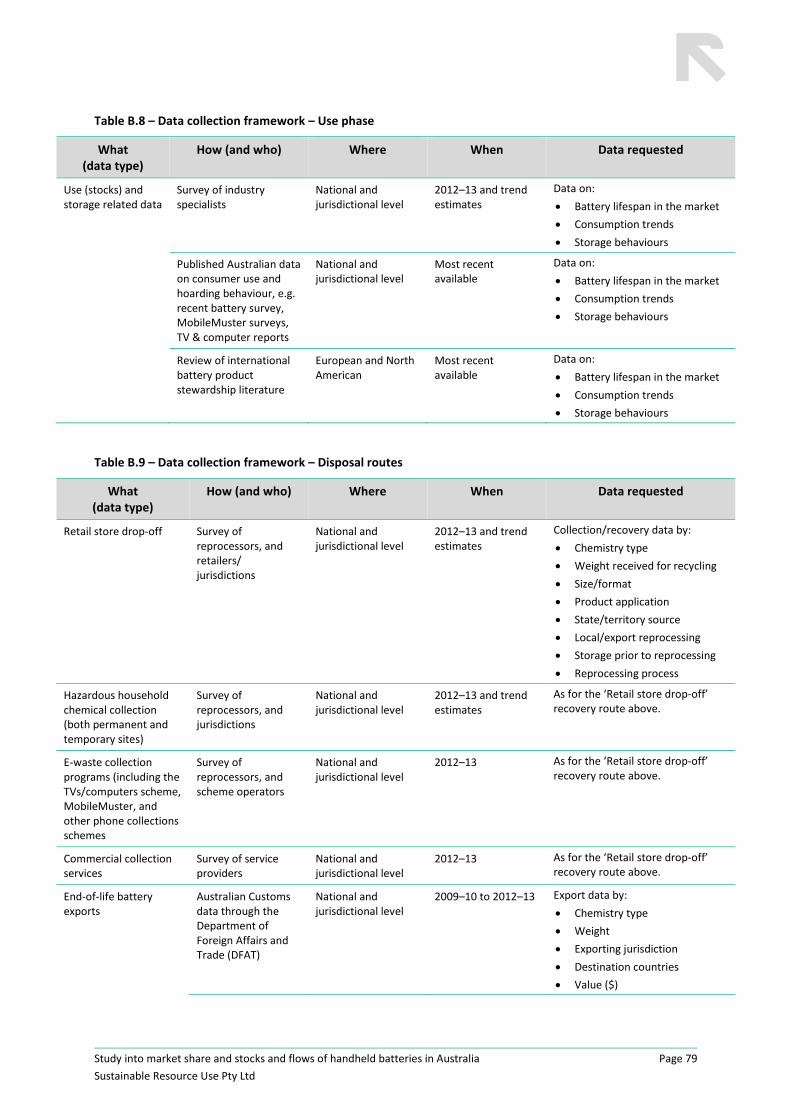
Study into market share and stocks and flows of handheld batteries in Australia
Sustainable Resource Use Pty Ltd
Page 79
Table B.8 – Data collection framework – Use phase
What (data type)
How (and who) Where When Data requested
Use (stocks) and storage related data
Survey of industry specialists
National and jurisdictional level
2012–13 and trend estimates
Data on:
Battery lifespan in the market
Consumption trends
Storage behaviours
Published Australian data on consumer use and hoarding behaviour, e.g. recent battery survey, MobileMuster surveys, TV & computer reports
National and jurisdictional level
Most recent available
Data on:
Battery lifespan in the market
Consumption trends
Storage behaviours
Review of international battery product stewardship literature
European and North American
Most recent available
Data on:
Battery lifespan in the market
Consumption trends
Storage behaviours
Table B.9 – Data collection framework – Disposal routes
What (data type)
How (and who) Where When Data requested
Retail store drop‐off Survey of reprocessors, and retailers/ jurisdictions
National and jurisdictional level
2012–13 and trend estimates
Collection/recovery data by:
Chemistry type
Weight received for recycling
Size/format
Product application
State/territory source
Local/export reprocessing
Storage prior to reprocessing
Reprocessing process
Hazardous household chemical collection (both permanent and temporary sites)
Survey of reprocessors, and jurisdictions
National and jurisdictional level
2012–13 and trend estimates
As for the ‘Retail store drop‐off’ recovery route above.
E‐waste collection programs (including the TVs/computers scheme, MobileMuster, and other phone collections schemes
Survey of reprocessors, and scheme operators
National and jurisdictional level
2012–13 As for the ‘Retail store drop‐off’ recovery route above.
Commercial collection services
Survey of service providers
National and jurisdictional level
2012–13 As for the ‘Retail store drop‐off’ recovery route above.
End‐of‐life battery exports
Australian Customs data through the Department of Foreign Affairs and Trade (DFAT)
National and jurisdictional level
2009–10 to 2012–13 Export data by:
Chemistry type
Weight
Exporting jurisdiction
Destination countries
Value ($)
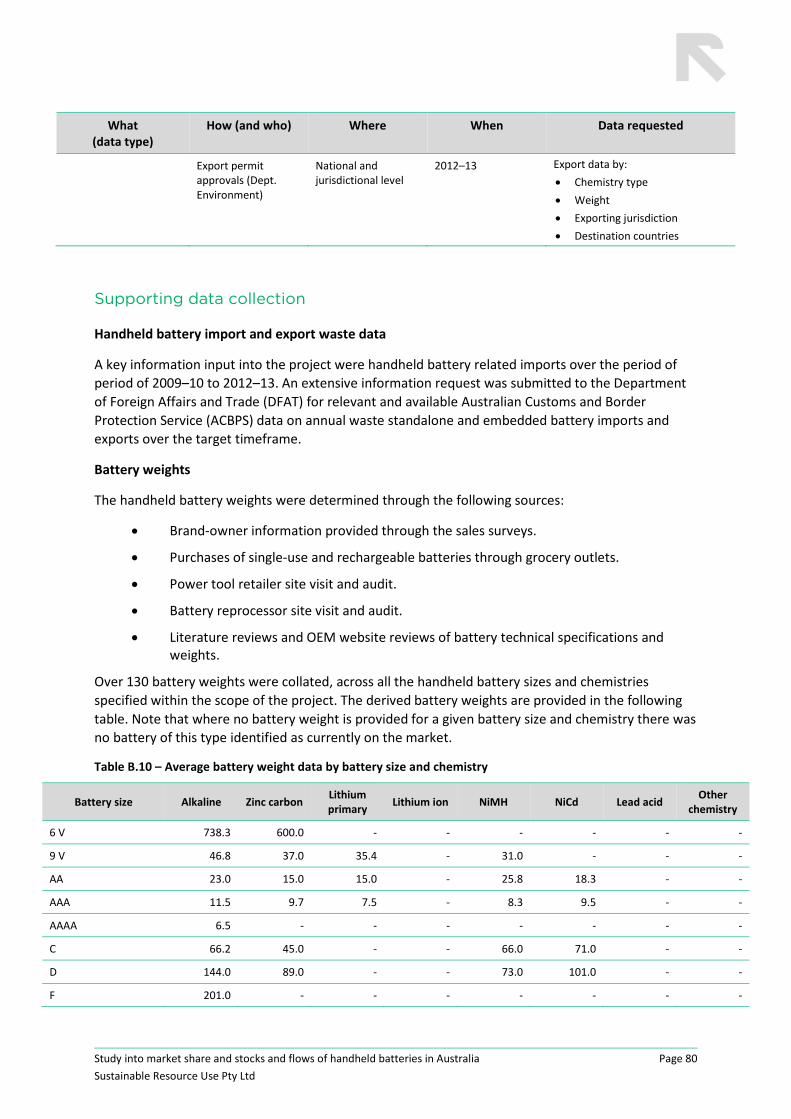
Study into market share and stocks and flows of handheld batteries in Australia
Sustainable Resource Use Pty Ltd
Page 80
What (data type)
How (and who) Where When Data requested
Export permit approvals (Dept. Environment)
National and jurisdictional level
2012–13 Export data by:
Chemistry type
Weight
Exporting jurisdiction
Destination countries
Supporting data collection
Handheld battery import and export waste data
A key information input into the project were handheld battery related imports over the period of
period of 2009–10 to 2012–13. An extensive information request was submitted to the Department
of Foreign Affairs and Trade (DFAT) for relevant and available Australian Customs and Border
Protection Service (ACBPS) data on annual waste standalone and embedded battery imports and
exports over the target timeframe.
Battery weights
The handheld battery weights were determined through the following sources:
Brand‐owner information provided through the sales surveys.
Purchases of single‐use and rechargeable batteries through grocery outlets.
Power tool retailer site visit and audit.
Battery reprocessor site visit and audit.
Literature reviews and OEM website reviews of battery technical specifications and weights.
Over 130 battery weights were collated, across all the handheld battery sizes and chemistries
specified within the scope of the project. The derived battery weights are provided in the following
table. Note that where no battery weight is provided for a given battery size and chemistry there was
no battery of this type identified as currently on the market.
Table B.10 – Average battery weight data by battery size and chemistry
Battery size Alkaline Zinc carbon Lithium primary
Lithium ion NiMH NiCd Lead acid Other
chemistry
6 V 738.3 600.0 ‐ ‐ ‐ ‐ ‐ ‐
9 V 46.8 37.0 35.4 ‐ 31.0 ‐ ‐ ‐
AA 23.0 15.0 15.0 ‐ 25.8 18.3 ‐ ‐
AAA 11.5 9.7 7.5 ‐ 8.3 9.5 ‐ ‐
AAAA 6.5 ‐ ‐ ‐ ‐ ‐ ‐ ‐
C 66.2 45.0 ‐ ‐ 66.0 71.0 ‐ ‐
D 144.0 89.0 ‐ ‐ 73.0 101.0 ‐ ‐
F 201.0 ‐ ‐ ‐ ‐ ‐ ‐ ‐

Study into market share and stocks and flows of handheld batteries in Australia
Sustainable Resource Use Pty Ltd
Page 81
Battery size Alkaline Zinc carbon Lithium primary
Lithium ion NiMH NiCd Lead acid Other
chemistry
J 3‐ ‐ ‐ ‐ ‐ ‐ ‐ ‐
Miniature 3.7 ‐ ‐ ‐ ‐ ‐ ‐ ‐
Multi‐cell ‐ ‐ 36.3 ‐ ‐ ‐ ‐ ‐
N 9.0 ‐ ‐ ‐ ‐ ‐ ‐ ‐
Button cell 2.1 ‐ 2.3 ‐ ‐ ‐ ‐ 0.9
Button stack 7.4 ‐ ‐ ‐ ‐ ‐ ‐ ‐
Laptop average ‐ ‐ ‐ 325.0 ‐ ‐ ‐ ‐
Tablet average ‐ ‐ ‐ 125.0 ‐ ‐ ‐ ‐
Mobile phone average
‐ ‐ ‐ 32.0 92.0 110.0 ‐ ‐
Cordless power tool average
‐ ‐ ‐ 635.8 ‐ 577.0 ‐ ‐
6 V / 1 Ah ‐ ‐ ‐ ‐ ‐ ‐ 310.0 ‐
6 V / 3 Ah ‐ ‐ ‐ ‐ ‐ ‐ 590.0 ‐
6 V / 4 Ah ‐ ‐ ‐ ‐ ‐ ‐ 710.0 ‐
6 V / 5 Ah ‐ ‐ ‐ ‐ ‐ ‐ 770.0 ‐
6 V / 7 Ah ‐ ‐ ‐ ‐ ‐ ‐ 1180.0 ‐
6 V / 10 Ah ‐ ‐ ‐ ‐ ‐ ‐ 1580.0 ‐
6 V / 12 Ah ‐ ‐ ‐ ‐ ‐ ‐ 1840.0 ‐
6 V / 14 Ah ‐ ‐ ‐ ‐ ‐ ‐ 2380.0 ‐
6 V / 20 Ah ‐ ‐ ‐ ‐ ‐ ‐ 4450.0 ‐
12 V / 1 Ah ‐ ‐ ‐ ‐ ‐ ‐ 465.0 ‐
12 V / 1.5 Ah ‐ ‐ ‐ 178.0 ‐ ‐ ‐ ‐
12 V / 2 Ah ‐ ‐ ‐ ‐ 376.0 577.0 900.0 ‐
12 V / 3 Ah ‐ ‐ ‐ 400.0 ‐ ‐ 1200.0 ‐
12 V / 4 Ah ‐ ‐ ‐ ‐ ‐ ‐ 1390.0 ‐
12 V / 5 Ah ‐ ‐ ‐ ‐ ‐ ‐ 1480.0 ‐
12 V / 7 Ah ‐ ‐ ‐ ‐ ‐ ‐ 2515.0 ‐
12 V / 10 Ah ‐ ‐ ‐ ‐ ‐ ‐ 3300.0 ‐
12 V / 12 Ah ‐ ‐ ‐ ‐ ‐ ‐ 4016.7 ‐
12 V / 17 Ah ‐ ‐ ‐ ‐ ‐ ‐ 6220.0 ‐
18 V / 2 Ah ‐ ‐ ‐ ‐ ‐ 1069.0 ‐ ‐
18 V / 3 Ah ‐ ‐ ‐ 658.0 ‐ ‐ ‐ ‐
18 V / 4 Ah ‐ ‐ ‐ 635.5 ‐ ‐ ‐ ‐
18 V / 5 Ah ‐ ‐ ‐ 614.0 ‐ ‐ ‐ ‐
Other battery size ‐ ‐ 13.8 22.0 ‐ ‐ ‐ ‐
Study into market share and stocks and flows of handheld batteries in Australia
Sustainable Resource Use Pty Ltd
Page 82
Data collection summary report
Following the completion of the data collection and consultation activities outlined in Section B.2,
the project team issued a short report to the project steering group summarising the data collection
outcomes.
B.3 Data analysis
Overview
In line with the MFA system outlined in Section B.1 the MFA model was developed in MS Excel. The
MFA reporting focusses on the 2012–13 year, but incorporates time‐series reporting out to 2019–20
on key model outputs.
Beyond performing the required calculations, MFA model is fully referenced and transparently
documents the many parameter estimations and assumptions undertaken throughout the modelling.
MFA inputs
Sales data
The key sales data inputs into the MFA model are the local brand‐owner sales survey responses and
the Customs import data.
For separately sold batteries the brand‐owner sales survey data was used to determine battery sizes
and chemistry splits, which were then applied to total market imports (by battery number) estimates
based on Customs import data.
For batteries sold in EEE, Customs import data was analysed to determine estimates of total market
imports (by battery number) by battery size, chemistry and application. This analysis was
supplemented by brand‐owner sales survey data, and through extensive product research to support
the conversion of EEE imports into equivalent battery numbers.
Numbers of separately sold batteries and batteries in EEE were then converted to a weight basis
using the separately collated battery weight data.
Use phase data
Use phase (stocks in active use + informal storage) data is based on 2012–13 sales data, calculated as
outlined above, incorporated with estimates of average handheld battery lifespans (see Table B.3)
and historical/future trends in battery chemistries.
To enable the estimation of handheld battery stocks and end‐of‐life arisings in any given year, a
handheld battery use phase time period distribution has been calculated for all battery chemistries
and application areas by assuming that period of battery use, prior to disposal, follows a normal
distribution. The standard deviation of the normal distribution was also required, which was
calculated by assuming that ~100% of the battery disposal events fall within three standard
deviations of the mean, that is, between μ ± 3σ. This means that six standard deviations is
approximately the distance between the minimum product life and the maximum product life. On
this basis the standard deviation can be estimated using:
Study into market share and stocks and flows of handheld batteries in Australia
Sustainable Resource Use Pty Ltd
Page 83
Equation B.1 σ ≈ (Max Life – Min Life)/6
To solve this equation it is also necessary to estimate the maximum life of the handheld battery (Max
Life), and the minimum life (Min Life). In all cases this has been done by assuming that Max Life is
twice the average lifespan, and Min Life is zero (i.e. immediate disposal).
Once solved, these use phase calculations enable the estimation of handheld battery stocks and end‐
of‐life arisings in any given year within the scoped time‐frame.
Disposal routes data
Handheld battery recovery for the 2012–13 year has been determined through the disposal survey of
reprocessors, government agencies, and other handheld battery recovery chain participants.
The quantity of handheld batteries disposed to landfill in 2012–13 is determined by subtracting the
estimated end‐of‐life arisings of handheld batteries in 2012–13 from the recovery as determined
through the disposal survey.
MFA outputs
The MFA provides estimates of handheld battery flows across sales, use and disposal in terms of:
chemistries
battery sizes
applications and application areas
single use / rechargeable battery type
level of integration in products.
It was also intended that sales data on supplier type (i.e. OEM / brand‐owner / parallel importer)
would be reported, however the data responses against this question were inconsistent, and analysis
of supplier type was not undertaken.
Brand-owner survey data
Survey responses of brand‐owner specific sales is commercially sensitive and is not reported in
project reports.
Jurisdictional analysis
The MFA geographic resolution sales and recovery data resolution is down to the state/territory level
where data supports this level of detail.
Handheld battery recycling rates have been determined in line with the methodology provided to the
SRU project team by the project steering group at the project inception meeting.
Efforts will be made to develop a robust, transparent MS Excel tool that will facilitate the consistent
replication of the MFA as required in the future.
Study into market share and stocks and flows of handheld batteries in Australia
Sustainable Resource Use Pty Ltd
Page 84
Forecasting
As outlined in Section 6.1 the sources of information to identify handheld battery trends and quantify
their impact on battery quantities have principally been historical data from battery schemes and
national battery registers across four European countries. The following trends have been
considered:
replacement of primary by secondary batteries
trend towards lithium based chemistries
trends portable IT devices sales and frequency of replacement
impact of battery driven leisure and gardening applications, e.g. electric bicycles and lawn‐mowers
manufacturing cost reductions (e.g. cobalt reduction in lithium batteries) which may affect the economics of collection and recycling.
‘Base‐case’ trend projections on stock and waste batteries arisings have been undertaken using the
best available forecast data, with sensitivity analysis undertaken on key parameters influencing
future trends.
Sensitivity analysis
Sensitivity analysis been undertaken on a number of key parameters to assist in informing
stakeholders on the model sensitivities and future areas where additional data collection could be
considered. The outcomes of this sensitivity analysis are provided in Section 8.1. The parameters
assessed are related to:
Battery lifespan estimates.
Trends between different chemistries, and from primary to secondary batteries.
Key assumptions made in Customs import data analysis.
Study into market share and stocks and flows of handheld batteries in Australia
Sustainable Resource Use Pty Ltd
Page 85
Other data analysis aspects
Provided here is a summary of other significant data analysis aspects applied in the MFA that have
not been documented elsewhere in this methodology.
There is a small amount of replacement mobile phone, laptop and notebook battery (lithium‐ion) imports, as reported by two manufacturers. These battery imports were estimated as being under 2% of total mobile/laptop/notebook sales in 2012–13, and are captured in the import data analysis.
Only one major local brand‐owner provided sales of lantern (6 volt) batteries. An estimate of lantern battery sales was determined by estimating the ratio of lantern batteries sales relative to combined C, D and 9 volt batteries for the available brand‐owner data and applying that ratio to national sales of C, D and 9 volt batteries as reported more widely. Six volt battery sales (by number) are estimated as being equivalent to 6% of combined C, D and 9 volt battery sales in 2012–13.
Wet cell (flooded cell) lead acid batteries are excluded from the scope of this study. For the purposes of excluding wet cell lead acid batteries from the study calculations wet cell lead acid batteries are estimated as making up 2.5% of the lead acid batteries ≤5 kg sold into the Australian market during 2012–13, with the primary market in motorcycles and scooters. The majority of lead acid batteries ≤5 kg are sealed lead acid batteries.
B.4 Reporting
Trend analysis/market assessment report
The trend analysis/market assessment report (this report) has been prepared that incorporates the
following aspects:
Material flow analysis outcomes.
Documentation of consumption data and trends.
Methodology development and documentation.
Sensitivity analysis outcomes.
2–3 page executive summary.
Detailed glossary of terms.
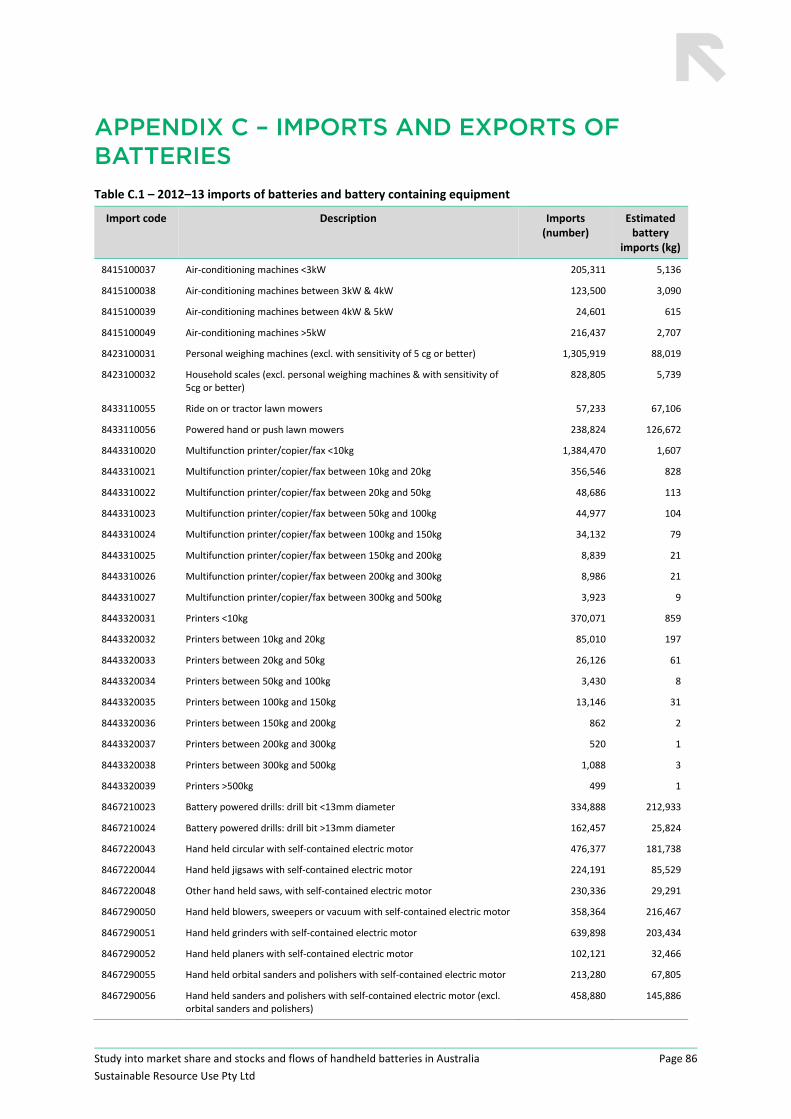
Study into market share and stocks and flows of handheld batteries in Australia
Sustainable Resource Use Pty Ltd
Page 86
APPENDIX C – IMPORTS AND EXPORTS OF BATTERIES Table C.1 – 2012–13 imports of batteries and battery containing equipment
Import code Description Imports (number)
Estimated battery
imports (kg)
8415100037 Air‐conditioning machines <3kW 205,311 5,136
8415100038 Air‐conditioning machines between 3kW & 4kW 123,500 3,090
8415100039 Air‐conditioning machines between 4kW & 5kW 24,601 615
8415100049 Air‐conditioning machines >5kW 216,437 2,707
8423100031 Personal weighing machines (excl. with sensitivity of 5 cg or better) 1,305,919 88,019
8423100032 Household scales (excl. personal weighing machines & with sensitivity of 5cg or better)
828,805 5,739
8433110055 Ride on or tractor lawn mowers 57,233 67,106
8433110056 Powered hand or push lawn mowers 238,824 126,672
8443310020 Multifunction printer/copier/fax <10kg 1,384,470 1,607
8443310021 Multifunction printer/copier/fax between 10kg and 20kg 356,546 828
8443310022 Multifunction printer/copier/fax between 20kg and 50kg 48,686 113
8443310023 Multifunction printer/copier/fax between 50kg and 100kg 44,977 104
8443310024 Multifunction printer/copier/fax between 100kg and 150kg 34,132 79
8443310025 Multifunction printer/copier/fax between 150kg and 200kg 8,839 21
8443310026 Multifunction printer/copier/fax between 200kg and 300kg 8,986 21
8443310027 Multifunction printer/copier/fax between 300kg and 500kg 3,923 9
8443320031 Printers <10kg 370,071 859
8443320032 Printers between 10kg and 20kg 85,010 197
8443320033 Printers between 20kg and 50kg 26,126 61
8443320034 Printers between 50kg and 100kg 3,430 8
8443320035 Printers between 100kg and 150kg 13,146 31
8443320036 Printers between 150kg and 200kg 862 2
8443320037 Printers between 200kg and 300kg 520 1
8443320038 Printers between 300kg and 500kg 1,088 3
8443320039 Printers >500kg 499 1
8467210023 Battery powered drills: drill bit <13mm diameter 334,888 212,933
8467210024 Battery powered drills: drill bit >13mm diameter 162,457 25,824
8467220043 Hand held circular with self‐contained electric motor 476,377 181,738
8467220044 Hand held jigsaws with self‐contained electric motor 224,191 85,529
8467220048 Other hand held saws, with self‐contained electric motor 230,336 29,291
8467290050 Hand held blowers, sweepers or vacuum with self‐contained electric motor 358,364 216,467
8467290051 Hand held grinders with self‐contained electric motor 639,898 203,434
8467290052 Hand held planers with self‐contained electric motor 102,121 32,466
8467290055 Hand held orbital sanders and polishers with self‐contained electric motor 213,280 67,805
8467290056 Hand held sanders and polishers with self‐contained electric motor (excl. orbital sanders and polishers)
458,880 145,886
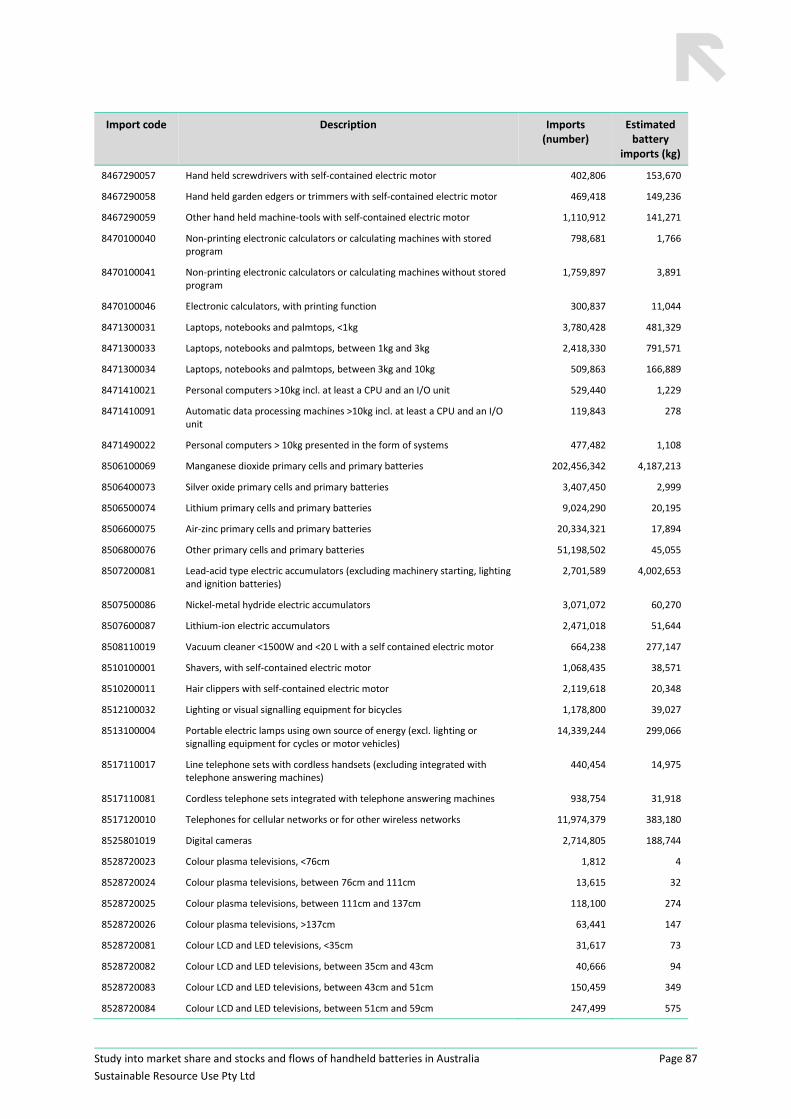
Study into market share and stocks and flows of handheld batteries in Australia
Sustainable Resource Use Pty Ltd
Page 87
Import code Description Imports (number)
Estimated battery
imports (kg)
8467290057 Hand held screwdrivers with self‐contained electric motor 402,806 153,670
8467290058 Hand held garden edgers or trimmers with self‐contained electric motor 469,418 149,236
8467290059 Other hand held machine‐tools with self‐contained electric motor 1,110,912 141,271
8470100040 Non‐printing electronic calculators or calculating machines with stored program
798,681 1,766
8470100041 Non‐printing electronic calculators or calculating machines without stored program
1,759,897 3,891
8470100046 Electronic calculators, with printing function 300,837 11,044
8471300031 Laptops, notebooks and palmtops, <1kg 3,780,428 481,329
8471300033 Laptops, notebooks and palmtops, between 1kg and 3kg 2,418,330 791,571
8471300034 Laptops, notebooks and palmtops, between 3kg and 10kg 509,863 166,889
8471410021 Personal computers >10kg incl. at least a CPU and an I/O unit 529,440 1,229
8471410091 Automatic data processing machines >10kg incl. at least a CPU and an I/O unit
119,843 278
8471490022 Personal computers > 10kg presented in the form of systems 477,482 1,108
8506100069 Manganese dioxide primary cells and primary batteries 202,456,342 4,187,213
8506400073 Silver oxide primary cells and primary batteries 3,407,450 2,999
8506500074 Lithium primary cells and primary batteries 9,024,290 20,195
8506600075 Air‐zinc primary cells and primary batteries 20,334,321 17,894
8506800076 Other primary cells and primary batteries 51,198,502 45,055
8507200081 Lead‐acid type electric accumulators (excluding machinery starting, lighting and ignition batteries)
2,701,589 4,002,653
8507500086 Nickel‐metal hydride electric accumulators 3,071,072 60,270
8507600087 Lithium‐ion electric accumulators 2,471,018 51,644
8508110019 Vacuum cleaner <1500W and <20 L with a self contained electric motor 664,238 277,147
8510100001 Shavers, with self‐contained electric motor 1,068,435 38,571
8510200011 Hair clippers with self‐contained electric motor 2,119,618 20,348
8512100032 Lighting or visual signalling equipment for bicycles 1,178,800 39,027
8513100004 Portable electric lamps using own source of energy (excl. lighting or signalling equipment for cycles or motor vehicles)
14,339,244 299,066
8517110017 Line telephone sets with cordless handsets (excluding integrated with telephone answering machines)
440,454 14,975
8517110081 Cordless telephone sets integrated with telephone answering machines 938,754 31,918
8517120010 Telephones for cellular networks or for other wireless networks 11,974,379 383,180
8525801019 Digital cameras 2,714,805 188,744
8528720023 Colour plasma televisions, <76cm 1,812 4
8528720024 Colour plasma televisions, between 76cm and 111cm 13,615 32
8528720025 Colour plasma televisions, between 111cm and 137cm 118,100 274
8528720026 Colour plasma televisions, >137cm 63,441 147
8528720081 Colour LCD and LED televisions, <35cm 31,617 73
8528720082 Colour LCD and LED televisions, between 35cm and 43cm 40,666 94
8528720083 Colour LCD and LED televisions, between 43cm and 51cm 150,459 349
8528720084 Colour LCD and LED televisions, between 51cm and 59cm 247,499 575
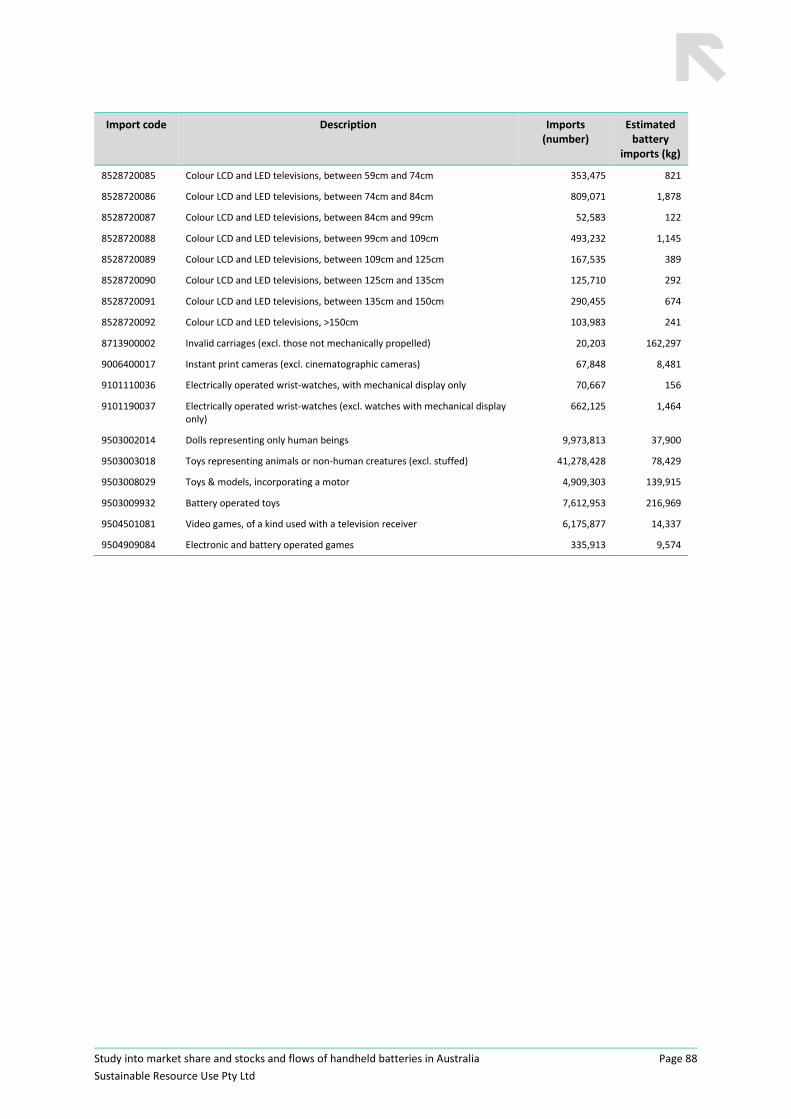
Study into market share and stocks and flows of handheld batteries in Australia
Sustainable Resource Use Pty Ltd
Page 88
Import code Description Imports (number)
Estimated battery
imports (kg)
8528720085 Colour LCD and LED televisions, between 59cm and 74cm 353,475 821
8528720086 Colour LCD and LED televisions, between 74cm and 84cm 809,071 1,878
8528720087 Colour LCD and LED televisions, between 84cm and 99cm 52,583 122
8528720088 Colour LCD and LED televisions, between 99cm and 109cm 493,232 1,145
8528720089 Colour LCD and LED televisions, between 109cm and 125cm 167,535 389
8528720090 Colour LCD and LED televisions, between 125cm and 135cm 125,710 292
8528720091 Colour LCD and LED televisions, between 135cm and 150cm 290,455 674
8528720092 Colour LCD and LED televisions, >150cm 103,983 241
8713900002 Invalid carriages (excl. those not mechanically propelled) 20,203 162,297
9006400017 Instant print cameras (excl. cinematographic cameras) 67,848 8,481
9101110036 Electrically operated wrist‐watches, with mechanical display only 70,667 156
9101190037 Electrically operated wrist‐watches (excl. watches with mechanical display only)
662,125 1,464
9503002014 Dolls representing only human beings 9,973,813 37,900
9503003018 Toys representing animals or non‐human creatures (excl. stuffed) 41,278,428 78,429
9503008029 Toys & models, incorporating a motor 4,909,303 139,915
9503009932 Battery operated toys 7,612,953 216,969
9504501081 Video games, of a kind used with a television receiver 6,175,877 14,337
9504909084 Electronic and battery operated games 335,913 9,574
Study into market share and stocks and flows of handheld batteries in Australia
Sustainable Resource Use Pty Ltd
Page 89
APPENDIX D – BATTERY SALES AND RECOVERY SURVEY FORMS
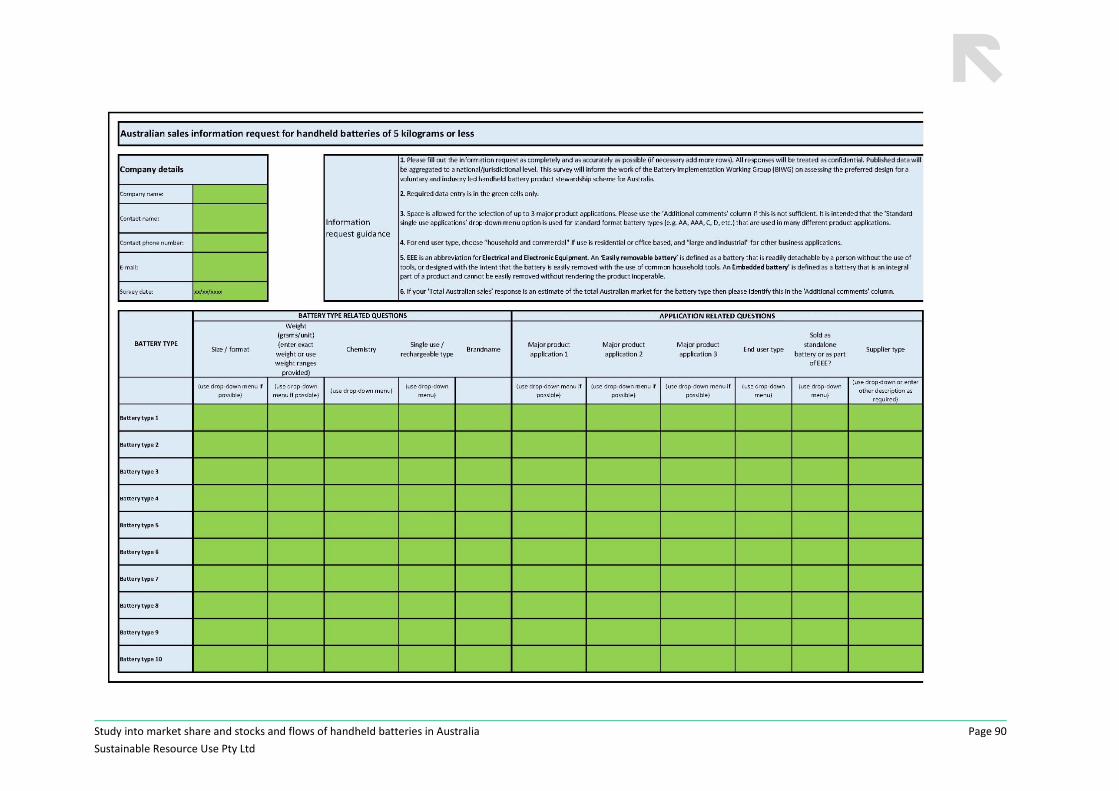
Study into market share and stocks and flows of handheld batteries in Australia
Sustainable Resource Use Pty Ltd
Page 90
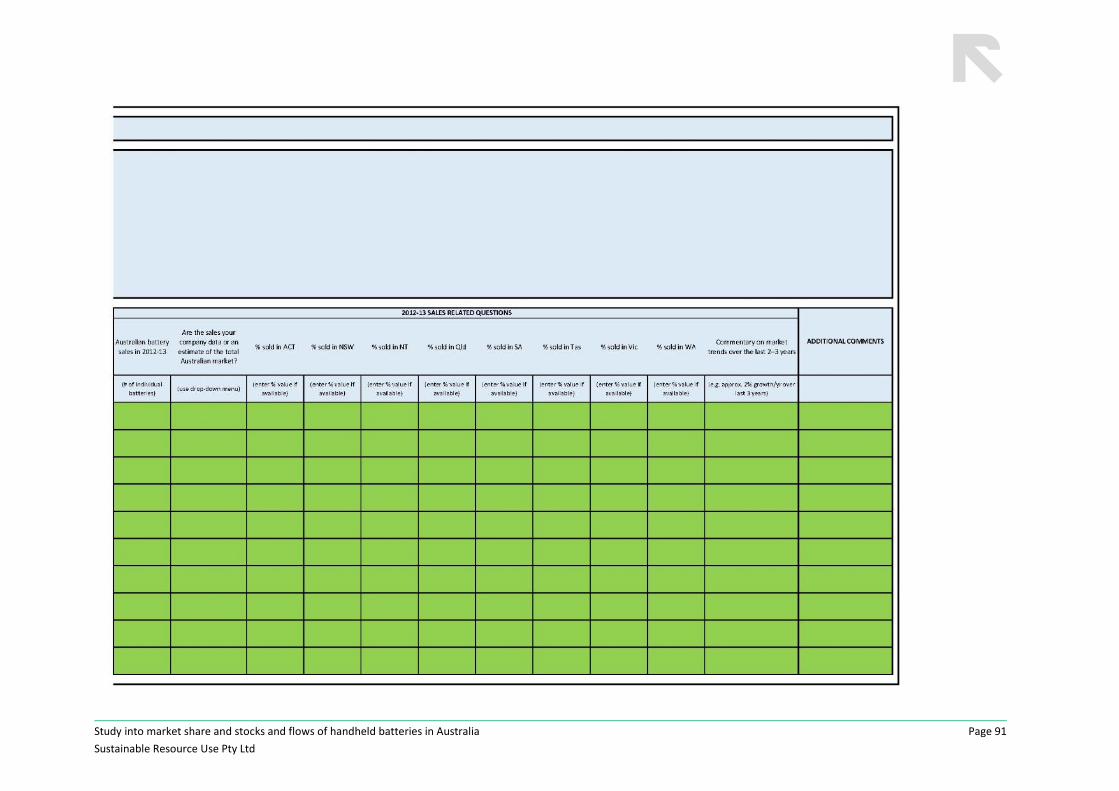
Study into market share and stocks and flows of handheld batteries in Australia
Sustainable Resource Use Pty Ltd
Page 91
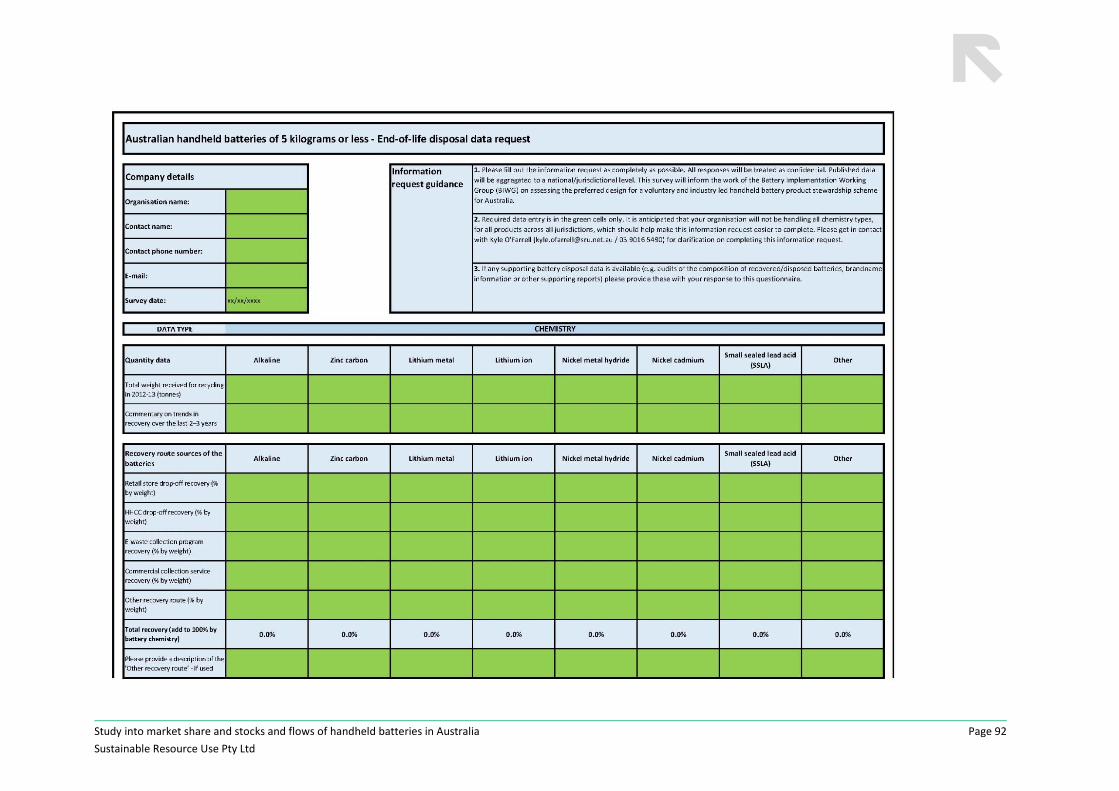
Study into market share and stocks and flows of handheld batteries in Australia
Sustainable Resource Use Pty Ltd
Page 92
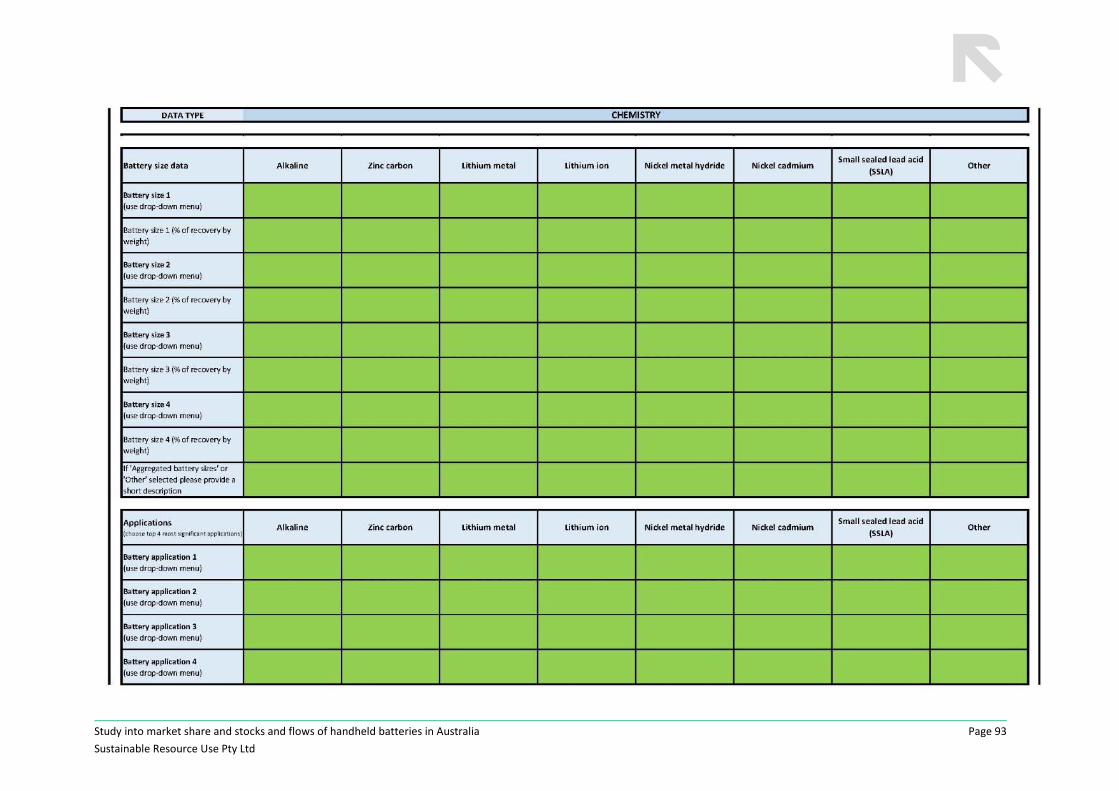
Study into market share and stocks and flows of handheld batteries in Australia
Sustainable Resource Use Pty Ltd
Page 93
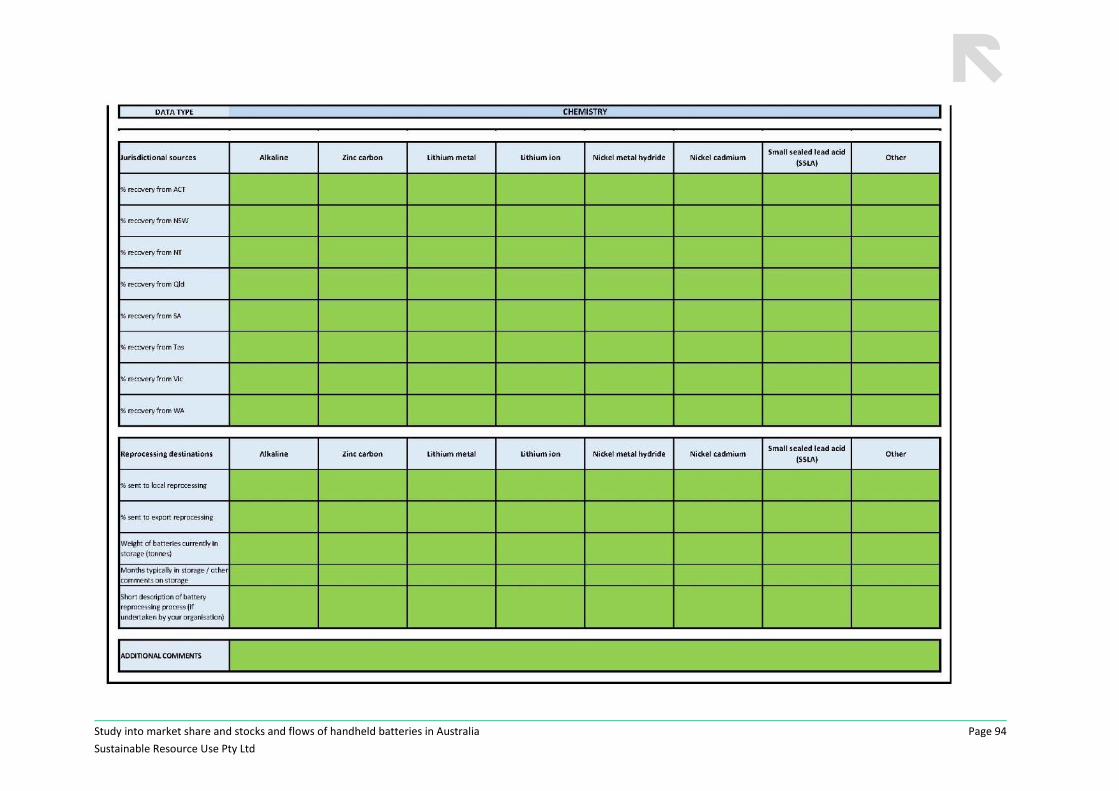
Study into market share and stocks and flows of handheld batteries in Australia
Sustainable Resource Use Pty Ltd
Page 94