Stock Market Timing Using Artificial Neural Networks and ...
16
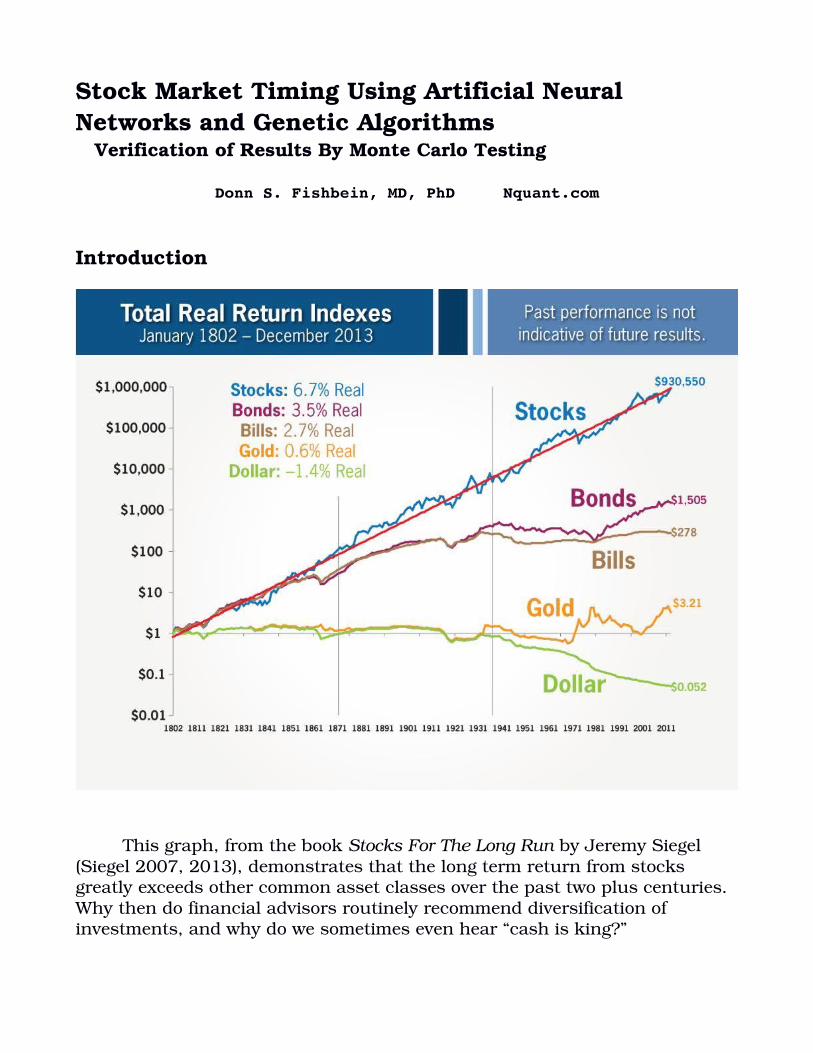
Stock Market Timing Using Artificial Neural Networks and Genetic Algorithms Verification of Results By Monte Carlo Testing Donn S. Fishbein, MD, PhD Nquant.com Introduction This graph, from the book Stocks For The Long Run by Jeremy Siegel (Siegel 2007, 2013), demonstrates that the long term return from stocks greatly exceeds other common asset classes over the past two plus centuries. Why then do financial advisors routinely recommend diversification of investments, and why do we sometimes even hear “cash is king?”
Transcript of Stock Market Timing Using Artificial Neural Networks and ...
Stock Market Timing Using Artificial Neural Networks and Genetic Algorithms Verification of Results By Monte Carlo Testing
Donn S. Fishbein, MD, PhD Nquant.com
Introduction
This graph, from the book Stocks For The Long Run by Jeremy Siegel
(Siegel 2007, 2013), demonstrates that the long term return from stocks greatly exceeds other common asset classes over the past two plus centuries. Why then do financial advisors routinely recommend diversification of investments, and why do we sometimes even hear “cash is king?”
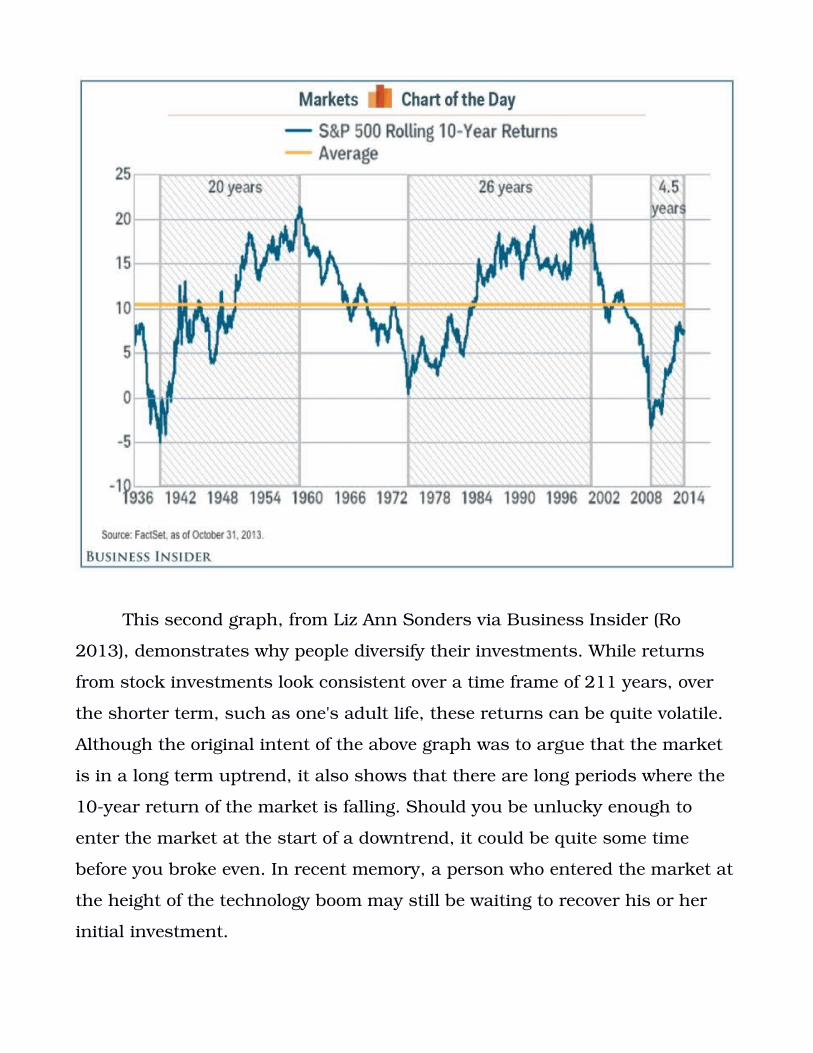
This second graph, from Liz Ann Sonders via Business Insider (Ro
2013), demonstrates why people diversify their investments. While returns
from stock investments look consistent over a time frame of 211 years, over
the shorter term, such as one's adult life, these returns can be quite volatile.
Although the original intent of the above graph was to argue that the market
is in a long term uptrend, it also shows that there are long periods where the
10year return of the market is falling. Should you be unlucky enough to
enter the market at the start of a downtrend, it could be quite some time
before you broke even. In recent memory, a person who entered the market at
the height of the technology boom may still be waiting to recover his or her
initial investment.
It is a quirk of human behavior that many people prefer lower draw
downs (maximum negative excursion) to higher total returns. When faced
with a choice between two investments, one yielding an 80% chance of a
$1,000 return, and one yielding a 100% chance of a $600 return, a majority
of people choose the latter, even though on average it will yield a lower total
return. Bernie Madoff''s scheme wooed sophisticated investors by promising
below average volatility and drawdown, even though his total return was often
less than that of the S&P 500 (Madoff, Wiki), and the method he said he
employed would not make money in a down market.
Despite the substantial coverage given to buyandhold strategies, the
average blended equity and fixedincome investor significantly lags broad
market averages and barely beats the rate of inflation (Hanlon 2014, Jaffe
2014, Maye 2012). The authors of these papers conclude the average investor
does in fact time the market, but driven more by emotion than logic, and
therefore does so poorly.
There is a middle ground between full time investment in the stock
market and diversification to decrease volatility (and returns). Methodically
developed, statistically verified mechanical, or automated, trading systems
can direct investments into the stock market during periods of market
uptrends, and to short stocks or direct capital into cash or other financial
classes during periods of market downtrends. Two keys to successful market
timing are developing systems which adapt to changing market conditions,
and the iterative testing of systems to demonstrate their success is due to
design rather than statistical chance.
To Time or Not To Time
There are two types of investors. The first type claims that the financial
markets can not be timed; that their movements are random and
unpredictable, and that market investment is worthwhile only because the
long term trend is up. Their advice is to buy assets and hold them for the long
term. This type of investor is subject to the whims of the market, and will
suffer long periods of stagnant or negative growth. The second type of investor
uses a variety of tools and techniques to determine buy and sell points, and
move from long to cash to short positions. If one is willing to invest the time
and effort to develop or evaluate profitable trading systems, the rewards can
be great.
In the realm of financial markets, the random walk theory and efficient
market hypothesis survive in spite of considerable evidence of their fallacy
(Murphy 2004) . The random walk theory states that the stock market cannot
be predicted. The efficient market hypothesis states that share price reflects
all relevant information and therefore as a corollary one cannot outperform
the overall market (Zweig 1997). Those who believe these suppositions would
conclude that timing the financial markets is pointless, and the only viable
strategy is buying stocks and holding long term (O'Shaughnessy 1997). A true
believer might even argue that it doesn't matter what stock you buy, since all
are priced efficiently.
This buyandhold advice has been repeated often by many offering
financial advice. Yet there are numerous counterexamples to its veracity. If
the markets were truly efficient, stocks prices would move smoothly up and
down in concert with the state of the economy. Bubbles and crashes would
occur infrequently. Intermarket arbitrage would not be possible, nor would it
be possible to exceed buyandhold returns using simple trading systems,
such as the 4% swing system (Fosback 1991, Arnold 1993). If the markets of
the past fifteen years have told us anything, it is that buyandhold is not an
optimal strategy.
Technical Analysis
Classical technical analysis teaches that the best trading systems are
robust and applicable across different instruments and time frames. This is in
part to assure that a particular trading system is not curvefit to a single time
series, and will therefore work with future data. However, there is no reason
that a system can not be trained on a particular time series and interval, as
long as the validity of the system is later verified to work on outofsample
data, data the system has not seen during trading. The challenge, given the
relatively short time series available for most financial instruments, as well as
the changing nature of these instruments over time, is to assure that the
success of a system in trading outofsample data is statistically significant
and not a random occurrence (Arnold 1993, Aronson 2007).
Trading systems which use technical indicators such as moving
averages and oscillators need to define parameters for indicators and state
how indicator(s) are evaluated to produce trading signals. For example, a
simple system might state: Buy when the price rises above a 20 period simple
moving average. A more complex system might use more indicators, similar
indicators with different parameters, and use these indicators in rules to
produce buy and sell signals. The assignment of parameter values, the
weighting of indicators, and how indicators are combined into a trading signal
are often arbitrary and suboptimal. This may lead to a system using more
inputs, and thus having more degrees of freedom, than is necessary. Such a
system may be susceptible to curve fitting and prove more difficult to validate
(Zirilli 1997). All things being the same, a trading system using a smaller
number of inputs is superior to a similarly performing system using more
inputs.
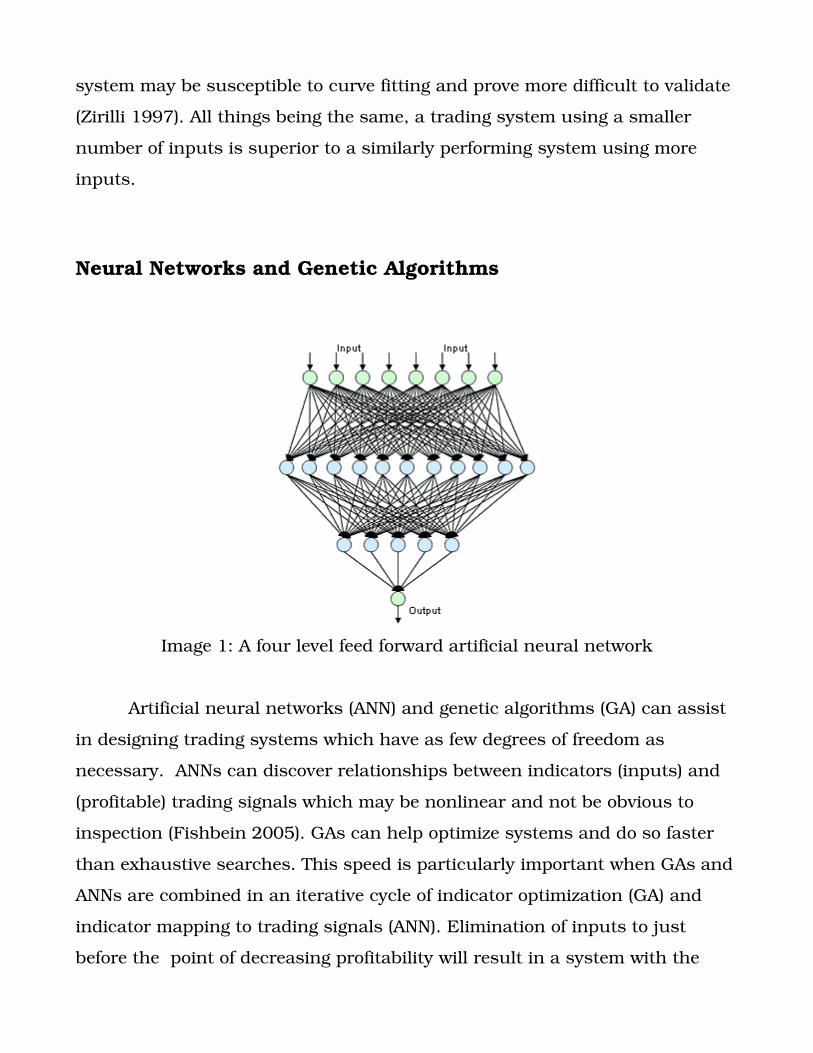
Neural Networks and Genetic Algorithms
Image 1: A four level feed forward artificial neural network
Artificial neural networks (ANN) and genetic algorithms (GA) can assist
in designing trading systems which have as few degrees of freedom as
necessary. ANNs can discover relationships between indicators (inputs) and
(profitable) trading signals which may be nonlinear and not be obvious to
inspection (Fishbein 2005). GAs can help optimize systems and do so faster
than exhaustive searches. This speed is particularly important when GAs and
ANNs are combined in an iterative cycle of indicator optimization (GA) and
indicator mapping to trading signals (ANN). Elimination of inputs to just
before the point of decreasing profitability will result in a system with the
fewest necessary degrees of freedom.
Assume that one or more indicators are chosen, and a hybrid ANN/GA
system produces a trading system which is profitable for the interval over
which the system is trained. The next step is to test the system outofsample,
using data not used during training. The success or failure over a single out
ofsample interval is not sufficient to evaluate a system. It is little more than a
role of the dice. Results may be anomalous and not representative of the
ability of a system over the longterm. A system may be profitable or not over
a single outofsample test and yet say little about the its ultimate
profitability.
Testing Trading Systems
A prudent person should test a trading system before committing to
using the system for live trading. The rigorousness of the testing program can
determine the success of the system in live trading. Contrary to popular
opinion, a record of successful live trading is not in of itself sufficient proof of
the validity of a system. Such success may be a statistical fluke, and not
representative of the future long term performance of a system.
The simplest test of a trading system is its application to a single time
range. The statistical significance of this result may vary depending on the
number of bars tested. There is also the concern that the system may have
been developed with knowledge of the test period, and therefore has been
tailored to the known data. The ability of such a system to perform into the
future, with previously unseen data, may be compromised.
Adaptive systems which are trained on known data introduce another

concern. If the system is trained and then tested on the same data set, it has
not been demonstrated that the system will be effective with unseen, future
data, such as occurs in real life trading. It is necessary to hold out a portion
of the data for testing the system after training. The progressive process of
testing a system on a portion of the held out data, and then incorporating the
held out portion into the training set, is referred to as walkforward testing.
Walkforward testing trains a system over a portion of the available
market data, then tests over a small interval forward in time. The system is
then retrained using the original training interval and the outofsample
segment, then tested outofsample over the next interval of market data. The
process is repeated until the available data is exhausted, and the results over
multiple outofsample tests are calculated, as shown below.
Www.profsoftware.com
In testing trading systems for financial markets, a common limitation is
the lack of sufficient data for testing. The trading year contains approximately

250 trading days, so an endofday system for a stock with a 10 year history
would contain appoximately 2500 data points. This may be an insufficient
number to generate a statistically significant test.
The fact that a system remains profitable over a number of walk
forward intervals doesn't in itself guarantee the system will remain profitable
in the future. Even if enough data is available to reach levels of statistical
significance, there is no certainty that the future will look like the walk
forward intervals. Consider the system mentioned earlier: Buy when the close
> 20 period simple moving average. This system performs well in a smoothly
trending market, and poorly in most other markets. If the walkforward
periods encompass only a smooth uptrend, the system will show a successful
walkforward test and yet fail in a market which does not resemble the walk
forward periods.
Monte Carlo Testing
What is needed is a unlimited stream of market data which would
represent all potential market conditions the system might be asked to trade
under. While actual data is limited, Monte Carlo testing provides a method to
generate synthetic data which closely simulates the data characteristics of the
actual market under test, as detailed by several authors (Chande 1997,
Aronson 2007). To summarize, synthetic data is created by picking an
arbitrary starting value, and then incrementing the open, high, low and close
for each period by a change or percentage change chosen from a bar in the
actual data, chosen randomly for each period. By this method, limitless
synthetic market data which retains characteristics of the original data can be
produced. The system can be trained and tested over a number of synthetic
data series to the desired level of statistical significance.
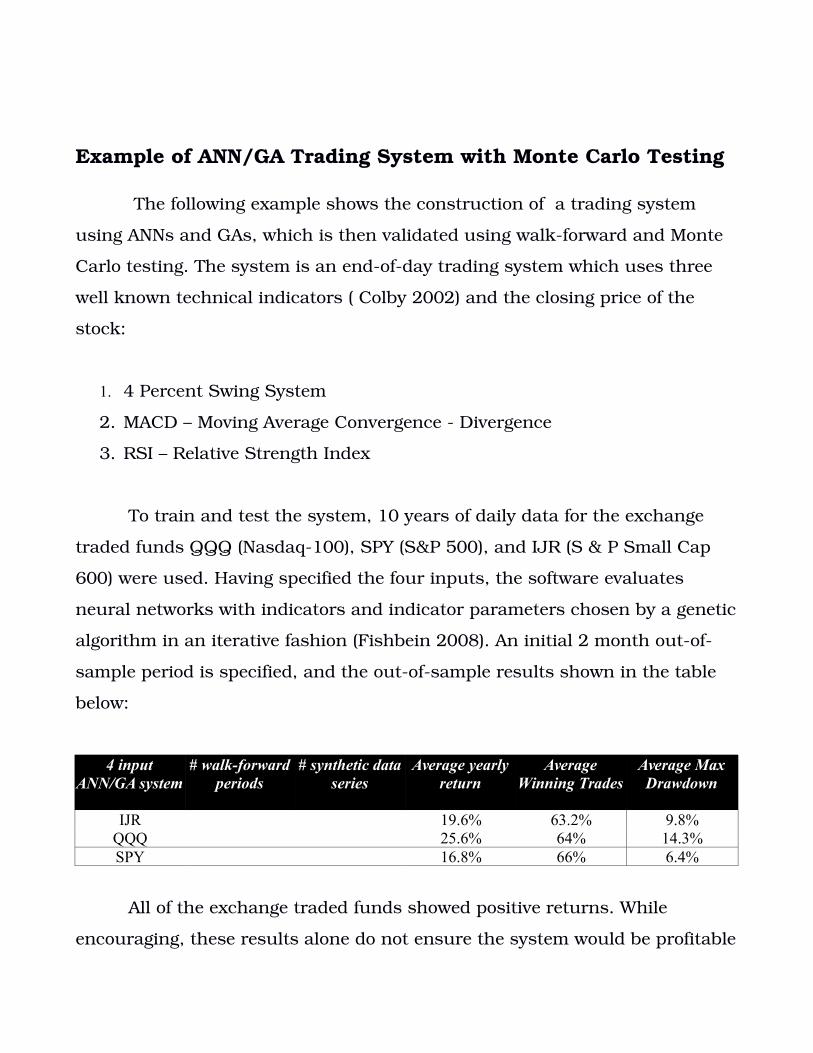
Example of ANN/GA Trading System with Monte Carlo Testing
The following example shows the construction of a trading system
using ANNs and GAs, which is then validated using walkforward and Monte
Carlo testing. The system is an endofday trading system which uses three
well known technical indicators ( Colby 2002) and the closing price of the
stock:
1. 4 Percent Swing System
2. MACD – Moving Average Convergence Divergence
3. RSI – Relative Strength Index
To train and test the system, 10 years of daily data for the exchange
traded funds QQQ (Nasdaq100), SPY (S&P 500), and IJR (S & P Small Cap
600) were used. Having specified the four inputs, the software evaluates
neural networks with indicators and indicator parameters chosen by a genetic
algorithm in an iterative fashion (Fishbein 2008). An initial 2 month outof
sample period is specified, and the outofsample results shown in the table
below:
4 inputANN/GA system
# walk-forwardperiods
# synthetic dataseries
Average yearlyreturn
AverageWinning Trades
Average MaxDrawdown
IJR 19.6% 63.2% 9.8%QQQ 25.6% 64% 14.3%SPY 16.8% 66% 6.4%
All of the exchange traded funds showed positive returns. While
encouraging, these results alone do not ensure the system would be profitable
in future markets. As previously discussed, the single outofsample period
might have characteristics particularly suitable to the design of the system. It
would be useful to test the system against a number of outofsample
scenarios.
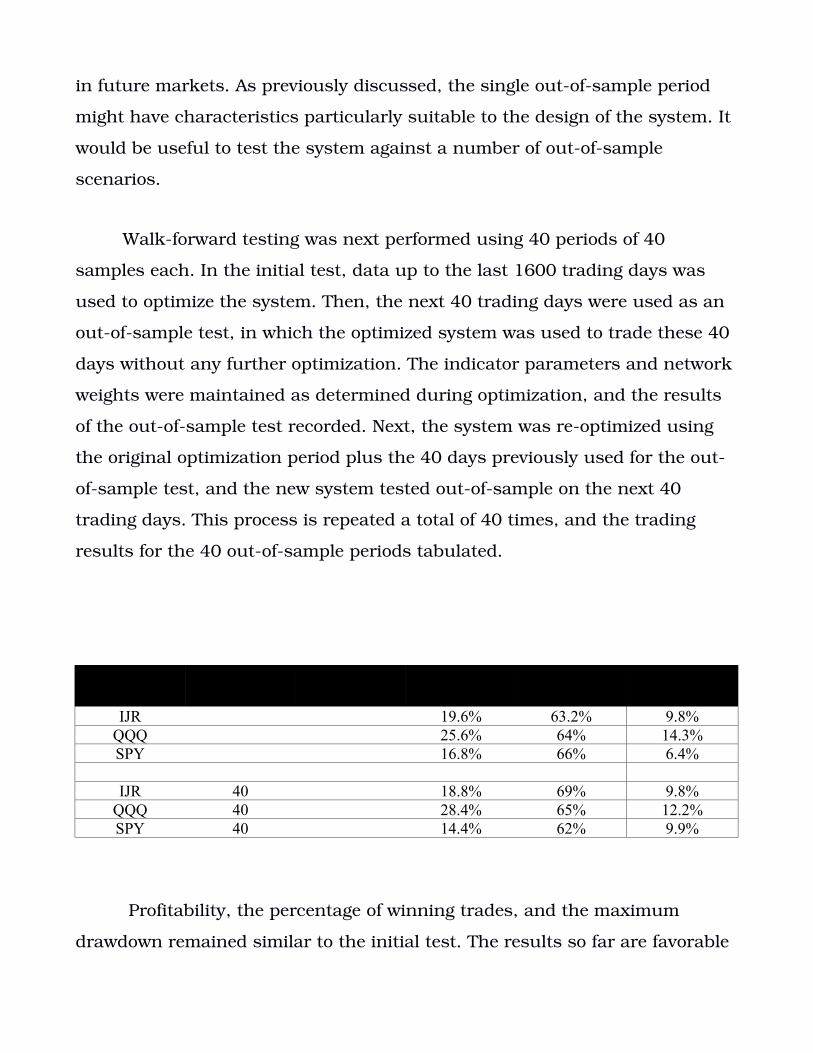
Walkforward testing was next performed using 40 periods of 40
samples each. In the initial test, data up to the last 1600 trading days was
used to optimize the system. Then, the next 40 trading days were used as an
outofsample test, in which the optimized system was used to trade these 40
days without any further optimization. The indicator parameters and network
weights were maintained as determined during optimization, and the results
of the outofsample test recorded. Next, the system was reoptimized using
the original optimization period plus the 40 days previously used for the out
ofsample test, and the new system tested outofsample on the next 40
trading days. This process is repeated a total of 40 times, and the trading
results for the 40 outofsample periods tabulated.
IJR 19.6% 63.2% 9.8%QQQ 25.6% 64% 14.3%SPY 16.8% 66% 6.4%
IJR 40 18.8% 69% 9.8%QQQ 40 28.4% 65% 12.2%SPY 40 14.4% 62% 9.9%
Profitability, the percentage of winning trades, and the maximum
drawdown remained similar to the initial test. The results so far are favorable
and this system has potential to be a useful tool.
The number of walkforward tests that can be performed is limited by
the length of the trading history for the instrument under test. Sufficient data
must be available for the initial optimization. It is also possible that even a
lengthy walkforward period may not adequately represent market conditions
the system may see in the future. Monte Carlo testing offers a method to
generate endless data which closely matches the characteristics of the original
data series. The intricacies and applications on Monte Carlo testing are
addressed elsewhere (Aronson 2007).
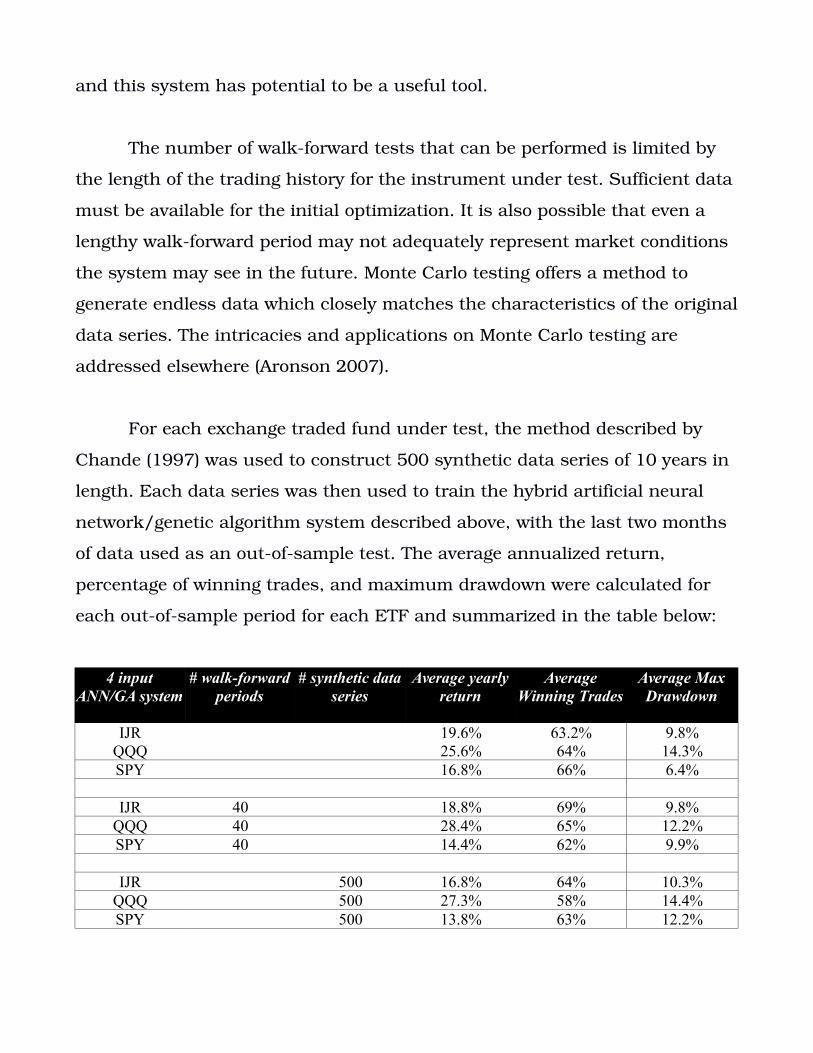
For each exchange traded fund under test, the method described by
Chande (1997) was used to construct 500 synthetic data series of 10 years in
length. Each data series was then used to train the hybrid artificial neural
network/genetic algorithm system described above, with the last two months
of data used as an outofsample test. The average annualized return,
percentage of winning trades, and maximum drawdown were calculated for
each outofsample period for each ETF and summarized in the table below:
4 inputANN/GA system
# walk-forwardperiods
# synthetic dataseries
Average yearlyreturn
AverageWinning Trades
Average MaxDrawdown
IJR 19.6% 63.2% 9.8%QQQ 25.6% 64% 14.3%SPY 16.8% 66% 6.4%
IJR 40 18.8% 69% 9.8%QQQ 40 28.4% 65% 12.2%SPY 40 14.4% 62% 9.9%
IJR 500 16.8% 64% 10.3%QQQ 500 27.3% 58% 14.4%SPY 500 13.8% 63% 12.2%
Results for each fund remained positive and did not show significant
variation from those obtained with walkforward testing. Average maximum
drawdown was higher in Monte Carlo testing than in walkforward testing.
Results from Monte Carlo testing may lag behind those from live data as
synthetic scenarios encompass a range of challenging conditions not seen
with the live period. These results from Monte Carlo testing give added
confidence that the system produces reproducible results and its results do
not represent a statistical anomaly (Masters 2009).
Summary
Buyandhold investing strategies for the stock market can be improved
upon. Systematic mechanical trading provides one way to time the market,
and lends itself to testing and validation. The combination of ANNs and GAs
offers a unique way to develop powerful trading systems. A hybrid ANN/GA
system using the 4% Swing System, MACD, RSI and closing price was
described. The system generated positive returns in the initial outofsample
test period. A walkforward test extending back 1600 trading days was
performed, again showing positive returns for each instrument. Finally, Monte
Carlo testing was performed using 500 synthetic data series for each
instrument, showing positive returns. Timing the stock market using a
mechanical trading system based on ANNs and GAs provides a statistically
significant increase in trading returns over a buy and hold strategy. Similar
results were demonstrated using a system with different inputs in earlier
papers (Fishbein 2009, Fishbein 2014).
Copyright 2009 and 2015 Donn S. Fishbein and Nquant.com
BIBLIOGRAPHY
Arnold, Curtis M. Timing The Market. Weiss Research, Inc., 1993
Aronson, DR. Evidence Based Technical Analysis. John Wiley and Sons, 2007.
Chande, TS. Beyond Technical Analysis: How to Develop and Implement a Winning Trading System. John Wiley and Sons, 1997.
Colby RW. The Encyclopedia of Technical Indicators, 2nd Ed. McGrawHill, 2002.
Conners, L. and Alvarez, C. Short Term Trading Strategies That Work: A Quantified Guide to Trading Stocks and ETFs. Trading Markets Publishing Group, 2009.
Fishbein DS. How to time the stock market Using Artificial Neural Networks and Genetic Algorithms. Trenton Computer Festival Proceedings, 2004.
Fishbein DS. Identifying Short Term Market Turns Using Neural Networks and Genetic Algorithms, Trenton Computer Festival Proceedings, 2008.
Fishbein DS. Why You Simply Must Time the Market (Using ANN/GA). Trenton Computer Festival Proceedings, 2009.
Fishbein DS. Stock Market Timing Using Artificial Neural Networks and Genetic Algorithms – Verification of Results By Monte Carlo Testing. Trenton Computer Festival Proceedings, 2014.
Fosback, NG. Stock Market Logic. Dearborn Financial Publishing, 1991.
Hanlon S. Why The Average Investor's Investment Is So Low. Forbes.com, 4242014
Jaffe C. Why the average mutual fund gets better returns than its average investor. Marketwatch.comw 352014.
“Madoff Investment Scandal”, Wikipedia, The Free Encyclopedia. 24 Feb 2015, 15:12 UTC. <https://en.wikipedia.org/wiki/Madoff_investment_scandal>
Masters, T. Monte Carlo Evaluation of Trading Systems. 24 Mar 2009, 16:13 UTC. <http://www.evidencebasedta.com/MonteDoc12.15.06.pdf>
Maye M. Average Investor 20 Year Return Astoundingly Awful. TheStreet.com, 7182012.
Murphy John. Intermarket Analysis. Wiley Trading, 2004.
"Monte Carlo method." Wikipedia, The Free Encyclopedia. 18 Mar 2009, 15:14 UTC. 25 Mar 2009 <http://en.wikipedia.org/w/index.phptitle=Monte_Carlo_method&oldid=278118547>
O'Shaughnessy, JP. What Works on Wall Street. McGrawHill, 1997.
Ro S. Low Returns Mean We Are In The Early Phase Of A Stock Market Upcycle. BusinessInsider.com, 11262013.
Siegel, J. Stocks for the Long Run 5/E: The Definitive Guide to Financial Market Returns & LongTerm Investment Strategies. McGrawHill, 2013.
Wikipedia: http://en.wikipedia.org/wiki/Ricky_Jay
Zirilli, Joseph S. Financial Prediction Using Neural Networks. International Thomson Computer Press, 1997.
Zweig, M. Winning of Wall Street. 1986, 1997(revised), Warner Books.