(Stock code: 1112 HK)Gross Margin Analysis Revenue Mix Gross Profit Margin by Products 1H 2015 1H...
40
1 (Stock code: 1112 HK)
Transcript of (Stock code: 1112 HK)Gross Margin Analysis Revenue Mix Gross Profit Margin by Products 1H 2015 1H...
1
(Stock code: 1112 HK)
Disclaimer
These materials have been prepared solely for the use at the presentation by Biostime International Holdings Limited (“the Company”) and
have not been independently verified. No representation or warranty, expressed or implied, is made and no reliance should be placed on
the accuracy, fairness, correctness or completeness of the information presented or contained in these materials. The Company or any of
its affiliates, advisers or representatives accepts no liability whatsoever for any loss howsoever arising from any information presented or
contained in these materials. The information presented or contained in these materials is subject to change without notice and its
accuracy is not guaranteed.
These materials contain certain forward-looking statements with respect to the Company, including its beliefs and expectations about the
future as at the date of this presentation. These forward-looking statements are based on a number of assumptions regarding the
Company's operations and factors beyond the Company's control, including but not limited to, the political and economic environment in
which the Company and its subsidiaries will operate in the future. Our actual results of operations, financial condition or business
prospects may differ materially from those expressed or implied in these forward-looking statements for a variety of reasons and as such,
no reliance should be placed on these forward-looking statements. The Company and its affiliates, advisors and representatives undertake
no obligation to update these forward-looking statements for events or circumstances that occur subsequent to such dates. This
presentation does not constitute or form part of any offer for sale or invitation, or solicitation of an offer to subscribe for or purchase any
securities in the United States, Hong Kong or anywhere else. No part of this presentation shall form the basis of or be relied upon in
connection with any contract or commitment whatsoever. The information of the presentation should not be relied upon as representation
of the Company.
These materials are highly confidential, are being given solely for your information and for your use and may not be copied, reproduced or
redistributed to any other person (whether within or outside your organization/firm) in any manner. You agree to treat the contents of this
presentation and these materials as strictly confidential.
2 2

3
Presentation Team
Mr. Luo Fei Chairman & CEO
Mr. Frank Cao Chief Financial Officer
Ms. Laetitia GarnierInternational Investment and
Cooperation Director
Mr. Jason Xu Investor Relations
Presenter Title

RESULTS
HIGHLIGHTS
4
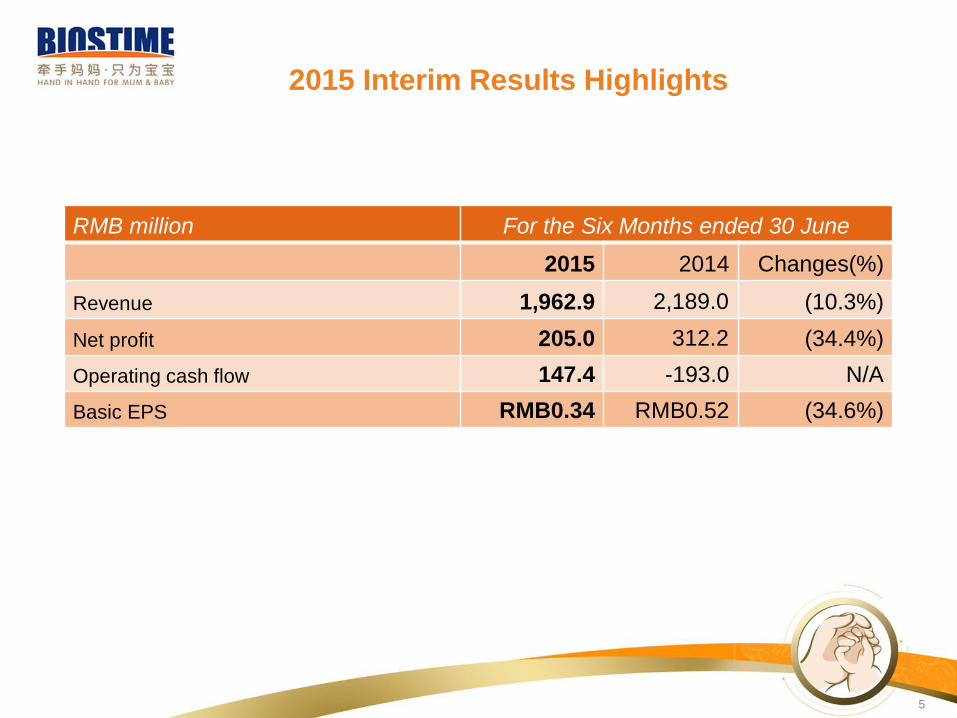
RMB million For the Six Months ended 30 June
2015 2014 Changes(%)
Revenue 1,962.9 2,189.0 (10.3%)
Net profit 205.0 312.2 (34.4%)
Operating cash flow 147.4 -193.0 N/A
Basic EPS RMB0.34 RMB0.52 (34.6%)
2015 Interim Results Highlights
5 5
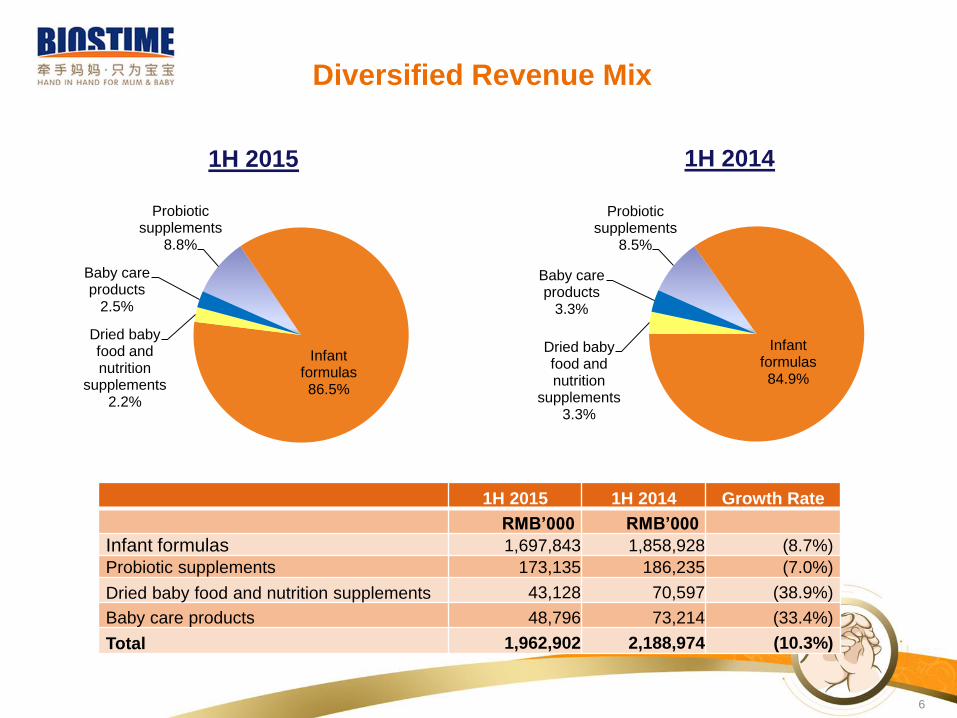
1H 2015 1H 2014 Growth Rate
RMB’000 RMB’000
Infant formulas 1,697,843 1,858,928 (8.7%)
Probiotic supplements 173,135 186,235 (7.0%)
Dried baby food and nutrition supplements 43,128 70,597 (38.9%)
Baby care products 48,796 73,214 (33.4%)
Total 1,962,902 2,188,974 (10.3%)
Probiotic supplements
8.5%
Infant formulas84.9%
Dried baby food and nutrition
supplements3.3%
Baby care products
3.3%
Diversified Revenue Mix
Probiotic supplements
8.8%
Infant formulas86.5%
Dried baby food and nutrition
supplements2.2%
Baby care products
2.5%
1H 2015 1H 2014
6 6
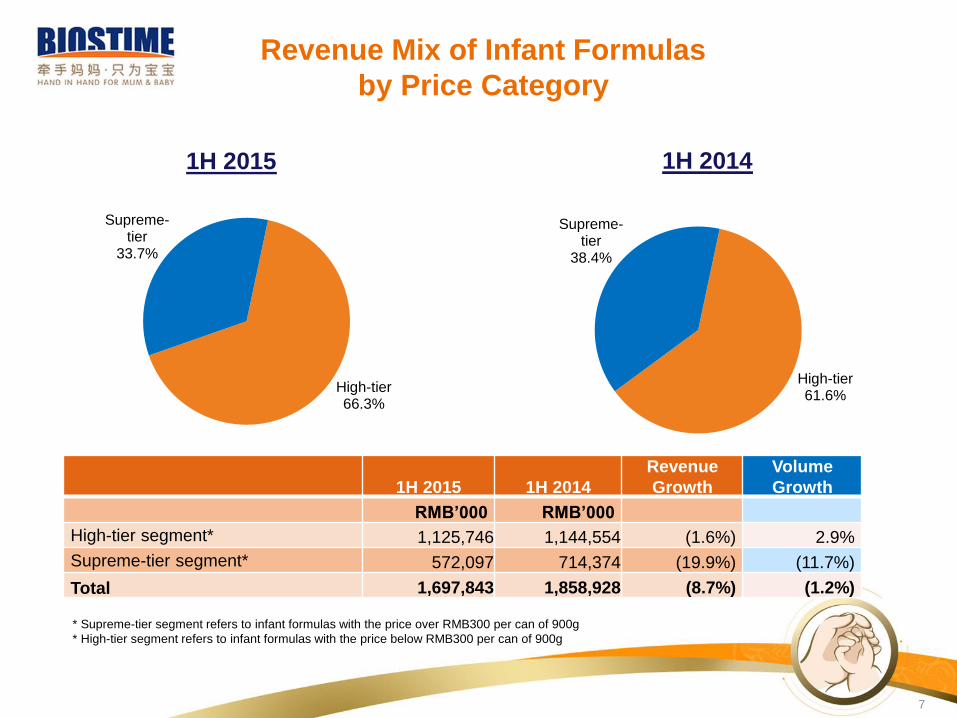
1H 2015 1H 2014
Revenue
Growth
Volume
Growth
RMB’000 RMB’000
High-tier segment* 1,125,746 1,144,554 (1.6%) 2.9%
Supreme-tier segment* 572,097 714,374 (19.9%) (11.7%)
Total 1,697,843 1,858,928 (8.7%) (1.2%)
* Supreme-tier segment refers to infant formulas with the price over RMB300 per can of 900g
* High-tier segment refers to infant formulas with the price below RMB300 per can of 900g
Revenue Mix of Infant Formulas
by Price Category
High-tier61.6%
Supreme-tier
38.4%
High-tier66.3%
Supreme-tier
33.7%
1H 2015 1H 2014
7 7
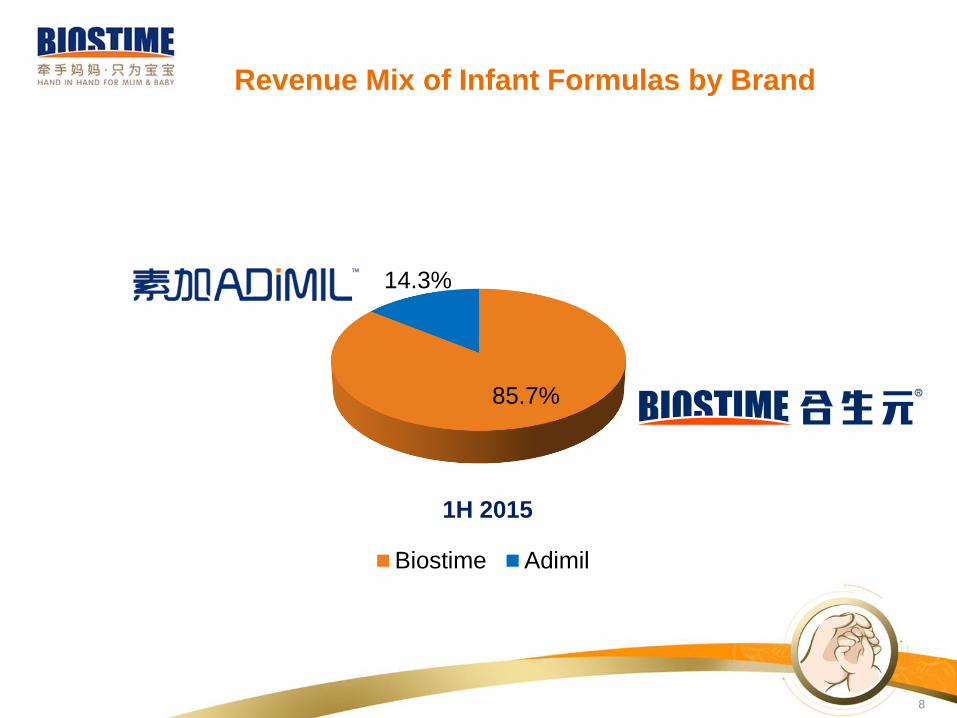
85.7%
14.3%
Biostime Adimil
Revenue Mix of Infant Formulas by Brand
1H 2015
8 8

BUSINESS
REVIEW
9
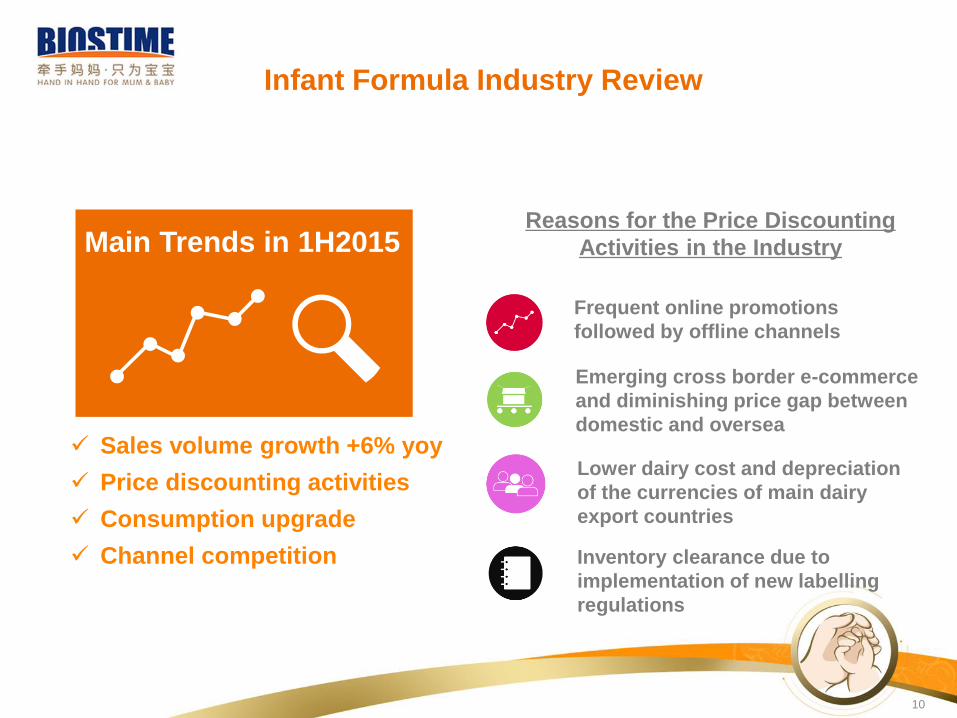
Infant Formula Industry Review
Sales volume growth +6% yoy
Price discounting activities
Consumption upgrade
Channel competition
Frequent online promotions
followed by offline channels
Emerging cross border e-commerce
and diminishing price gap between
domestic and oversea
Lower dairy cost and depreciation
of the currencies of main dairy
export countries
Inventory clearance due to
implementation of new labelling
regulations
Reasons for the Price Discounting
Activities in the IndustryMain Trends in 1H2015
10 10
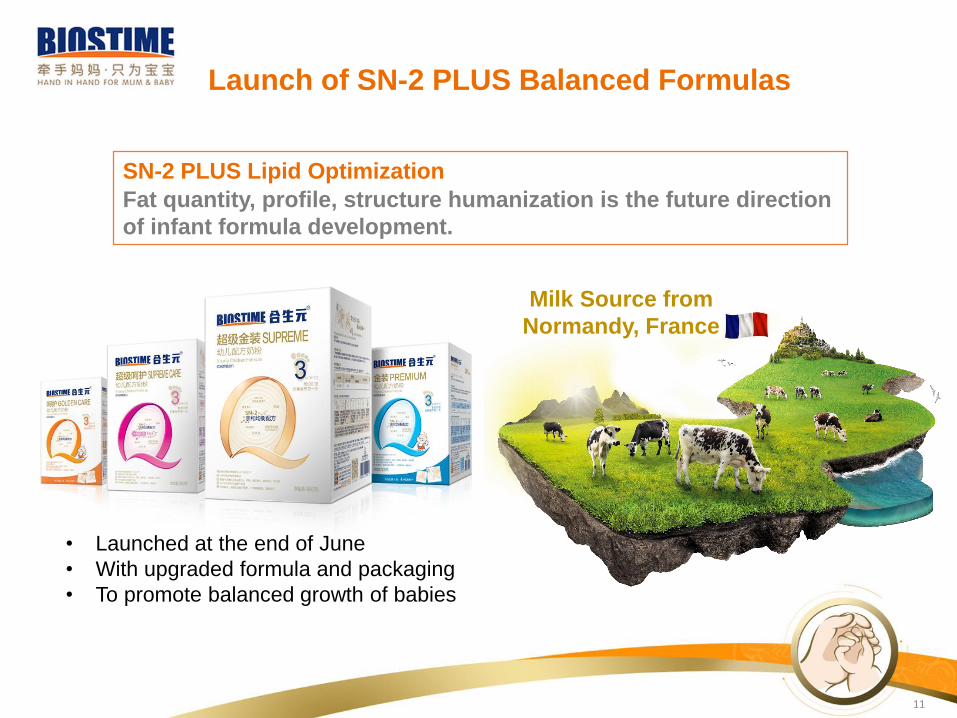
Launch of SN-2 PLUS Balanced Formulas
SN-2 PLUS Lipid Optimization
Fat quantity, profile, structure humanization is the future direction
of infant formula development.
• Launched at the end of June
• With upgraded formula and packaging
• To promote balanced growth of babies
Milk Source from
Normandy, France
11
12
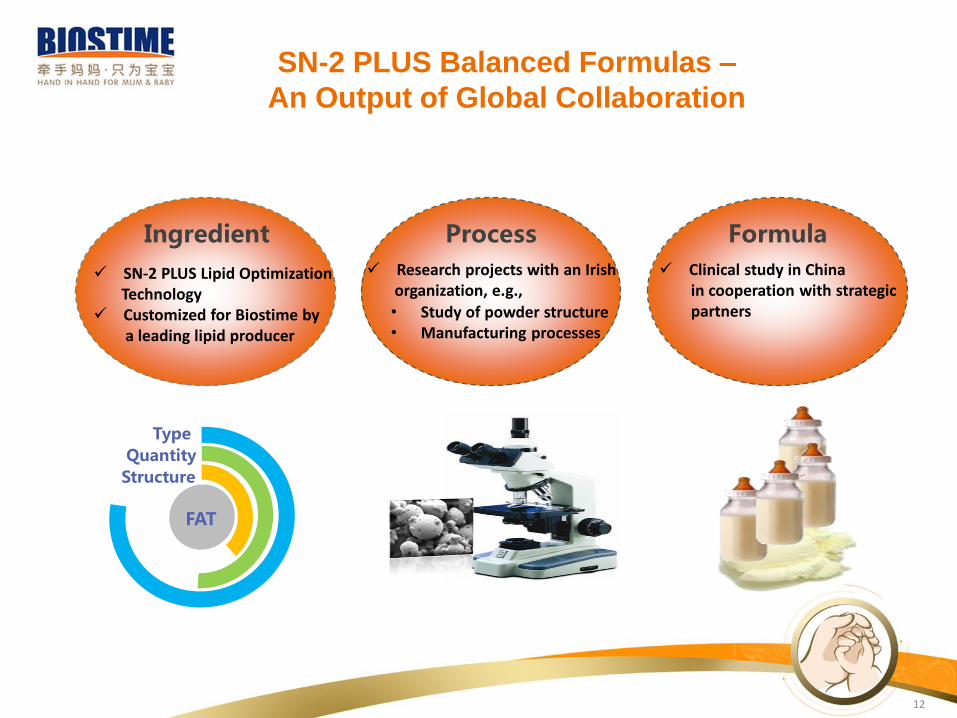
Ingredient
SN-2 PLUS Lipid Optimization Technology
Customized for Biostime bya leading lipid producer
Process
Research projects with an Irish organization, e.g.,
Formula
Clinical study in Chinain cooperation with strategicpartners• Study of powder structure
• Manufacturing processes
SN-2 PLUS Balanced Formulas –
An Output of Global Collaboration
13
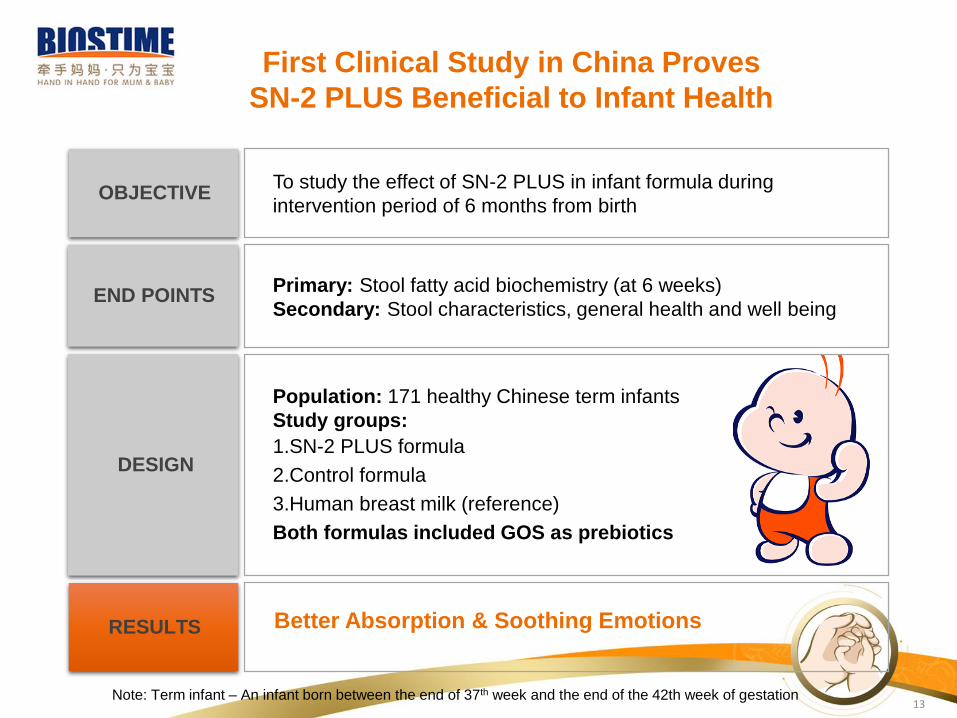
To study the effect of SN-2 PLUS in infant formula during
intervention period of 6 months from birth
Primary: Stool fatty acid biochemistry (at 6 weeks)
Secondary: Stool characteristics, general health and well being
Population: 171 healthy Chinese term infants
Study groups:
1.SN-2 PLUS formula
2.Control formula
3.Human breast milk (reference)
Both formulas included GOS as prebiotics
OBJECTIVE
END POINTS
DESIGN
Better Absorption & Soothing Emotions
First Clinical Study in China Proves
SN-2 PLUS Beneficial to Infant Health
RESULTS
Note: Term infant – An infant born between the end of 37th week and the end of the 42th week of gestation
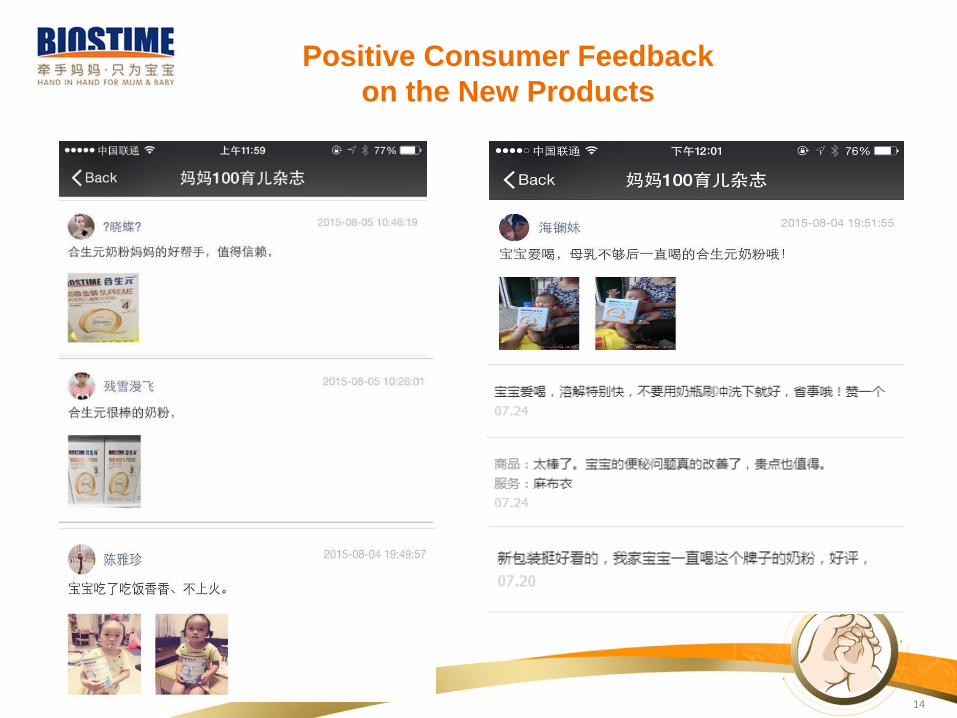
Positive Consumer Feedback
on the New Products
14

Enhancement of
Biostime Brand Recognition
Milk Source from Normandy, France
Resource + Technology
15

• Celebrity ambassador
• Key marketing concept: vitality
Enhancement of
Adimil Brand Recognition
16

Member Data Base
CouponsManager
Develop Customer
Cultivate Loyalty
My Bonus
My Sales Target
Member Asset
Coupons for New Customers
Parenting Advice
Status of Coupons
Sharing
My Budget
• Develop new customers with precision
• Nurture loyal members• Improve efficiency of
promotions
ONE TO ONEPrecision Marketing SystemMobile Internet Based
17
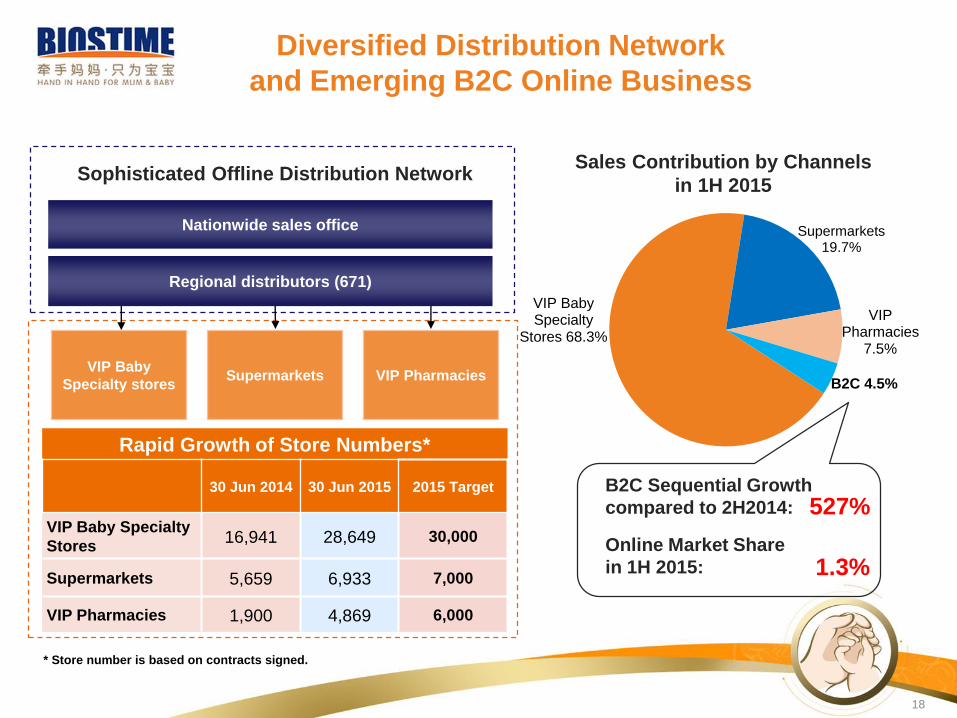
SupermarketsVIP Baby
Specialty stores
Nationwide sales office
Regional distributors (671)
VIP Pharmacies
* Store number is based on contracts signed.
Rapid Growth of Store Numbers*
30 Jun 2014 30 Jun 2015 2015 Target
VIP Baby Specialty
Stores16,941 28,649 30,000
Supermarkets 5,659 6,933 7,000
VIP Pharmacies 1,900 4,869 6,000
Diversified Distribution Network
and Emerging B2C Online Business
Sophisticated Offline Distribution Network
VIP Baby Specialty
Stores 68.3%
Supermarkets 19.7%
VIP Pharmacies
7.5%
B2C 4.5%
Sales Contribution by Channels
in 1H 2015
B2C Sequential Growth
compared to 2H2014: 527%
Online Market Share
in 1H 2015: 1.3%
18 18

2.9 Million
20
Mama100 APP
Registered Users
and WeChat Followers
as at 30 Jun 2015
High Quality Third-Party
Brands Introduced into the
Platform since April
Continuous Development of
Mama100 E-commerce
19 19

Enhancement of
R&D and Quality Management
• Commencement of the new R&D and
quality control center in Guangzhou
• Official launch of the microbiological
platform built in cooperation with
Merieux NutriSciences in the center
• Mayors of Guangzhou and Lyon
participated in the event
20
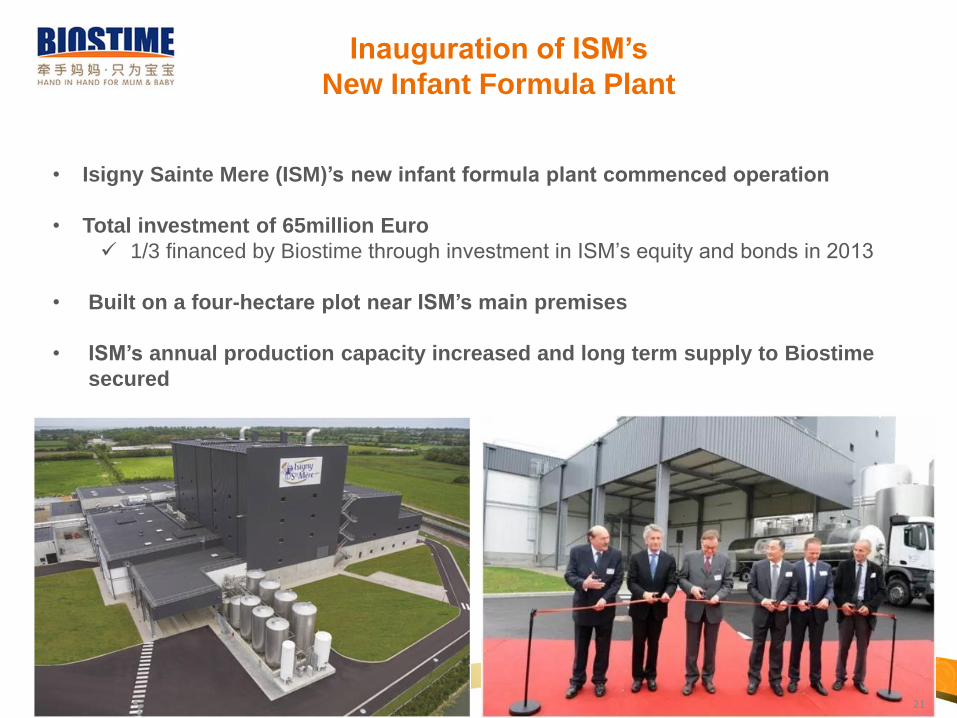
Inauguration of ISM’s
New Infant Formula Plant
• Isigny Sainte Mere (ISM)’s new infant formula plant commenced operation
• Total investment of 65million Euro
1/3 financed by Biostime through investment in ISM’s equity and bonds in 2013
• Built on a four-hectare plot near ISM’s main premises
• ISM’s annual production capacity increased and long term supply to Biostime
secured
21

PROSPECTS
22
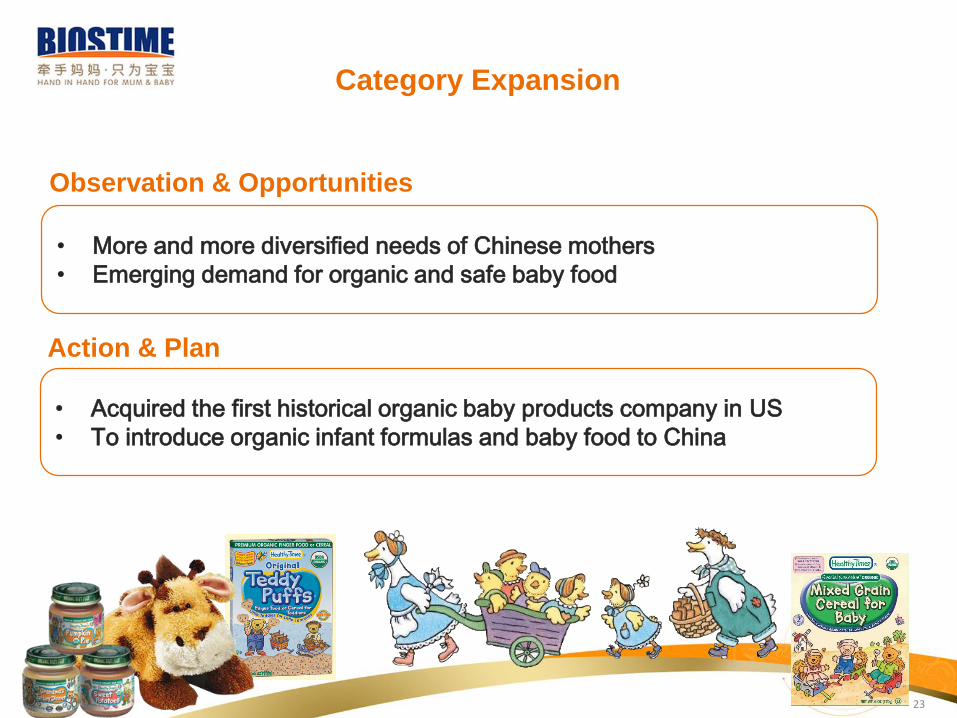
Category Expansion
Observation & Opportunities
• Acquired the first historical organic baby products company in US
• To introduce organic infant formulas and baby food to China
Action & Plan
• More and more diversified needs of Chinese mothers
• Emerging demand for organic and safe baby food
23
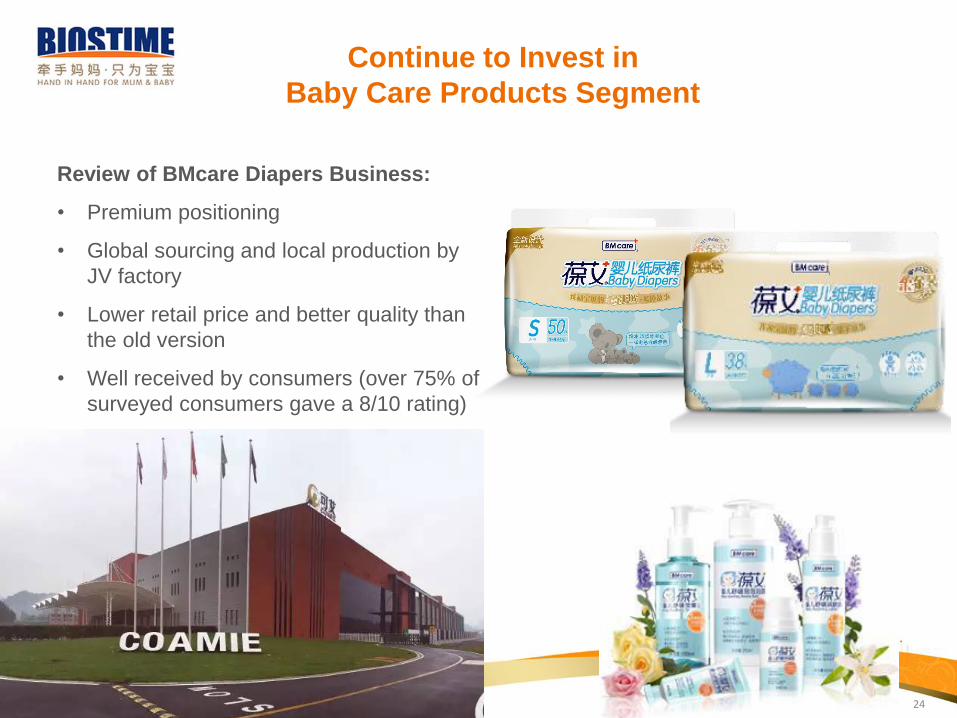
Continue to Invest in
Baby Care Products Segment
Review of BMcare Diapers Business:
• Premium positioning
• Global sourcing and local production by
JV factory
• Lower retail price and better quality than
the old version
• Well received by consumers (over 75% of
surveyed consumers gave a 8/10 rating)
24
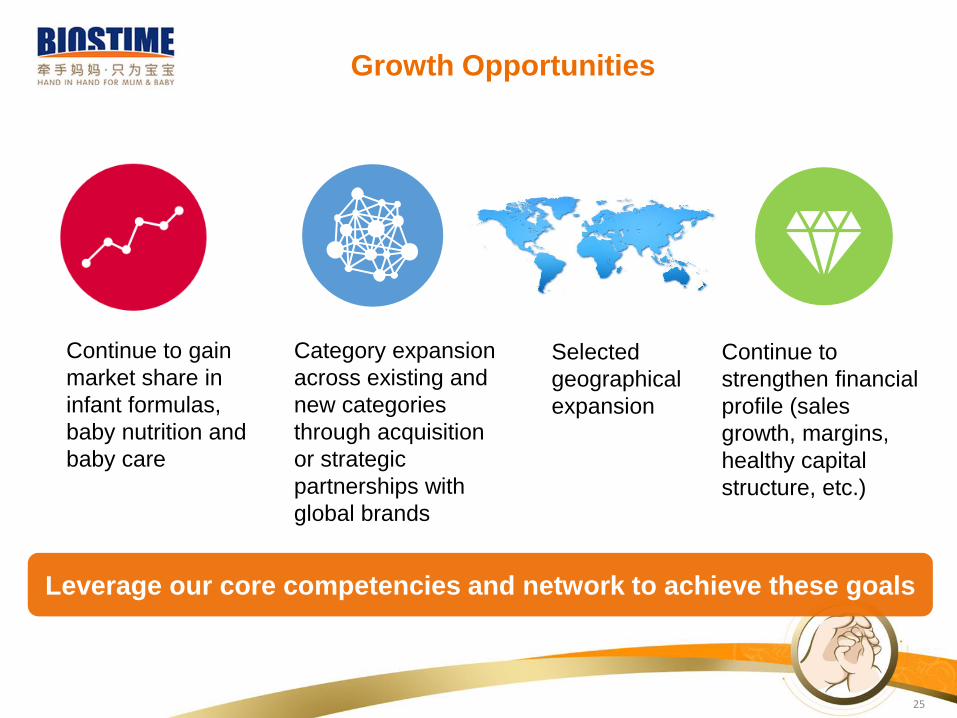
Growth Opportunities
Continue to gain
market share in
infant formulas,
baby nutrition and
baby care
Category expansion
across existing and
new categories
through acquisition
or strategic
partnerships with
global brands
Selected
geographical
expansion
Continue to
strengthen financial
profile (sales
growth, margins,
healthy capital
structure, etc.)
Leverage our core competencies and network to achieve these goals
25
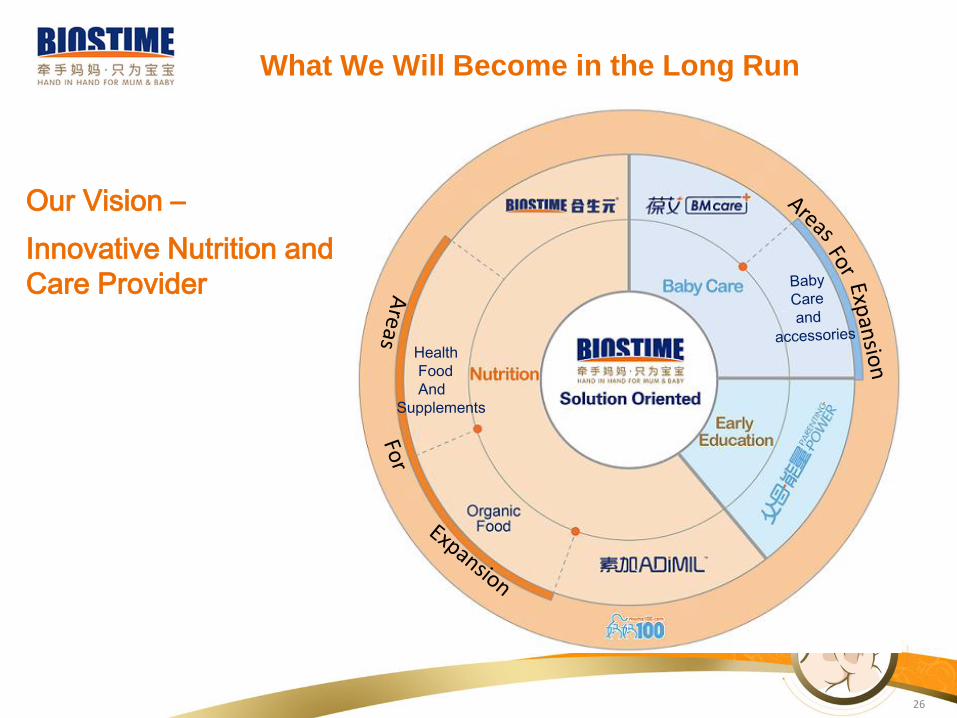
What We Will Become in the Long Run
Our Vision –
Innovative Nutrition and
Care Provider
Health
Food
And
Supplements
26
FINANCIAL
INFORMATION AND
OPERATING DATA
27
28
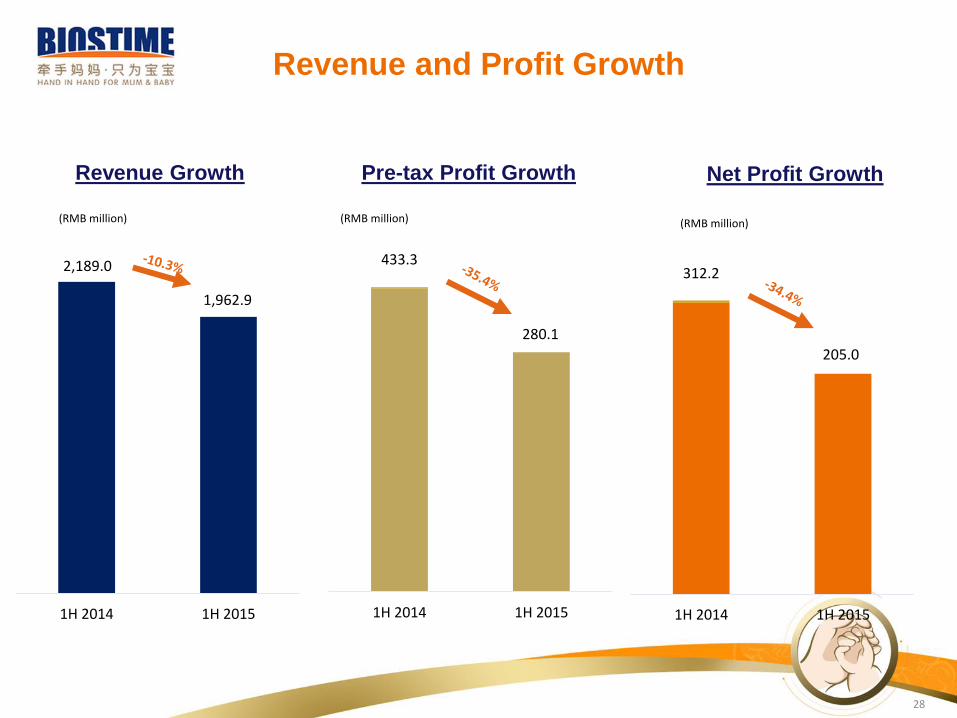
312.2
205.0
1H 2014 1H 2015
433.3
280.1
1H 2014 1H 2015
2,189.0
1,962.9
1H 2014 1H 2015
Revenue and Profit Growth
(RMB million) (RMB million) (RMB million)
Revenue Growth Pre-tax Profit Growth Net Profit Growth
29
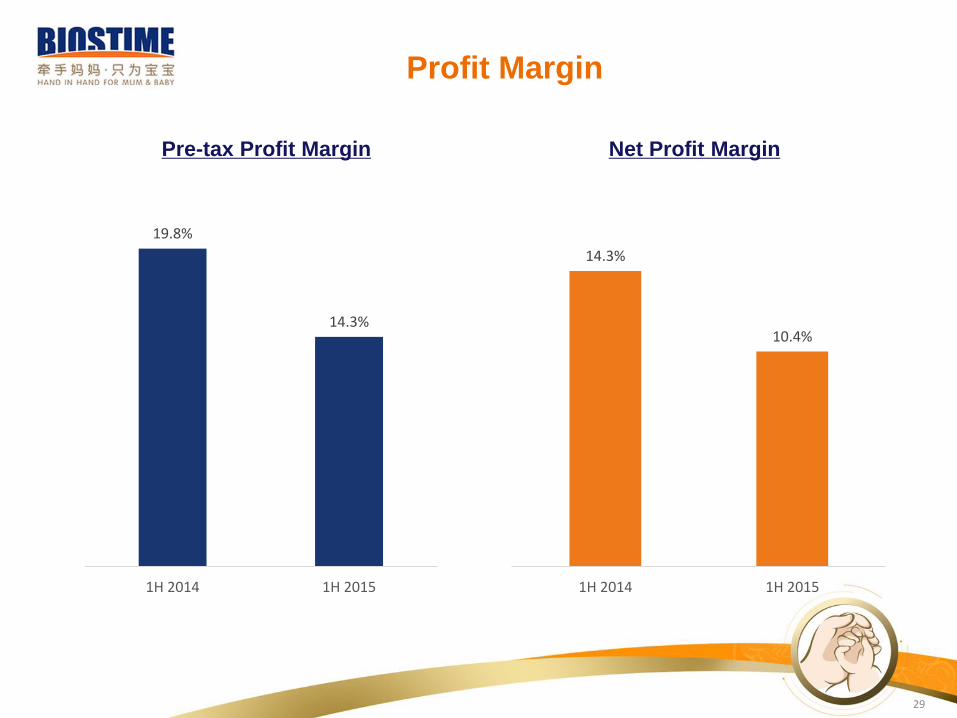
Profit Margin
Pre-tax Profit Margin Net Profit Margin
14.3%
10.4%
1H 2014 1H 2015
19.8%
14.3%
1H 2014 1H 2015
30
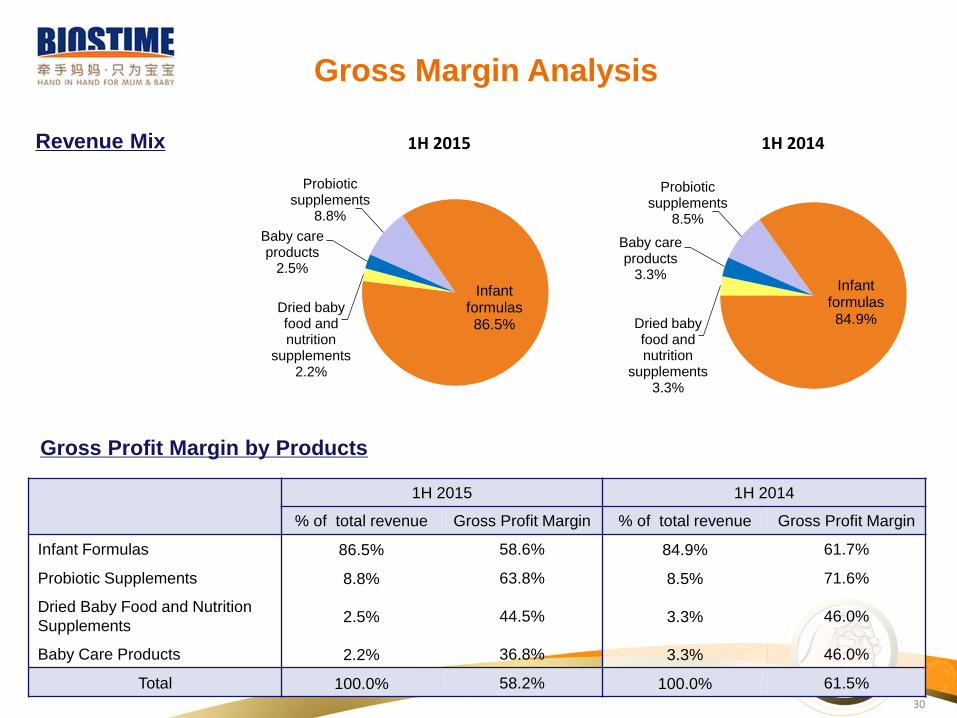
Gross Margin Analysis
Revenue Mix
Gross Profit Margin by Products
1H 2015 1H 2014
% of total revenue Gross Profit Margin % of total revenue Gross Profit Margin
Infant Formulas 86.5% 58.6% 84.9% 61.7%
Probiotic Supplements 8.8% 63.8% 8.5% 71.6%
Dried Baby Food and Nutrition
Supplements2.5% 44.5% 3.3% 46.0%
Baby Care Products 2.2% 36.8% 3.3% 46.0%
Total 100.0% 58.2% 100.0% 61.5%
1H 2015 1H 2014
Probiotic supplements
8.8%
Infant formulas86.5%
Dried baby food and nutrition
supplements2.2%
Baby care products
2.5%
Probiotic supplements
8.5%
Infant formulas84.9%Dried baby
food and nutrition
supplements3.3%
Baby care products
3.3%
31
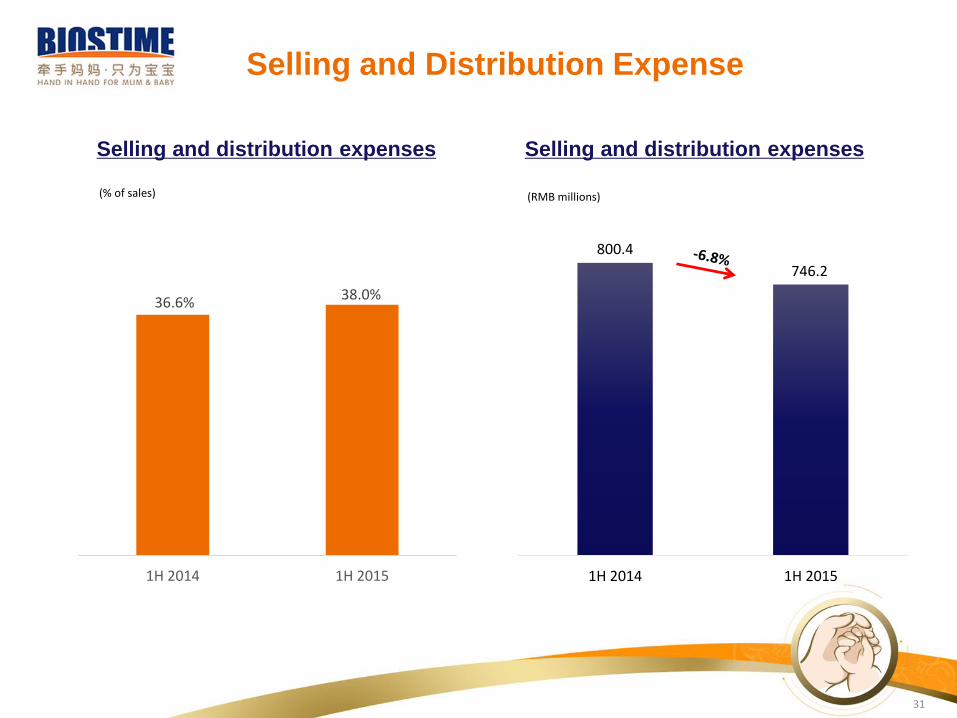
Selling and Distribution Expense
(% of sales) (RMB millions)
800.4
746.2
1H 2014 1H 2015
36.6%38.0%
1H 2014 1H 2015
Selling and distribution expenses Selling and distribution expenses
32
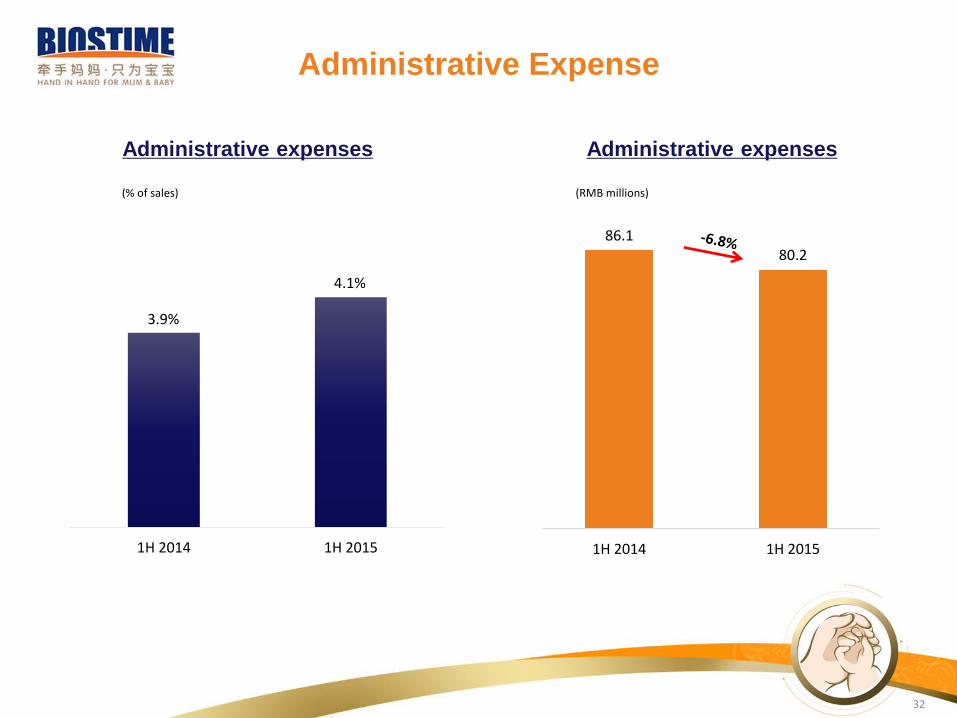
86.180.2
1H 2014 1H 2015
Administrative Expense
(% of sales)
3.9%
4.1%
1H 2014 1H 2015
(RMB millions)
Administrative expenses Administrative expenses
33
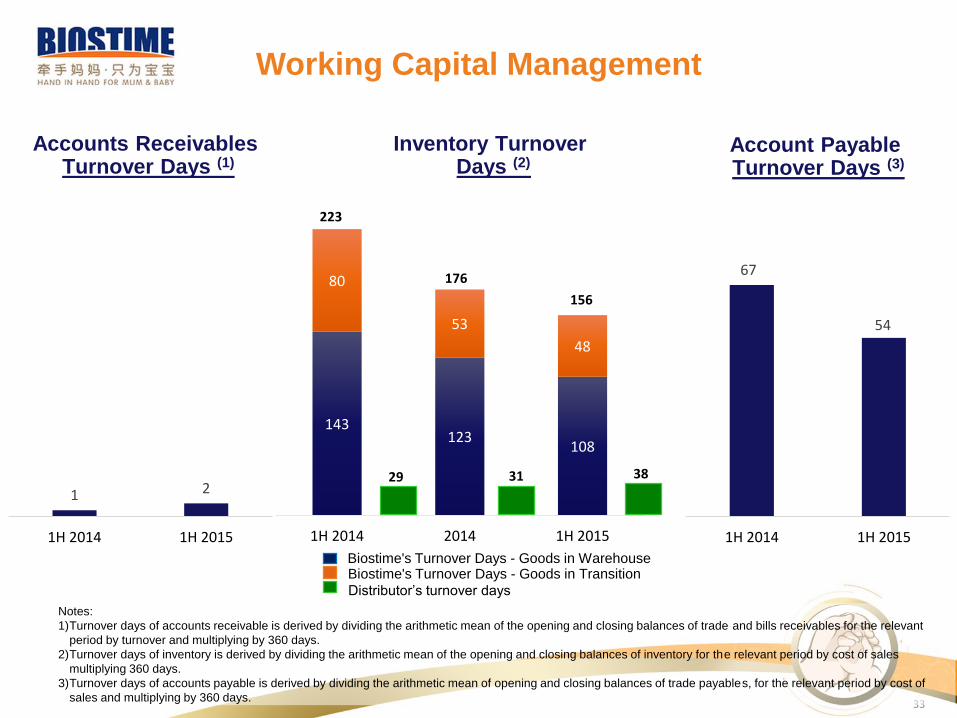
143123
108
80
53
48
1H 2014 2014 1H 2015
156
223
176
29 31 38
Working Capital Management
1 2
1H 2014 1H 2015
67
54
1H 2014 1H 2015
Accounts Receivables Turnover Days (1)
Inventory Turnover Days (2)
Account Payable Turnover Days (3)
Distributor’s turnover days
Biostime's Turnover Days - Goods in TransitionBiostime's Turnover Days - Goods in Warehouse
Notes:
1)Turnover days of accounts receivable is derived by dividing the arithmetic mean of the opening and closing balances of trade and bills receivables for the relevant
period by turnover and multiplying by 360 days.
2)Turnover days of inventory is derived by dividing the arithmetic mean of the opening and closing balances of inventory for the relevant period by cost of sales
multiplying 360 days.
3)Turnover days of accounts payable is derived by dividing the arithmetic mean of opening and closing balances of trade payables, for the relevant period by cost of
sales and multiplying by 360 days.
34
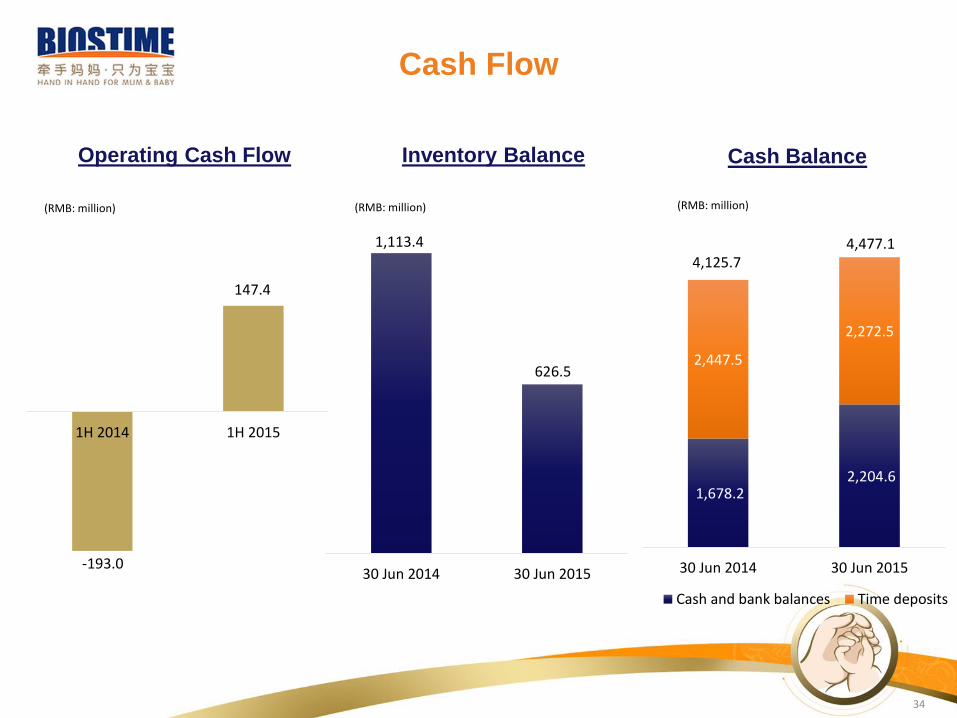
Cash Flow
(RMB: million)(RMB: million)
1,678.2 2,204.6
2,447.5
2,272.5
30 Jun 2014 30 Jun 2015
Cash and bank balances Time deposits
4,125.74,477.1
(RMB: million)
-193.0
147.4
1H 2014 1H 2015
Operating Cash Flow Inventory Balance Cash Balance
1,113.4
626.5
30 Jun 2014 30 Jun 2015

35
6,432.7
2,539.8
6,614.0
2,958.1
Total assets Net assets
30 Jun 2014 30 Jun 2015
Notes: (i) ROA is calculated by dividing net profit for the period by total asset amounts as at the end of the period; ROE is calculated by dividing net profit for the period by total equity amounts as at the end of the period.
9.7%
24.6%
6.2%
13.9%
Return on assets Return on equity
1H 2014 1H 2015
Consolidated Capital Structure
Asset Growth ROA and ROE (1)
(RMB: million)
36
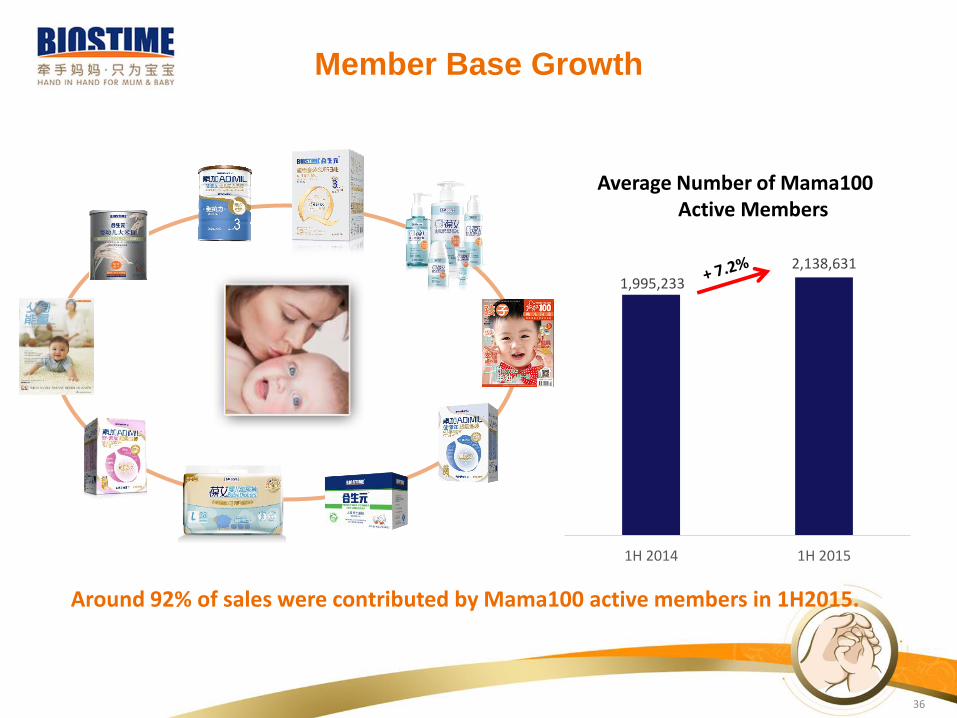
1,995,2332,138,631
1H 2014 1H 2015
Member Base Growth
Average Number of Mama100Active Members
Around 92% of sales were contributed by Mama100 active members in 1H2015.
37
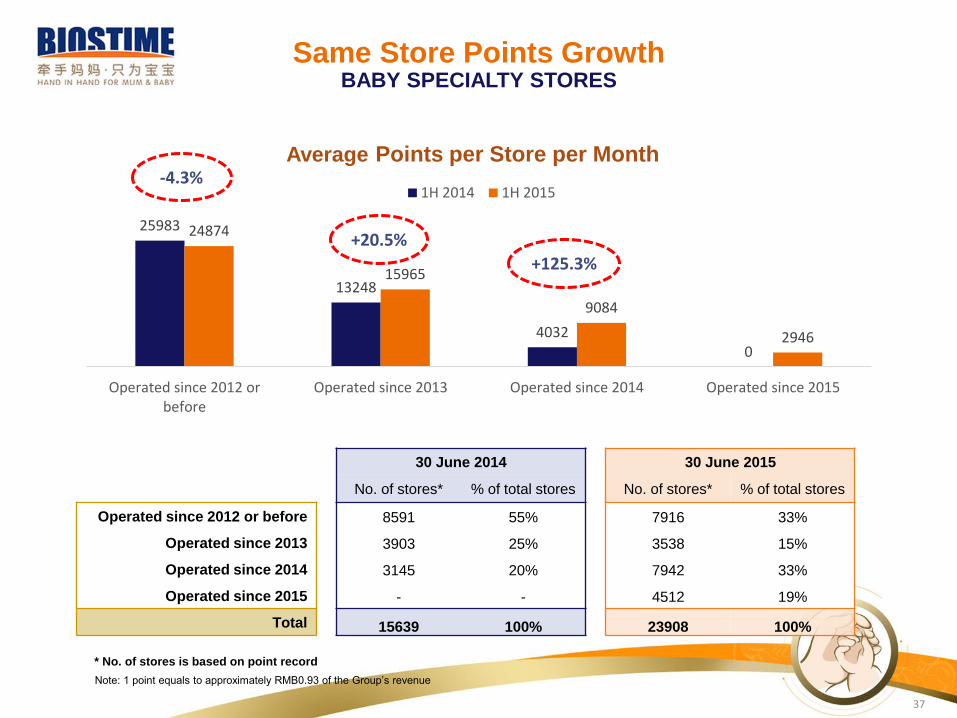
25983
13248
40320
24874
15965
9084
2946
Operated since 2012 orbefore
Operated since 2013 Operated since 2014 Operated since 2015
1H 2014 1H 2015
Same Store Points GrowthBABY SPECIALTY STORES
Average Points per Store per Month-4.3%
+20.5%
+125.3%
Note: 1 point equals to approximately RMB0.93 of the Group’s revenue
* No. of stores is based on point record
30 June 2014 30 June 2015
No. of stores* % of total stores No. of stores* % of total stores
Operated since 2012 or before 8591 55% 7916 33%
Operated since 2013 3903 25% 3538 15%
Operated since 2014 3145 20% 7942 33%
Operated since 2015 - - 4512 19%
Total 15639 100% 23908 100%
38
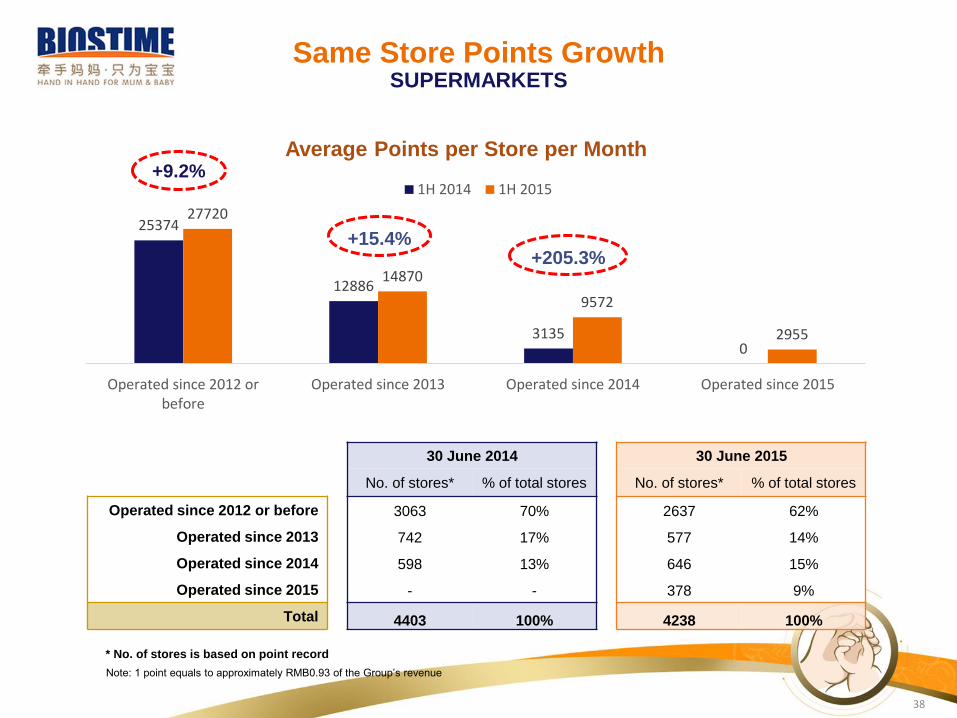
25374
12886
31350
27720
14870
9572
2955
Operated since 2012 orbefore
Operated since 2013 Operated since 2014 Operated since 2015
1H 2014 1H 2015
Same Store Points GrowthSUPERMARKETS
Average Points per Store per Month+9.2%
+15.4%
30 June 2014 30 June 2015
No. of stores* % of total stores No. of stores* % of total stores
Operated since 2012 or before 3063 70% 2637 62%
Operated since 2013 742 17% 577 14%
Operated since 2014 598 13% 646 15%
Operated since 2015 - - 378 9%
Total 4403 100% 4238 100%
+205.3%
Note: 1 point equals to approximately RMB0.93 of the Group’s revenue
* No. of stores is based on point record
39
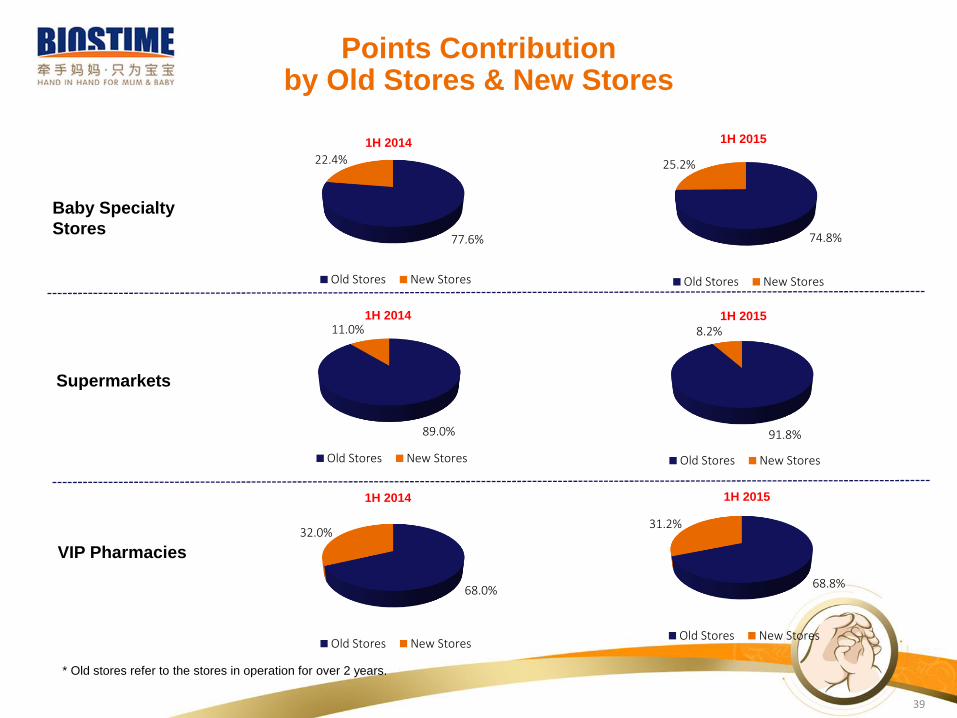
77.6%
22.4%
Old Stores New Stores
Points Contribution by Old Stores & New Stores
74.8%
25.2%
Old Stores New Stores
Baby Specialty
Stores
1H 2014
Supermarkets
VIP Pharmacies
91.8%
8.2%
Old Stores New Stores
68.8%
31.2%
Old Stores New Stores
1H 2015
* Old stores refer to the stores in operation for over 2 years.
89.0%
11.0%
Old Stores New Stores
1H 2014
1H 2014
1H 2015
1H 2015
68.0%
32.0%
Old Stores New Stores

THANK YOU
40