STOCK ASSESSMENT FOR ATLANTIC YELLOWFIN TUNA …€¦ · STOCK ASSESSMENT FOR ATLANTIC YELLOWFIN...
24
SCRS/2016/104 Collect. Vol. Sci. Pap. ICCAT, 73(2): 451-474 (2017) 451 STOCK ASSESSMENT FOR ATLANTIC YELLOWFIN TUNA USING A NON-EQUILIBRIUM PRODUCTION MODEL Takayuki Matsumoto 1 and Keisuke Satoh 1 SUMMARY A Stock-Production Model Incorporating Covariates (ASPIC), a non-equilibrium surplus-production model, was attempted for the stock assessment for the Atlantic Ocean yellowfin tuna, using the software package ASPIC ver. 5.34. The model configuration and fleet categorization are mainly based on the decision at and after this year’s data preparatory meeting. Several models indicated reasonable results. Those models predicted that at some stage in the recent past, yellowfin stock had been overfishing and had been overfished. In these cases, the fishing pressure appears to have eased in recent years, with a subsequent recovery in biomass. Based on the results of future projection, stock status in the near future will be in green zone with high probability (>60%) for future catch up to 120,000-140,000 t. Some of the sensitivity and retrospective analyses indicated non reasonable results. RÉSUMÉ Un modèle de production du stock incorporant des covariances (ASPIC), un modèle de production excédentaire en conditions de non-équilibre, a été tenté pour l'évaluation du stock d'albacore de l'océan Atlantique, en utilisant le logiciel ASPIC version 5.34. La configuration du modèle et la catégorisation des flottilles reposent essentiellement sur la décision prise pendant et après la réunion de préparation des données de cette année. Plusieurs modèles ont indiqué des résultats raisonnables. Ces modèles ont prédit qu'à un moment donné dans le passé récent, le stock d'albacore avait fait l'objet de surpêche et avait été surexploité. Dans ces cas, la pression de la pêche semble s'être atténuée au cours de ces dernières années, la biomasse s'étant rétablie par la suite. Sur la base des résultats de projections futures, l'état du stock sera dans un proche avenir dans la zone verte avec une forte probabilité (>60%) de prises futures se situant entre 120.000 et 140.000. Certaines analyses de sensibilité et rétrospectives ont indiqué des résultats non raisonnables. RESUMEN Se probó un modelo de producción de stock que incorporaba covariables (ASPIC), un modelo de producción excedente en condición de no equilibrio, para la evaluación del stock de rabil del océano Atlántico, utilizando el paquete de software ASPIC versión 5.34. La configuración del modelo y la categorización de la flota se basan principalmente en la decisión tomada en la reunión de preparación de datos de este año y después. Varios modelos produjeron resultados razonables. Estos modelos predijeron que en alguna etapa del pasado reciente, el stock de rabil había sido objeto de sobrepesca y había estado sobrepescado. En estos casos, la presión pesquera parece haberse atenuado en años recientes, con la consiguiente recuperación de la biomasa. Basándose en los resultados de las proyecciones futuras, el estado del stock en el futuro cercano estará en la zona verde con una elevada probabilidad (>60%) para capturas futuras de hasta 120.000-140.000 t. Algunos de los análisis retrospectivos y de sensibilidad produjeron resultados no razonables. KEYWORDS Stock assessment, mathematical model, yield predictions, yellowfin tuna, catch/effort 1 National Research Institute of Far Seas Fisheries, 5-7-1, Orido, Shimizu, Shizuoka-shi, 424-8633 Japan
Transcript of STOCK ASSESSMENT FOR ATLANTIC YELLOWFIN TUNA …€¦ · STOCK ASSESSMENT FOR ATLANTIC YELLOWFIN...

SCRS/2016/104 Collect. Vol. Sci. Pap. ICCAT, 73(2): 451-474 (2017)
451
STOCK ASSESSMENT FOR ATLANTIC YELLOWFIN TUNA USING A
NON-EQUILIBRIUM PRODUCTION MODEL
Takayuki Matsumoto1and Keisuke Satoh1
SUMMARY
A Stock-Production Model Incorporating Covariates (ASPIC), a non-equilibrium surplus-production model, was attempted for the stock assessment for the Atlantic Ocean yellowfin tuna, using the software package ASPIC ver. 5.34. The model configuration and fleet categorization are mainly based on the decision at and after this year’s data preparatory meeting. Several models indicated reasonable results. Those models predicted that at some stage in the recent past, yellowfin stock had been overfishing and had been overfished. In these cases, the fishing pressure appears to have eased in recent years, with a subsequent recovery in biomass. Based on the results of future projection, stock status in the near future will be in green zone with high probability (>60%) for future catch up to 120,000-140,000 t. Some of the sensitivity and retrospective analyses indicated non reasonable results.
RÉSUMÉ
Un modèle de production du stock incorporant des covariances (ASPIC), un modèle de production excédentaire en conditions de non-équilibre, a été tenté pour l'évaluation du stock d'albacore de l'océan Atlantique, en utilisant le logiciel ASPIC version 5.34. La configuration du modèle et la catégorisation des flottilles reposent essentiellement sur la décision prise pendant et après la réunion de préparation des données de cette année. Plusieurs modèles ont indiqué des résultats raisonnables. Ces modèles ont prédit qu'à un moment donné dans le passé récent, le stock d'albacore avait fait l'objet de surpêche et avait été surexploité. Dans ces cas, la pression de la pêche semble s'être atténuée au cours de ces dernières années, la biomasse s'étant rétablie par la suite. Sur la base des résultats de projections futures, l'état du stock sera dans un proche avenir dans la zone verte avec une forte probabilité (>60%) de prises futures se situant entre 120.000 et 140.000. Certaines analyses de sensibilité et rétrospectives ont indiqué des résultats non raisonnables.
RESUMEN Se probó un modelo de producción de stock que incorporaba covariables (ASPIC), un modelo de producción excedente en condición de no equilibrio, para la evaluación del stock de rabil del océano Atlántico, utilizando el paquete de software ASPIC versión 5.34. La configuración del modelo y la categorización de la flota se basan principalmente en la decisión tomada en la reunión de preparación de datos de este año y después. Varios modelos produjeron resultados razonables. Estos modelos predijeron que en alguna etapa del pasado reciente, el stock de rabil había sido objeto de sobrepesca y había estado sobrepescado. En estos casos, la presión pesquera parece haberse atenuado en años recientes, con la consiguiente recuperación de la biomasa. Basándose en los resultados de las proyecciones futuras, el estado del stock en el futuro cercano estará en la zona verde con una elevada probabilidad (>60%) para capturas futuras de hasta 120.000-140.000 t. Algunos de los análisis retrospectivos y de sensibilidad produjeron resultados no razonables.
KEYWORDS
Stock assessment, mathematical model, yield predictions, yellowfin tuna, catch/effort
1 National Research Institute of Far Seas Fisheries, 5-7-1, Orido, Shimizu, Shizuoka-shi, 424-8633 Japan

452
Introduction At 2011 ICCAT yellowfin tuna stock assessment meeting, stock assessment was held based on a Stock-Production Model Incorporating Covariates (ASPIC) and VPA 2-box models. At that time the results for both models, which were comparatively similar, were adopted for management advice. At 2016 ICCAT yellowfin tuna data preparatory meeting, it was decided that ASPIC will again be used for one of the stock assessment models for yellowfin tuna assessment in 2016 (ICCAT, 2016). Some of CPUE indices have been revised after the data preparatory meeting, and decision has been made which CPUE will be used. This paper provides preliminary stock assessment results based ASPIC model version 5.34 (Prager, 1992) applied to the Atlantic yellowfin tuna stock. 1. Model description and data input 1.1. Data and structural assumptions of the model
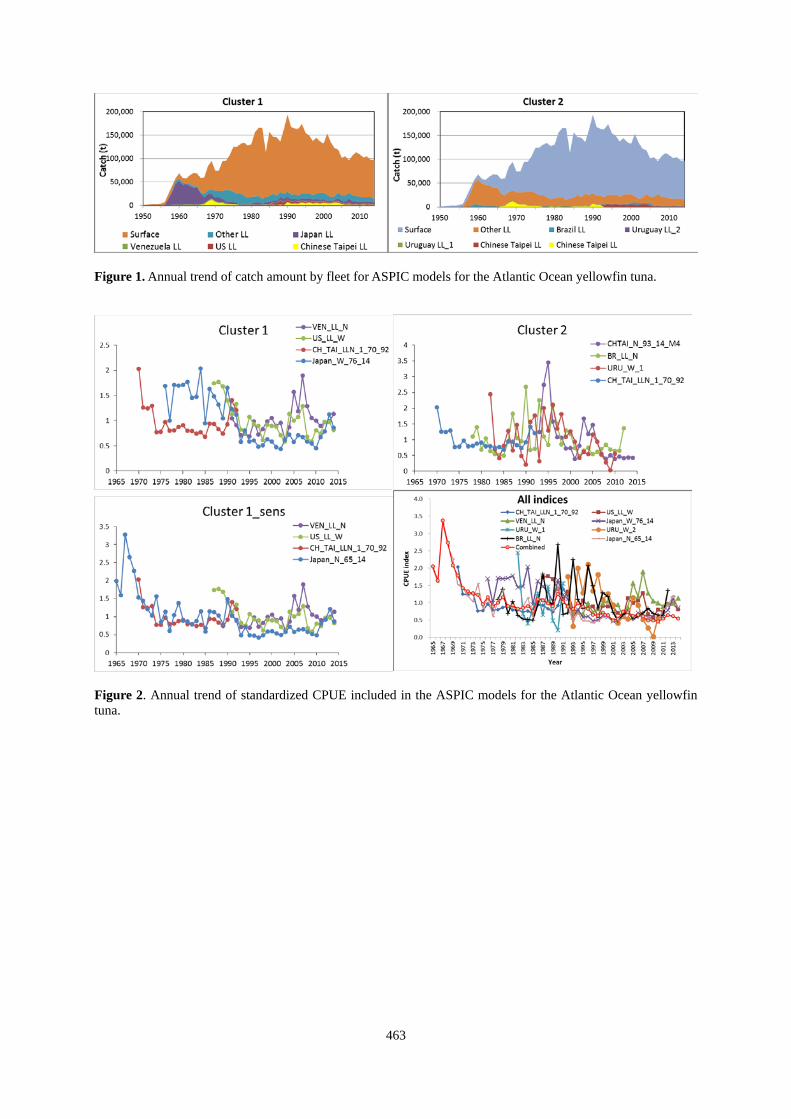
The model was fit to six or seven time series of catch (1950-2014) and four or five time series of CPUE (1965-2014) data. Fleet description (Table 1) is based on the agreement by the ICCAT yellowfin tuna working group members. The combination of CPUEs is based on their trend; one cluster (“Cluster 1”) of indices (Japanese LL, Ven LL, US LL, Chinese Taipei 1970-1992) shows an initial early decline, and then generally varies without trend. The second cluster (URU LL, BRZ LL, Chinese Taipei 1993-2014) shows an increase in CPUE in the mid-90s and then a subsequent decline. These are different from base model specifications at 2011 assessment, in which one fleet with one combined CPUE was used. As for continuity analysis, the model with one fleet and combined CPUE was examined. Combined CPUE was created using CPUE indices shown in Table 2 with weighted average by the number of 5x5 latitude and longitude counts summed by quarter within year (count of cell number with positive catch of YFT). In addition, the models with one fleet and only Japanese or US longline CPUE were also examined. Table 3 and Figure 1 show catch by fleet and Table 4 and Figure 2 show CPUE indices used for the models. Both logistic (Schaefer) and Fox shape were used to fit the data. B1/K was fixed to 0.9. Weighting of the fleet was either equal weight or weighted by average catch amount. The list of the scenarios is shown in Table 5. 1.2. Future projection
Software package ASPICP ver 3.16 was used for future projections. Based on bootstrapping (500 times) of above scenarios, future projections were conducted. Projection period is 15 years (2015-2029). Constant future catch with 70,000 t to 150,000 t (at 10,000 t interval) or constant future F with 0.75*F2014/FMSY to 1.00*F2014/FMSY (at 0.05*F2014/FMSY interval) was assumed. Catch for 2015 and 2016 was tentatively assumed to be the same as 2014 level. 1.3. Sensitivity analysis
Several sensitivity and retrospective analyses were conducted for one scenario (Cluster 1, logistic model) of ASPIC model (Table 6). In the scenario with start year 1970, B1/K was set at 0.84 which was calculated from K and biomass in 1970 estimated in the base model. Sensitivity analyses include scenarios with different B1/K and scenarios which exclude one or more CPUE. 2. Result and discussion Table 7 shows summary results of ASPIC runs. No reasonable results were obtained for Cluster 2, and so its results were not referred hereafter. As for Cluster 1, estimation of MSY ranged 126 to 133 thousand tons, which was much higher than 2014 catch (97 thousand tons). B-ratio (B2015/BMSY) was close to or over 1.0, and F-ratio (F2014/FMSY) was lower than 1.0. Estimation of r (intrinsic growth rate) differed depending on scenarios. Results of the scenarios with catch weighting were more optimistic than those with equal weighting, and Fox model more optimistic than those with logistic model. The results for “Cluster 1_sens” were more optimistic than those for Cluster 1. Results for “continuity runs” (with combined CPUE) indicated very pessimistic results compared with those for Cluster 1.

453
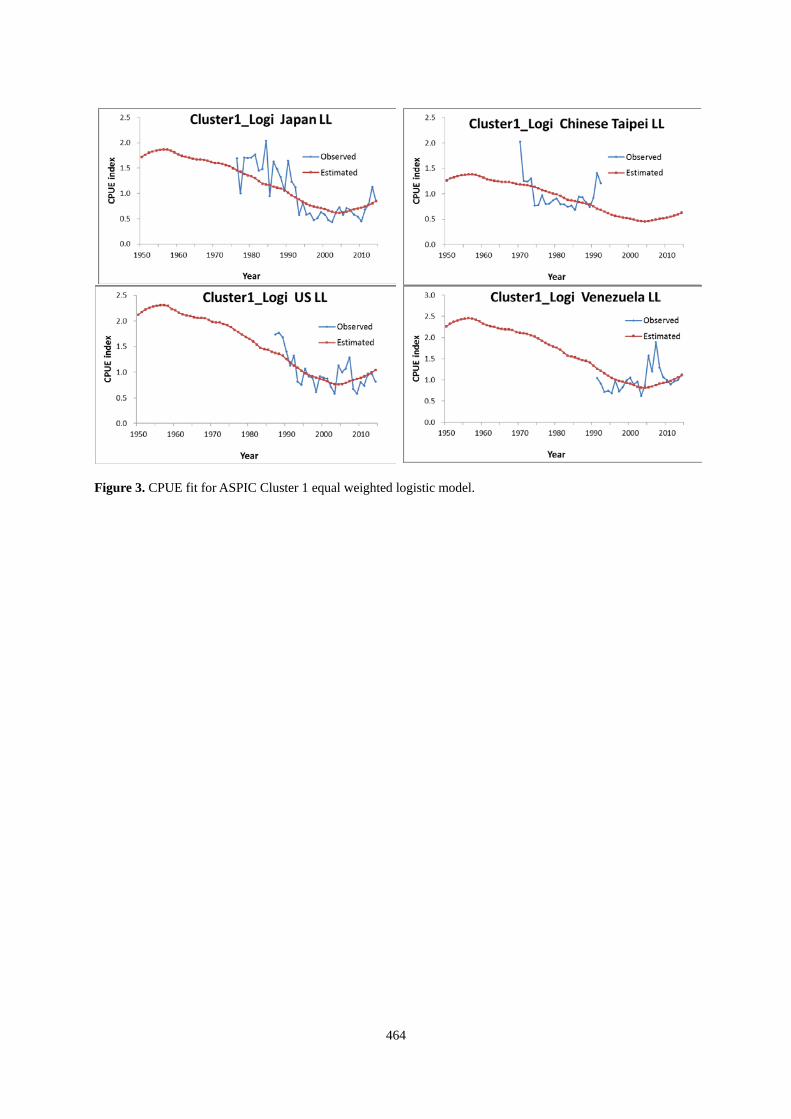
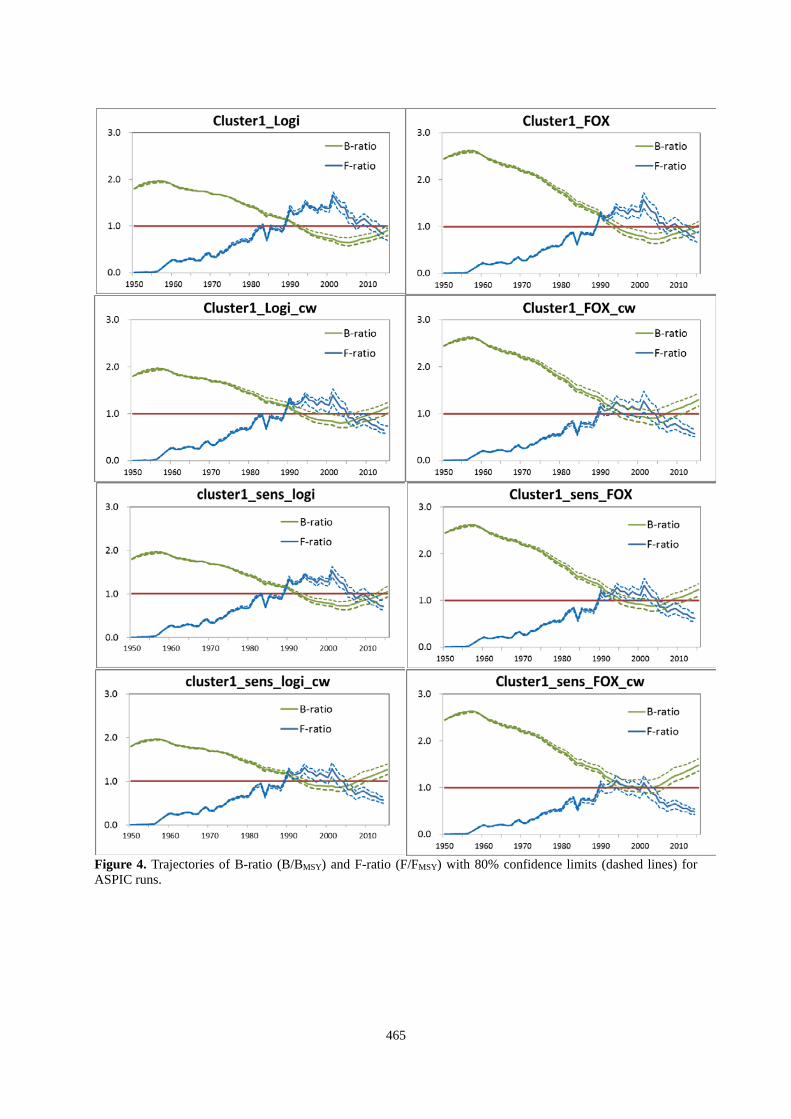
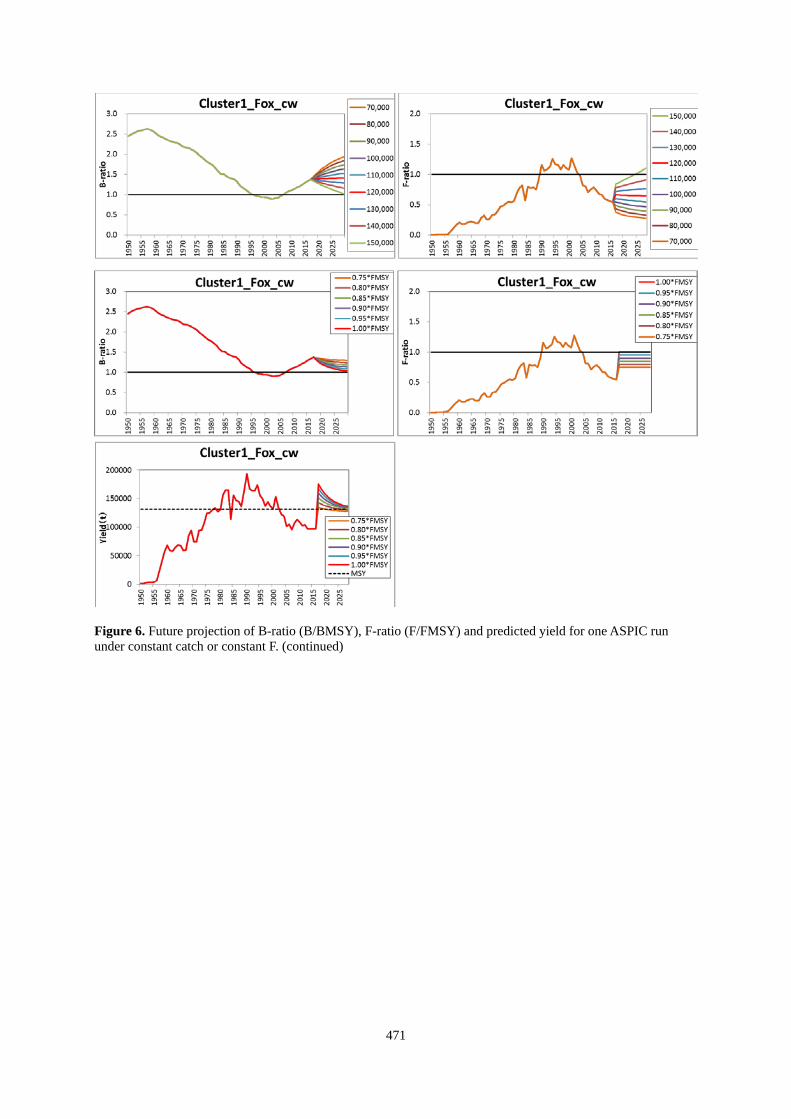
Model fits to the indices of abundance are similar among scenarios, and Figure 3 shows an example (1_Logi_eq). CPUE fit was comparatively good except for a part of period. Figure 4 shows trends of B-ratio (B/BMSY) and F-ratio (F/FMSY) for each scenario, and Figure 5 shows Kobe I plot for scenarios of Cluster 1, which indicate reasonable result. It appears that the stock had been overfishing and overfished during the last 10-20 years, but is recovering in recent years and the stock is currently in a green or yellow zone. Figure 6 shows the trends of F-ratio and B-ratio, respectively, for the future projection for the four scenarios of Cluster 1. It was estimated that F exceeds and biomass drops under MSY level within 15 years if future catch is over 130,000 t for logistic model equal weight and Fox model equal weight, and more optimistic for logistic and Fox model equal weight. Table 8 shows Kobe II matrixes (risk assessment) based on future projections for the four scenarios of Cluster 1. If future catch is 120,000 t to 140,000 t (differs depending on scenarios), the probability of being in the green zone of the Kobe plot becomes >60% within 15 years. It seems that, in recent years, due to lower catch level (Figure 1), Atlantic yellowfin stock is recovering, and will continue to recover if current catch level is continued. Figure 7 shows the results of sensitivity analyses for the scenario Cluster 1 logistic model equal weight. Changes in B1/K caused very large difference for B1/K 0.8, but little effect for 1.0. No reasonable results were obtained if Taiwanese or Venezuela longline CPUE was excluded, or if only Japanese and Taiwanese longline CPUE were used. The model with start year 1970 also didn’t get reasonable results. Figure 8 shows the results of retrospective analyses for the four scenarios of Cluster 1. No reasonable result was obtained and the model didn’t converge for the scenario which excluded one year as for logistic model equal weight and Fox model equal weight, respectively. Comparatively large difference (up to more or less 50%) was observed near the terminal years for logistic model equal weight. As for the rest, the results were close to that for the base model. Based on these results, logistic model with equal weight (and possibly Fox model equal weight as well) seems to be less appropriate for the base case. References ICCAT. 2012. Report of the 2011 ICCAT yellowfin tuna stock assessment session (San Sebastian, Spain - 5-12
September 2011). Col. Vol. Sci. Pap. ICCAT 68: 655–817. ICCAT. 2016. Report of the 2016 ICCAT yellowfin tuna data preparatory meeting (San Sebastian, Spain - 7-11
March 2016). 31pp. Prager, M.H. 1992, ASPIC: A Surplus-Production Model Incorporating Covariates. Col. Vol. Sci. Pap. ICCAT,
28: 218-229.

454
Table 1. Fleet descriptions and CPUE used in the ASPIC models in this study.
Fleet Chinese Taipei LL US LL Venezuela
LL Japan LL Uruguay LL Brazil
LL Other LL* Surface
Cluster1 1970-1992 1987- 2014
1991- 2014
1976- 2014
Catch only
Catch only
Cluster2 1970-1992, 1993-2014
1982-1991, 1992-2010
1978- 2012
Catch only
Catch only
CLUSTER_1_Sens 1970-1992 1987-
2014 1991- 2014
1965- 2014
Catch only
Catch only
* Aggregation of longline fishery for which CPUE is not used in the cluster. Table 2. List of CPUE indices used for creating combined CPUE.
abbreviation Fleet source 1 JPLL Japan longline JAP_CPUEN (column F) 2 BRLL Brazil longline BRA_LL (column K) 3 TLLE
Chinese Taipei longline TAI_M1_CPUEN (column D)
4 TLLL TAI_M4_CPUEN (column D)
5 GOLL Gulf of Mexico longline SCRS/2016/041 (Table 15) Stand. CPUE
6 ATLL U.S. longline (Atl. only) SCRS/2016/041 (Table 13) Stand. CPUE
7 ULLE Uruguay longline
URU_LL_CPUEW (column F) 8 ULLL URU_LL_CPUEW (column M) 9 VELL Venezuela longline VEN_LL_N (column H)
10 BRBB Brazil baitboat RelictIndices (column AS) 11 EDBB EU Dakar baitboat RelictIndices (column AG) 12 CIBB Canarias Islands baitboat RelictIndices (column AQ)
13 USRR U.S. rod and reel recreational RelictIndices (column F)
14 EPS3 EU purse seine 3% ASPIC_combined_indexes_base_case2.xlsx worksheet (indexes base) (columns N)
15 EPS1 EU_PS_1% ASPIC_combined_indexes_base_case2.xlsx worksheet (indexes base) (column O)
16 EPSF ES_FAD_PS ASPIC_combined_indexes_base_case2.xlsx worksheet (indexes base) (column P)
17 EPS7 EU purse seine 7% ASPIC_combined_indexes_base_case2.xlsx worksheet (indexes base) (columns Q)
18 VEPS Venezuela purse seine RelictIndices (column AR)

455
Table 3. Catches (t) of yellowfin tuna for each fleet listed in Table 1
Chinese Taipei LL
US LL
Venezuela LL
Japan LL
Brazil LL
Uruguay LL
Other LL (Cluster 1)
Other LL (Cluster 2)
Other LL (Cluster 1_Sens)
Surface
1950 0 0 0 0 0 0 0 0 0 1,200 1951 0 0 0 0 0 0 0 0 0 1,358 1952 0 0 0 0 0 0 0 0 0 2,787 1953 0 0 0 0 0 0 0 0 0 3,600 1954 0 0 0 0 0 0 0 0 0 3,407 1955 0 0 0 0 0 0 0 0 0 4,300 1956 0 0 0 612 0 0 0 612 0 5,985 1957 0 0 688 13,198 0 0 0 13,886 0 9,812 1958 0 0 1,050 27,159 1,740 0 1,740 28,209 1,740 10,632 1959 0 111 1,780 44,071 5,920 0 5,920 45,962 5,920 5,887 1960 0 0 1,597 50,822 4,700 0 4,702 52,421 4,702 11,372 1961 0 0 1,728 42,609 4,400 0 4,425 44,362 4,425 10,041 1962 278 17 3,001 41,973 1,400 0 1,423 45,014 1,423 10,831 1963 399 8 2,781 37,717 2,400 0 4,249 42,355 4,249 19,444 1964 396 0 1,787 35,106 1,624 0 3,038 38,307 3,038 28,601 1965 183 0 1,657 36,918 696 0 2,085 39,964 2,085 26,878 1966 1,243 0 1,978 22,354 464 0 2,341 26,209 2,341 30,820 1967 3,023 0 1,637 12,824 812 0 6,939 20,588 6,939 35,802 1968 8,884 0 1,661 13,913 812 0 7,771 22,533 7,771 52,094 1969 12,202 0 2,268 9,966 464 0 10,043 21,813 10,043 60,092 1970 7,990 0 1,748 6,809 812 0 14,447 22,192 14,447 43,461 1971 4,938 0 2,149 10,629 347 0 13,518 25,949 13,518 43,231 1972 5,317 0 2,398 6,497 233 0 16,508 25,170 16,508 63,908 1973 3,000 0 1,921 3,803 153 0 24,422 29,993 24,422 61,987 1974 2,630 0 1,210 3,475 232 0 24,967 29,420 24,967 74,859 1975 2,669 0 563 4,192 260 0 22,235 26,730 22,235 95,137 1976 1,962 0 626 3,366 681 0 18,871 22,182 18,871 100,136 1977 372 0 827 1,467 928 0 22,903 24,269 22,903 105,444 1978 384 0 1,306 1,923 795 0 17,249 19,683 17,249 113,182 1979 1,038 0 1,000 1,986 1,076 0 12,030 13,940 12,030 111,463 1980 687 52 1,000 2,839 521 0 14,681 18,051 14,681 111,484 1981 867 45 1,000 4,145 1,159 67 13,252 17,216 13,252 136,829 1982 610 65 484 6,062 935 214 13,161 18,623 13,161 144,861 1983 539 165 1,248 2,069 887 357 10,354 12,592 10,354 151,236 1984 646 593 1,667 3,967 484 368 11,189 16,564 11,189 95,996 1985 926 738 1,626 5,308 515 354 11,677 18,480 11,677 136,342 1986 1,410 3,975 910 3,405 1,057 270 15,227 22,190 15,227 121,681 1987 902 4,888 646 3,365 653 109 11,147 19,284 11,147 124,403 1988 1,848 8,644 731 5,982 898 177 11,080 25,362 11,080 107,952 1989 858 6,247 497 6,970 1,126 64 10,467 22,991 10,467 137,353 1990 7,465 4,474 258 5,919 661 18 11,100 21,072 11,100 164,388 1991 4,172 4,141 338 4,718 582 62 9,813 18,366 9,813 144,340 1992 4,528 5,337 459 3,715 1,248 74 9,815 18,004 9,815 139,916 1993 4,196 3,886 707 3,096 1,514 20 8,777 14,932 8,777 142,785 1994 6,660 3,246 850 4,783 1,084 59 10,888 18,625 10,888 147,317 1995 4,698 3,645 687 5,227 1,312 53 10,652 18,845 10,652 129,679 1996 6,653 3,320 383 5,250 734 171 10,512 18,560 10,512 123,039 1997 4,466 3,773 381 3,539 849 53 9,878 16,670 9,878 115,337 1998 5,328 2,449 560 5,173 1,014 88 12,032 19,112 12,032 118,954 1999 4,411 3,541 504 3,405 2,930 45 15,193 19,668 15,193 109,271 2000 5,661 2,901 421 4,061 2,754 45 14,085 18,669 14,085 105,025 2001 4,805 2,200 451 2,691 4,883 90 12,295 12,664 12,295 131,013 2002 4,659 2,573 266 2,105 3,321 91 8,185 9,717 8,185 116,637 2003 6,486 2,164 323 2,754 1,940 95 7,623 10,829 7,623 103,100 2004 5,824 2,492 558 6,260 1,968 204 12,421 19,560 12,421 91,889 2005 3,596 1,746 833 4,247 4,695 644 11,349 12,836 11,349 79,980 2006 1,260 2,010 593 4,643 1,329 218 12,983 18,681 12,983 83,171 2007 1,947 2,395 613 9,037 1,552 35 13,009 23,466 13,009 68,962 2008 1,122 1,394 712 6,252 1,744 66 12,279 18,826 12,279 84,957 2009 1,391 1,686 898 4,994 1,039 76 11,208 17,671 11,208 93,259 2010 824 1,218 1,249 4,580 1,145 122 10,719 16,499 10,719 90,192 2011 1,768 1,462 1,090 4,454 1,794 24 8,513 13,701 8,513 85,351 2012 1,071 2,270 736 4,661 1,815 6 9,337 15,184 9,337 86,436 2013 1,260 1,544 738 4,577 1,584 0 9,851 15,126 9,851 79,299 2014 1,047 1,456 790 3,828 703 0 6,569 11,940 6,569 83,342

456
Table 4. Standardized CPUE series for yellowfin tuna included in the ASPIC models.
Year CH_TAI_LLN_1_70_92
US_LL_W
VEN_LL_N
Japan_W_76_14
URU_W_1
URU_W_2
BR_LL_N
Japan_N_65_14
Combined
1965 1.991 2.050 1966 1.597 1.644 1967 3.280 3.377 1968 2.655 2.734 1969 2.265 2.080 1970 2.031 1.530 1.786 1971 1.261 1.437 1.431 1972 1.242 1.211 1.340 1973 1.297 1.037 1.272 1974 0.769 1.565 1.237 1975 0.775 0.843 0.963 1976 0.972 1.691 1.141 1.166 1977 0.797 1.002 0.604 0.897 1978 0.806 1.712 1.1 1.048 1.008 1979 0.873 1.696 1.4 1.379 1.166 1980 0.908 1.712 0.69 0.888 0.907 1981 0.796 1.771 1.04 0.871 0.931 1982 0.794 1.453 2.44 0.64 0.786 0.833 1983 0.742 1.477 0.68 0.54 0.881 0.858 1984 0.769 2.039 0.41 0.52 1.150 0.906 1985 0.680 0.950 0.81 0.5 0.584 0.762 1986 0.944 1.632 1.28 0.94 1.148 1.112 1987 0.932 1.741 1.483 0.66 1.83 1.123 1.076 1988 0.831 1.768 1.316 1.47 1.05 1.031 0.993 1989 0.739 1.683 1.047 0.49 0.95 0.783 0.903 1990 0.922 1.399 1.655 0.21 2.68 1.481 1.259 1991 1.405 1.129 1.044 1.229 1.56 0.67 1.026 1.030 1992 1.208 1.330 0.913 1.120 1.76 0.71 0.890 0.893 1993 0.820 0.711 0.578 0.32 2.25 0.480 0.819 1994 0.753 0.743 0.810 2.00 1.1 0.708 0.991 1995 1.073 0.686 0.582 1.29 0.84 0.479 0.898 1996 0.923 0.985 0.609 2.11 2.07 0.475 0.836 1997 0.893 0.725 0.478 1.35 1.5 0.416 0.659 1998 0.617 0.830 0.512 1.81 0.85 0.478 0.631 1999 0.920 0.987 0.628 1.09 1.29 0.588 0.722 2000 0.896 1.050 0.587 1.27 1.18 0.592 0.645 2001 0.878 0.897 0.476 0.94 0.73 0.534 0.490 2002 0.713 0.954 0.433 0.42 0.48 0.488 0.550 2003 0.582 0.622 0.612 0.61 0.660 0.575 0.744 2004 1.135 0.870 0.727 0.54 0.740 0.722 0.731 2005 1.001 1.573 0.575 1.16 0.540 0.576 0.624 2006 1.075 1.187 0.712 0.93 0.610 0.639 0.654 2007 1.289 1.894 0.673 0.52 0.710 0.646 0.607 2008 0.679 1.286 0.583 0.28 0.840 0.577 0.489 2009 0.581 1.055 0.547 0.03 0.690 0.511 0.490 2010 0.807 1.001 0.451 0.56 0.650 0.483 0.461 2011 0.741 0.895 0.676 0.650 0.809 0.543 2012 0.975 0.967 0.785 1.360 0.921 0.643 2013 0.970 0.992 1.128 1.212 0.619 2014 0.814 1.133 0.857 0.869 0.546

457
Table 5. Specification of model runs presented in this paper.
Model run Cluster B1/K Production function
Weighting of fleets Comment
1_Fox_eq 1 0.9 Fox Equal 1_Fox_cw 1 0.9 Fox Catch 1_Logi_eq 1 0.9 Logistic Equal 1_Logi_cw 1 0.9 Logistic Catch 2_Fox_eq 2 0.9 Fox Equal 2_Fox_cw 2 0.9 Fox Catch 2_Logi_eq 2 0.9 Logistic Equal 2_Logi_cw 2 0.9 Logistic Catch
1_sens_Fox_eq 1_sens 0.9 Fox Equal 1_sens_Fox_cw 1_sens 0.9 Fox Catch 1_sens_Logi_eq 1_sens 0.9 Logistic Equal 1_sens_Logi_cw 1_sens 0.9 Logistic Catch
JPN_7614_Logi None 0.9 Logistic None 1 fleet, only Japan LL CPUE (1976-2014)
JPN_7614_FOX None 0.9 Fox None 1 fleet, only Japan LL CPUE (1976-2014)
US_LL_logi None 0.9 Logistic None 1 fleet, only US LL CPUE US_LL_FOX None 0.9 Fox None 1 fleet, only US LL CPUE
Comb_CPUE_Logi None 0.9 Logistic None 1 fleet, combined CPUE Comb_CPUE_Fox None 0.9 Fox None 1 fleet, combined CPUE
Table 6. Scenarios of sensitivity analyses for the ASPIC model runs for yellowfin tuna. Scenario Abbreviation in the graph B1/K fix at 0.8 B1/K 0.8 B1/K fix at 1.0 B1/K 1.0 Drop index of Japan LL no JPLL Drop index of Taiwanese LL no TWLL Only with Taiwanese LL and JPN LL indices only TWLL&JPLL Drop index of US LL no USLL Drop index of Venezuela LL no VenLL Start year 1970 Start 1970

458
Table 7. Results of the ASPIC model runs.
Model run MSY (t) FMSY BMSY B2015/ BMSY
F2014/ FMSY K r
1_Fox_eq 126,000 0.170 739,800 1.019 0.770 2,011,000 0.17 1_Fox_cw 131,500 0.181 727,100 1.296 0.578 1,977,000 0.18 1_Logi_eq 132,400 0.168 787,100 0.908 0.827 1,574,000 0.34 1_Logi_cw 132,600 0.148 898,500 1.137 0.654 1,797,000 0.30 2_Fox_eq No convergence 2_Fox_cw No convergence 2_Logi_eq 9,651,000 1.868 5,167,000 1.995 0.005 10,330,000 3.74 2_Logi_cw 769,300 1.426 539,600 1.935 0.065 1,079,000 2.85
1_sens_Fox_eq 129,700 0.173 749,000 1.236 0.615 2,036,000 0.17 1_sens_Fox_cw 137,400 0.206 666,700 1.483 0.483 1,812,000 0.21 1_sens_Logi_eq 132,800 0.162 818,300 1.055 0.706 1,637,000 0.32 1_sens_Logi_cw 136,500 0.166 821,600 1.271 0.567 1,643,000 0.33 JPN_7614_Logi 145,000 0.338 429,500 0.978 0.723 859,100 0.68 JPN_7614_FOX 133,800 0.261 512,200 0.984 0.764 1,392,000 0.26
US_LL_Logi 126,400 0.131 965,500 0.770 1.012 1,931,000 0.26 US_LL_FOX 119,100 0.135 882,300 0.885 0.933 2,398,000 0.14
Comb_CPUE_Logi 114,500 0.086 1,329,000 0.654 1.298 2,658,000 0.17 Comb_CPUE_Fox 101,500 0.073 1,394,000 0.852 1.123 3,789,000 0.07

459
Table 8. Kobe II risk matrix (probability of not exceeding MSY level) based on ASPIC results for yellowfin tuna. 1_Logi_eq Probability B>BMSY Catch (t) 2015 2016 2017 2018 2019 2020 2021 2022 2023 2024 2025 2026 2027 2028 2029
70,000 31% 38% 46% 64% 84% 95% 98% 99% 100% 100% 100% 100% 100% 100% 100%80,000 31% 38% 46% 62% 79% 91% 96% 98% 99% 99% 99% 99% 99% 99% 100%90,000 31% 38% 46% 59% 73% 84% 92% 96% 98% 98% 98% 99% 99% 99% 99%
100,000 31% 38% 46% 56% 66% 76% 85% 91% 94% 96% 97% 97% 98% 98% 98%110,000 31% 38% 46% 52% 60% 67% 73% 79% 85% 90% 91% 93% 94% 95% 95%120,000 31% 38% 46% 50% 54% 57% 61% 65% 70% 72% 76% 79% 82% 85% 87%130,000 31% 38% 46% 46% 46% 48% 48% 48% 49% 49% 49% 49% 49% 50% 51%140,000 31% 38% 46% 43% 39% 38% 36% 33% 30% 28% 26% 22% 20% 17% 15%150,000 31% 38% 46% 39% 37% 32% 26% 23% 18% 14% 11% 8% 6% 4% 3%
F 2015 2016 2017 2018 2019 2020 2021 2022 2023 2024 2025 2026 2027 2028 20290.75*FMSY 31% 38% 46% 55% 63% 71% 75% 78% 81% 83% 84% 86% 87% 88% 88%0.80*FMSY 31% 38% 46% 53% 60% 64% 69% 73% 75% 76% 78% 79% 79% 80% 80%0.85*FMSY 31% 38% 46% 52% 56% 60% 63% 65% 68% 70% 71% 72% 73% 74% 74%0.90*FMSY 31% 38% 46% 50% 52% 55% 57% 59% 60% 61% 62% 63% 64% 64% 64%0.95*FMSY 31% 38% 46% 47% 49% 51% 52% 52% 53% 54% 54% 54% 55% 55% 55%1.00*FMSY 31% 38% 46% 46% 46% 45% 45% 45% 45% 45% 45% 45% 45% 45% 45% 1_Logi_eq Probability F<FMSY Catch (t) 2015 2016 2017 2018 2019 2020 2021 2022 2023 2024 2025 2026 2027 2028
70,000 90% 96% 100% 100% 100% 100% 100% 100% 100% 100% 100% 100% 100% 100%80,000 90% 96% 100% 100% 100% 100% 100% 100% 100% 100% 100% 100% 100% 100%90,000 90% 96% 100% 100% 100% 100% 100% 100% 100% 100% 100% 100% 100% 100%
100,000 90% 96% 98% 100% 100% 100% 100% 100% 100% 100% 100% 100% 100% 100%110,000 90% 96% 89% 94% 96% 98% 99% 100% 100% 100% 100% 100% 100% 100%120,000 90% 96% 73% 76% 80% 83% 87% 90% 93% 94% 95% 96% 96% 97%130,000 90% 96% 51% 51% 51% 52% 54% 54% 54% 56% 57% 57% 57% 58%140,000 90% 96% 34% 32% 29% 27% 24% 23% 20% 18% 16% 13% 11% 10%150,000 90% 96% 21% 18% 15% 13% 10% 8% 6% 5% 3% 3% 2% 2%
F 2015 2016 2017 2018 2019 2020 2021 2022 2023 2024 2025 2026 2027 20280.75*FMSY 90% 96% 93% 93% 93% 93% 93% 93% 93% 93% 93% 93% 93% 93%0.80*FMSY 90% 96% 86% 86% 86% 86% 86% 86% 86% 86% 86% 86% 86% 86%0.85*FMSY 90% 96% 78% 78% 78% 78% 78% 78% 78% 78% 78% 78% 78% 78%0.90*FMSY 90% 96% 68% 68% 68% 68% 68% 68% 68% 68% 68% 68% 68% 68%0.95*FMSY 90% 96% 57% 57% 57% 57% 57% 57% 57% 57% 57% 57% 57% 57%1.00*FMSY 90% 96% 47% 47% 47% 47% 47% 47% 47% 47% 47% 47% 47% 47% 1_Logi_eq Probability green zone of Kobe plot Catch (t) 2015 2016 2017 2018 2019 2020 2021 2022 2023 2024 2025 2026 2027 2028
70,000 31% 38% 46% 64% 84% 95% 98% 99% 100% 100% 100% 100% 100% 100%80,000 31% 38% 46% 62% 79% 91% 96% 98% 99% 99% 99% 99% 99% 99%90,000 31% 38% 46% 59% 73% 84% 92% 96% 98% 98% 98% 99% 99% 99%
100,000 31% 38% 46% 56% 66% 76% 85% 91% 94% 96% 97% 97% 98% 98%110,000 31% 38% 46% 52% 60% 67% 73% 79% 85% 90% 91% 93% 94% 95%120,000 31% 38% 46% 50% 54% 57% 61% 65% 70% 72% 76% 79% 82% 85%130,000 31% 38% 46% 46% 46% 48% 48% 48% 49% 49% 49% 49% 49% 50%140,000 31% 38% 34% 32% 29% 27% 24% 23% 20% 18% 16% 13% 11% 10%150,000 31% 38% 21% 18% 15% 13% 10% 8% 6% 5% 3% 3% 2% 2%
F 2015 2016 2017 2018 2019 2020 2021 2022 2023 2024 2025 2026 2027 20280.75*FMSY 31% 38% 46% 55% 63% 71% 75% 78% 81% 83% 84% 86% 87% 88%0.80*FMSY 31% 38% 46% 53% 60% 64% 69% 73% 75% 76% 78% 79% 79% 80%0.85*FMSY 31% 38% 46% 52% 56% 60% 63% 65% 68% 70% 71% 72% 73% 74%0.90*FMSY 31% 38% 46% 50% 52% 55% 57% 59% 60% 61% 62% 63% 64% 64%0.95*FMSY 31% 38% 46% 47% 49% 51% 52% 52% 53% 54% 54% 54% 55% 55%1.00*FMSY 31% 38% 45% 45% 45% 45% 45% 45% 45% 45% 44% 44% 44% 44%

460
Table 8. Kobe II risk matrix (probability of not exceeding MSY level) based on ASPIC results for yellowfin tuna. (continued) 1_Logi_cw Probability B>BMSY Catch (t) 2015 2016 2017 2018 2019 2020 2021 2022 2023 2024 2025 2026 2027 2028 2029
70,000 70% 76% 85% 94% 98% 99% 100% 100% 100% 100% 100% 100% 100% 100% 100%80,000 70% 76% 85% 92% 97% 99% 99% 100% 100% 100% 100% 100% 100% 100% 100%90,000 70% 76% 85% 91% 95% 98% 99% 99% 99% 99% 99% 100% 100% 100% 100%
100,000 70% 76% 85% 89% 92% 95% 98% 98% 98% 98% 99% 99% 99% 99% 99%110,000 70% 76% 85% 88% 90% 92% 93% 95% 97% 97% 97% 97% 97% 98% 98%120,000 70% 76% 85% 85% 87% 88% 89% 89% 90% 91% 92% 92% 93% 93% 94%130,000 70% 76% 85% 84% 83% 83% 83% 83% 82% 82% 82% 81% 81% 81% 80%140,000 70% 76% 85% 82% 79% 76% 74% 72% 70% 69% 66% 65% 64% 63% 60%150,000 70% 76% 85% 79% 75% 70% 67% 64% 60% 58% 53% 49% 46% 42% 39%
F 2015 2016 2017 2018 2019 2020 2021 2022 2023 2024 2025 2026 2027 2028 20290.75*FMSY 70% 76% 85% 85% 86% 87% 87% 87% 88% 88% 88% 88% 88% 89% 89%0.80*FMSY 70% 76% 85% 84% 84% 83% 83% 83% 83% 83% 83% 83% 82% 82% 82%0.85*FMSY 70% 76% 85% 82% 80% 78% 78% 76% 76% 76% 75% 75% 75% 74% 74%0.90*FMSY 70% 76% 85% 80% 77% 75% 73% 71% 70% 70% 69% 68% 68% 68% 67%0.95*FMSY 70% 76% 85% 78% 75% 71% 69% 68% 66% 65% 64% 63% 61% 61% 60%1.00*FMSY 70% 76% 85% 77% 71% 68% 66% 64% 61% 59% 58% 58% 56% 55% 54% 1_Logi_ cw Probability F<FMSY Catch (t) 2015 2016 2017 2018 2019 2020 2021 2022 2023 2024 2025 2026 2027 2028
70,000 100% 100% 100% 100% 100% 100% 100% 100% 100% 100% 100% 100% 100% 100%80,000 100% 100% 100% 100% 100% 100% 100% 100% 100% 100% 100% 100% 100% 100%90,000 100% 100% 100% 100% 100% 100% 100% 100% 100% 100% 100% 100% 100% 100%
100,000 100% 100% 100% 100% 100% 100% 100% 100% 100% 100% 100% 100% 100% 100%110,000 100% 100% 100% 100% 100% 100% 100% 100% 100% 100% 100% 100% 100% 100%120,000 100% 100% 97% 98% 98% 98% 99% 99% 99% 99% 99% 99% 99% 99%130,000 100% 100% 88% 87% 86% 85% 85% 85% 85% 85% 84% 84% 84% 84%140,000 100% 100% 71% 70% 67% 65% 64% 62% 60% 57% 57% 55% 53% 51%150,000 100% 100% 59% 55% 50% 46% 43% 40% 36% 33% 31% 30% 27% 24%
F 2015 2016 2017 2018 2019 2020 2021 2022 2023 2024 2025 2026 2027 20280.75*FMSY 100% 100% 94% 94% 94% 94% 94% 94% 94% 94% 94% 94% 94% 94%0.80*FMSY 100% 100% 87% 87% 87% 87% 87% 87% 87% 87% 87% 87% 87% 87%0.85*FMSY 100% 100% 76% 76% 76% 76% 76% 76% 76% 76% 76% 76% 76% 76%0.90*FMSY 100% 100% 67% 67% 67% 67% 67% 67% 67% 67% 67% 67% 67% 67%0.95*FMSY 100% 100% 58% 58% 58% 58% 58% 58% 58% 58% 58% 58% 58% 58%1.00*FMSY 100% 100% 48% 48% 48% 48% 48% 48% 48% 48% 48% 48% 48% 48% 1_Logi_ cw Probability green zone of Kobe plot Catch (t) 2015 2016 2017 2018 2019 2020 2021 2022 2023 2024 2025 2026 2027 2028
70,000 70% 76% 85% 94% 98% 99% 100% 100% 100% 100% 100% 100% 100% 100%80,000 70% 76% 85% 92% 97% 99% 99% 100% 100% 100% 100% 100% 100% 100%90,000 70% 76% 85% 91% 95% 98% 99% 99% 99% 99% 99% 100% 100% 100%
100,000 70% 76% 85% 89% 92% 95% 98% 98% 98% 98% 99% 99% 99% 99%110,000 70% 76% 85% 88% 90% 92% 93% 95% 97% 97% 97% 97% 97% 98%120,000 70% 76% 85% 85% 87% 88% 89% 89% 90% 91% 92% 92% 93% 93%130,000 70% 76% 85% 84% 83% 83% 83% 83% 82% 82% 82% 81% 81% 81%140,000 70% 76% 71% 70% 67% 65% 64% 62% 60% 57% 57% 55% 53% 51%150,000 70% 76% 59% 55% 50% 46% 43% 40% 36% 33% 31% 30% 27% 24%
F 2015 2016 2017 2018 2019 2020 2021 2022 2023 2024 2025 2026 2027 20280.75*FMSY 70% 76% 85% 85% 86% 87% 87% 87% 88% 88% 88% 88% 88% 89%0.80*FMSY 70% 76% 85% 84% 84% 83% 83% 83% 83% 83% 83% 83% 82% 82%0.85*FMSY 70% 76% 76% 76% 76% 76% 76% 75% 75% 75% 75% 75% 75% 74%0.90*FMSY 70% 76% 67% 67% 67% 67% 67% 67% 67% 67% 67% 67% 67% 67%0.95*FMSY 70% 76% 58% 58% 58% 58% 58% 58% 58% 58% 58% 58% 58% 58%1.00*FMSY 70% 76% 48% 48% 48% 48% 48% 48% 48% 48% 48% 48% 48% 48%

461
Table 8. Kobe II risk matrix (probability of not exceeding MSY level) based on ASPIC results for yellowfin tuna. (continued) 1_Fox_eq Probability B>BMSY Catch (t) 2015 2016 2017 2018 2019 2020 2021 2022 2023 2024 2025 2026 2027 2028 2029
70,000 53% 65% 73% 89% 97% 100% 100% 100% 100% 100% 100% 100% 100% 100% 100%80,000 53% 65% 73% 87% 96% 99% 100% 100% 100% 100% 100% 100% 100% 100% 100%90,000 53% 65% 73% 84% 92% 97% 99% 100% 100% 100% 100% 100% 100% 100% 100%
100,000 53% 65% 73% 82% 89% 94% 97% 99% 100% 100% 100% 100% 100% 100% 100%110,000 53% 65% 73% 78% 84% 88% 91% 94% 97% 98% 99% 100% 100% 100% 100%120,000 53% 65% 73% 75% 77% 79% 81% 83% 85% 87% 88% 90% 92% 92% 93%130,000 53% 65% 73% 72% 71% 70% 69% 68% 66% 64% 63% 61% 59% 57% 56%140,000 53% 65% 73% 69% 64% 60% 53% 47% 41% 36% 30% 27% 22% 18% 15%150,000 53% 65% 73% 66% 57% 47% 39% 28% 22% 17% 13% 10% 7% 6% 5%
F 2015 2016 2017 2018 2019 2020 2021 2022 2023 2024 2025 2026 2027 2028 20290.75*FMSY 53% 65% 73% 79% 84% 87% 90% 91% 93% 94% 94% 94% 94% 94% 95%0.80*FMSY 53% 65% 73% 78% 80% 83% 85% 87% 88% 89% 89% 90% 90% 91% 91%0.85*FMSY 53% 65% 73% 75% 77% 78% 79% 80% 81% 82% 82% 82% 83% 83% 83%0.90*FMSY 53% 65% 73% 73% 73% 73% 73% 73% 73% 73% 73% 73% 73% 73% 73%0.95*FMSY 53% 65% 73% 71% 71% 69% 69% 67% 66% 66% 65% 65% 64% 64% 64%1.00*FMSY 53% 65% 73% 70% 67% 64% 62% 60% 57% 55% 54% 54% 52% 51% 51% 1_Fox_ eq Probability F<FMSY Catch (t) 2015 2016 2017 2018 2019 2020 2021 2022 2023 2024 2025 2026 2027 2028
70,000 98% 99% 100% 100% 100% 100% 100% 100% 100% 100% 100% 100% 100% 100%80,000 98% 99% 100% 100% 100% 100% 100% 100% 100% 100% 100% 100% 100% 100%90,000 98% 99% 100% 100% 100% 100% 100% 100% 100% 100% 100% 100% 100% 100%
100,000 98% 99% 100% 100% 100% 100% 100% 100% 100% 100% 100% 100% 100% 100%110,000 98% 99% 96% 98% 99% 100% 100% 100% 100% 100% 100% 100% 100% 100%120,000 98% 99% 85% 87% 89% 90% 91% 93% 94% 95% 96% 97% 98% 98%130,000 98% 99% 65% 64% 63% 61% 59% 57% 55% 53% 51% 48% 46% 44%140,000 98% 99% 41% 37% 30% 26% 22% 19% 16% 14% 12% 10% 9% 7%150,000 98% 99% 23% 17% 14% 11% 8% 7% 5% 5% 4% 2% 2% 1%
F 2015 2016 2017 2018 2019 2020 2021 2022 2023 2024 2025 2026 2027 20280.75*FMSY 98% 99% 96% 96% 96% 96% 96% 96% 96% 96% 96% 96% 96% 96%0.80*FMSY 98% 99% 91% 91% 91% 91% 91% 91% 91% 91% 91% 91% 91% 91%0.85*FMSY 98% 99% 83% 83% 83% 83% 83% 83% 83% 83% 83% 83% 83% 83%0.90*FMSY 98% 99% 73% 73% 73% 73% 73% 73% 73% 73% 73% 73% 73% 73%0.95*FMSY 98% 99% 63% 63% 63% 63% 63% 63% 63% 63% 63% 63% 63% 63%1.00*FMSY 98% 99% 48% 48% 48% 48% 48% 48% 48% 48% 48% 48% 48% 48% 1_Fox_ eq Probability green zone of Kobe plot Catch (t) 2015 2016 2017 2018 2019 2020 2021 2022 2023 2024 2025 2026 2027 2028
70,000 53% 65% 73% 89% 97% 100% 100% 100% 100% 100% 100% 100% 100% 100%80,000 53% 65% 73% 87% 96% 99% 100% 100% 100% 100% 100% 100% 100% 100%90,000 53% 65% 73% 84% 92% 97% 99% 100% 100% 100% 100% 100% 100% 100%
100,000 53% 65% 73% 82% 89% 94% 97% 99% 100% 100% 100% 100% 100% 100%110,000 53% 65% 73% 78% 84% 88% 91% 94% 97% 98% 99% 100% 100% 100%120,000 53% 65% 73% 75% 77% 79% 81% 83% 85% 87% 88% 90% 92% 92%130,000 53% 65% 65% 64% 63% 61% 59% 57% 55% 53% 51% 48% 46% 44%140,000 53% 65% 41% 37% 30% 26% 22% 19% 16% 14% 12% 10% 9% 7%150,000 53% 65% 23% 17% 14% 11% 8% 7% 5% 5% 4% 2% 2% 1%
F 2015 2016 2017 2018 2019 2020 2021 2022 2023 2024 2025 2026 2027 20280.75*FMSY 53% 65% 73% 79% 84% 87% 90% 91% 93% 94% 94% 94% 94% 94%0.80*FMSY 53% 65% 73% 78% 80% 83% 85% 87% 88% 89% 89% 90% 90% 91%0.85*FMSY 53% 65% 73% 75% 77% 78% 79% 80% 81% 82% 82% 82% 83% 83%0.90*FMSY 53% 65% 72% 72% 72% 72% 72% 72% 72% 72% 72% 72% 72% 72%0.95*FMSY 53% 65% 63% 63% 63% 63% 63% 62% 62% 62% 62% 62% 61% 61%1.00*FMSY 53% 65% 48% 48% 48% 48% 48% 48% 48% 48% 47% 47% 47% 47%

462
Table 8. Kobe II risk matrix (probability of not exceeding MSY level) based on ASPIC results for yellowfin tuna. (continued) 1_Fox_cw Probability B>BMSY Catch (t) 2015 2016 2017 2018 2019 2020 2021 2022 2023 2024 2025 2026 2027 2028 2029
70,000 96% 99% 100% 100% 100% 100% 100% 100% 100% 100% 100% 100% 100% 100% 100%80,000 96% 99% 100% 100% 100% 100% 100% 100% 100% 100% 100% 100% 100% 100% 100%90,000 96% 99% 100% 100% 100% 100% 100% 100% 100% 100% 100% 100% 100% 100% 100%
100,000 96% 99% 100% 100% 100% 100% 100% 100% 100% 100% 100% 100% 100% 100% 100%110,000 96% 99% 100% 100% 100% 100% 100% 100% 100% 100% 100% 100% 100% 100% 100%120,000 96% 99% 100% 100% 100% 100% 100% 100% 100% 100% 100% 100% 100% 100% 100%130,000 96% 99% 100% 100% 100% 100% 100% 100% 100% 100% 100% 99% 99% 99% 99%140,000 96% 99% 100% 100% 99% 98% 97% 96% 95% 94% 93% 91% 87% 85% 82%150,000 96% 99% 100% 99% 98% 96% 94% 91% 85% 80% 76% 68% 62% 56% 52%
F 2015 2016 2017 2018 2019 2020 2021 2022 2023 2024 2025 2026 2027 2028 20290.75*FMSY 96% 99% 100% 100% 99% 99% 98% 98% 98% 97% 97% 97% 97% 97% 97%0.80*FMSY 96% 99% 100% 99% 98% 97% 97% 96% 95% 95% 94% 94% 94% 93% 93%0.85*FMSY 96% 99% 100% 99% 97% 96% 94% 93% 92% 91% 89% 87% 86% 86% 85%0.90*FMSY 96% 99% 100% 98% 96% 94% 92% 88% 85% 83% 82% 80% 78% 77% 77%0.95*FMSY 96% 99% 100% 98% 94% 92% 86% 82% 79% 76% 73% 71% 69% 67% 66%1.00*FMSY 96% 99% 100% 97% 93% 87% 81% 77% 72% 67% 64% 61% 58% 56% 56% 1_Fox_ cw Probability F<FMSY Catch (t) 2015 2016 2017 2018 2019 2020 2021 2022 2023 2024 2025 2026 2027 2028
70,000 100% 100% 100% 100% 100% 100% 100% 100% 100% 100% 100% 100% 100% 100%80,000 100% 100% 100% 100% 100% 100% 100% 100% 100% 100% 100% 100% 100% 100%90,000 100% 100% 100% 100% 100% 100% 100% 100% 100% 100% 100% 100% 100% 100%
100,000 100% 100% 100% 100% 100% 100% 100% 100% 100% 100% 100% 100% 100% 100%110,000 100% 100% 100% 100% 100% 100% 100% 100% 100% 100% 100% 100% 100% 100%120,000 100% 100% 100% 100% 100% 100% 100% 100% 100% 100% 100% 100% 100% 100%130,000 100% 100% 100% 100% 100% 100% 100% 100% 100% 100% 100% 100% 100% 100%140,000 100% 100% 97% 96% 94% 93% 91% 88% 85% 81% 80% 77% 74% 70%150,000 100% 100% 90% 82% 78% 72% 65% 58% 52% 48% 45% 41% 35% 32%
F 2015 2016 2017 2018 2019 2020 2021 2022 2023 2024 2025 2026 2027 20280.75*FMSY 100% 100% 97% 97% 97% 97% 97% 97% 97% 97% 97% 97% 97% 97%0.80*FMSY 100% 100% 94% 94% 94% 94% 94% 94% 94% 94% 94% 94% 94% 94%0.85*FMSY 100% 100% 84% 84% 84% 84% 84% 84% 84% 84% 84% 84% 84% 84%0.90*FMSY 100% 100% 73% 73% 73% 73% 73% 73% 73% 73% 73% 73% 73% 73%0.95*FMSY 100% 100% 59% 59% 59% 59% 59% 59% 59% 59% 59% 59% 59% 59%1.00*FMSY 100% 100% 49% 49% 49% 49% 49% 49% 49% 49% 49% 49% 49% 49% 1_Fox_ cw Probability green zone of Kobe plot Catch (t) 2015 2016 2017 2018 2019 2020 2021 2022 2023 2024 2025 2026 2027 2028
70,000 96% 99% 100% 100% 100% 100% 100% 100% 100% 100% 100% 100% 100% 100%80,000 96% 99% 100% 100% 100% 100% 100% 100% 100% 100% 100% 100% 100% 100%90,000 96% 99% 100% 100% 100% 100% 100% 100% 100% 100% 100% 100% 100% 100%
100,000 96% 99% 100% 100% 100% 100% 100% 100% 100% 100% 100% 100% 100% 100%110,000 96% 99% 100% 100% 100% 100% 100% 100% 100% 100% 100% 100% 100% 100%120,000 96% 99% 100% 100% 100% 100% 100% 100% 100% 100% 100% 100% 100% 100%130,000 96% 99% 100% 100% 100% 100% 100% 100% 100% 100% 100% 99% 99% 99%140,000 96% 99% 97% 96% 94% 93% 91% 88% 85% 81% 80% 77% 74% 70%150,000 96% 99% 90% 82% 78% 72% 65% 58% 52% 48% 45% 41% 35% 32%
F 2015 2016 2017 2018 2019 2020 2021 2022 2023 2024 2025 2026 2027 20280.75*FMSY 96% 99% 97% 97% 97% 97% 97% 97% 97% 97% 97% 97% 97% 97%0.80*FMSY 96% 99% 94% 94% 94% 94% 94% 94% 94% 94% 94% 94% 94% 93%0.85*FMSY 96% 99% 84% 84% 84% 84% 84% 84% 84% 84% 84% 84% 84% 84%0.90*FMSY 96% 99% 73% 73% 73% 73% 73% 73% 73% 73% 73% 73% 73% 73%0.95*FMSY 96% 99% 59% 59% 59% 59% 59% 59% 59% 59% 59% 59% 59% 59%1.00*FMSY 96% 99% 49% 49% 49% 49% 49% 49% 49% 49% 49% 49% 49% 49%
463
Figure 1. Annual trend of catch amount by fleet for ASPIC models for the Atlantic Ocean yellowfin tuna.
Figure 2. Annual trend of standardized CPUE included in the ASPIC models for the Atlantic Ocean yellowfin tuna.
464
Figure 3. CPUE fit for ASPIC Cluster 1 equal weighted logistic model.
465
Figure 4. Trajectories of B-ratio (B/BMSY) and F-ratio (F/FMSY) with 80% confidence limits (dashed lines) for ASPIC runs.

466
Figure 4. Trajectories of B-ratio (B/BMSY) and F-ratio (F/FMSY) with 80% confidence limits (dashed lines) for ASPIC runs. (continued)

467
Figure 5. Kobe I plot for 4 ASPIC runs.

468
Figure 6. Future projection of B-ratio (B/BMSY), F-ratio (F/FMSY) and predicted yield for one ASPIC run under constant catch or constant F.

469
Figure 6. Future projection of B-ratio (B/BMSY), F-ratio (F/FMSY) and predicted yield for one ASPIC run under constant catch or constant F. (continued)

470
Figure 6. Future projection of B-ratio (B/BMSY), F-ratio (F/FMSY) and predicted yield for one ASPIC run under constant catch or constant F. (continued)
471
Figure 6. Future projection of B-ratio (B/BMSY), F-ratio (F/FMSY) and predicted yield for one ASPIC run under constant catch or constant F. (continued)

472
Figure 7. Results of sensitivity analyses for ASPIC model one scenario for yellowfin tuna.

473
Figure 8. Results of retrospective analyses for ASPIC model for yellowfin tuna.

474
Figure 8. Results of retrospective analyses for ASPIC model for yellowfin tuna. (continued)