STIs in Central Ohio: Local, State & National Trends
25
STIs in Central Ohio: Local, State & National Trends April 17, 2019 Mysheika W. Roberts, MD, MPH Health Commissioner • Columbus Public Health @DrMRoberts
Transcript of STIs in Central Ohio: Local, State & National Trends
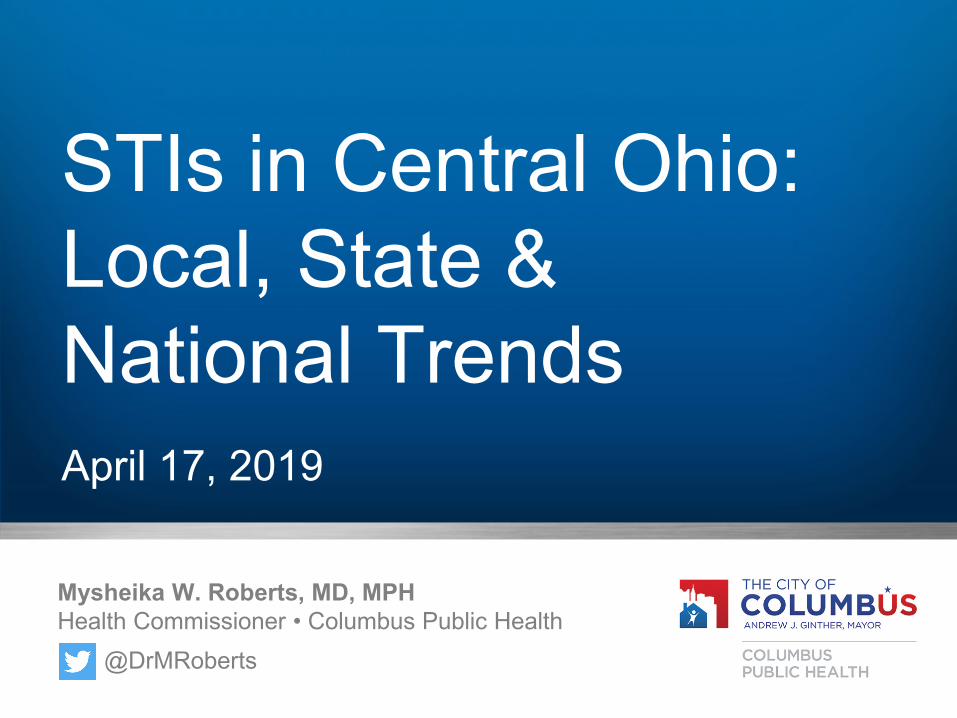
STIs in Central Ohio: Local, State & National TrendsApril 17, 2019
Mysheika W. Roberts, MD, MPHHealth Commissioner • Columbus Public Health
@DrMRoberts

City of Columbus • Columbus Public Health
STIs in the U.S.
• Almost 2.3 million cases of chlamydia, gonorrhea and syphilis (primary and secondary) were reported to the CDC in 2017.
Chlamydia Gonorrhea Syphilis2017:
528.8 per 100,0002017:
171.9 per 100,0002017:
9.5 per 100,000
6.9% increase from 2016
18.6% increase from 2016
10.5% increase from 2016

City of Columbus • Columbus Public Health
ChlamydiaFranklin County, 2018
10,178 cases (787.8 per 100,000)
• Young people (15-24) had the highest reported chlamydia rates.Age
• African Americans had 6.0 times higher reported chlamydia rates than whites. Race
• Females had 1.6 times higher reported chlamydia rates than males.Sex

City of Columbus • Columbus Public Health
Chlamydia by AgeFranklin County, 2018; N=10,178
<151%
15-1927%
20-2436%
25-2919%
30-348%
35-394%
40-442%
45+3%
<1515-1920-2425-2930-3435-3940-4445+
Over 60% of reported chlamydia infections occur among those aged 15-24 years old.
City of Columbus • Columbus Public Health
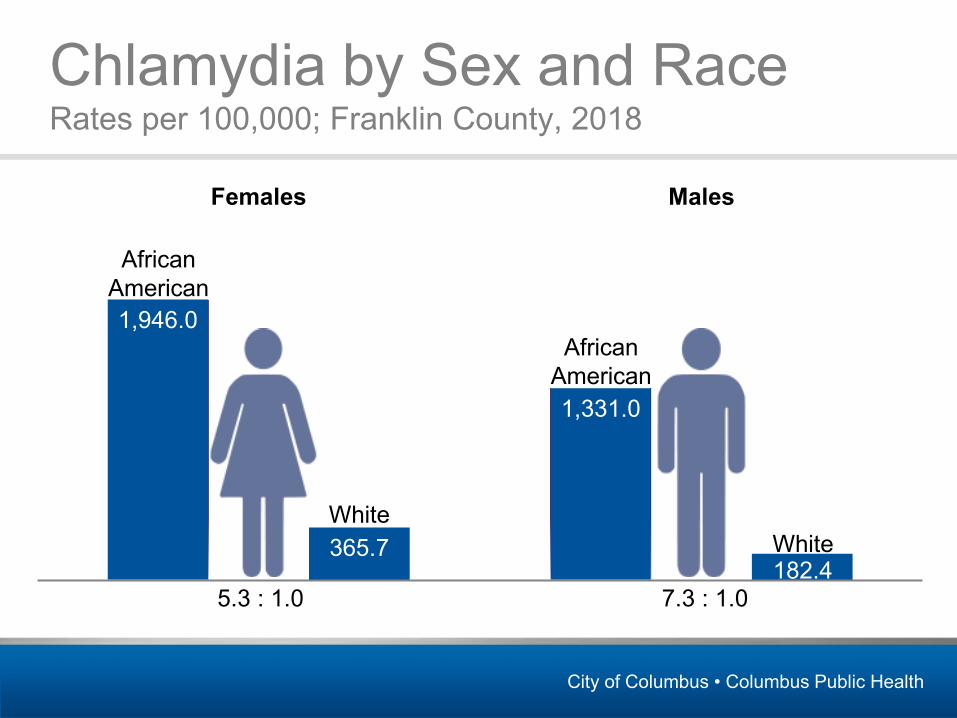
Chlamydia by Sex and RaceRates per 100,000; Franklin County, 2018
1,946.0
1,331.0
365.7182.4
Females Males
African American
White
5.3 : 1.0 7.3 : 1.0
African American
White
City of Columbus • Columbus Public Health
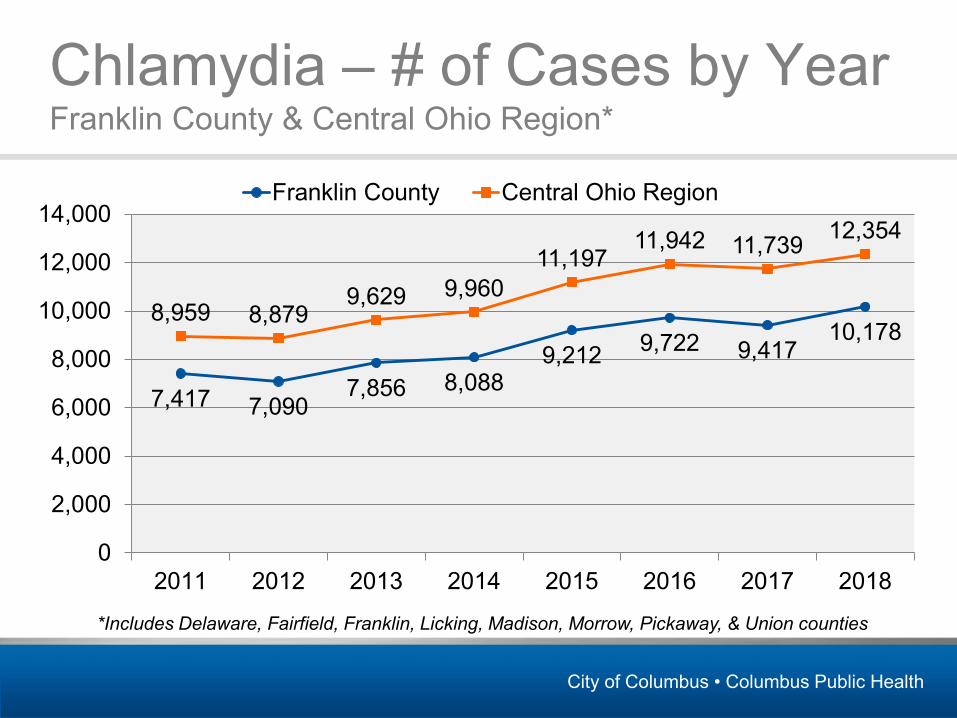
Chlamydia – # of Cases by YearFranklin County & Central Ohio Region*
7,417 7,0907,856 8,088
9,212 9,722 9,41710,178
8,959 8,8799,629 9,960
11,19711,942 11,739 12,354
0
2,000
4,000
6,000
8,000
10,000
12,000
14,000
2011 2012 2013 2014 2015 2016 2017 2018
Franklin County Central Ohio Region
*Includes Delaware, Fairfield, Franklin, Licking, Madison, Morrow, Pickaway, & Union counties
City of Columbus • Columbus Public Health
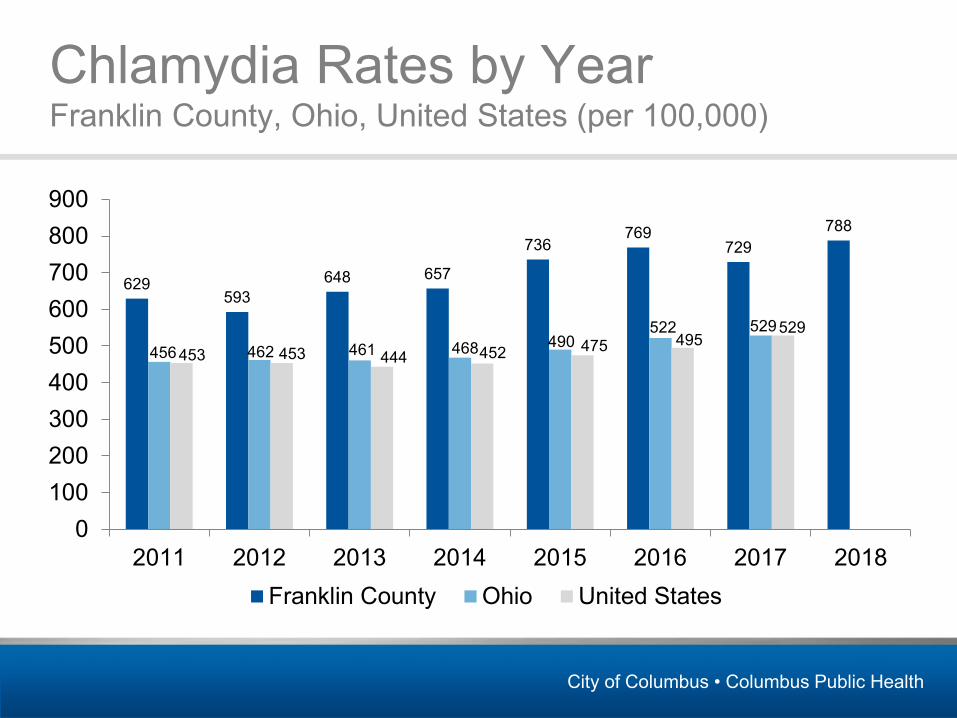
Chlamydia Rates by Year Franklin County, Ohio, United States (per 100,000)
629593
648 657
736769
729788
456 462 461 468 490522 529
453 453 444 452 475 495529
0100200300400500600700800900
2011 2012 2013 2014 2015 2016 2017 2018Franklin County Ohio United States
City of Columbus • Columbus Public Health
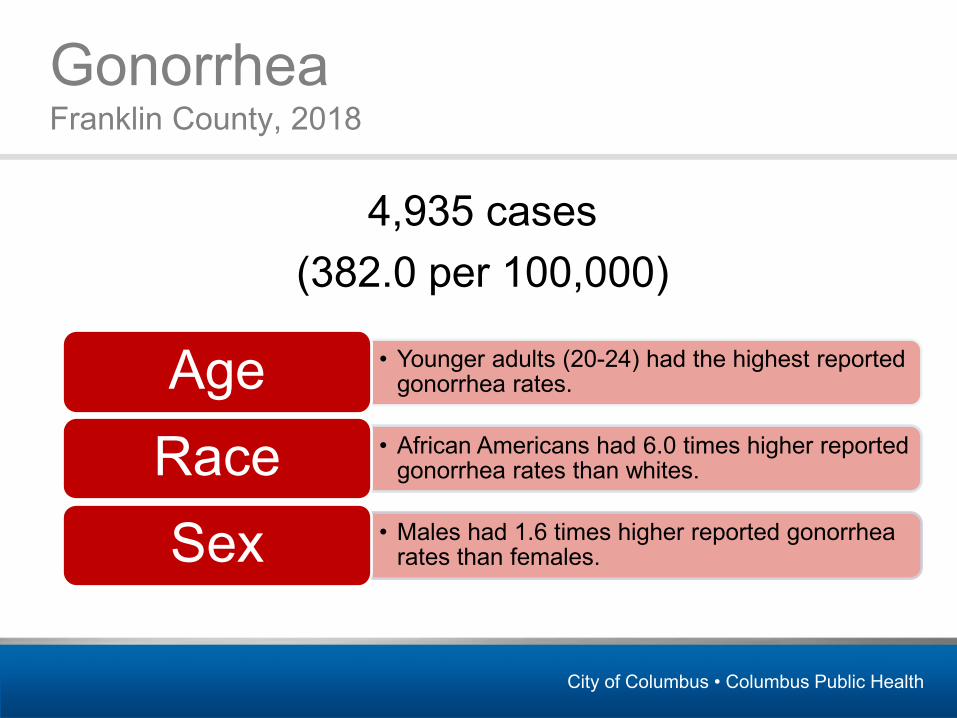
GonorrheaFranklin County, 2018
4,935 cases(382.0 per 100,000)
• Younger adults (20-24) had the highest reported gonorrhea rates.Age
• African Americans had 6.0 times higher reported gonorrhea rates than whites.Race
• Males had 1.6 times higher reported gonorrhea rates than females.Sex

City of Columbus • Columbus Public Health
Gonorrhea by AgeFranklin County, 2018; N=4,935
<151%
15-1913%
20-2424%
25-2923%
30-3413%
35-399%
40-446% 45+
11%<1515-1920-2425-2930-3435-3940-4445+
Nearly 50% of reported gonorrhea infections were among individuals aged 20-29 years old.

City of Columbus • Columbus Public Health
Gonorrhea by Sex and RaceRates per 100,000; Franklin County, 2018
664.6
1126.8
132.6 162.7
Females Males
African American
African American
White White
5.0 : 1.0 6.9 : 1.0
City of Columbus • Columbus Public Health
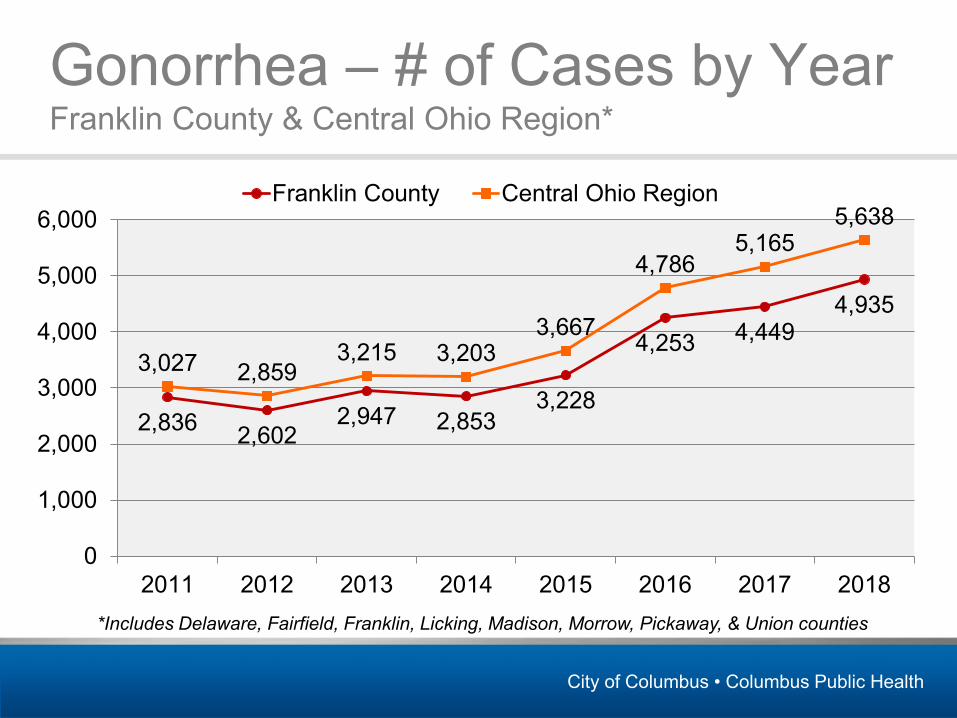
Gonorrhea – # of Cases by YearFranklin County & Central Ohio Region*
2,836 2,6022,947 2,853
3,228
4,253 4,4494,935
3,027 2,8593,215 3,203
3,667
4,7865,165
5,638
0
1,000
2,000
3,000
4,000
5,000
6,000
2011 2012 2013 2014 2015 2016 2017 2018
Franklin County Central Ohio Region
*Includes Delaware, Fairfield, Franklin, Licking, Madison, Morrow, Pickaway, & Union counties
City of Columbus • Columbus Public Health
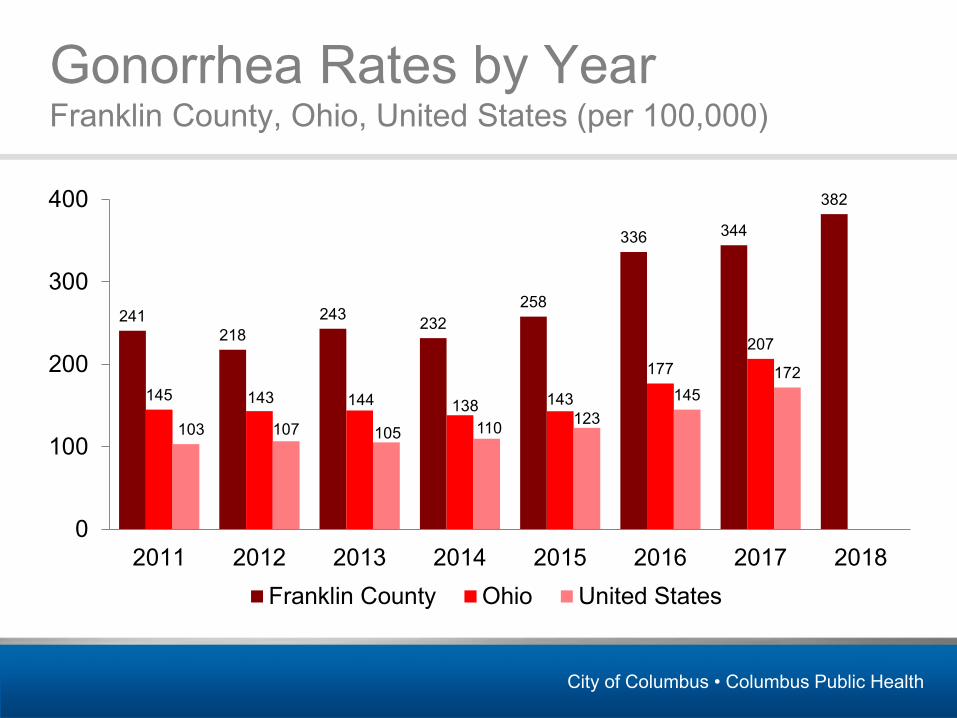
Gonorrhea Rates by Year Franklin County, Ohio, United States (per 100,000)
241218
243 232258
336 344
382
145 143 144 138 143
177207
103 107 105 110 123145
172
0
100
200
300
400
2011 2012 2013 2014 2015 2016 2017 2018Franklin County Ohio United States
City of Columbus • Columbus Public Health
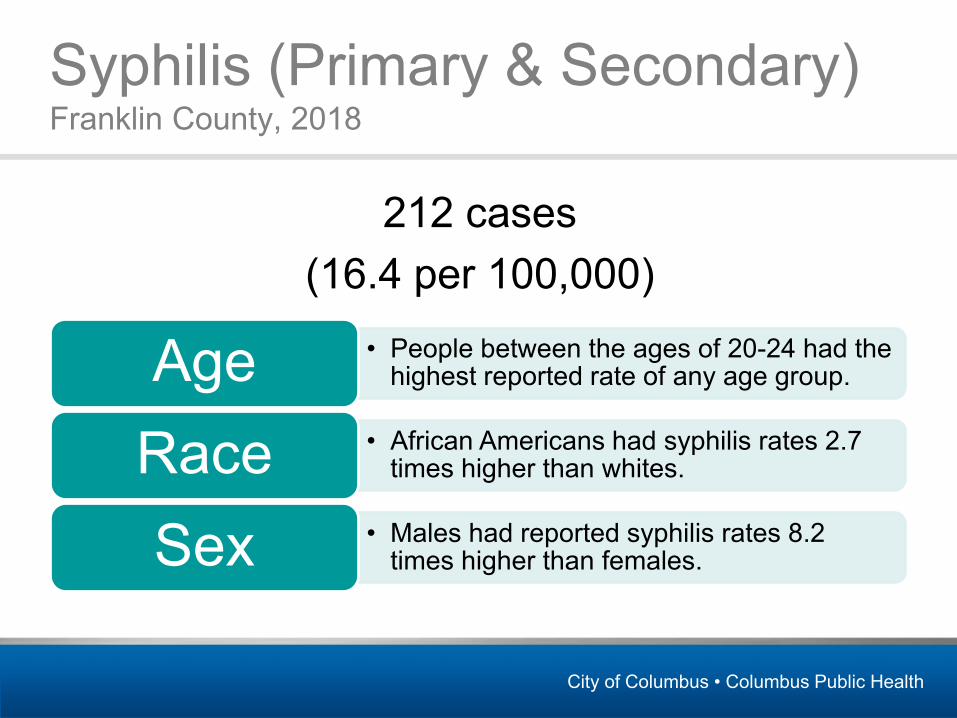
Syphilis (Primary & Secondary)Franklin County, 2018
212 cases (16.4 per 100,000)
• People between the ages of 20-24 had the highest reported rate of any age group.Age
• African Americans had syphilis rates 2.7 times higher than whites.Race
• Males had reported syphilis rates 8.2 times higher than females.Sex
City of Columbus • Columbus Public Health
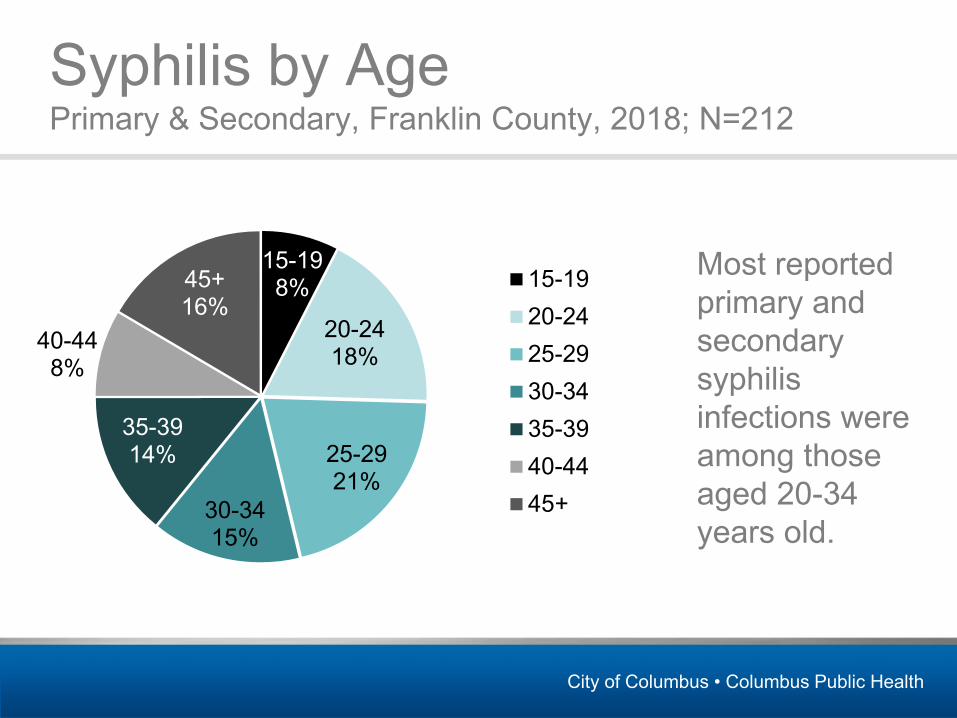
Syphilis by AgePrimary & Secondary, Franklin County, 2018; N=212
15-198%
20-2418%
25-2921%
30-3415%
35-3914%
40-448%
45+16%
15-1920-2425-2930-3435-3940-4445+
Most reported primary and secondary syphilis infections were among those aged 20-34 years old.
City of Columbus • Columbus Public Health
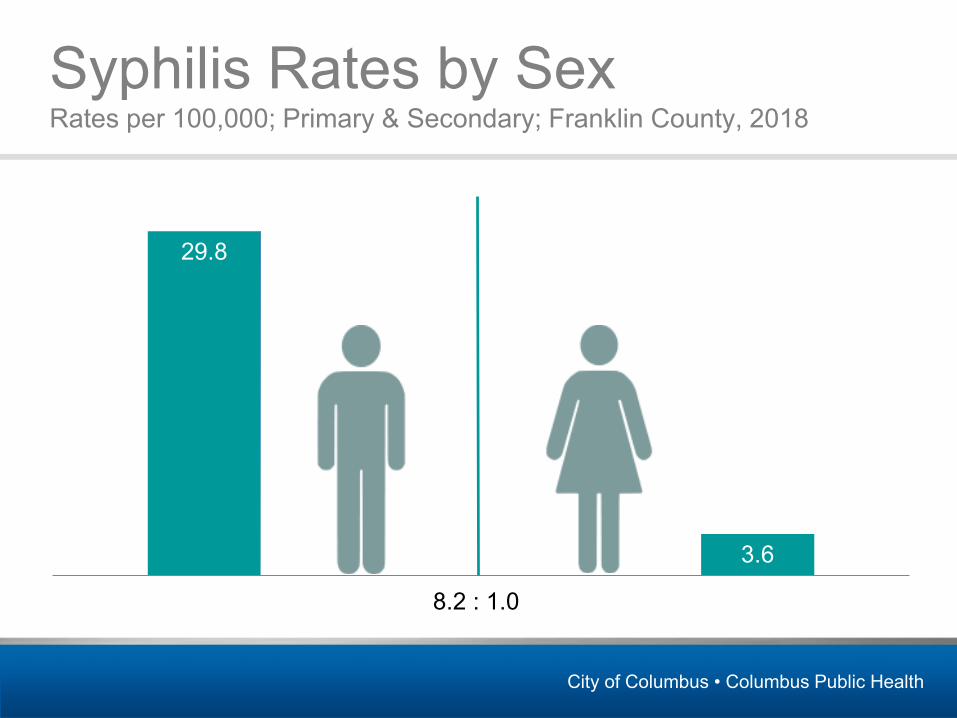
Syphilis Rates by Sex Rates per 100,000; Primary & Secondary; Franklin County, 2018
29.8
3.6
8.2 : 1.0
City of Columbus • Columbus Public Health
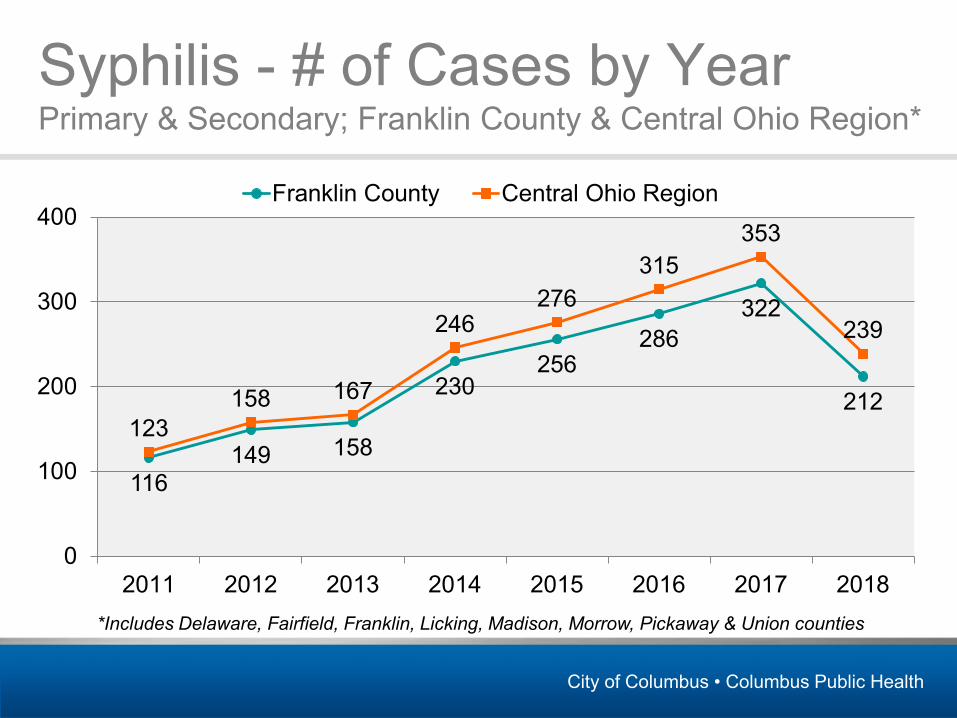
Syphilis - # of Cases by YearPrimary & Secondary; Franklin County & Central Ohio Region*
116149 158
230256
286322
212123
158 167
246276
315353
239
0
100
200
300
400
2011 2012 2013 2014 2015 2016 2017 2018
Franklin County Central Ohio Region
*Includes Delaware, Fairfield, Franklin, Licking, Madison, Morrow, Pickaway & Union counties
City of Columbus • Columbus Public Health
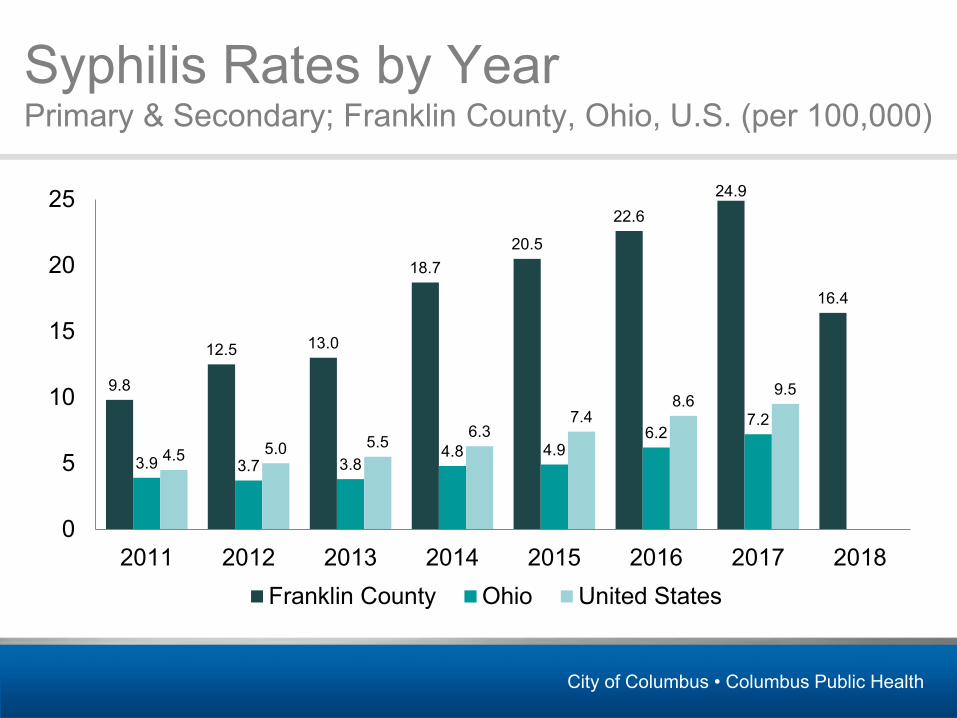
Syphilis Rates by Year Primary & Secondary; Franklin County, Ohio, U.S. (per 100,000)
9.8
12.5 13.0
18.720.5
22.624.9
16.4
3.9 3.7 3.84.8 4.9
6.27.2
4.5 5.0 5.5 6.37.4
8.69.5
0
5
10
15
20
25
2011 2012 2013 2014 2015 2016 2017 2018Franklin County Ohio United States

City of Columbus • Columbus Public Health
Congenital Syphilis (2018)
• 8 congenital syphilis cases in Central Ohio* 88% of babies were asymptomatic.
71% of mothers received prenatal care.
Most mothers had early or late latent stage syphilis.
*Includes Delaware, Fairfield, Franklin, Licking, Madison, Morrow, Pickaway & Union counties
City of Columbus • Columbus Public Health
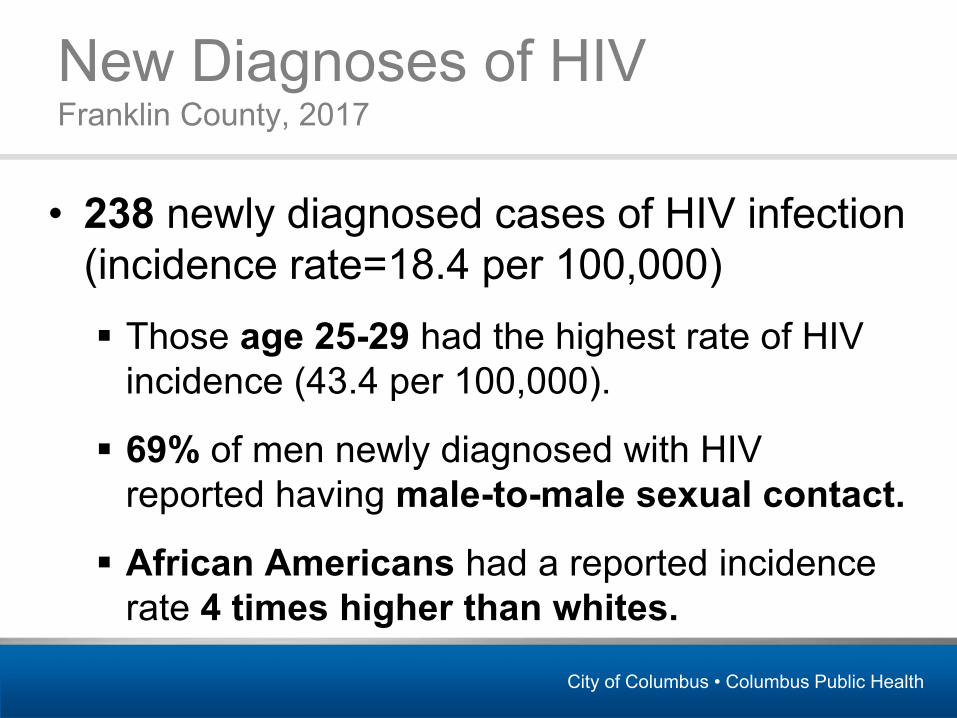
New Diagnoses of HIVFranklin County, 2017
• 238 newly diagnosed cases of HIV infection (incidence rate=18.4 per 100,000) Those age 25-29 had the highest rate of HIV
incidence (43.4 per 100,000).
69% of men newly diagnosed with HIV reported having male-to-male sexual contact.
African Americans had a reported incidence rate 4 times higher than whites.

City of Columbus • Columbus Public Health
New Diagnoses of HIVFranklin County, 2017; N=238
Females:IDU
3.8%Females:
Heterosexual contact18.1%
Females:Other/Unknown
1.3%
Males:MSM contact
49.6%
Males:IDU
3.4%
Males:MSM contact
& IDU3.4%
Males:Heterosexual
contact1.3%
Males:Other/Unknown
19.3%
By Sex of Case and Transmission Category*
*Transmission categories are mutually exclusive, hierarchical risk categories determined by the CDC and system calculated using sex at birth and risk factor history
City of Columbus • Columbus Public Health
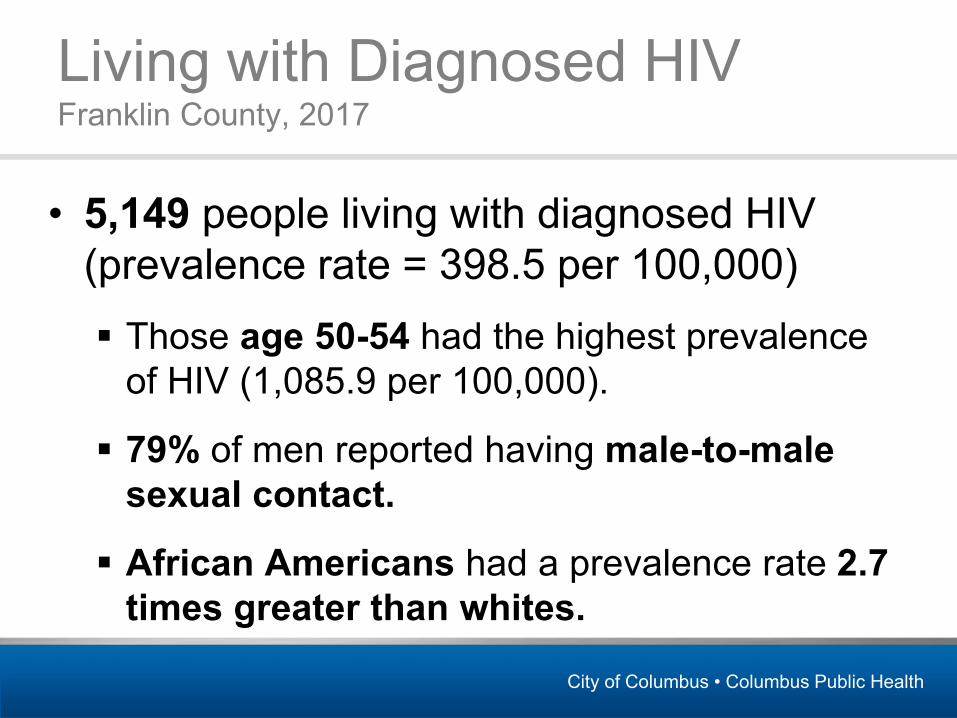
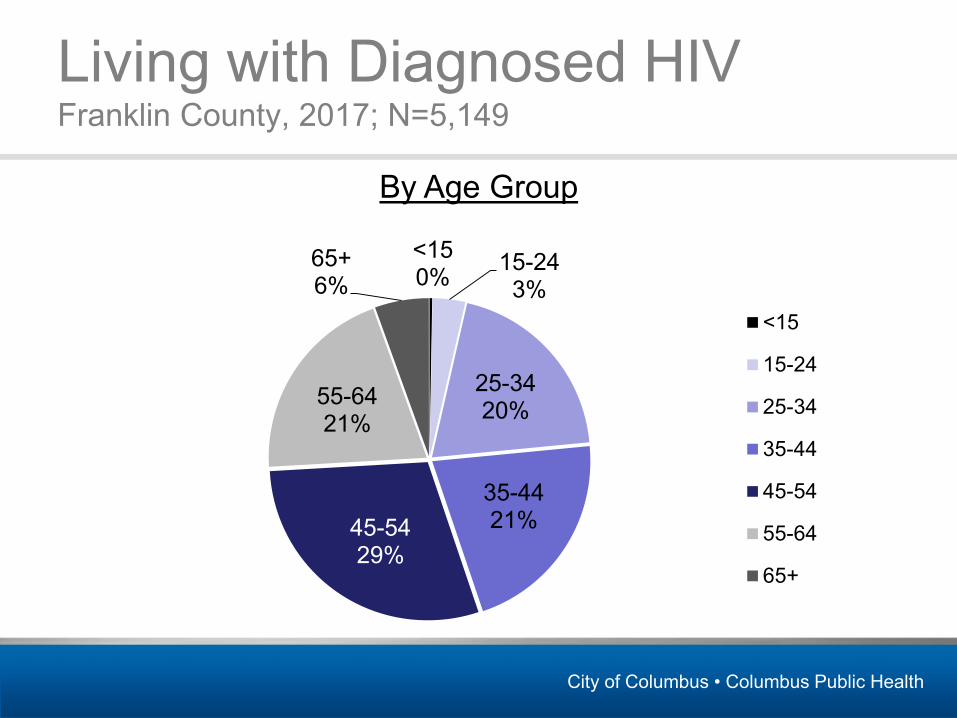
Living with Diagnosed HIVFranklin County, 2017
• 5,149 people living with diagnosed HIV (prevalence rate = 398.5 per 100,000) Those age 50-54 had the highest prevalence
of HIV (1,085.9 per 100,000).
79% of men reported having male-to-male sexual contact.
African Americans had a prevalence rate 2.7 times greater than whites.
City of Columbus • Columbus Public Health
Living with Diagnosed HIVFranklin County, 2017; N=5,149
<150% 15-24
3%
25-3420%
35-4421%45-54
29%
55-6421%
65+6%
<15
15-24
25-34
35-44
45-54
55-64
65+
By Age Group

City of Columbus • Columbus Public Health
Reported Persons Living with HIV# of Cases by Year; Franklin County & Central Ohio Region*
4,511 4,712 4,811 4,985 5,149
5,078 5,282 5,404 5,580 5,766
0
1,000
2,000
3,000
4,000
5,000
6,000
2013 2014 2015 2016 2017
Franklin County Central Ohio Region
*Includes Delaware, Fairfield, Franklin, Licking, Madison, Morrow, Pickaway & Union counties

City of Columbus • Columbus Public Health
Sources• Franklin County and Central Ohio Region Statistics:
– Chlamydia, gonorrhea and syphilis: Ohio Disease Reporting System, Analysis by Office of Epidemiology, Columbus Public Health. Data current as of March 31, 2019.
– HIV: Ohio Department of Health HIV/AIDS Surveillance Program. Data reported through June 30, 2018.
• Ohio Statistics:– Chlamydia, gonorrhea and syphilis: Ohio Department of Health STD Surveillance
Program, Bureau of Infectious Diseases. Data reported through May 24, 2018.– HIV: Ohio Department of Health HIV/AIDS Surveillance Program. Data reported
through June 30, 2018.
• National Statistics:– Centers for Disease Control and Prevention. Sexually Transmitted Disease
Surveillance 2017 (www.cdc.gov/std/stats) & HIV Surveillance Report 2017 (http://www.cdc.gov/hiv/library/reports/hiv-surveillance.html).

City of Columbus • Columbus Public Health
Questions?
Mysheika W. Roberts, MD, MPHHealth Commissioner • Columbus Public Health
@DrMRoberts