Real Estate Trends in Central Ohio - ULI...
34
Real Estate Trends in Central Ohio Presentation by Jung Kim | December 3, 2015
Transcript of Real Estate Trends in Central Ohio - ULI...
Real Estate Trends in Central Ohio
Presentation by Jung Kim | December 3, 2015

The National Picture: Highlights from ULI’s Emerging Trends in Real Estate

4.02 3.98
3.85 3.81 3.80
3.70 3.67 3.67 3.61 3.61 3.55 3.52
3.44
1.00 2.00 3.00 4.00 5.00
Real estate brokers Private real estate owners/developers
Institutional real estate owners/developers Real estate investment managers
Commercial builders Homebuilders/land developers
Architects/designers REITS
Insurance company RE lenders Real estate consultants
Commercial bank RE lenders CMBS lenders/issuers
Property managers
2016 2015 2014 2013 2012
Prospects by real estate industry Abysmal Fair Excellent

Top 10 issues for real estate in 2016 No
importance Moderate
importance Great
importance
4.56 4.13 4.10
4.03 3.95
3.83 3.78
3.57 3.53 3.51
1.00 2.00 3.00 4.00 5.00
Job growth Construction costs
Income and wage growth Land costs
Interest rates Infrastructure funding/development
Vacancy rates Transportation funding
Global economic growth Refinancing

Underwriting standards in 2016
DEBT
EQUITY
35.4% 45.7%
43.3% 19.6%
31.9% 29.8%
51.7% 44.7%
39.4% 41.5%
35.1% 29.2%
12.9% 9.6%
17.4% 39.1%
33.0% 41.0%
0% 10% 20% 30% 40% 50% 60% 70% 80% 90% 100%
2016 2015 2014 2013 2012 2011
Less rigorous Remain the same More rigorous
34.0% 41.4%
30.7% 19.6% 22.8%
26.6%
52.4% 47.5%
50.8% 50.7% 46.7% 40.6%
13.6% 11.1%
18.5% 29.7% 30.5%
32.8%
2016 2015 2014 2013 2012 2011
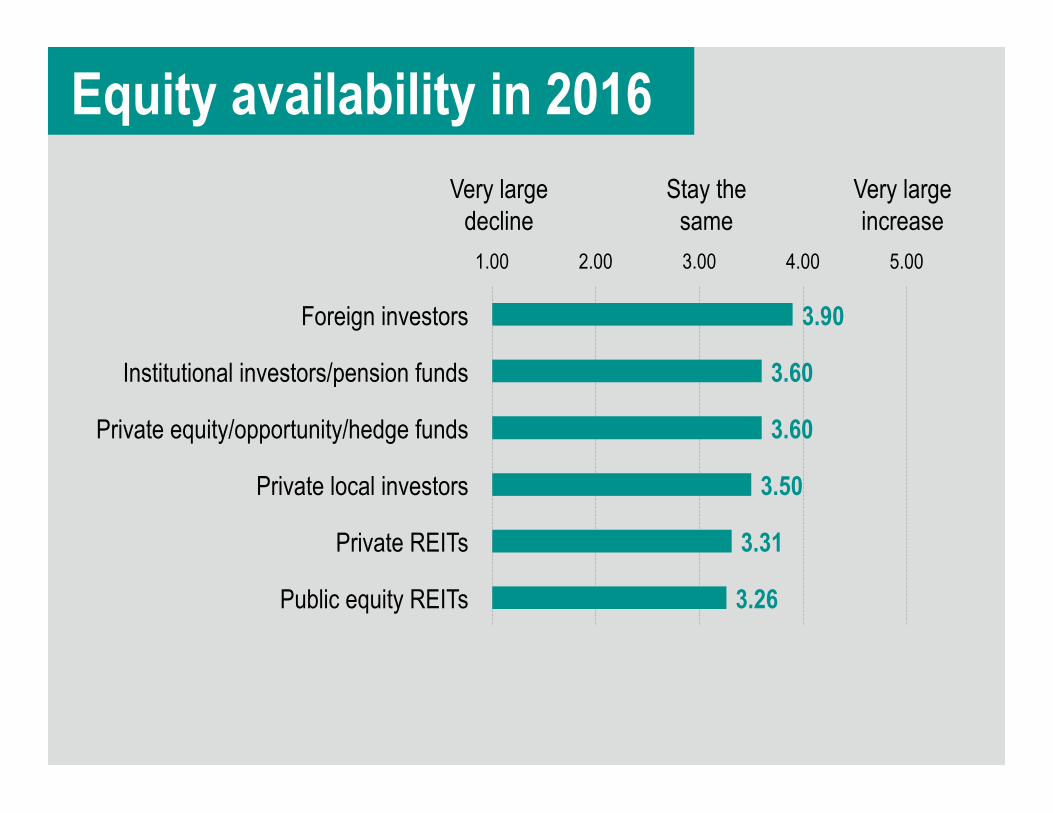
Equity availability in 2016 Very large
decline Stay the
same Very large increase
3.90
3.60
3.60
3.50
3.31
3.26
1.00 2.00 3.00 4.00 5.00
Foreign investors
Institutional investors/pension funds
Private equity/opportunity/hedge funds
Private local investors
Private REITs
Public equity REITs

Debt availability in 2016 Very large
decline Stay the
same Very large increase
3.65
3.59
3.58
3.48
3.44
3.33
2.91
1.00 2.00 3.00 4.00 5.00
Securitized lenders/CMBS
Nonbank financial institutions
Mezzanine lenders
Insurance companies
Commercial banks
Mortgage REITs
Government-sponsored enterprises

Real estate capital market balance
38% 44%
48% 46%
14% 11%
2015 2016
Oversupplied In balance Undersupplied
14%
35%
56%
55%
30%
10%
2015
2016
20%
25%
51%
52%
30%
23%
2015
2016
55%
64%
33%
29%
12%
8%
2015
2016
Debt capital for acquisitions Debt capital for refinancing Debt capital for development Equity capital for investing

Next stop: the suburbs?
Cities 46%
Cities 37%
Suburbs 24%
Suburbs 29%
Rural/small towns 30%
Rural/small towns 32%
Current
Desired
Millennials current and desired location
Big city 46%
Big city 61%
Medium-sized city 54%
Medium-sized city 39%
Current
Desired
Suburbs <20 min. 70%
Suburbs <20 min. 76%
Suburbs >20 min. 30%
Suburbs >20 min. 24%
Current
Desired
The Local Picture: Real Estate Trends in Central Ohio

Respondents by field
Private Developer
32%
Builder 3%
Lender 8% Institutional
Investor 8%
Brokerage 3%
Professional Service Firm
30%
Government 8%
University 3%
Other 5%

Respondents by title
Owner 32%
President/CEO 13%
EVP/COO/CFO 10%
Vice President 8%
Director/ Manager
26%
Associate 8%
Other 3%

Respondents by sector
64% 58%
47% 28% 28%
25% 25%
22%
0% 20% 40% 60% 80% 100%
Residential - rental
Office
Retail
Residential - for sale
Industrial/distribution
Hospitality
Niche/alternative
Institutional/public

Expected profitability of own business
Excellent
Good
Fair
Poor
Abysmal
Excellent Good Fair Poor Abysmal
3.68 4.02 4.05
4.27 3.89 3.91 4.06
1.00
1.50
2.00
2.50
3.00
3.50
4.00
4.50
5.00
2013 2014 2015 2016
Expectations Actual

Expected profitability of own business
Excellent
Good
Fair
Poor
Abysmal
Excellent Good Fair Poor Abysmal
3.98 4.06 4.28 4.09 4.27 4.14
1.00
1.50
2.00
2.50
3.00
3.50
4.00
4.50
5.00
Cleveland Columbus Indiana
2015 2016

Central Ohio relative to other markets
3.30
3.42
3.75
3.50
3.30
3.30
3.46
3.46
3.39
3.42
3.22
3.21
3.09
3.29
3.42
3.23
3.27
3.43
3.22
3.09
3.26
3.54
3.58
3.35
1.00 2.00 3.00 4.00 5.00
REITs
Real estate investment management
Private local real estate owners
Commercial bank real estate lenders
CMBS lenders/issuers
Insurance company real estate lenders
Real estate brokers
Architects, designers
Real estate consultants
Commercial developers
Multifamily developers
Homebuilders/residential land developers
2016 2015
Much worse
Somewhat better
Much better
About the same
Somewhat worse

Central Ohio relative to other markets "Overall, Columbus is healthy and doing well compared to its peers."
"Columbus across the board is good. For industrial, we are top 5 in second tier markets in rent growth, absorption, and delivery."
Central Ohio compares “very, very favorably, especially with the technology industry."
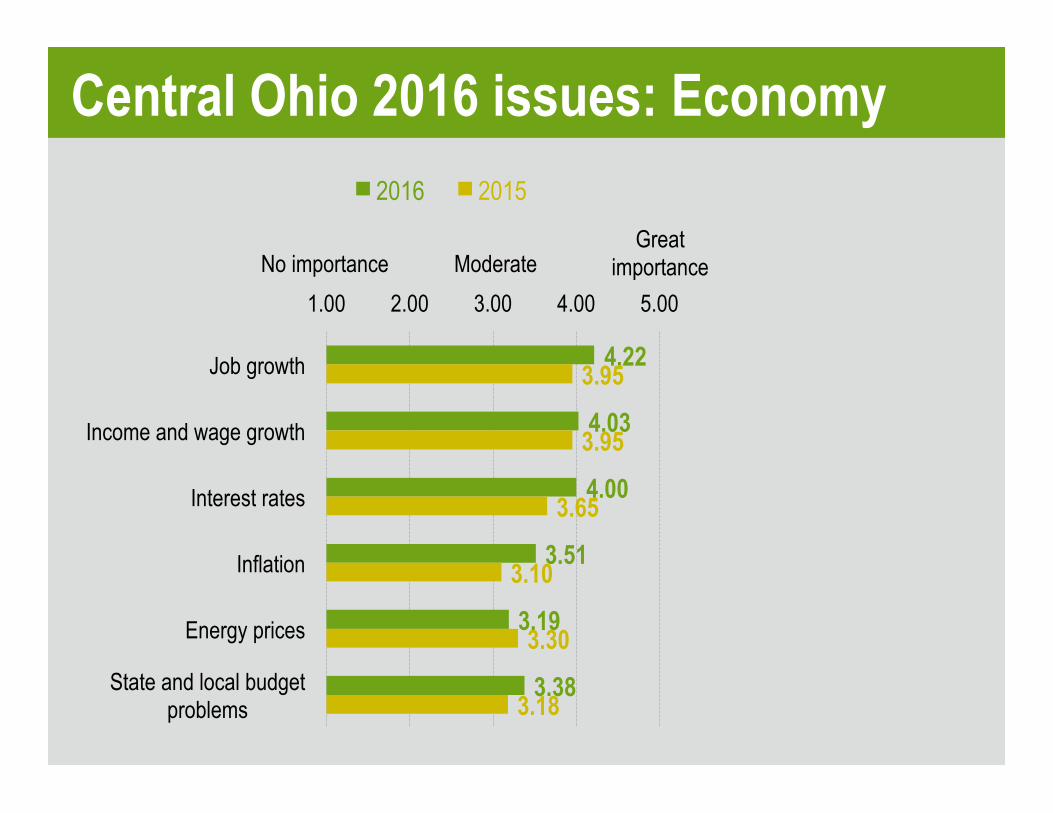
Central Ohio 2016 issues: Economy
Excellent
Good
Fair
Poor
Abysmal
4.22
4.03
4.00
3.51
3.19
3.38
3.95
3.95
3.65
3.10
3.30
3.18
1.00 2.00 3.00 4.00 5.00
Job growth
Income and wage growth
Interest rates
Inflation
Energy prices
State and local budget problems
2016 2015
No importance Great
importance Moderate
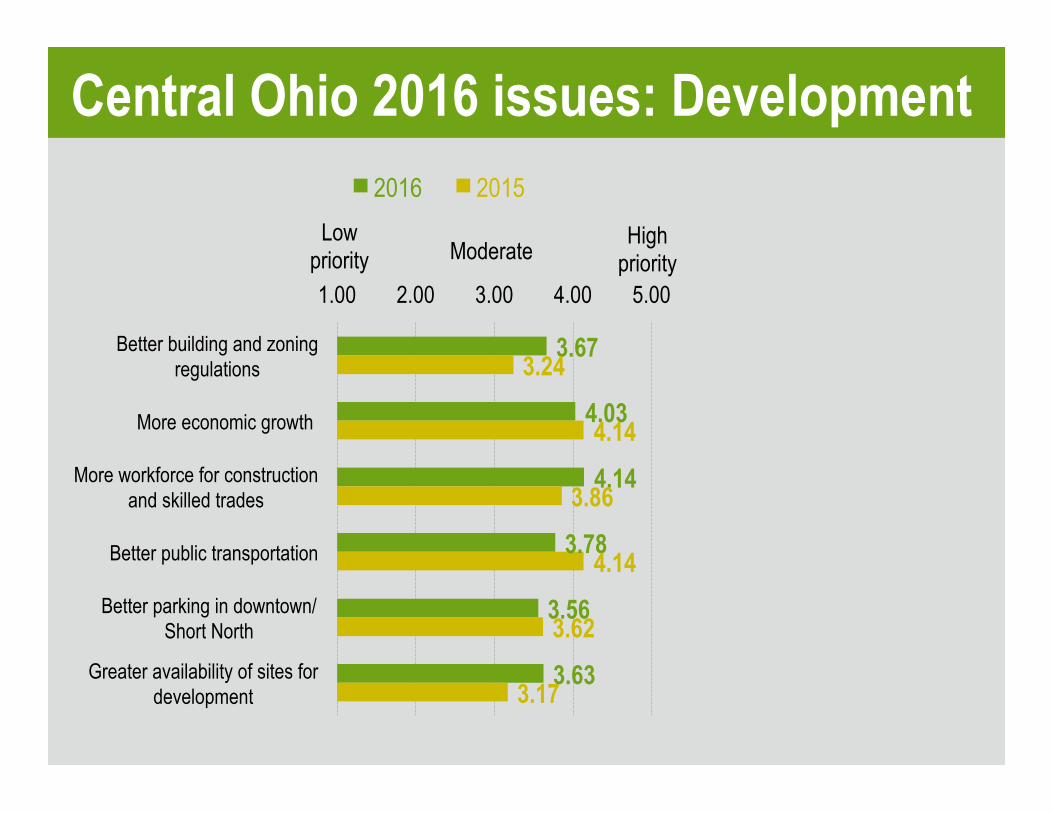
Central Ohio 2016 issues: Development
Excellent
Good
Fair
Poor
Abysmal
3.67
4.03
4.14
3.78
3.56
3.63
3.24
4.14
3.86
4.14
3.62
3.17
1.00 2.00 3.00 4.00 5.00
Better building and zoning regulations
More economic growth
More workforce for construction and skilled trades
Better public transportation
Better parking in downtown/Short North
Greater availability of sites for development
2016 2015 Low
priority High
priority Moderate

Central Ohio 2016 issues "Every sub trade has the same issue of finding qualified workforce."
"Material costs for the most part have stayed pretty level, but labor costs are going up quite a bit."
"Sites are going to be a challenge due to zoning regulations."
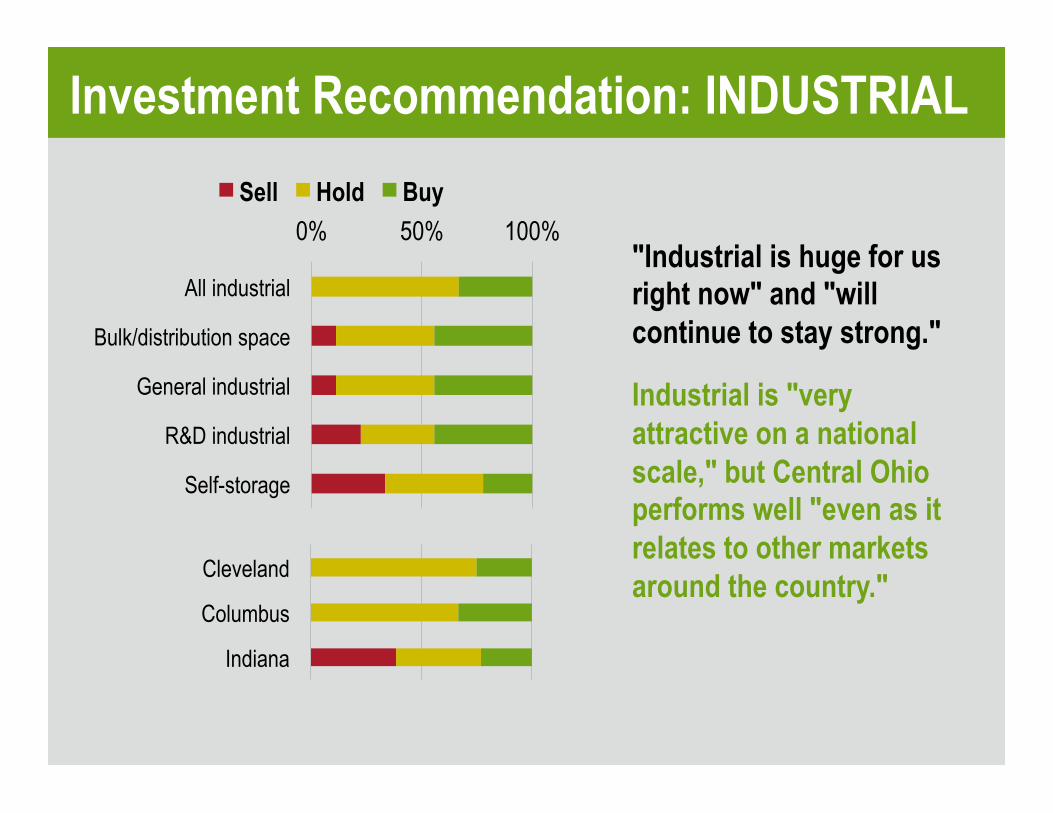
Investment Recommendation: INDUSTRIAL
"Industrial is huge for us right now" and "will continue to stay strong."
Industrial is "very attractive on a national scale," but Central Ohio performs well "even as it relates to other markets around the country."
0% 50% 100%
All industrial
Bulk/distribution space
General industrial
R&D industrial
Self-storage
Sell Hold Buy
Cleveland
Columbus
Indiana

Investment Recommendation: OFFICE
"The number of people per square foot has changed and are downsizing."
"Trend of people wanting to locate in an urban area for their workforce, more so than we have seen over the past 20 or 30 years."
0% 50% 100%
All office
CBD office
Suburban office
Medical office
Sell Hold Buy
Cleveland
Columbus
Indiana

Investment Recommendation: RETAIL
Development "very flat," but "financially, retail is very strong."
"Downsizing and consolidation of tenants caused by online distribution channels."
With omnichannel, stores are "trying to do more or the same in smaller spaces."
0% 50% 100%
All retail
Regional malls
Power centers
Neighborhood/community
Sell Hold Buy
Cleveland
Columbus
Indiana

Investment Recommendation: RENTAL
"I don't see anything on the horizon slowing the activity down."
"Multifamily might slow down a little bit, but the demand is still out there."
"There is a really strong push to downsize and want the quality of life downtown can provide."
0% 50% 100%
All apartments
Luxury apartments
Moderate apartments
Tax credit apartments
Student housing
Sell Hold Buy
Cleveland
Columbus
Indiana

"The market is hot for residential for sale." "Residential sales have been very good." "Land is getting tougher and tougher to find."
"I don’t think the for-sale model will be as frothy as the early 2000’s, but we are seeing a growing demand for buyers."
Investment Recommendation: FOR SALE

Interest rates
Fall Moderately 3%
Remain Stable 19%
Increase Moderately
75%
Increase Substantially
3%
Expected change next 3 years Response to rate rise
0% 20% 40% 60% 80% 100%
Obtain financing or refinancing now
Adjust portfolio
Reduce development activity
Scale back risk
Cleveland Columbus Indiana

"Certainly, interest rates have not gone up as soon as people thought they would, but hopefully it will happen in a thoughtful manner."
"Slight increases – 50 to 75 basis points." Financing strategies include "putting in hedges and interest rate caps and swaps" and "locking our rates for existing assets at sub-5% rates."
Interest rates

Capital availability
Oversupplied 18%
In Balance 55%
Undersupplied 24%
Substantially Undersupplied
3%
Availability through 2016 Expected change in availability
Some Increase 35%
No Change 56%
Some Decline 9%

"The banks have been more aggressive than they were even in 2013 and 2014, so that has freed up capital to get deals done."
"For every dollar of equity needed, there are $4 or $5 chasing deals."
"Blocking and tackling is more difficult" as investors "require evidence that there is a market for the projects they are financing."
Capital availability

Prospects for Central Ohio submarkets
Powell 3.80 (+0.03) Polaris
3.94 (+0.02)
Dublin 4.21 (+0.21)
New Albany 4.12 (-0.15)
UA/Grandview 4.27 (+0.39)
Downtown4.33 (+0.12)
Easton 4.26 (-0.11)
Hilliard 3.41 (-0.18)
Gahanna/CMH 3.66 (+0.22)
Cbus North 3.50 (-0.32)
Cbus West 2.72 (+0.22)
Cbus East 2.81 (+0.17)
Worthington 3.75 (+0.33)
Westerville 3.73 (+0.08)
Cbus South 2.44 (+0.12)
Reynoldsburg 2.91 (+0.26)
Groveport/Obetz 3.13 (-0.06)
Grove City 3.34 (+0.15)
North Delaware 3.50 (+0.08)
Union 3.34 (+0.06)
Madison 2.74 (-0.06)
Pickaway 2.70 (-0.10)
Licking 3.07 (+0.31)
Fairfield 3.07 (+0.23)
Color Score
5 = Excellent
4.0 to 4.5
4 = Good
3.5 to 4.0
3.0 to 3.5
3 = Fair
2.5 to 3.0
2.0 to 2.5
2 = Poor
1 = Abysmal

Prospects for Central Ohio submarkets "Downtown is at a place it’s probably never been. Tremendous amount of momentum and on its way to becoming a great neighborhood."
"Anything urban is hot."
"It will be interesting to see the willingness of further out suburban communities to urbanize."

Hot Topics: Housing Affordability To what extent do you agree or disagree with the following statements?
0% 20% 40% 60% 80% 100%
Development is in line with demographic trends and
market demand
There has been too much focus on high-end rental units
Much of the new rental product is too small to continue to be competitive in the market as
millennials age
Strongly disagree Disagree Neutral Agree Strongly agree "Vacancy rate downtown is pretty low, so I think the market is able to satisfy the creation of these luxury apartments."
"No better time to mix in affordable housing as you are doing larger scale developments."
"Affordable works, but only with subsidies. We need more focus on how to do that."

Hot Topics: Job Access Level of support for job access solutions
62%
53%
38%
More affordable housing near employment centers
Better COTA service
Employer contribution to transportation alternatives
"The New Albany Smart Ride program is up from seven people when we launched to 2,000 today…really needed for economic development."
"We have to come together with a real transportation plan."
"How we handle transit will have everything to do with the success of our city."

Five Takeaways for 2016 1. Great expectations: 2016 business prospects at highest score
ever in Real Estate Trends in Central Ohio.
2. O skilled tradesman, where art thou?: Workforce shortages a major pain point, leading to higher development costs and prices.
3. Doing more with less (space): Retail, office, and rental housing maximizing value with smaller spaces.
4. Fed said dovish, so did our survey: Small and gradual rises in interest rates.
5. Downtown takes the reins: Downtown Columbus ranks as top Central Ohio submarket for 2016.