
Steve R. Meyer, Ph.D. Vice-President, Pork Analysis EMI ... · Vice-President, Pork Analysis EMI...
33
Steve R. Meyer, Ph.D. Vice-President, Pork Analysis EMI Analytics
Transcript of Steve R. Meyer, Ph.D. Vice-President, Pork Analysis EMI ... · Vice-President, Pork Analysis EMI...

Steve R. Meyer, Ph.D.Vice-President, Pork AnalysisEMI Analytics

Key factors for 2016 . . . Lowest costs since 2007 – Good crops!
PEDv cases remainemuch like last year. PRRS?
HPAI – Indiana outbreak is controlled, other?
MCOOL is gone – what about imports?
Demand: Three good years but what now?
Pork industry productivity is surging
Exports with a still-strong U.S. dollar?
World competition?

Macro conditions continue positive, not robust Civilian unemployment dropped to 4.9%
U6 rate = 9.9%, steady since October
Q4 Real GDP growth slowed to 1.8% yr/yr, and 0.7% annualized qtr/qtr
January employment was +151k, follows 3 months of >260k, +2.735 million for ‘15
Oil near $30: Bad for some but good for more!
Higher (barely!) interest rates but has the Fed over-played even that small increase?

Meat/poultry demand has been on a GREAT run!. . . Nov & Dec: -2.9% & -3.8% yr/yr but ‘15 was +5.7%

Meat/poultry consumption has grown but . . . . . . Remains ~4.5% lower than 2006 peak
Source: USDA data, compiled by Livestock Marketing Information Center
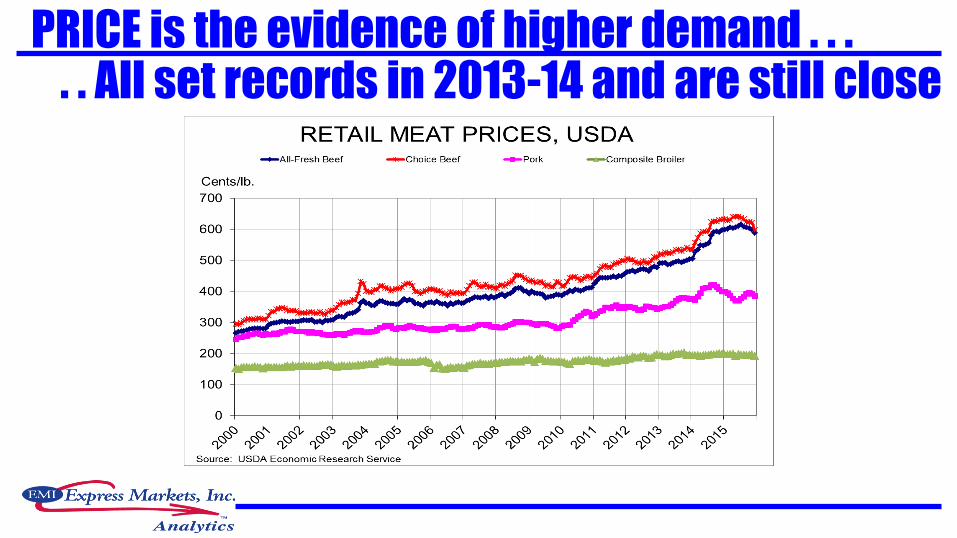
PRICE is the evidence of higher demand . . . . . All set records in 2013-14 and are still close

All species up for ‘15 – but slowed late in year

COSTS OF PRODUCTION

0
50
100
150
200
250
300
2005 2006 2007 2008 2009 2010 2011 2012 2013 2014 2015 2016
Mil
lio
n M
etr
ic T
on
s
World Coarse Grain Stocks
China United States Argentina Brazil EU 27 Other
“Comfortable” world stocks have been restored

Corn basically in the $3.50-$4.00 range thru ‘17

0
50
100
150
200
250
300
1980 1985 1990 1995 2000 2005 2010 2015
Mill
ion
Met
ric
Ton
s
World Soybean Production Source: USDA
US Brazil Argentina China ROW
2015 Forward Forecast
Record world SB output in ‘14 and ’15, down in ‘16

Sharply lower SBM prices – good for birds, pigs!
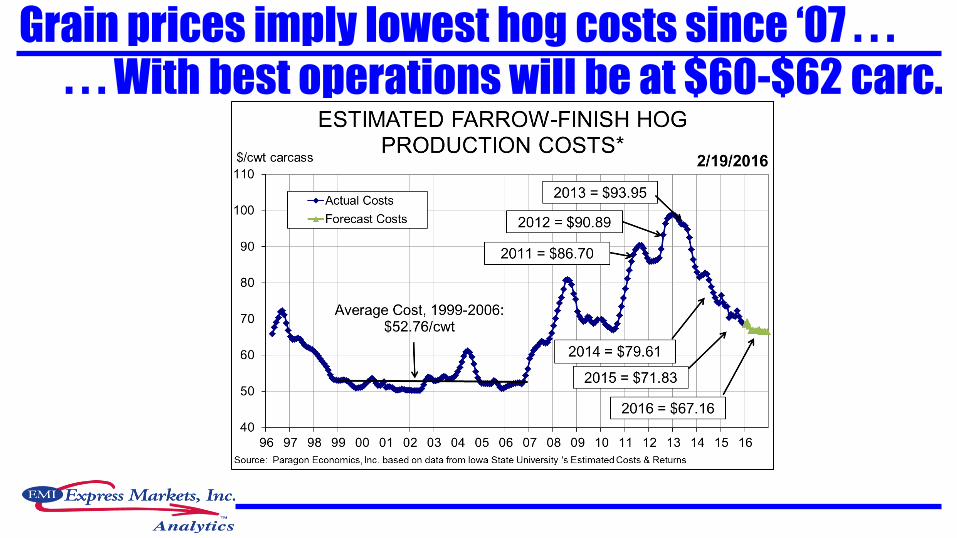
Grain prices imply lowest hog costs since ‘07 . . .
. . . With best operations will be at $60-$62 carc.

HOGS AND PORK

U.S. dollar: A new “recent” high of 100.6, early Dec.
Some softening in recent weeks
Stability is less disruptive than change period
Fed rate hikes (???) could STRENGTHEN the dollar

Pork exports suffered in late ‘14 and early ‘15. . . . . . Dec was up 9.2% yr/yr, 2015 ended UP 1.8%

Big stocks of all meats – but pork stocks are falling
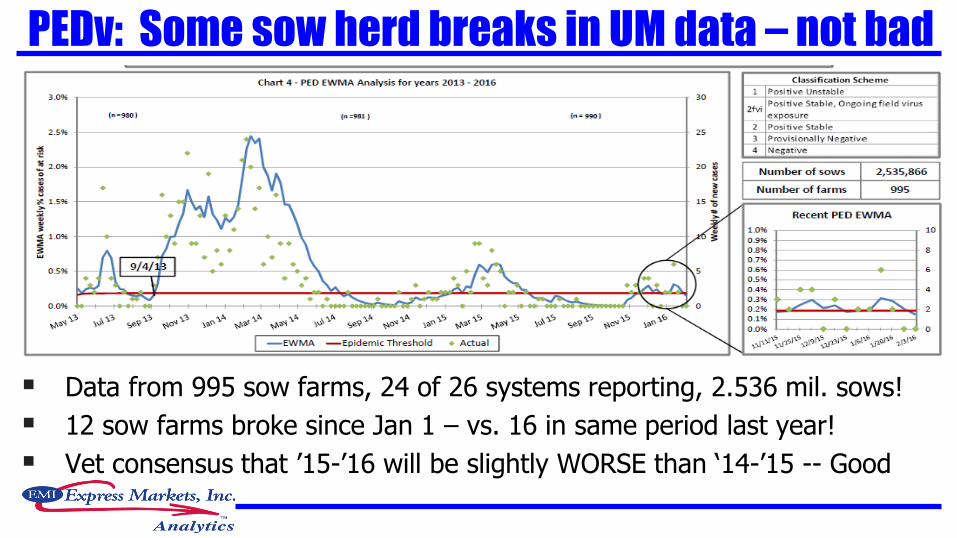
PEDv: Some sow herd breaks in UM data – not bad
Data from 995 sow farms, 24 of 26 systems reporting, 2.536 mil. sows!
12 sow farms broke since Jan 1 – vs. 16 in same period last year!
Vet consensus that ’15-’16 will be slightly WORSE than ‘14-’15 -- Good

Dec H&P report was neutral, ‘16 much like ‘15 . . .
Inventories on Dec 1
All hogs and pigs 67,776 68,299 100.8 101.4 -0.6
Kept for breeding 5,939 6,002 101.1 100.9 0.2
Kept for marketing 61,838 62,297 100.7 101.5 -0.8
Under 50 lbs. 19,801 19,508 98.5 99.6 -1.1
50-119 lbs. 17,366 17,282 99.5 100.4 -0.9
120-179 lbs. 13,000 13,210 101.6 101.4 0.2
180 lbs. and over 11,671 12,296 105.4 105.3 0.1
Farrowings
Sep-Nov sows farrowed 2,994 2,875 96.0 98.1 -2.1
Dec-Feb Intentions 2,895 2,840 98.1 99.6 -1.5
Mar-May Intentions 2,854 2,850 99.9 100.5 -0.6
Sep-Nov Pig Crop 30,633 30,271 98.8 99.7 -0.9
Sep-Nov pigs saved per litter 10.28 10.53 102.4 101.6 0.8
*Thousand head ** Thousand Litters 1Source: Urner Barry
Category 2014 2015
'15 as
Pct of
'14
Pre-
Report
Est's1
Actual
minus
Est.
USDA QUARTERLY HOGS & PIGS REPORT
December 23, 2005
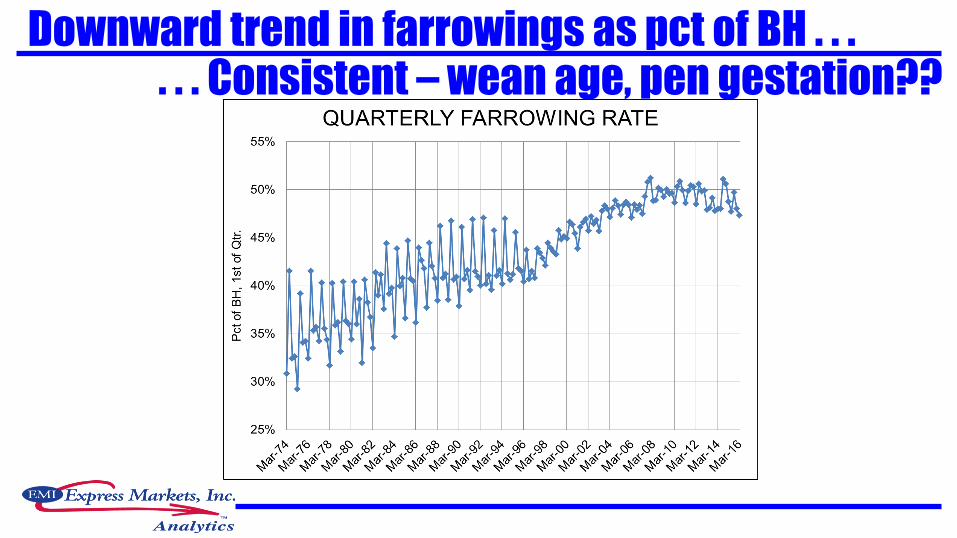
Downward trend in farrowings as pct of BH . . . . . . Consistent – wean age, pen gestation??

Litter size – 3 straight records with more to come

Since Dec 1, actual is close (-0.3%) to forecast . . .. . . Note similarity through Q3 – growth in Q4

Weights: will remain lower through Q1 . . .
Net impact of weights in ’16 will be zero
But the one positive quarter will be a problem –weight will add to Q4 supply
. . . Unchanged Q2 and Q3, +1% in Q4

No flood of hogs from Canada but MORE . . .

Slaughter forecasts from Dec H&P adjusted for . . . . . . higher imports – +230k FP/WP, +40k MHs
Mil. Hd % Chnge Mil. Hd % Chnge Mil. Hd % Chnge Mil. Hd % Chnge
2013 Year 112.124 -1.0%
2014 Q1 27.131 -2.6%
Q2 25.575 -4.5%
Q3 25.558 -7.6%
Q4 28.612 -4.0%
Year 106.876 -4.7%
2015 Q1 27.650 1.9% 27.398 1.0% 27.405 1.0% 28.723 5.9%
Q2 27.186 6.3% 27.358 7.0% 27.237 6.5% 27.848 8.9%
Q3 27.839 8.9% 27.779 8.7% 28.446 11.3% 28.474 11.4%
Q4 30.500 6.6% 30.400 6.2% 30.098 5.2% 30.369 6.7%
Year 113.176 5.9% 112.935 5.7% 113.186 5.9% 115.414 8.0%
2016 Q1 29.240 1.8% 29.597 3.0% 29.221 1.7%
Q2 28.126 1.0% 27.852 0.0% 27.613 -0.8%
Q3 28.830 1.3% 28.555 0.3% 28.698 0.8%
Q4 30.834 1.5% 30.515 0.5% 31.220 2.8%
Year* 117.030 1.5% 116.519 1.0% 116.752 1.2%
Red figures are analysts' last FORECAST for the given quarter (Q1 done in Dec, Q2 done in Mar, etc.) 2/4/15
Blue figures are estimated using USDA data*Annual total uses actuals to-date plus forecasts for the rest of the year.
Green figures are revisions since latest Hogs and Pigs report
ISU LMIC EMI ACTUAL
December 2015 Hogs & Pigs -- Commercial Slaughter Forecasts

Price Forecasts – December H & P
ISU LMIC EMI CME
Ia-Mn
Producer-Sold
Neg'd Base
National Wtd
Avg. Base Price
National Net
Neg'd Price,
Wtd. Avg.
CME Lean Hog
Futures/Index
2014 Year 102.50 100.31 102.95 104.99
2015 Q1 64.35 68.67 66.03 68.59
Q2 71.59 73.56 73.22 74.36
Q3 73.43 74.60 74.92 74.64
Q4 58.95 61.91 59.80 62.77
Year 67.08 69.69 68.49 70.09
2016 Q1 58 - 63 62 - 64 61 - 65 64.33
Q2 71 - 76 73 - 77 72 - 76 74.62
Q3 69 - 74 74 - 79 74 - 78 76.90
Q4 58 - 63 62 - 68 57 - 60 65.75
Year 64 - 69 68 - 71 66 - 70 70.40
Blue figures are estimated using USDA data 2/19/16
Green figures are revisions since the latest USDA Hogs and Pigs report.
December 2015 Hogs & Pigs -- Price Forecasts

Packers have had to make their money on meat! . . Cutout-hog spread will remain very wide!

Strong LH futures, low costs 2016 profits!. . .

Pork product outlook . . .
Cutout
- Much higher, yr/yr, in Q1 due to last year’s port fiasco
- Summer highs near $90, Q4 lows below $70
Loins, ¼” Trim
- Near $100 through early summer
- Summer highs at $115 to $120
- Boneless, strap-on -- $140 thru Q1, $150-$155 summer
Butts – Much like ’15 pending pulled pork features

Pork product outlook . . .
Hams
- Less volatility than ’15 is almost a sure bet!
- 23-27 hams $60-$65 through summer, $70-$75 seasonal high
Bellies
- MUCH stronger H1 vs. last year’s export-driven debacle
- EXPECT (!) near average prices with 14-16s peaking at $160 or so in August
Trim – 42s pressured by 50 beef, 72s peak near $80

Risks Major export disruption – small prob, HUGE impact PEDv impact: We still aren’t in the clear HPAI – same thing here Slower demand growth
- Domestic: Will positive preferences continue? Will wages/earnings grow?
- Exports: World economy, strong $U.S.
Surge of Canadian hogs due to US$, end of MCOOL Packing capacity crunch in Q4

Steve R. Meyer, Ph.D.Vice-President, Pork AnalysisEMI Analytics
QUESTIONS AND DISCUSSION


![Pandering and pork-barrel politics · pork / =∗ >/ (∗)+ >(=∗ ∗= =, ()= < ≥ ()+≥(. / /. / ∗ ∗ ()= ⎧ ⎪⎨ ⎪⎩ ()>) ()∈ ) (∗,)> . ≡ /)]](https://static.fdocuments.in/doc/165x107/5f953f35c33d70257c62d34e/pandering-and-pork-barrel-politics-pork-a-a-a-a-.jpg)